Article

There Is No Place like Home! How Willing Are Young Adults to Move to Find a Job?

1
Institute of Political Science, University of Heidelberg, 69115 Heidelberg, Germany
2
Department of Economics and Business, University of Catania, 95129 Catania, Italy
3
Department of Accounting and Management, University of Málaga, 29016 Málaga, Spain
*
Author to whom correspondence should be addressed.
Sustainability 2021, 13(13), 7494; https://doi.org/10.3390/su13137494
Submission received: 2 June 2021 / Revised: 1 July 2021 / Accepted: 2 July 2021 / Published: 5 July 2021

Abstract

:
The European Union (EU) has undergone significant economic crises in recent years. Therein, young people were amongst the hardest hit groups, with youth unemployment rising as high as 50% in some member states. Particularly high rates of youth unemployment were often observed in rural areas, where labour market supply in relation to demand were notably divergent. One of the core pillars of the EU’s agenda is to tackle the persistent problem of youth unemployment. Since the recent crisis, this has been via the “Youth on the Move” initiative, which involves the promotion of intra- and international mobility of young adults in order to gain access to job opportunities. However, what has received little attention so far is the question of what the general willingness of young adults to move is like, and to what extent this varies, for example, depending upon the area they live in. This paper therefore asks if rural youth differ from youth in urban areas in relation to their willingness to move for a job within their country or to another country. Moreover, what influences the general willingness to be mobile? Based on the Cultural Pathways to Economic Self-Sufficiency and Entrepreneurship (CUPESSE) Survey, which includes data on 18–35-year-olds in a sample of 11 European countries, it is shown that living in a rural area is strongly associated with the willingness to move. Furthermore, it shows that rural youth are more willing to move within the country but less willing to move to another country. Based on the presentation of the various factors, which promote or curb mobility readiness, the results make it clear that the success of EU initiatives depends on the preferences and willingness of the target group in question.

1. Introduction

In recent years, youth unemployment, particularly in Europe, has received considerable attention both in European Union (EU) policymaking and in academic debates. The sharp increase in youth unemployment rates in the wake of the 2008 economic crisis led the EU to deviate from its previous policy of simply making recommendations to extensive, concrete, and financially supported policies in order to combat youth unemployment head on. Conterminously, free movement is a core pillar of the EU: It is intended to create a single European labour market and increase its flexibility and efficiency. Moreover, increased mobility is expected to help match labour supply and demand, thus leading to a better utilisation of human capital and thereby increasing economic productivity in line with the Lisbon agenda [1]. Hence, the promotion of mobility has also become a core element of European policy designed to combat youth unemployment.
Besides the fact that existing research on youth mobility critically addresses European transformations and their inequality-related effects on youth and youth transitions [2], European policy makers simply assume that young adults are willing to move internationally in order to escape unemployment. However, this ignores the reality that job mobility is not feasible for everyone and presents different people with different challenges. In order to gain a better understanding of the basic willingness of young Europeans to be mobile and the different factors that promote or hinder this willingness, this paper pursues two research questions. Firstly, what influences the general willingness of European youth to be mobile? Secondly, to what extent do young adults from areas with different levels of urbanisation differ in their willingness to move for a new job?
At the same time, migratory movement implies a transformation process for the regions that are left, which potentially results in economic, social, and demographic impacts on regions’ sustainability. This is due to the fact that mobility intentions and decisions do not operate evenly across territories and social groups. Migration of those with stronger social and cultural capital has an impact on the region they are leaving. Decreasing numbers of inhabitants often lowers the local demand for services, resulting in fewer employment opportunities and unmet needs [3]. These risks are often accompanied by a decline in productive activity in the primary sector and the rise of a consumption mode, resulting in a greater predominance of the tertiary sector [4]. The challenges of mobility are particularly great for rural areas. A well-known phenomenon is the brain drain, which describes highly qualified people often leaving rural areas because they cannot find a suitable job there. This reduction in population also has other social consequences, such as the loss of volunteers who would otherwise have contributed to strengthening the community and parents of future generations [5]. From a demographic perspective, young people are needed in rural areas to enable generational renewal and thus prevent the aging of the population structure [6]. Considering that in 2015 75% of the EU territory consisted of rural areas [7], it becomes clear that the EU’s promotion of young adult mobility should not be thought of without the context of spatial distribution. Thus, consideration of mobility intentions therefore represents a central element in the context of both combating youth unemployment and increasing regions’ sustainable development.
Drawing on data from the Cultural Pathways to Economic Self-Sufficiency and Entrepreneurship (CUPESSE) survey [8], which includes a representative sample of 18–35-year-olds from 11 European countries, the various aspects influencing young adults’ willingness to move within their own country or to another country to find a new job are examined. In doing so, it is shown that young adults are more willing to move within their own country than to another country for a new job. Furthermore, personal economic hardship and higher levels of education increase willingness, whereas being married and living in rural areas decrease the willingness of European youth to move internationally for a new job.
It is precisely this reluctance of young adults to move to another country in order to find a new job that contrasts with the EU’s approach to promoting mobility. Therefore, it is argued that the EU needs to pay attention to young adults’ motives, which foster or hinder their willingness to move for a new job, in order to create successful policies. The goal of reducing youth unemployment can only be achieved if more attention is directly paid to the nature of the target group.
By addressing the perspective of young adults and their willingness to be mobile, this paper represents a consistent continuation of the ongoing discussion on youth mobility in Europe [1,2,9,10]. Understanding these dynamics is highly pertinent since youth mobility not only represents one of the central pillars of the EU’s youth unemployment policy to date, but will also be an important theme for this ongoing issue. At the latest juncture, given the COVID-19 pandemic and its many economic consequences, it has once again become clear that youth unemployment and successful ways to combat it will continue to be a central issue of European policymaking in the future.
The paper is structured as follows. The first section gives an overview of the development of youth unemployment in Europe in the context of the economic crisis of 2008, as well as the different policies of the EU designed to fight youth unemployment. This is followed by a theoretical overview of youth mobility, from which several hypotheses on the nature of young adults’ willingness to move for a new job are derived. Subsequently, an analysis of the data and method used, as well as the empirical results, are presented. The paper closes with a discussion of the key findings and a concluding section.

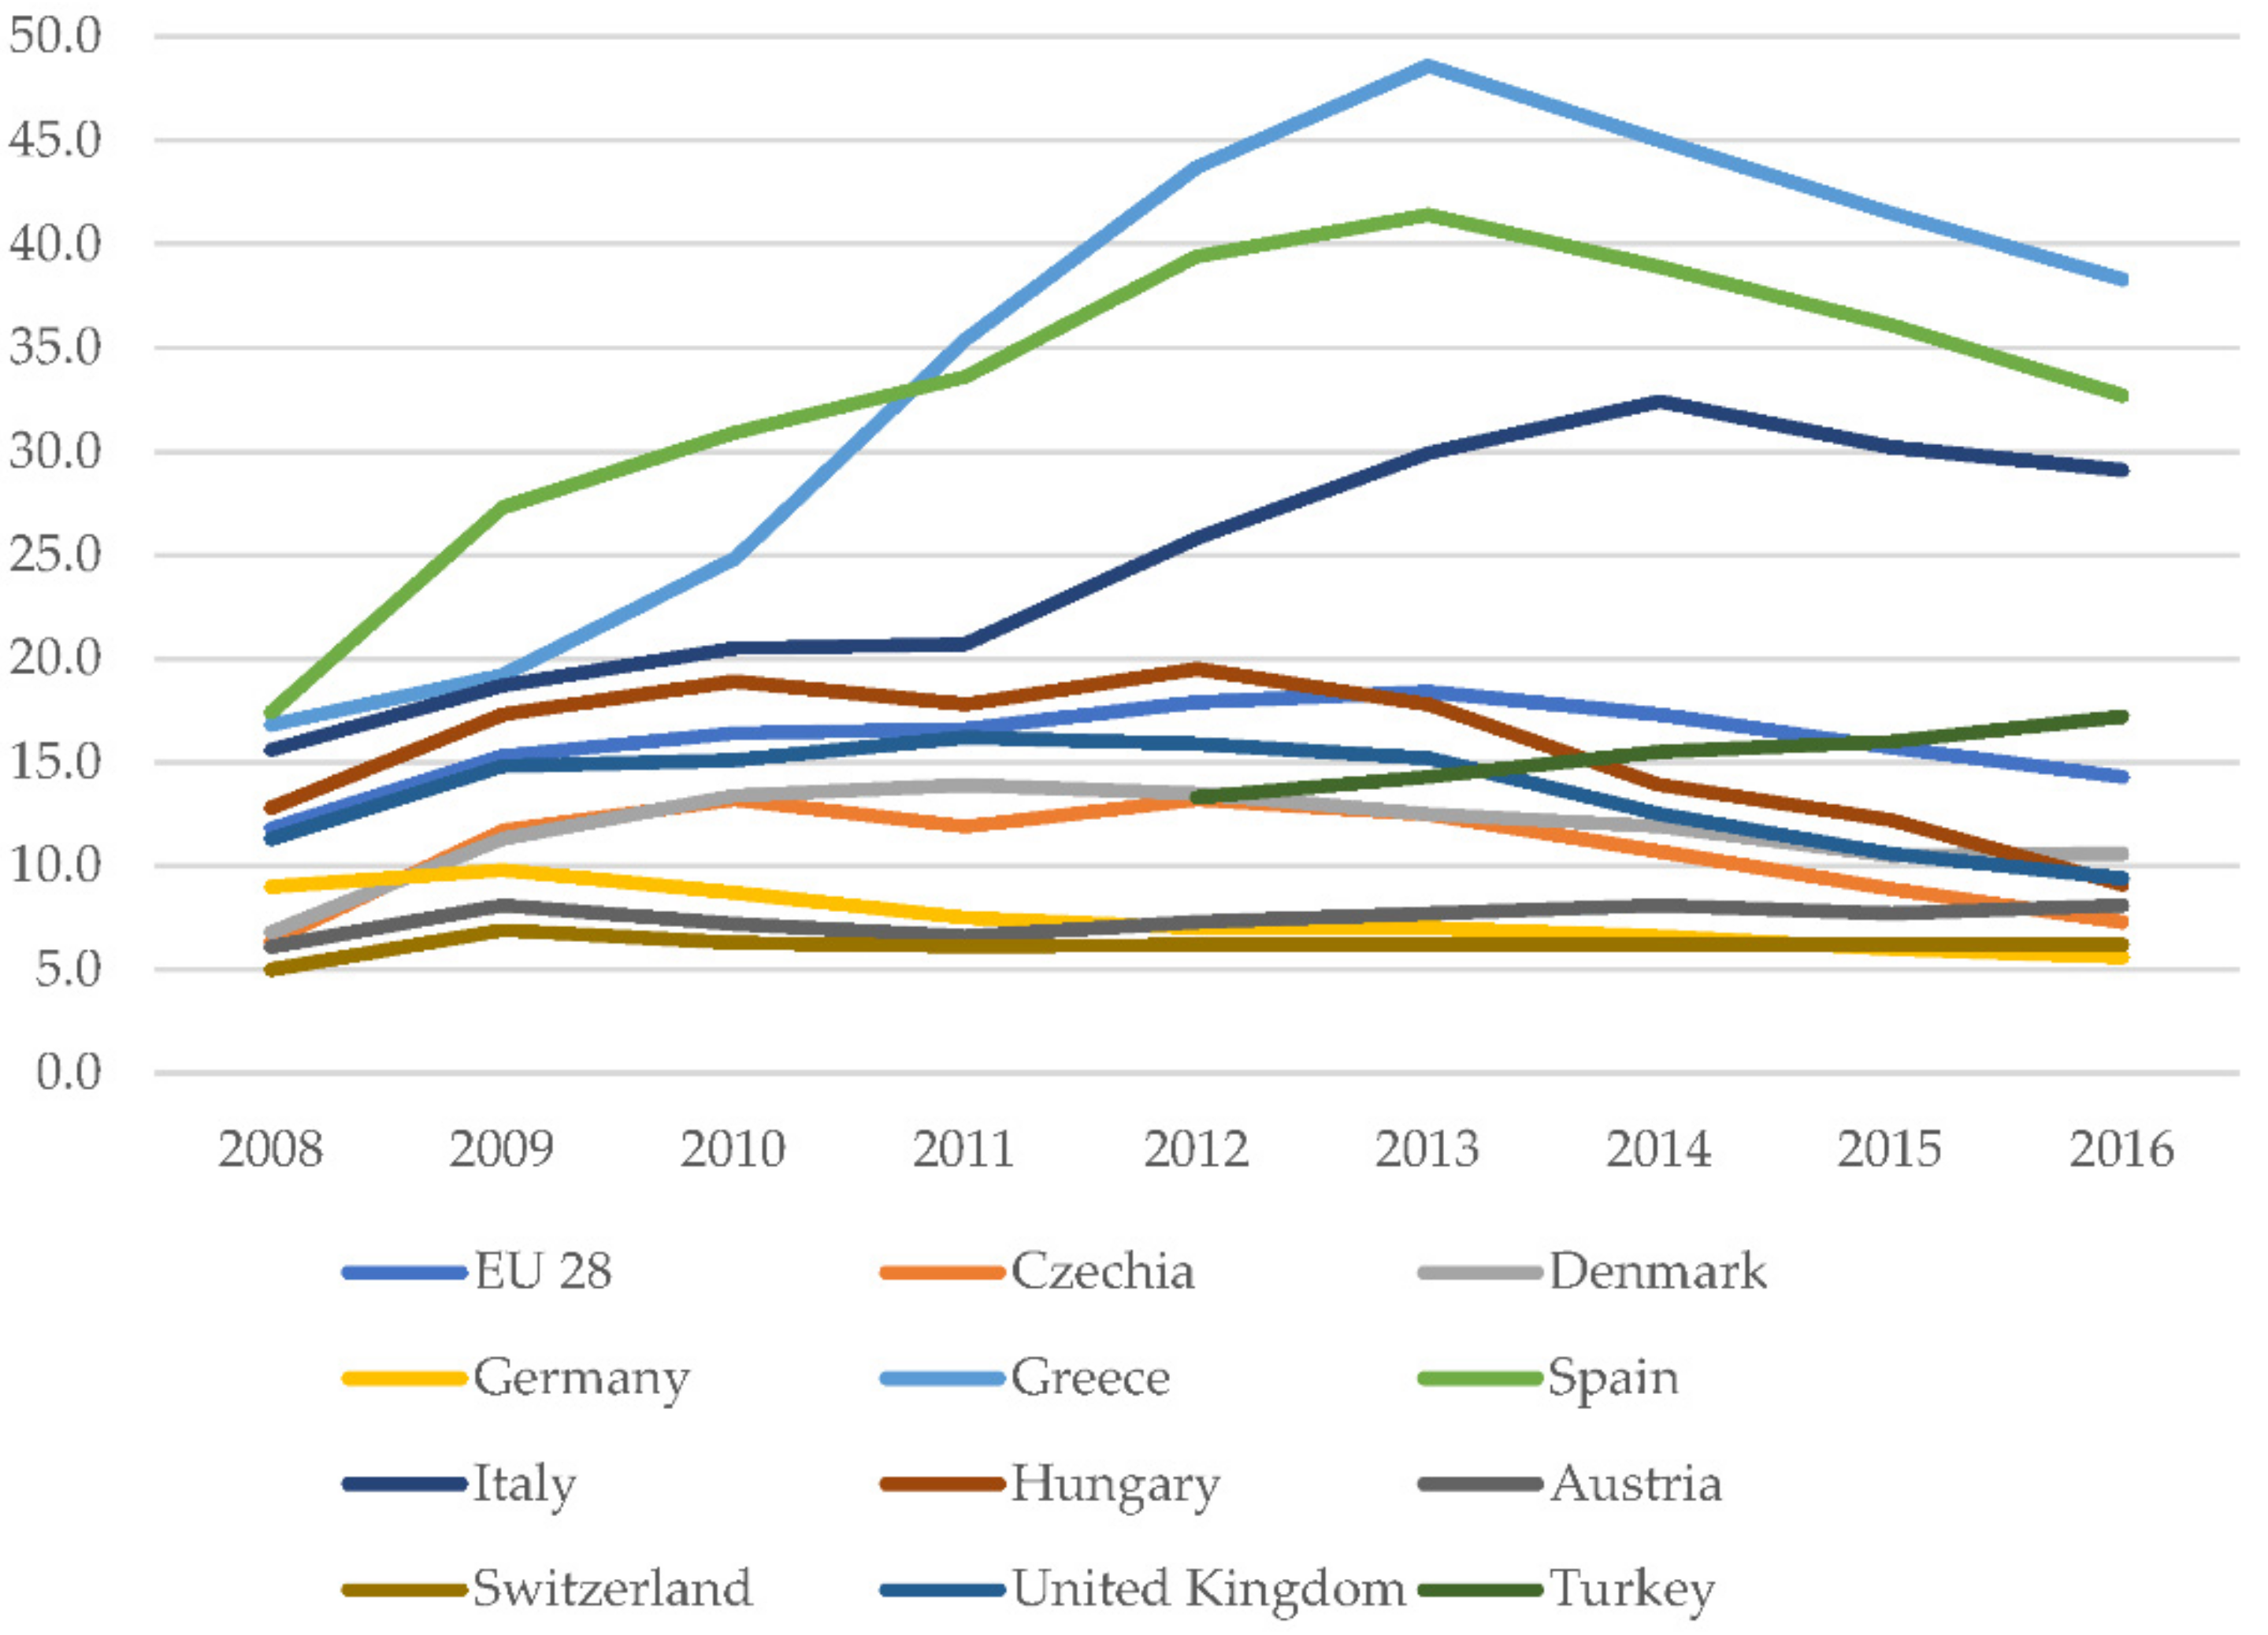
2. Youth Unemployment and the European Agenda to Combat It

Subsequent to the onset of the global economic crisis in 2008, the youth unemployment rate rose rapidly in a number of European countries. Although the impact of this crisis varied enormously across Europe, as can be seen from Figure 1, southern European countries were hardest hit, with the youth unemployment rate (i.e., amongst 15–29-year-olds) in Greece, for example, rising from 16.8% in 2008 to 48.6% in 2013 [11]. In other countries, however, such as Austria, there was only a slight increase (6.1% to 7.7%) during this period, and there was even a decrease (9.0% to 7.0%) in Germany.
Previous research has shown youth unemployment was already a problem in many countries before the crisis [12] and described various causes and aggravating factors thereof. Existing studies argue that the period of youth unemployment considered here is unique due to several aspects [10]. One such aspect is that labour market flexibility makes it particularly difficult for young people to find permanent employment. Moreover, young adults are often amongst the first to be affected by downsizing and restructuring measures. Furthermore, the problem of overqualification and skills mismatch continued to grow. At the individual level, studies have also shown that long-term exposure to unemployment is part of a generational legacy [13]. This means that parents shape their children’s opportunities through the transmission of resources and values.
The economic crisis and its impact on youth unemployment rates resulted in an extension of EU-level efforts to promote youth employment [12] and caused the EU to deviate from its usual path of common policies. As described by Tosun and Hörisch [14], the fundamental orientation of the EU in this policy area began in 1997 with the Luxembourg Job Summit, which was the starting point of the EU employment policy framework. Here, both the European Employment Strategy and the Open Method of Coordination (OMC) were adopted. This initiated the so-called Luxembourg process, in which member states, based on a common set of objectives and goals, became part of an annual monitoring cycle for national labour market policies.
At the same time, the Lisbon Strategy took place from 2000 to 2010, within which the European Employment Strategy was renewed twice according to the proven system. Part of this renewal was that young adults were explicitly included as a target group for the first time. This further resulted in a series of political measures to promote youth employment (see Table 1 for an overview).
Although for many years EU labour market policy was characterised by general policy recommendations based on the OMC, measures to combat youth unemployment have differed significantly. These measures became concrete and financially supported by EU funds. Thus, the EU developed a set of policies to tackle youth unemployment underpinned by the concept of social investment [15].
Elaborated before the outbreak of the crisis, Youth in Action provided the legal framework for promoting non-formal learning amongst young adults. Specifically, it included funding for projects in five areas: “youth for Europe” (including youth exchanges, initiatives, and democracy projects), the European voluntary service “youth in the world” (covering projects where European youth cooperate with youth from different countries of the world), youth support systems, and general support for European cooperation in the youth field [16]. The main targets of this action were youth themselves and youth workers.
Increasing young people’s mobility lies at the heart of the Youth on the Move programme. Beyond promoting lifelong learning and higher education, its goal is to help young adults find a job. The programme includes both assisting countries to remove obstacles to mobility, and encouraging employers to create job openings for young mobile workers. At the same time, it directly helps young people to find a job in another country. For this purpose, the project “Your first EURES Job” was launched. This is supported by the European job mobility portal (EURES), which provides information, advice, and recruitment services to facilitate free movement of workers within the European Union.
Initiated by the European Parliament in 2010 and endorsed by the Council of the EU in 2013, the Youth Guarantee makes the member states responsible for providing young people with a good-quality job offer within four months after graduating or becoming unemployed. This offer can be a job, an apprenticeship, a traineeship, or continued education. Existing studies show that EU member states implement this in very different ways [12,17]. Furthermore, the EU directly addressed young adults that are not in employment, education, or training (NEETs) with the Youth Employment Initiative in 2013. For this purpose, EUR 6.4 billion were made available for regions with youth unemployment rates exceeding 25% [18]. Finally, and in response to frequent criticism that precarious situations are being created for young people in traineeships under the Youth Guarantee, the Quality Framework for Traineeship was created [19]. Additionally, and with the aim of improving the quality and supply of apprenticeships as well as spreading successful concepts across the EU, the European Alliance for Apprenticeships was announced.
Overall, youth unemployment became a central issue in most European countries in the aftermath of the 2008 crisis. The extent to which young people were affected varied greatly both between countries and within countries, depending on the degree of urbanisation of the region in question. The EU took this as an opportunity to deviate from the usual approach of recommendations and to take concrete, often financially supported, measures with the aim of reducing youth unemployment. This new approach also demanded flexibility from young adults in order to obtain education, training, or a job. The extent to which this flexibility exists on the side of young adults is examined in the following sections.

3. Young Adults’ Willingness for Job Mobility

In the course of EU enlargement between 2004 and 2007, an unexpected level of intra-European migration of young adults in search of a job took place for the first time. This migration movement varied between countries, but was generally characterised by a movement of a high proportion of young adults with tertiary education from East to West [20]. Since the economic crisis of 2008, the direction of most of the migration of young adults in the EU has changed. South–North migration emerged, in which mainly young adults from Spain, Greece, Italy, and Portugal moved to the more northern European countries in search of a job [10].
The EU promotes labour mobility as an adjustment mechanism to ensure more efficient labour allocation across the EU [21]. Thus, intra-EU mobility can lower unemployment rates across the EU. However, this mobility might come at the cost of young migrants. Mobility can be an advantage for future jobs, for example from the employer’s perspective through additional language skills or increased social capital, but mobility itself is no guarantee of finding a job in the future [22]. Instead, for young adults, mobility can result in very short-term flexible contracts and force them to accept jobs for which they are overqualified [23]. Furthermore, it must also be acknowledged that moving within (or even to another) country to get a job is simply not feasible for everyone. Individuals differ, for example, in terms of their personalities and socio-economic backgrounds, and previous research indicates that individual perceptions and decisions with regards to employment are context-dependent [24]. It follows that the factors influencing the willingness to move for a new job can be contextual as well as personal.
A central contextual factor here is the structure and amenities of the region in which one lives. Here, the increasing importance of (large) cities poses a number of challenges to the rural regions surrounding them [25]. Exemplary of these challenges is the pressure on family-run farms. An increasing proportion of individuals work outside of agriculture, although it is still the central economic sector in rural regions. This development of employment out of agriculture can be an obstacle to successful succession on family farms. Especially with a view to maintaining food security and food sovereignty, it is of central importance to preserve small-scale food production [26,27]. This is prompting countries to adopt various strategies to mitigate this problem, such as targeted support for the non-family transmission of farms [26] or financial support programs to address the so-called “young farmers problem” [28]. This development to work outside of agriculture and thus potentially also outside of rural areas is conditioned by the local structural conditions. For young adults in rural areas, it is often the case that the opportunities to develop their future lie in other regions, thus forcing them to migrate [29]. This applies both to the educational path and to the path to employment. Secondary schools are only available in the next larger town or that it is often necessary to move to cities with universities for a tertiary education. Subsequently, the suitable jobs for the achieved education are then also found outside of rural regions. In line with this, Bjarnason and Thorlindsson [30] were able to demonstrate that for the case of Iceland, the perception of job opportunities is the strongest predictor for rural youth being willing to migrate. Accordingly, a potential influence of the urbanisation level of the locality where an individual lives on the willingness to move for a job can be expected within the first hypothesis:
Hypothesis 1 (H1).
The more rural the place one lives, the higher the willingness to migrate for a job.
A look at the personal influencing factors then shows exiting native labour markets due to the experience of difficult economic conditions, constituting the main reason to migrate within international migration literature. In such circumstances, individuals want to move from a place with low employment opportunities and wages to places where more jobs and higher wages are available [31]. Existing studies on youth provide evidence for such dynamics. Cairns et al., for instance, showed that Portuguese young adults consider international mobility a possible option when domestic labour market prospects are limited [32]. Similarly, a study by Van Mol [33] showed that Italian youth often move to another country due to economic circumstances, and in order to improve the chances of securing employment in the domestic labour market upon their return. These findings form the basis for the second hypothesis:
Hypothesis 2 (H2).
The worse the individual economic situation, the greater the willingness to move in order to find a job.
Finally, there is another personal influencing factor, which, however, is expected to tend to reduce the willingness to be mobile. This is mainly about being attached to the place one lives in through close family relations. The general idea here is that people value living closely to family, and take this into account when deciding about migrating or staying. On the one hand, young adults who receive greater help from their families show that they are less willing to migrate [30]. It is not only about families that share a household, but is expected to also apply to the context of non-resident family ties [34,35]. On the other hand, it can also be assumed that a stronger sense of obligation to the family is also associated with a lower willingness to migrate. Following this, the final hypothesis is formulated:
Hypothesis 3 (H3).
The closer the family ties, the less willing young people are to migrate for a job.
Overall, various aspects promote or hinder young adults’ willingness to migrate for a job. How these are operationalised within the study, as well as which effects can be reported in this respect, is described in the following sections.

4. Data and Method

This study is based on the CUPESSE dataset from 2016 [8]. This dataset is the result of a survey amongst youth (aged 18 to 35) in 11 European countries, namely, Austria, the Czech Republic, Denmark, Germany, Greece, Hungary, Italy, Spain, Switzerland, Turkey, and the United Kingdom. The sampling frame was consistent across the countries, resulting in probability samples of individuals aged 18 to 35 representative of employment status, NUTS-2 region, age group, education, and migration background for each country [8]. Interviews took place online in nine of the 11 countries. Due to low internet coverage, the survey could not be conducted online in Hungary or Turkey. Instead, the Hungarian team used computer-assisted personal interviewing and in Turkey interviews were conducted face-to-face using paper and pencil [8]. The surveys were conducted by professional polling firms such as Gallup, YouGov, and others [8]. For a more detailed account of the dataset and information on the survey methodology, see Tosun et al. [8].
The age range surveyed reflects the current state of research on the transition from school to work. In contrast to official statistics (which often use age 25 as the end of youth), the survey includes up to 35-year-olds and thus takes into account the empirical evidence that current generations take significantly longer than previous generations to make the transition from school to work [36]. Furthermore, the countries in the sample reflect both important dimensions of economic variations within Europe [37] and variation with regards to political and welfare state systems [38]. Overall, the survey includes questions about attitudes towards work, education, and the economic situation of young adults. Table 2 provides an overview of all variables used for this study as well as their statistical description. Appendix A also contains the correlation matrix of the variables used. Appendix B also provides an overview of questions and coding for the variables used from the CUPESSE Survey.

4.1. Dependent Variables

The central research topic of the present study is the willingness of young adults to move for a job. Respondents to the survey were asked, “What changes would you be willing to make to get a new job?” and had to indicate their answer (no/maybe/yes) to the following statements: “I would be willing to move within country [the respective survey country was inserted here],” and “I would be willing to move to a different country.” This makes it possible to examine in more detail the willingness to engage in both intra- and international mobility. Furthermore, these items are particularly suitable, since “behavioural intentions account for an appreciable proportion of variance in actual behaviour” [39]. Additionally, migration intentions have been proven to be a good predictor of migration behaviour [40]. Finally, a study by Van Dalen and Henkens [41] showed that for the Dutch context, forces triggering migration intentions are the same triggering actual migratory behaviour. The answers were coded binary given answers with those who were willing (=1) and those who were not or maybe willing (=0).
In order to test the hypotheses, a logit regression analysis separated for the two forms of willingness to move for a job was applied. The estimation was based on the following regression:
Y i c = α c + β X i c + δ Z i c + ε i c   ,
where Y i c represents either the willingness of an individual i to move within or to a different country c . The coefficients α c allow country-fixed effects to be considered to control for country-specific factors that may influence our dependent variables, and X and Z are, respectively, sets of control and interest variables. Furthermore, country and post-stratification weights (based on gender, age, education, and NUTS-2 region) according to the CUPESSE data were implemented. Standard errors are robust to heteroscedasticity in all analyses.
For a more in-depth descriptive look at the data, Table 3 shows the distribution of the answers, including the statistical significance of the t-tests in the differences among means separated for both dependent variables. This involves only those independent variables that were used to investigate the previously mentioned hypotheses. This shows a significant difference between the Yes and No responses to willingness to move for the economic situation variables. If one compares rural and non-rural young people here, one can see a significantly stronger refusal to move to another country amongst young people from rural areas. Finally, there was no significant difference for the variable on familialism.

4.2. Independent Variables

The influence of the environment in which one lives was considered in the first hypothesis. The data in the CUPESSE dataset were collected at the NUTS-2 region level. Since information on the degree of urbanisation is only available at the NUTS-3 level, it had to be calculated accordingly. The European Union provides information on the degree of urbanisation of all NUTS-3 regions. For this classification, they proceed in the following manner. Firstly, the population pattern in rural areas is determined based on two types of territorial units: “rural areas,” i.e., areas located outside urban clusters, and “urban clusters,” i.e., clusters of adjacent grid cells of 1 km2 with a density of at least 300 inhabitants per km2 and at least 5000 inhabitants. As a second step, NUTS-3 regions are classified based on the proportion of population living in rural areas as follows: “predominantly rural,” if the population share in rural areas is more than 50%; “intermediate,” if the population share in rural areas is between 20% and 50%; and “predominantly urban,” if the population share in rural areas is less than 20%. In order to avoid distortions caused by extremely small NUTS-3 regions, regions smaller than 500 km2 are grouped with one or more neighbouring regions for the purpose of classification. In the third step, the size of urban centres in a region is used as another classification criterion. A predominantly rural region containing an urban centre with more than 200,000 inhabitants, whose share is at least 25% of the regional population, is classified as intermediate. An intermediate region containing an urban centre with more than 500,000 inhabitants, whose share is at least 25% of the regional population, is classified as predominantly urban [42]. For the aim of this study and to use these data, the NUTS-3 regions were weighted by their population size and the NUTS-2 index was formed as the average of their NUTS-3 indices. This resulted in the rural index, which takes values between one and three, and the higher the value, the more rural the region in which the respondent lives.
In the course of the second hypothesis, the aim was to investigate how personal economic situation affects willingness to move. This was operationalised via three concepts. The first look was taken at employment status. To do this, respondents were asked what they had mainly done in recent months. We used their answers in binary form, distinguishing between those in paid work or self-employment (=1), and those who were unemployed or engaged in unpaid education, community service, or others. Secondly, an assessment of the personal economic situation was considered. To this end, the question was how satisfied respondents were with their personal financial situation. This personal assessment represents the central link between the actual economic situation and personal attitudes. Existing research has repeatedly shown that personal perceptions act as a filter between the objective economic situation and various decisions, such as voting decisions [43,44]. The inclusion of this variable thus made it possible to look at underlying personal attitudes, which are often not measured by objective indicators [8]. Thirdly, the social environment of the responders was considered. For example, in the wake of the economic crisis, it became apparent that youth unemployment varied greatly both across countries and within countries across regions. Individual behaviour is particularly influenced by the extent to which people are affected by being at risk of unemployment and by the extent to which their social environment is affected. Therefore, finally, the question of how many of one’s friends were unemployed was included in the analysis to operationalise the economic situation.
In the third and last hypothesis, the strength of family relationships was considered. This was operationalised with two different concepts. Firstly was one’s marital status. This binary variable indicated whether someone was married or not. Secondly, general attitudes towards family were considered. For this purpose, collective orientations were taken [45] and formed into an index that took the average of the answers (strongly agree to strongly disagree) to the following three statements: “It is the duty of family members to take care of each other, even if they have to give up something they want themselves,” “Family members should stick together, no matter what sacrifices are required,” and, “It is important that children respect the decisions made by their parents, even if they disagree with these decisions.”

4.3. Control Variables

Personal characteristics also play a role in individual willingness to move. Thus, the analysis included a set of control variables. Previous studies show that men are more likely to have high migration aspirations for work than women [46]. Accordingly, the same effect was expected for this study. In addition, others have shown that older people are less willing to migrate than younger people are, which was also expected for this study.
Another reason that promotes the migration of young people is the level of education. The so-called “brain overflow” occurs when many young adults graduate from tertiary education, but their qualifications do not fit with the labour demand in their home country. The often resulting “brain drain” phenomenon, meaning the labour migration of highly skilled individuals, was already well known before the economic crisis of 2008, with scholarship on this topic dating back to the 1960s [3,47]. In the course of the economic crisis of 2008, a high number of highly educated young adults migrated from Southern European countries to Central and Northern European countries. This represented a phenomenon that was fostered by the crisis and, indeed, has continued since then [48]. Many studies show that migrants are positively selected in terms of education [49] and that this applies particularly to young migrants [50]. To control for the level of education, a dummy variable for “medium education” was coded, indicating whether the highest level of education achieved by youths was equal to the Level 4 of the International Standard Classification of Education (ISCED), whereas the dummy variable “high education” identified higher levels of education (which require achieving at least a tertiary education level). Accordingly, the reference group was represented by youths with low educational levels (ISCED level less than 4).
Furthermore, the willingness to migrate is also influenced by personality structure. Studies have shown that a general willingness to take risks also has a positive effect on the willingness to migrate [31]. Accordingly, the item “On a scale from 0 to 10 would you say that in general you are a person who tends to avoid taking risks or are you fully prepared to take risks?” was used. To that end, an increasing willingness to migrate being accompanied by an increasing willingness to take risks was expected for this study. Finally, this study was controlled for individual attitudes towards work. Existing research has demonstrated that work values predict various work-related decisions, such as career choices or job selection [51]. Thus, an index that took the average of the answers (strongly agree to strongly disagree) to the following statements was created: “To fully develop your talents you need to have a job,” “It’s humiliating to receive money without having to work,” “Work is a duty towards society,” and “Work should always come first even if it means less spare time.”.

5. Empirical Results

The results of the analyses are presented in Table 4 with reference to willingness to move within one’s own country and in Table 5 with reference to willingness to move to another country to find a job. The models presented are structured in the same way for both tables and are based on the hypotheses. The basic model (M0) contains only the previously named control variables. M1 to M3 contain the relevant independent variables for the corresponding hypotheses (H1 to H3).
Firstly, the aim was to investigate to what extent the degree of urbanisation of the area in which one lives has an influence on the willingness to move for a job. Due to the often poorer relationship between supply and demand on the labour market in rural regions, it was expected that the more rural the environment, the greater the willingness to move. The results show differences depending on the form of moving. The more rural the environment, the more willing young adults were to move within their own country. The opposite picture emerged, however, with regards to the willingness to move to another country. Here, the willingness to move decreased the more rural the area in which one lived. Table 6 and Table 7 report the changes in probability of moving within and to another country, respectively, when the independent variables increased by one unit given that all predictors were set to their mean values. The marginal effect of one additional point in the rural index increased the likelihood of moving within the country by more than 4%, whereas it decreased the willingness to move abroad by around 2.3%. This resulted in the picture that rural young people in particular are willing to move within their own country in order to find a new job. The “big step” to move to another country, on the other hand, does not seem to be desired by rural youth.
Furthermore, the results show that one’s employment status had no effect on the willingness to move to a different country. Instead, when it came to moving for a job within one’s own country, one’s employment status had a negative effect. Thus, if one has a job, one is (as expected) less willing to move to find a new job. Similarly, for economic self-sufficiency, there was no significant effect on the willingness to move within one’s own country. On the other hand, if one looks at the willingness to move to another country, it can be seen that the willingness to move decreased with increasing economic self-sufficiency. This seems plausible, since with decreasing economic pressure there is less incentive to take the “big step” and move to another country to find a new job. Furthermore, it can be seen that for both forms of moving, the willingness increased the more one’s friends were unemployed. This underlines that young adults in an environment particularly affected by youth unemployment are even more willing to do whatever it takes and would move both within their own country and to another country to find a new job. Overall, hypothesis two can be confirmed on the basis of all three indicators, namely, that the willingness to move for a new job increases with a worsening economic situation.
Within the third and final hypothesis, the focus was on family relationships. In the context of marital status, being married appeared to be associated with a lower willingness to move to another country for a new job. At the same time, being married had no significant impact on the willingness to move within one’s own country. Thus, as far as the influence of one’s own nuclear family relationship is concerned, hypothesis three can only be confirmed with regard to the willingness to move to another country. Hypothesis three, on the other hand, must be rejected when looking at the influence of collectivistic attitudes. Familialism had no significant influence on the willingness to move within or to another country for a new job.
The final look was directed at the results of the control variables. Here, all expectations were confirmed and showed significant effects for both forms of moving for a new job. It was confirmed that men were more willing than women to move for a new job. In the wake of the “brain drain” phenomenon frequently observed over the decades, as expected, as education increased, so did the willingness to move for a new job. The higher the level of education, the greater the willingness to move both within one’s own country and to another country. Furthermore, the willingness to move decreased with increasing age and it was confirmed that the more one was willing to take a risk, the greater the willingness to move for a new job. Finally, the more central work was to one’s own life, the higher the willingness to move for a new job, both within one’s own country and to another.

6. Discussion

When comparing the results with previous studies, three aspects stand out as especially worthy of discussion.
First, a particularly striking finding is that rural youth are more willing to move within their own country than to move to another country to get a job. Existing studies cannot provide an empirical justification but only a theoretical justification for this differentiation. For example, Rye [4] argued that physical distances for young people in rural areas have shortened in recent decades. It is no longer a big step for young rural adults to move into the unknown in the city, and many other young people have already done so before them. In order to receive an appropriate education, there is often no other option than to attend schools or move to universities in urban areas [52]. Moving within one’s own country has therefore become something rather commonplace for young people from rural areas. In addition, the individualization thesis states that in today’s societies individuals are breaking with traditional preconceived scripts of how to live their lives. Even though class constraints are still present in this thesis, it is concluded that everyone is increasingly required to take their destiny into their own hands [53,54]. From this analytical perspective, young people from rural areas feel freer than previous generations to shape their life path.
Second, the present study confirms the findings of previous research that the willingness to move for a job increases with a worsening personal economic situation. However, the consideration of the influence of the personal environment represents a supplement to the state of research. Previous studies on this aspect are rare and the result thus connects to the study by Salamońska and Czeranowska [55], who showed that the willingness to migrate is higher among young adults who agree with the statement that young people are marginalized in the state in which they live. The finding that the unemployment of one’s friends increases the willingness to find a new job is of particular relevance when thinking about economic crises. The recent past has impressively shown that in times of economic crisis, youth unemployment in particular often rises sharply, thus increasing the pressure on young people. It can be expected that the willingness of young people to move for a job also increases in crises such as the current COVID-19 pandemic.
Third, the findings on the role of family attachment represent a contribution to the state of research. The finding that only being married has an influence on the willingness to move to another country, whereas family ties have no influence on moving within one’s own country or to another country, provides an impetus for further in-depth studies. This depth is especially called for when comparing the result with existing studies examining similar topics. They often investigate on more abstract general feelings of belonging, thus showing that these reduced the willingness to move [56]. For instance, Theodori and Theodori [6] showed that rural youth in Texas are unwilling to move due to community attachment and a sense of place-belonging.
A look at the strengths of the study shows that comparing willingness to move within a country to willingness to move to another country is a novelty in the state of research. Previous studies focused on the willingness to move within the country between rural and urban areas. Moreover, these studies usually focused on individual countries or regions (e.g., [5,6]). With the comparative view both between the forms of willingness and with a sample consisting of 11 European countries, the results now attain broader validity. This is also important considering that the EU focuses its policymaking on mobility across national borders.
Nevertheless, some limitations of this study need to be discussed. Limitations were already present from the data situation. A dataset with more countries would be desirable in order to obtain a larger picture of the situation in more European countries. In addition, it would be desirable to collect data that are more current. It is true that no other dataset than the CUPESSE dataset used here offers the possibility to investigate the willingness of young people to move within their own country or to another country in a European context in this form. Nevertheless, it would be worthwhile to collect such data again for further research. Likewise, it is clear that no conclusions can be drawn about causalities based on cross-sectional data. Therefore, panel data would be particularly suitable for further analysis. Finally, it would be desirable to collect data at the NUTS-3 level in order to be able to examine the influence of the degree of urbanisation of the region in which one lives in more detail.
Equally, the study also provides impetus for future research. It would be particularly interesting to compare the findings of this study with the motives of young adults who have indeed moved to secure a new job. Additionally, within qualitative in-depth studies, one could explore the motives that make rural youth more willing to move within the country than moving to another country. Simões et al. [3], who showed that emotional bonds play an important role and investigated the returning intentions of youth originating from rural regions, took an important first step in this direction.

7. Conclusions

In order to achieve smart, inclusive, and sustainable growth for Europe, young people are essential. This has been emphasised by the EU Commission in the introductory words of the Youth on the Move programme [18]. Although the economic crisis of 2008 led to devastating consequences in the form of unemployment, particularly for young people, the EU regards the issue of mobility as a core pillar of the solution to the problem. Thus, young adults are expected to move across national borders to find employment. In so doing, a better distribution and coverage of supply and demand on the labour market within the EU is to be achieved.
What the EU has failed to take into account, however, is the low level of willingness to be mobile amongst young people in order to find a job. Specifically, the low willingness to move to another country contradicts the aspirations of the EU policy. Within the present study, it was shown that young adults were less willing to move to another country than to move within their own country to find a job. The willingness to move was generally influenced by various factors. For example, a worse personal economic situation led to a higher willingness to move for a new job both within and to another country. Coming from a rural area, or being married, on the other hand, reduced the willingness to move to another country. It was particularly interesting to see that the more rural the environment in which one lived, the more willing one was to move within one’s own country and the less willing one was to move to another country to find a job. Overall, the analysis clearly demonstrated that moving within one’s own country and to another country is characterised by different levels of willingness and is associated with different hurdles. Here, many young adults appear unwilling to move to another country in order to find a job.
Existing research, however, recommends prioritising the barriers that account for the most non-compliance when thinking about what keeps the target group from complying with policies [57]. As has been shown, young European adults are rather unwilling to move to another country in order to find a job. Thus, immobility can be perceived as a major barrier to labour market integration. Despite the launch of Youth on the Move, the EU has not made sufficient efforts to enhance the geographical mobility of youth [14].
The results of the study clearly point to necessary steps for successful policies in the future. Building on research from Weiss and Hörisch [58], who argued that implemented labour market policies have to match with the work values of individuals in order to be successful, the results of the present study suggest that European policies to combat youth unemployment must take into account young adults’ perspectives and, in this case, specifically address their (un)willingness to be mobile. Concurrently, it also shows that it is important for research on labour migration dynamics to consider the goals, motivations, and willingness of young adults more fully. The economic crisis of 2008 will not be the last phase of challenges for labour market policy. For example, the COVID-19 pandemic and its economic consequences mean that a new peak phase of youth unemployment already needs to be addressed. In this context, lessons should be learned from the past and policies geared towards the needs of the target group should be developed.

Author Contributions

Conceptualisation, J.W.; data analysis, L.F.; writing and editing, J.W., L.F., and M.S.-P. All authors have read and agreed to the published version of the manuscript.

Funding

This article is based upon work from COST Action CA18213 Rural NEET Youth Network, supported by COST (European Cooperation in Science and Technology); www.cost.eu.

Data Availability Statement

Data are freely available for purposes of academic research and via GESIS data archive: https://doi.org/10.4232/1.13042.

Conflicts of Interest

The authors declare no conflict of interest.

Appendix A

Table A1. Correlation Matrix.
Variables(1)(2)(3)(4)(5)(6)(7)(8)(9)(10)(11)(12)(13)(14)
(1) Move within country1.000
(2) Move to a different country0.443 *1.000
(3) Age−0.093 *−0.079 *1.000
(4) Female−0.072 *−0.059 *−0.022 *1.000
(5) Married−0.079 *−0.081 *0.354 *0.044 *1.000
(6) Medium education0.0150.019 *−0.242 *0.032 *−0.075*1.000
(7) High education0.069 *0.063 *0.225 *−0.003−0.024 *−0.485 *1.000
(8) Risk aversion0.127 *0.174 *−0.073 *−0.103 *−0.016 *0.037 *−0.0041.000
(9) Work values0.070 *0.029 *0.007−0.037 *0.112 *0.038 *−0.081 *0.082 *1.000
(10) Employment status−0.044 *−0.031 *0.305 *−0.161 *0.094 *−0.166 *0.181 *0.037 *0.085 *1.000
(11) Economic self-sufficiency−0.028 *−0.058 *−0.000−0.055 *0.071 *−0.021 *0.093 *0.0060.021 *0.244 *1.000
(12) Social ties0.082 *0.087 *−0.072 *0.040 *−0.020 *0.049 *−0.070 *0.053 *0.035 *−0.221 *−0.268 *1.000
(13) Rural index0.010−0.028 *−0.018 *0.0110.017 *−0.083 *−0.051 *−0.039 *−0.015 *−0.062 *−0.005−0.027 *1.000
(14) Familialism0.009−0.0060.029 *−0.042 *0.155 *0.016 *−0.102 *0.059 *0.353 *0.033 *−0.030 *0.067 *−0.0031.000
Note: The table contains the Pearson correlation and * denotes statistical significance at the 0.05 level.

Appendix B

Table A2. Overview of the Variables Used from the CUPESSE Dataset.
VariableQuestionRangeMean (Std. Dev.)
Move within country“What changes would you be willing to make to get a new job?” “I would be willing to move to within country”
   (1)
No
   (2)
Maybe
   (3)
Yes
Recoded towards:
   (0)
No/Maybe
   (1)
Yes
0–10.41 (0.49)
Move to a different country“What changes would you be willing to make to get a new job?” “I would be willing to move to another country”
   (1)
No
   (2)
Maybe
   (3)
Yes
Recoded towards:
   (0)
No/Maybe
   (1)
Yes
0–10.29 (0.46)
Age“How old are you?” (Blank field for respondents to fill in the answer)18–3527.16 (4.95)
Female“Are you…”
   (0)
Male
   (1)
Female
0–10.52 (0.50)
Married“Which one of the following descriptions best describes your current legal martial status today?”
   (0)
Others (registered civil partnership, separated, divorced, widowed, single, none of the above)
   (1)
Married
0–10.29 (0.45)
Medium education“What is the highest level of education you have successfully completed?”
Recoded towards:
  • (1) ISCED IV
  • Reference category: ISCED I to III
0–10.21 (0.40)
High education“What is the highest level of education you have successfully completed?”
Recoded towards:
  • (1) ISCED V or higher
  • Reference category: ISCED I to III
0–10.48 (0.50)
Employment status“Which of these descriptions applies to what you have been doing for the last month?”
Recoded towards:
   (0)
Unemployed/not having a job/not in paid work/in education/doing an internship/in training/unable to work because of health issues/doing civil service or compulsory military service/on parental leave/doing houswork, looking after children or other dependents/other
   (1)
In paid work as an employee/self-employed
0–10.59 (0.49)
Economic self-sufficiency“Thinking about your own financial situation, how satisfied are you right now?”
   (1)
Very dissatisfied
   (2)
Rather dissatisfied
   (3)
Rather satisfied
   (4)
Very satisfied
1–42.46 (0.86)
Social ties“Thinking about your friends, how many of them are unemployed?”
   (1)
None of them
   (2)
A few of them
   (3)
Some of them
   (4)
Most of them
   (5)
All of them
1–52.22 (1.01)
Risk aversion“On a scale from 0 to 10 would you say that in general you are a person who tends to avoid taking risks or are you fully prepared to take risks?”
Scale ranging from
   (0)
I tend to avoid risks
   (10)
I am fully prepared to take risks
0–105.30 (2.40)
Work values“Please read the following statements and tell us how much you agree or disagree with them.”
To fully develop your talents you need to have a job.
It’s humiliating to receive money without having to work.
Work is a duty towards society.
Work should always come first even if it means less spare time.
For all statements:
1—strongly disagree/2—somewhat disagree/3—somewhat agree/4—strongly agree
Recoded towards an index that takes the average of the answers to these statements.
1–42.87 (0.60)
Familialism“We would like to know your views about family relationships. To what extent to you agree of disagree with the follwing statements?”
It is the duty of family members to take care of each other, even if they have to give up something they want themselves.
Family members should stick together, no matter what sacrifices are required.
It is important that children respect the decisions made by their parents, even if they disagree with these decisions.
For all statements:
1—strongly disagree/2—somewhat disagree/3—somewhat agree/4—strongly agree
Recoded towards an index that takes the average of the answers to these statements.
1–43.14 (0.60)

References

  1. Emilsson, H.; Mozetič, K. Intra-EU youth mobility, human capital and career outcomes: The case of young high-skilled Latvians and Romanians in Sweden. J. Ethn. Migr. Stud. 2021, 47, 1811–1828. [Google Scholar] [CrossRef] [Green Version]
  2. Aksakal, M.; Schmidt, K. The role of cultural capital in life transitions among young intra-EU movers in Germany. J. Ethn. Migr. Stud. 2019. [Google Scholar] [CrossRef]
  3. Simões, F.; Rocca, A.; Rocha, R.; Mateus, C.; Marta, E.; Tosun, J. Time to Get Emotional: Determinants of University Students’ Intention to Return to Rural Areas. Sustainability 2021, 13, 5135. [Google Scholar] [CrossRef]
  4. Rye, J.F. Youth migration, rurality and class: A Bourdieusian approach. Eur. Urban Reg. Stud. 2011, 1–14. [Google Scholar] [CrossRef] [Green Version]
  5. Demi, M.A.; McLaughlin, D.K.; Snyder, A.R. Rural Youth Residential Preferences: Understanding the Youth Development—Community Development Nexus. Community Dev. 2009, 40, 311–330. [Google Scholar] [CrossRef]
  6. Theodori, A.E.; Theodori, G.L. The influence of community attachments, sense of community, and educational aspirations upon the migration intentions of rural youth in Texas. Community Dev. 2015, 46, 380–391. [Google Scholar] [CrossRef]
  7. Perpiña Castillo, C.; Kavalov, B.; Ribeiro Barranco, R.; Diogo, V.; Jacobs-Crisioni, C.; Batista e Silva, F.; Baranzelli, C.; Lavalle, C. Territorial Facts and Trens in the EU Rural Areas within 2015–2030; Publications Office of the European Union: Luxembourg, 2018. [Google Scholar] [CrossRef]
  8. Tosun, J.; Arco-Tirado, J.L.; Caserta, M.; Cemalcilar, Z.; Freitag, M.; Hörisch, F.; Jensen, C.; Kittel, B.; Littvay, L.; Lukes, M.; et al. Perceived economic self-sufficiency: A country- and generation-comparative approach. Eur. Political Sci. 2019, 18, 510–531. [Google Scholar] [CrossRef]
  9. King, R.; Williams, A.M. Editorial Introduction: New European Youth Mobilities. Popul. Space Place 2018, 24, e2121. [Google Scholar] [CrossRef]
  10. O’Reilly, J.; Eichhorst, W.; Gábos, A.; Hadjivassiliou, K.; Lain, D.; Leschke, J.; McGuinness, S.; Kureková, L.M.; Nazio, T.; Ortlieb, R.; et al. Five Characteristics of Youth Unemployment in Europe: Flexibility, Education, Migration, Family Legacies, and EU Policy. SAGE Open 2015, 1–19. [Google Scholar] [CrossRef] [Green Version]
  11. Eurostat. Youth Unemployment Rate by Sex, Age and Country of Birth [yth_empl_100]. 2021. Available online: https://appsso.eurostat.ec.europa.eu/nui/submitViewTableAction.do (accessed on 15 May 2021).
  12. Tosun, J. Promoting youth employment through multi-organizational governance. Public Money Manag. 2017, 37, 39–46. [Google Scholar] [CrossRef]
  13. Warmuth, J.R.; Kittel, B.; Steiber, N.; Mühlböck, M. Cultural Pathways to Economic Self-Sufficiency and Entrepreneurship. An Overview of Theoretical Perspectives on Micro Mechanisms. CUPESSE Working Paper 1; Heidelberg University: Heidelberg, Germany, 2015. [Google Scholar]
  14. Tosun, J.; Hörisch, F. Steering the behaviour of young people: The EU’s policy approach to promote employment. In Research Handbook on Behavioral Change and Public Policy; Strassheim, H., Beck, S., Eds.; Edgar Elgar: Cheltenham, UK, 2019; pp. 257–271. [Google Scholar]
  15. Marques, P.; Hörisch, F. Understanding massive youth unemployment during the EU sovereign debt crisis: A configurational study. Comp. Eur. Politics 2020, 18, 233–255. [Google Scholar] [CrossRef]
  16. European Commission. Youth in Action. Programme Guide. European Commission: Brussels, Belgium, 2012; pp. 1–149. [Google Scholar]
  17. Tosun, J.; Treib, O.; De Francesco, F. The impact of the European Youth Guarantee on active labour market policies: A convergence analysis. Int. J. Soc. Welf. 2019, 28, 358–368. [Google Scholar] [CrossRef]
  18. European Commission. Youth Employment Initiative (YEI). 2021. Available online: https://ec.europa.eu/social/main.jsp?catId=1176 (accessed on 15 May 2021).
  19. Council of the European Union. Council Recommendation on a Quality Framework for Traineeships (Employment, Social Policy, Health and Consumer Affairs Council Meeting). Brussels, Belgium. 2014. Available online: http://www.consilium.europa.eu/uedocs/cms_data/docs/pressdata/en/lsa/141424.pdf (accessed on 10 May 2021).
  20. Favell, A. The new face of east-west migration in Europe. J. Ethn. Migr. Stud. 2008, 34, 701–716. [Google Scholar] [CrossRef] [Green Version]
  21. European Commission. Youth on the Move (COM [2010] 477). Luxembourg: Publications Office of the European Union. 2010. Available online: http://europa.eu/youthonthemove/docs/communication/youth-on-the-move_EN.pdf (accessed on 10 May 2021).
  22. Nienaber, B.; Manafi, I.; Vysotskaya, V.; Roman, M.; Marinescu, D. Challenging youth unemployment through international mobility. J. Soc. Econ. Stat. 2020, 9, 5–27. [Google Scholar] [CrossRef]
  23. Kahanec, M.; Zimmermann, K. Labor Migration, EU Enlargement, and the Great Recession; Springer: Berlin, Germany, 2015. [Google Scholar]
  24. Rapp, C.; Shore, J.; Tosun, J. Not so risky business? How social policies shape the perceived feasibility of self-employment. J. Eur. Soc. Policy 2018, 28, 143–160. [Google Scholar] [CrossRef]
  25. Sroka, W.; Dudek, M.; Wojewodzic, T.; Król, K. Generational Changes in Agriculture: The Influence of Farm Characteristics and Socio-Economic Factors. Agriculture 2019, 9, 264. [Google Scholar] [CrossRef] [Green Version]
  26. Korzenszky, A. Extrafamilial farm succession: An adaptive strategy contributing to the renewal of peasantries in Austria. Can. J. Dev. Stud. 2019, 40, 291–308. [Google Scholar] [CrossRef] [Green Version]
  27. Zmika, K.; Fortes, A.; Tia, M.N.; Sumane, S.; Ayambila, S.N.; Zmija, D.; Satola, L.; Sutherland, L.A. Small farming and generational renewal in the context of food security challenges. Glob. Food Secur. 2020, 26, 1–8. [Google Scholar] [CrossRef]
  28. Eistrup, M.; Sanches, A.R.; Munoz-Rojas, J.; Correia, T.P. A “Young Farmer Problem”? Opportunities and Constraints for Generational Renewal in Farm Management: An Example from Southern Europe. Land 2019, 8, 70. [Google Scholar] [CrossRef] [Green Version]
  29. Kirkpatrick Johnson, M.; Elder, G.H., Jr.; Stern, M. Attachments to Family and Community and the Young Adult Transition of Rural Youth. J. Res. Adolesc. 2005, 15, 99–125. [Google Scholar] [CrossRef]
  30. Bjarnason, T.; Thorlindsson, T. Should I stay or should I go? Migration Expectations Among Youth in Icelandic Fishing and Farming Communities. J. Rural Stud. 2006, 22, 290–300. [Google Scholar] [CrossRef]
  31. Van Mol, C. Migration aspirations of European youth in times of crisis. J. Youth Stud. 2016, 19, 1303–1320. [Google Scholar] [CrossRef] [Green Version]
  32. Cairns, D.; Growiec, K.; de Almeida Alves, N. Another ‘Missing Middle’? The marginalised Majority of Tertiary-Educated Youth in Portugal during the Economic Crisis. J. Youth Stud. 2014, 17, 1046–1060. [Google Scholar] [CrossRef]
  33. Van Mol, C. Intra-European Student Mobility in International Higher Education Circuits. Europe on the Move; Palgrave Macmillan: Basingstoke, UK, 2014. [Google Scholar]
  34. Mulder, C.H. Putting family centre stage: Ties to nonresident family, internal migration, and immobility. Demogr. Res. 2018, 39, 1151–1180. [Google Scholar] [CrossRef] [Green Version]
  35. Thomas, M.J.; Dommermuth, L. Internal Migration and the Role of Intergenerational Family Ties and Life Events. J. Marriage Fam. 2020, 82, 1461–1478. [Google Scholar] [CrossRef] [Green Version]
  36. Arnett, J.J. Emerging Adulthood: The Winding Road from the Late Teens through the Twenties; Oxford University Press: New York, NY, USA, 2014. [Google Scholar]
  37. Tosun, J.; Speckesser, S.; Jensen, C.; O’Reilly, J. The absorption of structural and investment funds and youth unemployment. In EU Cohesion Policy: Reassessing Performance and Direction; Bachtler, J., Berkowitz, P., Hardy, S., Muravska, T., Eds.; Routledge: London, UK, 2016; pp. 151–168. [Google Scholar]
  38. Bonoli, G.; Natali, D. The Politics of the New Welfare State; Oxford University Press: Oxford, UK, 2012. [Google Scholar]
  39. Ajzen, I. Attitudes, Personality, and Behavior; Open University Press: Maidenhead, UK, 2005. [Google Scholar]
  40. De Jong, G. Expectations, gender, and norms in migration decision-making. Popul. Stud. 2010, 54, 307–319. [Google Scholar] [CrossRef]
  41. Van Dalen, H.P.; Henkens, K. Explaining Emigration Intentions and Behaviour in the Netherlands, 2005–10. Popul. Stud. 2012, 67, 225–241. [Google Scholar] [CrossRef] [Green Version]
  42. Eurostat. Methodology—Rural Development. 2021. Available online: https://ec.europa.eu/eurostat/de/web/rural-development/methodology (accessed on 15 May 2021).
  43. Debus, M.; Stegmaier, M.; Tosun, J. Economic voting under coalition governments: Evidence from Germany. Political Sci. Res. Methods 2014, 2, 315–334. [Google Scholar] [CrossRef]
  44. Weiss, J. What is Youth Political Participation? Literature Review on Youth Political Participation and Political Attitudes. Front. Political Sci. 2020, 2, 1–13. [Google Scholar] [CrossRef]
  45. Matsumoto, D.; Kouznetsova, N.; Ray, R.; Ratzlaff, C.; Biehl, M.; Raroque, J. Psychological Culture, Physical Health, and Subjective Well-being. J. Gend. Cult. Health 1999, 4, 1–18. [Google Scholar] [CrossRef]
  46. Vandenbrande, T.; Coppin, L.; van der Hallen, P.; Ester, P.; Fourage, D.; Fasang, A.; Geerdes, S.; Schömann, K. Mobility in Europe. Analysis of the 2005 Eurobarometer Survey on Geographical and Labour Market Mobility; European Foundation for the Improvement of Living and Working Conditions: Luxembourg, 2006. [Google Scholar]
  47. Pethe, H. Un-restricted agents? International migration of the highly skilled revisited. Soc. Geogr. Discuss. 2007, 3, 211–236. [Google Scholar] [CrossRef]
  48. Staniscia, B.; Deravignone, L.; González-Martín, B.; Pumares, P. Youth mobility and the development of human capital: Is there a Southern European model? J. Ethn. Migr. Stud. 2019, 1–17. [Google Scholar] [CrossRef]
  49. Feliciano, C. Educational Selectivity in U.S. Immigration: How do Immigrants Compare to Those Left Behind? Demography 2005, 42, 131–152. [Google Scholar] [CrossRef] [PubMed]
  50. Braun, M.; Arsene, C. The Demographics of Movers and Stayers in the European Union. In Pioneers of European Integration. Citizenship and Mobility in the EU; Recchi, E., Favell, A., Eds.; Edward Elgar: Cheltenham, UK, 2009; pp. 26–51. [Google Scholar]
  51. Cemalcilar, Z.; Jensen, C.; Tosun, J. Gendered Intergenerational Transmission of Work Values? A Country Comparison. ANNALS Am. Acad. Political Soc. Sci. 2019, 682, 125–138. [Google Scholar] [CrossRef]
  52. Farrugia, D. The mobility imperative for rural youth: The structural, symbolic and non-representational dimensions rural youth mobilities. J. Youth Stud. 2015, 1–17. [Google Scholar] [CrossRef]
  53. Giddens, A. The Consequences of Modernity; Polity Press: Cambridge, UK, 1996. [Google Scholar]
  54. Beck, U. The Cosmopolitan Society and Its Enemies. Theory Cult. Soc. 2002, 19, 17–44. [Google Scholar] [CrossRef]
  55. Salamonska, J.; Czeranowska, O. Janus-faced mobilities: Motivations for migration among European youth in times of crisis. J. Youth Stud. 2019, 1–17. [Google Scholar] [CrossRef]
  56. Pretty, G.; Bramston, P.; Patrick, J.; Pannach, W. The Relevance of Community Sentiments to Australian Rural Youths’ Intention to Stay in Their Home Communities. Am. Behav. Sci. 2006, 50, 226–240. [Google Scholar] [CrossRef] [Green Version]
  57. Weaver, R.K. Getting People to Behave: Research Lessons for Policy Makers. Public Adm. Rev. 2015, 75, 806–816. [Google Scholar] [CrossRef]
  58. Weiss, J.; Hörisch, F. Security or autonomy?—A comparative analysis of work values and labor market policies in different European welfare states. Int. J. Soc. Welf. 2021, 1–17. [Google Scholar]
Figure 1. Youth unemployment rates (15–29-year-olds). In addition to the rate for the EU 28, those states that are part of the sample of the later analysis are presented here. Eurostat has provided data on youth unemployment in Turkey only since 2012. Source: Eurostat 2021.
Sustainability 13 07494 g001
Table 1. Overview of EU policies to combat youth unemployment.
Policy ProgrammePolicy Measures
Youth in Action (2007)Legal framework for supporting non-formal learning activities of young people (Decision N° 1719/2006/EC). It promotes mobility within and beyond EU borders, non-formal learning, and intercultural dialogue and encourages all young people regardless of their background.
Youth on the Move (2010)Initiative (COM/2016/0940) for improving young adults’ prospects to find a job. The focus is on lifelong learning, higher education, and very centrally on the promotion of mobility.
Youth Guarantee (2013)Commitment by all member states to ensure that youth under the age of 30 receive a good-quality offer of employment, education, apprenticeship or traineeship within four months after leaving education or becoming unemployed.
Youth Employment Initiative (2013)Is one of the main EU financial resources to support the implementation of the Youth Guarantee. It supports young people who are not in education, employment, or training exclusively.
European Alliance for Apprenticeships (2014)Aims to help trainees acquire high-quality work experience under fair conditions and thereby increase their chance of finding a good-quality job.
Source: own overview.
Table 2. Descriptive statistics.
VariableObs.MeanStd. Dev.MinMax
Move within country17,4060.410.4901
Move to a different country17,4060.290.4601
Rural index17,4061.640.5813
Age17,40627.164.951835
Female17,4060.520.5001
Married17,4060.290.4501
Medium education17,4060.210.4001
High education17,4060.480.5001
Employment status17,4060.590.4901
Economic self-sufficiency17,4062.460.8614
Social ties17,4062.221.0115
Risk aversion17,4065.302.40010
Work values17,4062.870.6014
Familialism17,4063.140.6014
Table 3. Response distribution for the two dependent variables.
VariableMove within a CountryMove to a Different Country
No
(Obs. 10,217)
Yes
(Obs. 7189)
Diff.No
(Obs. 12,294)
Yes
(Obs. 5112)
Diff.
Employment status0.6120.568−0.044 ***0.6030.569−0.034 ***
Economic self-sufficiency2.4792.429−0.050 ***2.492.381−0.108 ***
Social ties2.1452.3150.170 ***2.1592.3520.193 ***
Rural index1.6311.6430.0121.6461.611−0.035 ***
Familialism3.1373.1480.0113.1443.136−0.008
*** p < 0.01.
Table 4. Estimation results for moving within the country.
Willingness to Move within
the Country
(M0)(M1)(M2)(M3)
Age0.971 ***0.971 ***0.976 ***0.971 ***
(0.00519)(0.00517)(0.00545)(0.00519)
Female0.738 ***0.738 ***0.720 ***0.739 ***
(0.0334)(0.0334)(0.0329)(0.0334)
Married0.9480.9440.9400.946
(0.0526)(0.0523)(0.0523)(0.0528)
Medium education1.282 ***1.291 ***1.312 ***1.284 ***
(0.0937)(0.0940)(0.0971)(0.0939)
High education1.480 ***1.495 ***1.554 ***1.482 ***
(0.0794)(0.0802)(0.0839)(0.0796)
Risk aversion1.108 ***1.109 ***1.109 ***1.108 ***
(0.0110)(0.0110)(0.0110)(0.0110)
Work values1.398 ***1.396 ***1.403 ***1.392 ***
(0.0573)(0.0572)(0.0579)(0.0594)
Rural index 1.185 ***
(0.0535)
Employment status 0.895 **
(0.0476)
Economic self-sufficiency 0.995
(0.0284)
Social ties 1.104 ***
(0.0282)
Familialism 1.015
(0.0418)
Constant0.272 ***0.189 ***0.208 ***0.263 ***
(0.0553)(0.0421)(0.0471)(0.0590)
Country fixed effectsYESYESYESYES
AIC23,573.1823,551.5923,529.9423,574.93
BIC23,712.9423,699.1223,693.0023,722.46
Observations17,40617,40617,40617,406
Odds ratios with standard errors in parenthesis clustered at the NUTS-2 level. AIC = Akaike information criterion; BIC = Bayesian information criterion. *** p < 0.01, ** p < 0.05.
Table 5. Estimation results for moving to a different country.
Willingness to Move to Another
Country
(M0)(M1)(M2)(M3)
Age0.976 ***0.976 ***0.975 ***0.976 ***
(0.00552)(0.00552)(0.00578)(0.00552)
Female0.801 ***0.800 ***0.793 ***0.799 ***
(0.0397)(0.0396)(0.0397)(0.0396)
Married0.882 **0.884 **0.889 *0.885 **
(0.0541)(0.0542)(0.0546)(0.0544)
Medium education1.196 **1.191 **1.231 **1.192 **
(0.0965)(0.0962)(0.100)(0.0964)
High education1.489 ***1.480 ***1.542 ***1.485 ***
(0.0888)(0.0885)(0.0932)(0.0888)
Risk aversion1.169 ***1.169 ***1.168 ***1.170 ***
(0.0132)(0.0132)(0.0132)(0.0132)
Work values1.183 ***1.184 ***1.180 ***1.194 ***
(0.0527)(0.0527)(0.0526)(0.0549)
Rural index 0.890 **
(0.0444)
Employment status 1.053
(0.0625)
Economic self-sufficiency 0.918 ***
(0.0295)
Social ties 1.083 ***
(0.0309)
Familialism 0.966
(0.0424)
Constant0.192 ***0.246 ***0.202 ***0.208 ***
(0.0424)(0.0606)(0.0505)(0.0505)
Country fixed effectsYESYESYESYES
AIC20,948.8120,941.5320,915.9320,949.64
BIC21,088.5721,089.0621,078.9821,097.16
Observations17,40617,40617,40617,406
Odds ratios with standard errors in parenthesis clustered at the NUTS-2 level. AIC = Akaike information criterion; BIC = Bayesian information criterion. *** p < 0.01, ** p < 0.05, * p < 0.1.
Table 6. Marginal effects of moving within the country.
Willingness to Move within
the Country
(M0)(M1)(M2)(M3)
Age−0.0071 ***−0.0070 ***−0.0059 ***−0.0071 ***
(0.0013)(0.0013)(0.0014)(0.0013)
Female−0.0735 ***−0.0734 ***−0.0795 ***−0.0733 ***
(0.0110)(0.0109)(0.0111)(0.0110)
Married−0.0130−0.0139−0.0150−0.0134
(0.0134)(0.0134)(0.0135)(0.0135)
Medium education0.0601 ***0.0618 ***0.0657 ***0.0605 ***
(0.0176)(0.0176)(0.0178)(0.0176)
High education0.0949 ***0.0973 ***0.1067 ***0.0951 ***
(0.0129)(0.0129)(0.0129)(0.0129)
Risk aversion0.0248 ***0.0250 ***0.0250 ***0.0248 ***
(0.0024)(0.0024)(0.0024)(0.0024)
Work values0.0810 ***0.0808 ***0.0820 ***0.0801 ***
(0.0099)(0.0099)(0.0100)(0.0103)
Rural index 0.0411 ***
(0.0109)
Employment status −0.0268 **
(0.0129)
Economic self-sufficiency −0.0011
(0.0069)
Social ties 0.0239 ***
(0.0062)
Familialism 0.0035
(0.0100)
Country fixed effectsYESYESYESYES
Observations17,40617,40617,40617,406
Robust standard errors in parenthesis clustered at the NUTS2 level. *** p < 0.01, ** p < 0.05.
Table 7. Marginal effects of moving to a different country.
Willingness to Move to
Another Country
(M0)(M1)(M2)(M3)
Age−0.0050 ***−0.0050 ***−0.0051 ***−0.0050 ***
(0.0011)(0.0011)(0.0012)(0.0011)
Female−0.0449 ***−0.0451 ***−0.0467 ***−0.0453 ***
(0.0100)(0.0100)(0.0101)(0.0100)
Married−0.0254 **−0.0250 **−0.0238 *−0.0246 **
(0.0124)(0.0124)(0.0124)(0.0124)
Medium education0.0361 **0.0353 **0.0420 **0.0355 **
(0.0162)(0.0162)(0.0163)(0.0162)
High education0.0804 ***0.0791 ***0.0874 ***0.0798 ***
(0.0118)(0.0118)(0.0119)(0.0118)
Risk aversion0.0316 ***0.0315 ***0.0314 ***0.0317 ***
(0.0022)(0.0022)(0.0022)(0.0023)
Work values0.0339 ***0.0341 ***0.0334 ***0.0358 ***
(0.0090)(0.0090)(0.0090)(0.0093)
Rural index −0.0235 **
(0.0101)
Employment status 0.0105
(0.0120)
Economic self-sufficiency −0.0173 ***
(0.0065)
Social ties 0.0161 ***
(0.0058)
Familialism −0.0070
(0.0089)
Country fixed effectsYESYESYESYES
Observations17,40617,40617,40617,406
Robust standard errors in parenthesis clustered at the NUTS2 level. *** p < 0.01, ** p < 0.05, * p < 0.1.
Publisher’s Note: MDPI stays neutral with regard to jurisdictional claims in published maps and institutional affiliations.

