Review

Effects of Dietary Tannins’ Supplementation on Growth Performance, Rumen Fermentation, and Enteric Methane Emissions in Beef Cattle: A Meta-Analysis

by
José Felipe Orzuna-Orzuna
1,
Griselda Dorantes-Iturbide
1,
Alejandro Lara-Bueno
1,*,
Germán David Mendoza-Martínez
2,
Luis Alberto Miranda-Romero
1 and
Pedro Abel Hernández-García
3
1
Departamento de Zootecnia, Universidad Autónoma Chapingo, Chapingo 56230, Mexico
2
Departamento de Producción Agrícola y Animal, Unidad Xochimilco, Universidad Autónoma Metropolitana, Mexico City 04960, Mexico
3
Centro Universitario UAEM Amecameca, Universidad Autónoma del Estado de Mexico, Amecameca 56900, Mexico
*
Author to whom correspondence should be addressed.
Sustainability 2021, 13(13), 7410; https://doi.org/10.3390/su13137410
Submission received: 15 May 2021 / Revised: 12 June 2021 / Accepted: 28 June 2021 / Published: 2 July 2021
(This article belongs to the Special Issue Sustainable Livestock Production)

Abstract

:
The environmental sustainability of beef production is a significant concern within the food production system. Tannins (TANs) can be used to minimize the environmental impact of ruminant production because they can improve ruminal fermentation and ruminants’ lifetime performances and mitigate methane (CH4) emissions. The objective of this study was to evaluate the effects of dietary supplementation with TANs as sustainable natural alternative to reduce the environmental impact on growth performance, rumen fermentation, enteric CH4 emissions, and nitrogen (N) use efficiency of beef cattle through a meta-analysis. A comprehensive search of studies published in scientific journals that investigated the effects of TANs’ supplementation on the variables of interest was performed using the Scopus, Web of Science, and PubMed databases. The data analyzed were extracted from 32 peer-reviewed publications. The effects of TANs were assessed using random-effects statistical models to examine the standardized mean difference (SMD) between TANs’ treatments and control (non-TANs). The heterogeneity was explored by meta-regression and subgroup analysis was performed for the covariates that were significant. TANs’ supplementation did not affect weight gain, feed consumption, feed efficiency, or N use efficiency (p > 0.05). However, it reduced the concentration of ammonia nitrogen in rumen (SMD = −0.508, p < 0.001), CH4 emissions per day (SMD = −0.474, p < 0.01) and per unit dry matter intake (SMD = −0.408, p < 0.01), urinary N excretion (SMD = −0.338, p < 0.05), and dry matter digestibility (SMD = −0.589, p < 0.001). Ruminal propionate (SMD = 0.250) and butyrate (SMD = 0.198) concentrations and fecal N excretion (SMD = 0.860) improved in response to TANs’ supplementation (p < 0.05). In conclusion, it is possible to use TANs as a CH4 mitigation strategy without affecting cattle growth rate. In addition, the shift from urinary to fecal N may be beneficial for environment preservation, as urinary N induces more harmful emissions than fecal N. Therefore, the addition of tannins in the diet of beef cattle could be used as a sustainable natural alternative to reduce the environmental impact of beef production.

1. Introduction

Minimizing enteric methane (CH4) emissions from ruminant production while improving feed conversion efficiency and growth rate is a goal for sustainable livestock production [1]. In addition, the nitrogen (N) excreted by ruminants is the main source of nitrous oxide (N2O) emissions in livestock systems [2] and can contribute to air and water pollution [3]. Therefore, strategies based on changing the composition and concentration of urinary compounds by diet manipulation could be considered potential options to mitigate urine N2O emissions and consequently improve sustainability in ruminant production [4]. Among these strategies, dietary tannins’ (TANs’) supplementation has received special attention, particularly in ruminants [5]. TANs are a group of polyphenolic compounds that are present in a wide variety of plants and can have positive effects in animals, such as antimicrobial, antiparasitic, antioxidant, anti-inflammatory, and immunomodulatory [5]. According to Naumann et al. [6], TANs are generally classified based on their chemical structure into two groups: condensed tannins (CTs) and hydrolysable tannins (HTs). CTs consist of flavan-3-ol subunits linked together to form oligomers and polymers, whereas HTs are esters of gallic or ellagic acid linked to a polyol core [6].
In ruminants, previous studies [7,8,9] have shown that dietary supplementation with TANs improves the utilization efficiency of ingested feed. In addition, TANs have been successfully used to reduce enteric CH4 production, urinary N excretion, and N2O emissions [7,10] and to increase the duodenal flux of microbial protein and amino acids [11]. TANs-rich plants and TANs’ extracts have also shown positive impact on rumen microbial activity [12], ruminal fermentation rate [10], antioxidant status, and health of ruminants [13,14]. However, TANs can also reduce the digestion of protein in the rumen and the entire gastrointestinal tract [15]. Therefore, the intake of TANs in combination with a medium-poor quality diet (e.g., insufficient crude protein in the diet) may not generate nutritional benefits and is detrimental to performance ([6,8,15]. For example, some studies have reported negative effects of dietary supplementation with TANs on digestibility, productive performance, and ruminal fermentation [2,16], while other studies have not observed significant effects on digestibility, productive performance, CH4 emissions, and urinary and fecal nitrogen excretion in response to TAN supplementation [7,11,16].
Particularly, in beef cattle, several studies have been conducted to evaluate the effect of dietary supplementation with TANs on the growth performance [17,18], nutrient intake and digestibility [19,20], ruminal parameters [21,22], enteric CH4 emissions [23,24], and urinary and fecal N excretion [17,21]. However, the results observed to date have been non-conclusive because their effects vary widely, even within the same plant species [14]. The variations in the chemical and botanical origin of TANs, processing methods, feeding conditions, physiological state of animals, and supplementation levels used are factors that could contribute to the variability of the effects observed in animals supplemented with TANs [5,14,25]. Therefore, identifying and controlling this variability is a key aspect in the development of TANs-containing products that can be used as feed additives to improve the sustainability of beef production.
Although some classical reviews [5,6,14,25] previously suggested that dietary supplementation with TANs can improve productivity and decrease enteric CH4 production in ruminants, these studies did not use a meta-analytical approach and none focused only on beef cattle. Meta-analysis (MA) is a statistical tool that allows combining and synthesizing data published in different studies in a quantitative way [26,27,28]. In addition, MA can be used to explore sources of heterogeneity, which provides additional information on factors contributing to the variability of the observed results [29], and it also helps to identify potential areas for further research [26]. MA has been frequently used in clinical and biomedical research, but its implementation in animal science-related research is still limited [30]. The objective of this meta-analysis was to evaluate the effect of dietary supplementation with tannins as sustainable natural alternative to reduce the environmental impact on the growth performance, nutrient intake and digestibility, ruminal parameters, enteric CH4 emissions, and nitrogen use efficiency of beef cattle. In addition, we examined the heterogeneity of the responses by meta-regression analysis to identify factors contributing to the variability observed in the response variables.

2. Materials and Methods

2.1. Literature Search and Study Selection

A comprehensive literature search in the scientific databases of Web of Science, Scopus, and PubMed was carried out to identify studies that investigated the effect of TANs’ supplementation on growth performance, nutrient intake and digestibility, ruminal fermentation, and enteric CH4 emissions in beef cattle. In all databases, the keywords “tannin, chestnut, quebracho, leucaena, birdsfoot, lotus, sainfoin, onobrychis, sulla, hedysarum, proanthocyanidin, growth, digestibility, fermentation, methane, bull, steer and cattle” were used, among which were TANs and the most common TANs-containing plants [31]. A total of 613 scientific publications published between 2010 and 2020 were identified. These publications went through a two-step selection process, as previously described by Herremans et al. [31]. First, a selection was performed using titles and abstracts excluding in vitro and simulation studies, reviews, and articles that did not measure the variables of interest. Subsequently, to be considered, studies had to meet several inclusion criteria previously reported by other authors [31,32]: (1) studies on adult (male, weaned or older) and confined beef cattle; (2) data on growth performance, nutrient intake and digestibility, ruminal fermentation, urinary and fecal excretion, or in vivo CH4 emissions (measured with respirometry chambers, the sulfur hexafluoride “SF6” tracer technique, or the Green-Feed system (C-Lock Inc., Rapid City, SD, USA)); (3) similarity between control and experimental groups, except for the presence of TANs; (4) quantification or possible determination of dietary TANs’ doses; (5) peer-reviewed journal articles written in English; (6) experimental design employed (rotating or continuous); (7) least squares means of the control and experimental groups with variability measures (standard error or standard deviation); and (8) sample size used.

2.2. Data Extraction

Based on the selection criteria, only 32 articles were included in the database for the final analysis. The response variables extracted for the meta-analysis included daily weight gain, feed efficiency (determined as weight gain/feed intake (G:F), kg/kg), final body weight, intake and digestibility of dry matter (DM) and nutrients (organic matter, crude protein, ether extract, neutral detergent fiber digestibility, and acid detergent fiber digestibility), ruminal parameters (ruminal concentration of propionate, butyrate, acetate, total volatile fatty acids, ammonia nitrogen, and protozoa), in vivo CH4 emissions (per day and per unit of dry matter intake), and urinary and fecal N excretion. Moreover, when available, additional data were collected, such as characteristics of the published study (author, year of publication), amount of forage in the diet (g/kg DM), source of chemical or botanical origin of TANs, experimental design used (rotational or continuous), period of TANs’ supplementation (days), chemical composition of diet, number of replicates, type of TANs (CTs, HTs, or mixture of both), method of TANs’ inclusion (extract or naturally present in the diet), and amount of TANs in the diet (g/kg DM). The references of the articles included in the data set are listed in Table A1 in Appendix A. Averages, standard deviation (SD), and number of repetitions for each treatment were extracted from these articles. When the articles presented the SD of each experimental group, these values were used directly in the meta-analysis. In cases where the SD was not reported, it was calculated by multiplying the standard error means (SEM) by the square root of the sample size, using the equation SD = SEM × √n, as previously reported by Higgins and Thomas [33], where n = number of replicates.

2.3. Calculations and Statistical Analysis

Regarding the data involved in the meta-analysis and meta-regression, these were analyzed using the Open Meta-analyst for Ecology and Evolution software [34] and the statistical software R (version 3.6.3) using the “metafor” package [35]. The response variables were analyzed through the standardized mean difference (SMD), also called effect size (ES), in which the difference between the means of the experimental and control groups was standardized using the SD of the groups with and without TANs [36]. The SMDs were calculated using the methods previously described by DerSimonian and Laird [37] for random effects models. The SMD is a more robust estimation of the ES when there is heterogeneity in the data set [38]. On the other hand, using the SAS statistical program [39], the chemical composition variables of the diets and the response parameters extracted were analyzed with the MEANS procedure to obtain descriptive statistics values. Differences in the composition of the diets of the control and TANs-supplemented treatments were evaluated by the MIXED procedure, using the studies as random effect and Tukey’s test to detect differences between treatments, as previously reported by Torres et al. [40].

2.4. Heterogeneity

Measurement of heterogeneity was performed using chi-square test (Q) and the I2 (percentage of variation) statistic [41]. Due to the relatively low power of the Q test to detect heterogeneity among a small number of treatment comparisons, an α level of 0.10 was used [38,42]. I2 values range from 0 to 100%. Values close to 25% indicate low heterogeneity, close to 50% indicate moderate heterogeneity, and close to 75% indicate high heterogeneity among studies [27,29]. Likewise, I2 values greater than 50% indicate significant heterogeneity [32].

2.5. Publication Bias

According to Littell et al. [43], the visual inspection of funnel plots generally used to assess publication bias is subjective and must be balanced with additional analyses. Accordingly, three methods were used to assess evidence of publication bias: (1) the funnel plot [44], (2) Egger’s regression asymmetry test [45], and (3) Begg’s adjusted rank correlation [46]. A bias was considered to be present when the funnel plot showed asymmetry or when at least one of the statistical methods (Egger’s test or Begg’s test) was significant (p < 0.10). The tests to assess publication bias are inappropriate when significant heterogeneity (Q) is detected with an α ≤ 0.10 and when the variable to be assessed is not reported in at least 10 studies because it may lead to false-positive claims [47]. Consequently, funnel plots, Egger’s test, and Begg’s test were only performed for variables that met the aforementioned criteria. In cases where statistical evidence of publication bias was found, the trim-and-fill method of Duval and Tweedie was used to estimate the number of possible missing observations [48].

2.6. Meta-Regression

The sources of heterogeneity of parameters that showed an I2 greater than 50% [27] or Q with an α level of ≤0.10 [42] were evaluated by a meta-regression analysis. The meta-regression analysis was only performed for response variables that were reported in at least 10 studies [43]. Meta-regression was estimated using the DerSimonian and Laird method of moments, which is well established for estimating the variance between studies [27]. In the meta-regression, continuous and categorical variables were used. The continuous variables were TANs’ doses (g/kg DM), difference of NDF content in the diets (g/kg DM), and duration of the experimental phase (days). The categorical variables were type of TANs (CTs, HTs, or mixture of both), source of botanical or chemical origin of the TANs, method by which the TANs were supplied (extract or as part of some dietary ingredient), animal’s age (≤12 and >12 months old), and the experimental design used (rotational or continuous). When categorical co-variables were significant at an α level of ≤0.05, SMD was assessed by subgroup analysis. Likewise, when the meta-regression was significant (p ≤ 0.05) for continuous co-variables, these were evaluated by subgroup analysis dividing the co-variables as follows: level of TANs’ supplementation in the diet (≤12 and >12 g/kg DM) and experimental period (≤90 and >90 days).

3. Results

3.1. Study Attributes and Excluded Studies

The online search using three databases of scientific publications from January 2010 to December 2020 returned a total of 613 publications (Figure S1). After exclusion of duplicate papers and selection of titles and abstracts, 46 full-text articles were evaluated. Of these, 32 articles met the inclusion criteria (Table A1) and were used to obtain quantitative data for meta-analysis.
The descriptive statistics and means test for diet composition are presented in Table 1. Except for NDF content, no significant differences were observed between the control and the TANs’ treatment for the rest of the nutrient components of the diet (p > 0.05). This indicates that it is possible to exclude the effects of the chemical composition of the diets on the response of the animals to TANs’ supplementation for the data set.
The studies included in this meta-analysis were conducted in 10 different countries (Table A1). The experimental doses of TANs ranged from 0.46 to 60 g/kg DM, while the duration of the experimental periods varied from 28 to 180 days (Table 1). The TANs used were divided into CTs, HTs, and mixture of both. Of the treatments, 53.3% used CTs, 12.4% used HTs, and 34.3% used mixtures of CTs and HTs. On the other hand, 77% of the treatments used TANs’ extracts in the diets, while 23% used parts of plants, forages, or subproducts that contained TANs in natural form (Table A1). Regarding TANs’ sources, most of the treatments (34.3%) used TANs from quebracho tree (Schinopsis spp.), 19% used TANs from Acacia mearnsii, and 14.3% used TANs from pistachio tree (Pistacia vera). On the other hand, 32.4% of the treatments supplied TANs from chestnut tree (Castanea sativa), Leucaena leucocephala, tannic acid, and mixtures of these or other sources (Table A1).

3.2. Growth Performance and Nutrient Intake

In general, no significant effects of TANs’ inclusion in beef cattle diets were found (p > 0.05) for final body weight (FBW), dry matter intake (DMI), organic matter intake (OMI), crude protein intake (CPI), ether extract intake (EEI), neutral detergent fiber intake (NDFI), acid detergent fiber intake (ADFI), average daily gain (ADG), or feed efficiency (FE; Table 2). However, there was tendency in reduction of FE (p = 0.06).

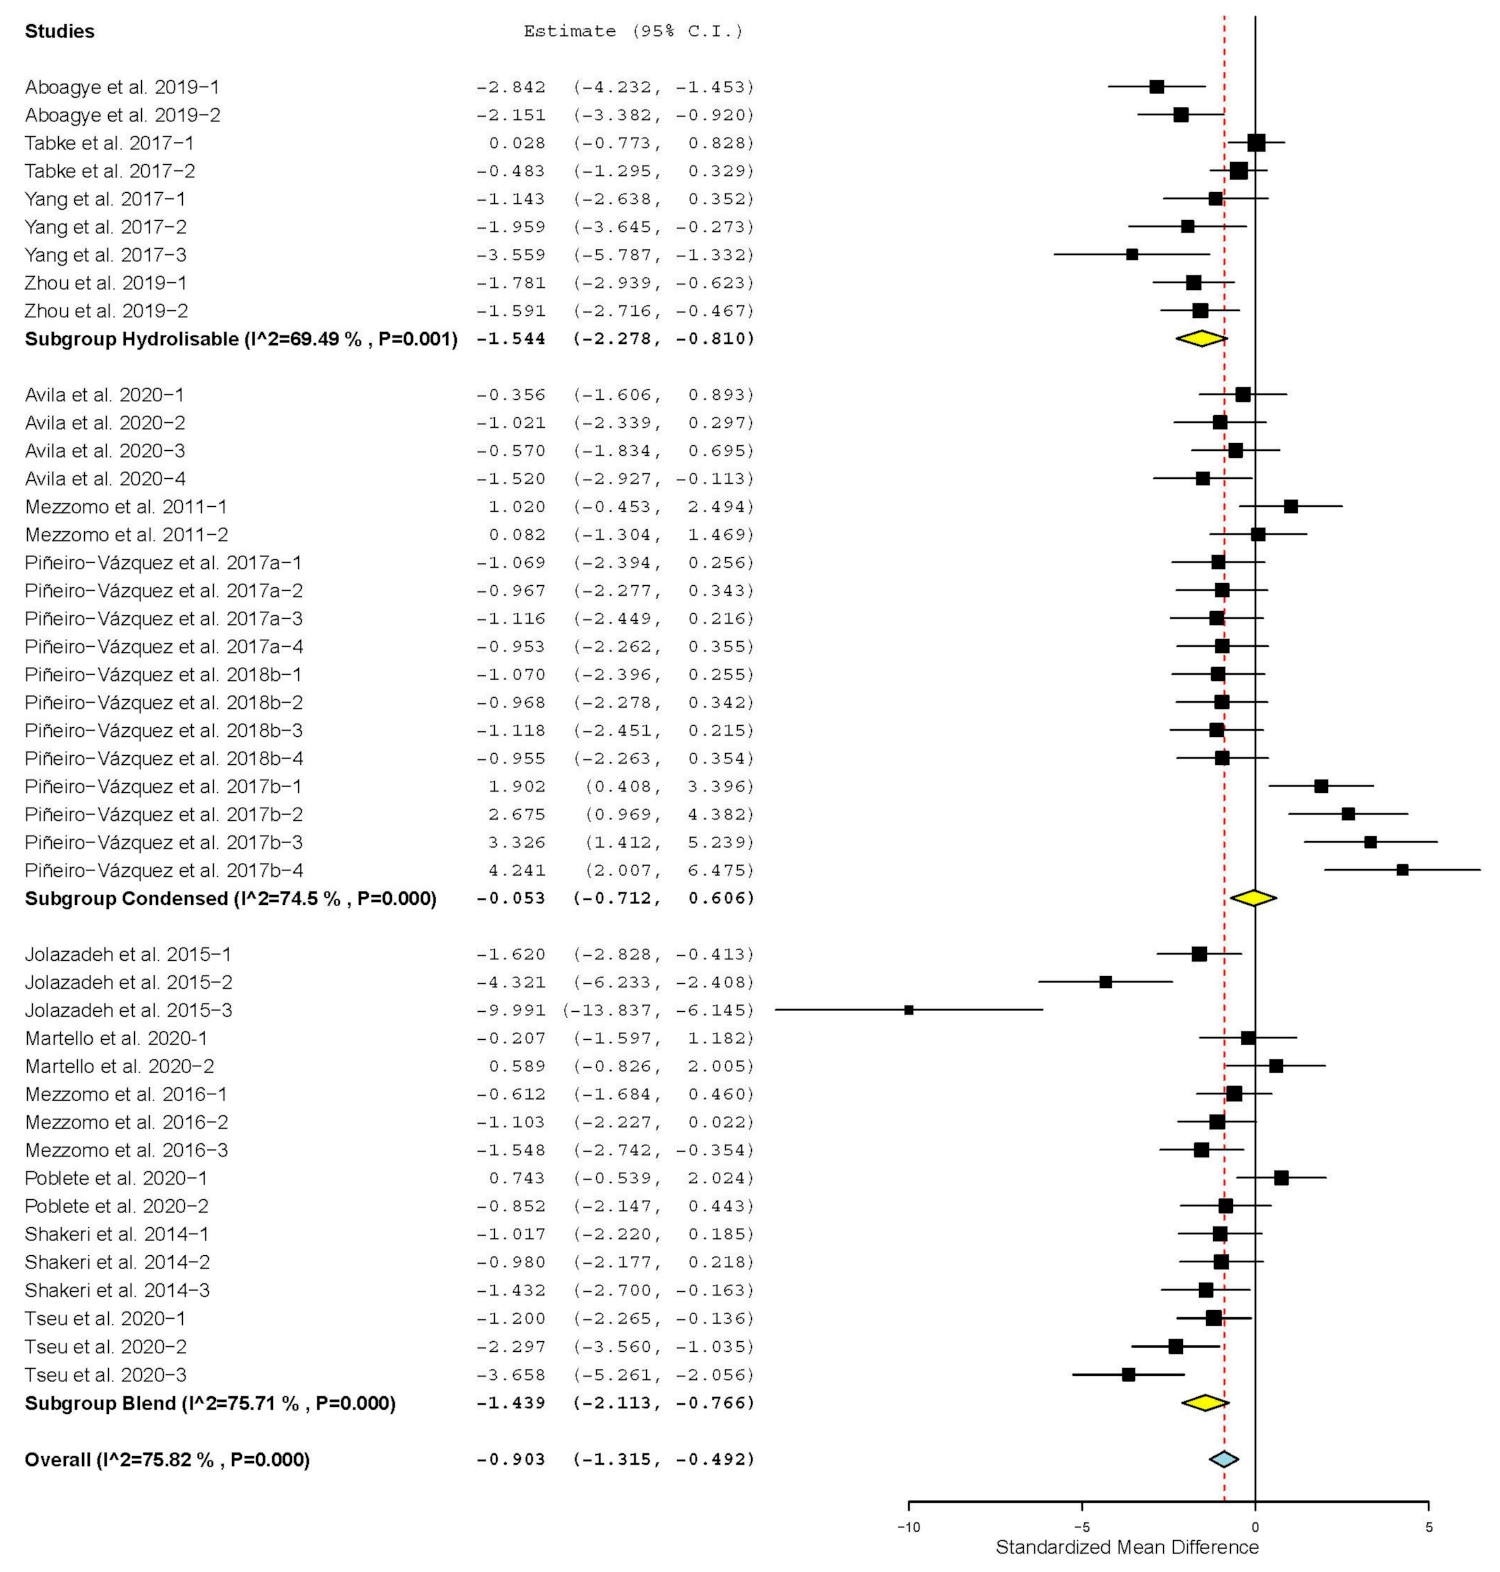
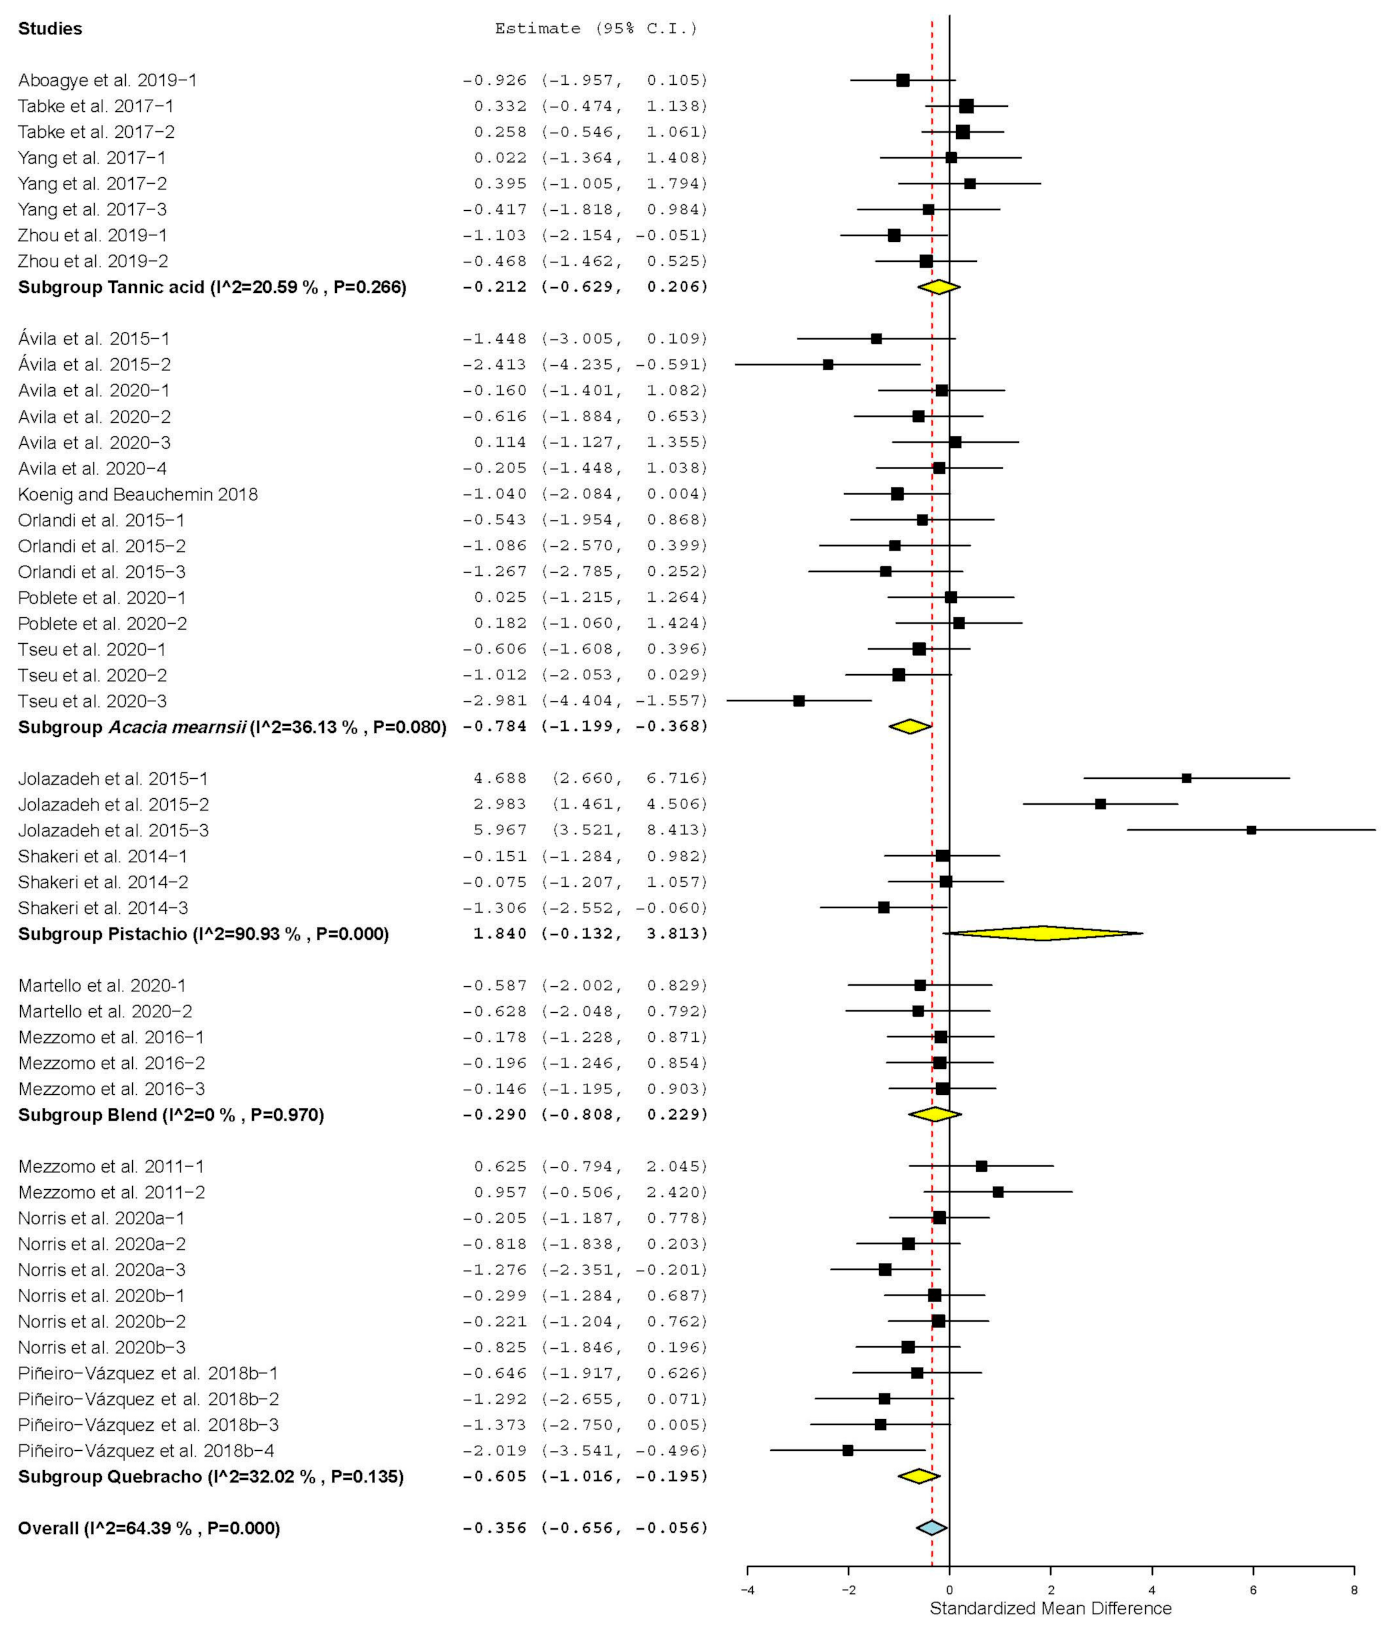
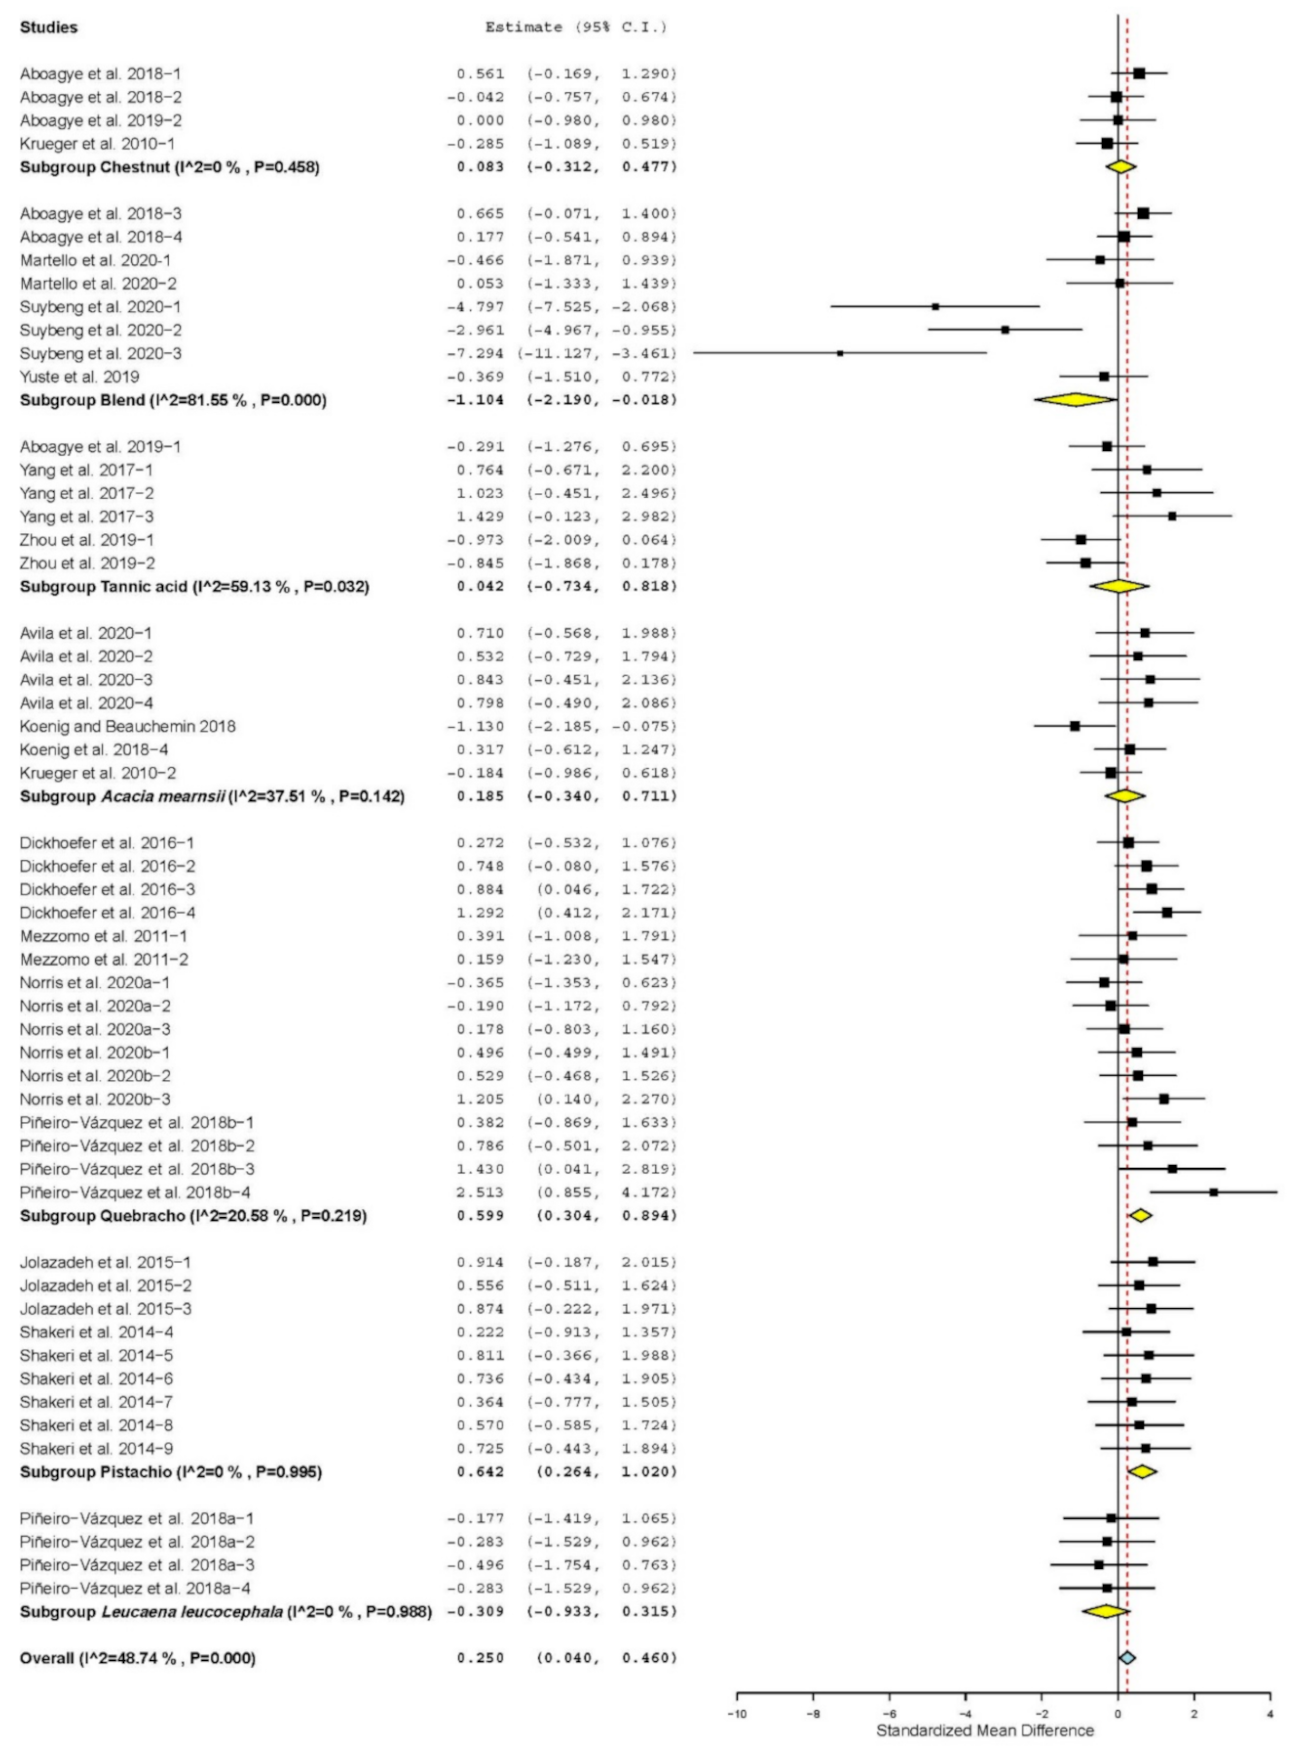
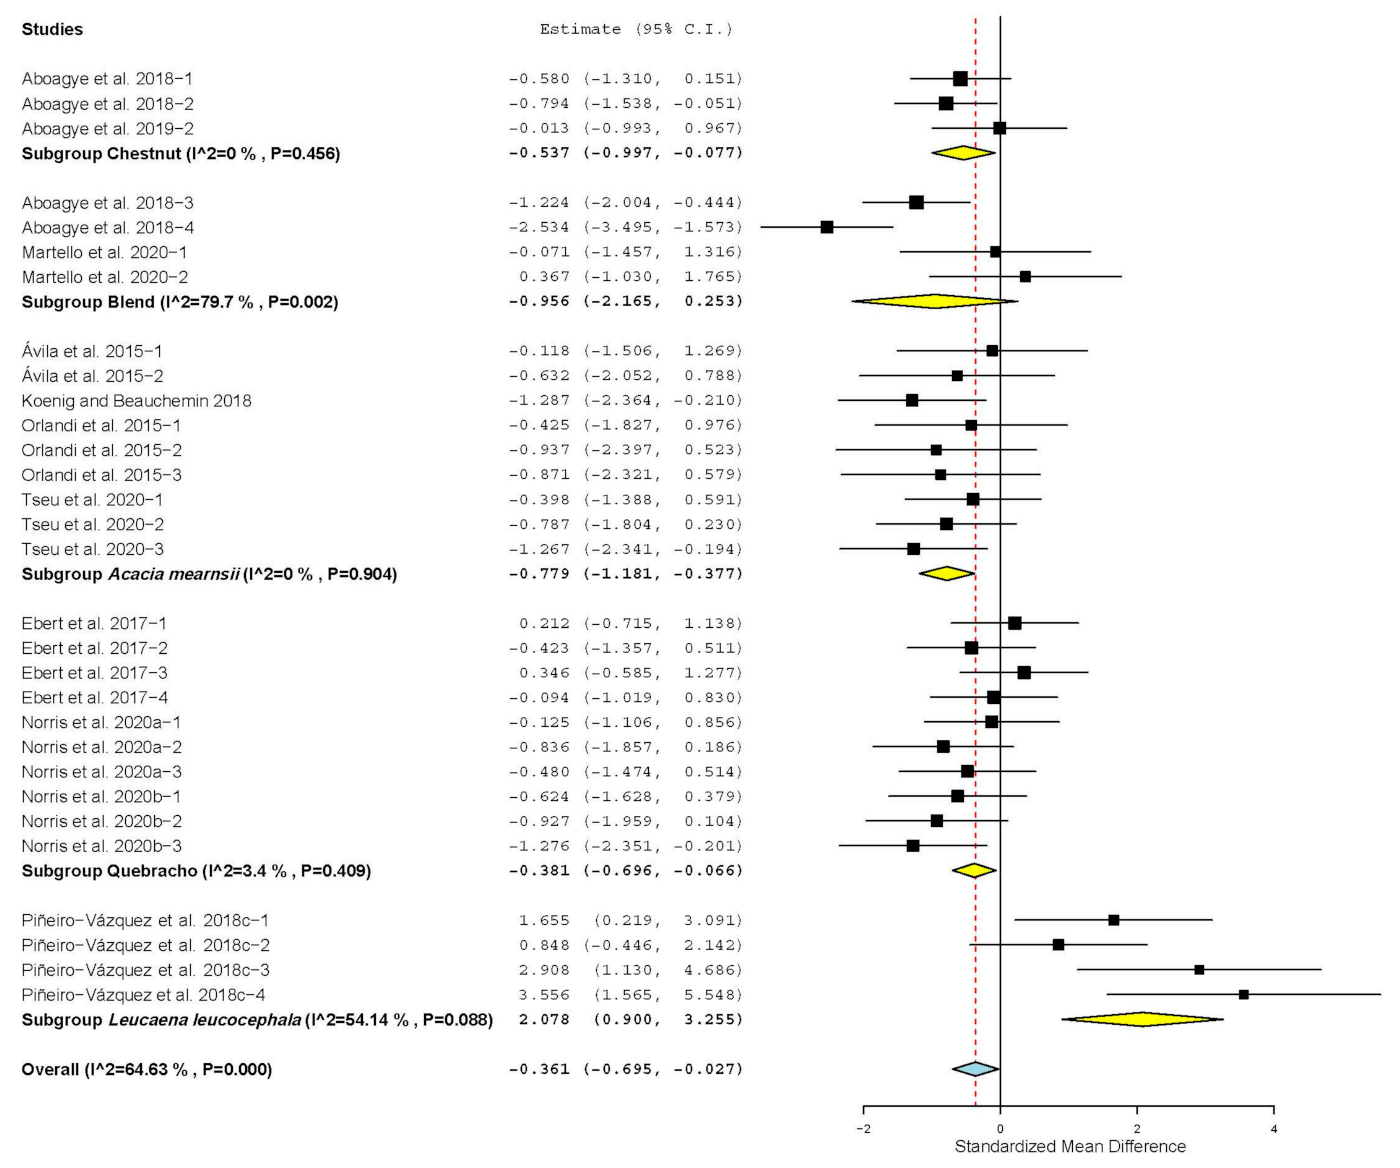
3.3. Digestibility, Ruminal Parameters, and Methane Emissions

There were no significant effects of TANs’ inclusion in beef cattle diets (p > 0.05) for ether extract digestibility (EED), ruminal pH, ruminal concentration of total volatile fatty acids (VFA), acetate and protozoa, or for nitrogen use efficiency (NUE; Table 3). However, we observed a negative impact (p < 0.05) of TANs’ inclusion in the diets on dry matter digestibility (DMD), organic matter digestibility (OMD), crude protein digestibility (CPD), neutral detergent fiber digestibility (NDFD), and acid detergent fiber digestibility (ADFD). On the other hand, rumen propionate, butyrate concentration, and fecal nitrogen excretion (FNE) increased (p < 0.05) in response to TANs’ supplementation. We observed a positive impact (reduction) of TANs’ inclusion (p < 0.05) in the diets for ruminal ammonia nitrogen concentration (NH3-N), urinary nitrogen excretion (UNE), and for enteric CH4 emissions per day (MED) and per unit of dry matter intake (MEDMI; Table 3).

3.4. Analysis of Publication Bias

The tests to assess publication bias are inappropriate when there is significant heterogeneity (Q) (p ≤ 0.10) and when the variable to be assessed is not reported in at least 10 studies [47]. Therefore, this analysis was only performed for ADG, FBW, OMI, NDFI, and ruminal butyrate concentration. The visual inspection of the funnel plots showed presence of publication bias for all variables analyzed (Figures S2a, S3a, S4a, S5a and S6a). Egger’s test showed publication bias for ADG, FBW, OMI, and NDFI (p < 0.05), but did not detect publication bias for butyrate (p = 0.87). On the other hand, Begg’s test only detected publication bias for ADG and OMI (p < 0.05), while FBW, NDFI, and butyrate were not significant (p > 0.10). The trim-and-fill method indicated that the number of missing observations for ADG and FBW were seven and nine, respectively, both on the left side of the funnel plot (Figures S2b and S3b), whereas, for OMI, NDFI, and butyrate, the missing observations were 14, 7, and 13, respectively, all on the right side of the funnel plot (Figures S4b, S5b and S6b).

3.5. Meta-Regression

Significant heterogeneity (Q) was observed for DMI, FE (p < 0.05; Table 2), DMD, OMD, CPD, EED, NDFD, ADFD, ruminal pH, ruminal NH3-N concentration, total VFA, acetate, propionate and protozoa, MED, and MEDMI, as well as for UNE and FNE (p < 0.001; Table 3). Although significant heterogeneity existed, it is not advisable to use meta-regression when there are fewer than 10 studies that reported the response variable of interest [43]. Consequently, this analysis was only performed for the variables DMI, DMD, OMD, CPD, NDFD, ruminal pH, ruminal concentration of NH3-N, total VFA, acetate and propionate, MEDMI, and UNE as well as for the FNE.
Except for age, there was no significant relationship (p > 0.05) between DMI and the moderators used (level of supplementation, period of supplementation, type of TANs, method of TANs’ supply, source of botanical or chemical origin of TANs, NDF content in the diet, and experimental design). The dose of TANs supplied in the diets explained 63.4, 69.1, 25.8, 33.4, 17.2, and 31.7% of the observed heterogeneity for DMD, OMD, NDFD, ruminal acetate and propionate concentration, and FNE, respectively (p < 0.05). The period of TANs’ supplementation only had a significant relationship (p < 0.05) with the MEDMI, explaining only 21.95% of the observed heterogeneity. The type of TANs explained (p < 0.05) only 7.25, 7.16, 19.5, 6.7, and 17.4% of the observed heterogeneity in CPD, NDFD, NH3-N, total VFA, and UNE, respectively. A significant relationship (p < 0.05) was observed between CPD and MEDMI with the method of inclusion of TANs in the diet (extract or naturally present in plant parts), where the inclusion method explained 14.5, 23.2, 70.3, and 84.85% of the observed heterogeneity in CPD, MEDMI, UNE, and FNE, respectively. The source of botanical or chemical origin of TANs explained (p < 0.05) 48.7, 13.3, 83.7, 17.3, 18, 61, 82.3, and 100% of the heterogeneity observed in CPD, NDFD, NH3-N, total VFA, propionate, MEDMI, UNE, and FNE, respectively. A significant relationship (p < 0.05) was observed between CPD and MEDMI with the NDF content of the diets, where variation in NDF content explained 16 and 48.8% of the heterogeneity observed in CPD and MEDMI, respectively. The experimental design used (rotating or continuous) explained (p < 0.05) 19.8, 42, 29.7, 48.2, and 33.1% of the observed heterogeneity for DMD, OMD, NDFD, ruminal pH, and MEDMI, respectively. The age (≤12 and >12 months old) explained (p < 0.05) 31.4, 100, 49.7, 55.1, and 79.7% of the heterogeneity observed in DMI, CPD, ruminal pH, NH3-N, and total VFA, respectively.

3.6. Subgroup Analysis

Regarding the type of TANs, supplementation with HTs and mixture of CTs with HTs decreased CPD (p < 0.001), while there was no change in CPD in animals supplemented with CTs (p > 0.05; Figure 1). NDFD decreased (SMD = −0.633; p < 0.001) in beef cattle supplemented with CTs, but there was no change in NDFD with supplementation of HTs and mixture of CTs with HTs (p > 0.05; Figure S7). Ruminal NH3-N concentration decreased (p < 0.001) with supplementation of HTs (SMD = −0.980) and mixture of CTs with HTs (SMD = −0.582). However, NH3-N was not affected in animals supplemented with CTs (p > 0.05; Figure S8). The ruminal concentration of total VFA increased in study animals using CTs (SMD = 0.253; p = 0.04) but decreased when using HTs (SMD = −0.491; p = 0.03). No significant changes in ruminal concentration of total VFA were observed in study animals using mixtures of CTs and HTs (p > 0.05; Figure 2). UNE decreased with supplementation of HTs and mixture of CTs (SMD = −0.445; p = 0.03 with HTs (SMD = −0.900; p < 0.001). However, UNE was not affected in animals supplemented with CTs (SMD = −0.338; p > 0.05).
With respect to the source of botanical or chemical origin of the TANs, Figure 3 shows that, except for plant mixtures, all TANs’ sources modified CPD (p < 0.05; Figure 3).
Figure 4 shows that NDFD decreased (p < 0.05) only when TANs came from Acacia mearnsii and quebracho. Ruminal NH3-N concentration was not affected by TANs when they came from a mixture of plants (p > 0.05). However, it increased when the TANs came from Leucaena leucocephala (SMD = 76.47; p < 0.001) and decreased in studies using Acacia mearnsii, quebracho, chestnut, pistachio, and tannic acid as a source of TANs (p < 0.05; Figure S9).
Supplementation with TANs decreased the concentration of total VFA in ruminal liquid when tannic acid was the source of chemical origin of the TANs (SMD = −0886; p = 0.004). On the other hand, the ruminal concentration of total VFA increased (SMD = 0.431; p = 0.018) when quebracho was used as the source of TANs (Figure 5).
Dietary supplementation with TANs increased ruminal propionate concentration only when TANs were obtained from quebracho tree and pistachio (p < 0.001), while ruminal propionate concentration was reduced (SMD = −1.104; p = 0.046) when TANs were from plant mixtures (Figure 6).
Dietary supplementation with TANs significantly reduced MEDMI only in animals from studies using tannic acid and Leucaena leucocephala as a source of TANs (p < 0.001; Figure 7).
Figure 8 shows that UNE decreased (p < 0.05) only when TANs came from chestnut, Acacia mearnsii, quebracho, and Leucaena leucocephala (p < 0.05). However, when TANs were supplied as a part of the diet ingredients, FNE was not affected (SMD = −0.368; p > 0.05). However, UNE was not affected by TANs when they came from a mixture of plants (p > 0.05). On the other hand, FNE was not affected by TANs when they came from a mixture of plants and Leucaena leucocephala (p > 0.05). However, it increased (p < 0.001) when the TANs came from Acacia mearnsii and quebracho (Figure 9).
With respect to the method by which TANs were included in the diets, CPD decreased when TANs were added to the diets in the form of extracts (SMD = −1.199; p <0.001). However, when TANs were contained in the ingredients of the diets, CPD was not affected (p = 0.179; Figure S10). MEDMI decreased significantly when TANs were supplied as part of the diet ingredients (SMD = −0.982; p < 0.001); however, when TANs were added to the diets in the form of extracts, MEDMI was not affected (p > 0.05; Figure 10). UNE decreased when TANs were added to the diets in the form of extracts (SMD = −0.558; p < 0.001). However, UNE increased when TANs were contained in the ingredients of the diets (SMD = 2.078; p < 0.001). On the other hand, UFE increased significantly when TANs were added to the diets in the form of extracts (SMD = p < 0.001); however, when TANs were supplied as a part of the diet ingredients, FNE was not affected (SMD = −0.368; p > 0.05).
Regardless of TANs’ supplementation, animals from studies that used rotational experimental designs (i.e., Latin squares and crossover designs) had lower DMD (SMD = −0.765; p < 0.001), while no differences were observed regarding DMD in animals from studies that used continuous experimental designs (i.e., completely randomized and randomized blocks designs; p > 0.05). OMD decreased in animals from studies that used rotating experimental designs (SMD = −0.856; p < 0.001), while no difference was observed in DMD in animals from studies that used continuous experimental designs (p > 0.05). Studies that used rotating experimental designs had lower NDFD (SMD = −0.704; p <0.001); however, NDFD was not affected in animals from studies that used continuous experimental designs (p > 0.05). Ruminal pH was not affected by the type of experimental design used (p > 0.05). MEDMI decreased in animals from studies that used rotating experimental designs (SMD = −0.836; p < 0.001), while no differences were observed with respect to MEDMI in animals from studies that used continuous experimental designs (p > 0.05).
Regarding the level of TANs’ supplementation, animals in studies using doses greater than 12 g/kg DM showed lower DMD (SMD = −0.917; p < 0.001), while no differences were observed in DMD in animals in studies using doses lower than 12 g/kg DM (p > 0.05). OMD was lower in animals supplemented with doses of TANs higher than 12 g/kg DM (SMD = −0.976; p < 0.001), but doses lower than 12 g did not change OMD (p > 0.05). Studies using TANs’ doses higher than 12 g/kg DM had lower NDFD (SMD = −0.775; p < 0.001); however, NDFD was not affected when TANs’ doses lower than 12 g/kg DM were used (p > 0.05). The concentration of acetate in the ruminal fluid increased in animals from studies that used TANs’ doses lower than 12 g/kg DM (SMD = 0.387; p = 0.038), while there was no effect when more than 12 g TANs were used (p > 0.05). Animals in studies that used TANs’ doses higher than 12 g/kg DM showed higher rumen propionate concentration (SMD = 0.319; p = 0.010), whereas TANs’ doses lower than 12 g/kg DM did not change rumen propionate concentration (p > 0.05). FNE increased significantly regardless of the dose of TANs used; however, the effect was greater (SMD = 1.119; p < 0.001) when doses greater than 12 g/kg DM were used compared to doses of less than 12 g/kg DM (SMD = 0.482; p < 0.01).
Regarding the period of supplementation with TANs, it was observed that the MEDMI decreased in the animals of studies that used experimental periods ranging from 90 to 180 days (SMD = −0.793; p = 0.002). However, when the supplementation period was shorter (less than 90 days), MEDMI was not affected (p > 0.05).
Regarding the age, animals younger than 12 months old showed lower DMI (SMD = −1.249; p < 0.05), while no differences were observed in DMI for animals older than 12 months (SMD = 0.104; p > 0.05). CPD was lower in animals younger than 12 months old (SMD = −1.090; p < 0.001), but animals older than 12 months old did not change (SMD = 0.201; p > 0.05). Ruminal pH was lower in animals older than 12 months old (SMD = −0.767; p < 0.05), while no differences were observed in ruminal pH for animals younger than 12 months old (SMD = 0.154; p > 0.05). Ruminal concentration of NH3-N decreased in animals younger than 12 months old (SMD = −0.745; p < 0.05), while there was no effect in animals older than 12 months old (SMD = −0.030; p > 0.05). The ruminal concentration of total VFA increased in animals older than 12 months old (SMD = 0.753; p = 0.01) but decreased in animals younger than 12 months old (SMD = −1.245; p < 0.001).

4. Discussion

The environmental sustainability of beef production is a significant concern within the food production system [49]. Current literature suggests that TANs can be supplemented to improve the sustainability of both dairy and beef cattle by reducing CH4 emissions and enhancing animal performance [1,25]. In ruminants, some studies suggest that dietary supplementation with TANs increases duodenal amino acid flux [11], reduces enteric CH4 production [7,10], and improves the rumen microbial activity [50]. Consequently, it was expected that beef cattle supplemented with TANs in the diet would have higher growth rate. However, the present meta-analysis showed that ADG and FBW were not affected by dietary supplementation with TANs. A positive relationship exists between improved productivity and both environmental and economic sustainability [49]. This suggests that TANs do not affect growth rate or environmental or economic sustainability in beef cattle. Nevertheless, these results should be interpreted carefully considering that both variables were subject to publication bias. Similar to our results, a meta-analysis conducted by Méndez-Ortiz et al. [51] showed that CTs’ intake did not affect significantly the weight gain of growing lambs.
There is considerable interest in improved feed efficiency as a means of augmenting the economic and environmental sustainability of beef production systems [52]. It has been reported that dietary inclusion of TANs reduces ruminal protein degradation, resulting in higher efficiency of nitrogen utilization [5,25]. On the other hand, enteric CH4 emissions represent losses of 2–12% of energy intake in ruminants [53]. In the present meta-analysis, the values observed for ruminal NH3-N concentration and CH4 emissions indicated a reduction in ruminal protein degradation and enteric CH4 emissions. This could be associated with higher efficiency of protein utilization and energy consumed. However, these effects did not modify the feed efficiency. This suggests that TANs do not affect either environmental or economic sustainability in beef cattle.
Some review articles have hypothesized that the presence of TANs in the diet may negatively affect feed intake in ruminants due to their astringent nature [5,54]. However, in the present meta-analysis, no changes in DM or nutrient intake were observed in response to dietary supplementation with TANs. Such absence probably occurred because the average dose of TANs used was 14.6 g/kg DM and the negative effects of TANs on the intake seem to occur with doses higher than 50 g/kg DM [6]. Similar to our results, two previously conducted meta-analyses reported that dietary supplementation with TANs at average concentrations of 46.3 and 9.5 g/kg DM did not affect significantly the feed intake of growing lambs and dairy cows in production, respectively [31,51]. These results together suggest that TANs can be used in beef cattle and other ruminants during their different productive stages without negative effects on feed intake.
With respect to total tract digestibility, dietary supplementation with TANs reduced the digestibility of DM and the dietary nutrients. Similar to our results, a meta-analysis conducted by Herremans et al. [31] reported that dietary supplementation with TANs at average doses of 9.5 g/kg DM reduced the digestibility of DM and dietary nutrients in dairy cows. However, in their study they observed that it does not affect the milk production and its composition. The rumen microbial activity and the endogenous digestive enzyme activity can be affected when large amounts of TANs are present in the diet [5], resulting in lower nutrient digestibility [6]. Additionally, the reduction and/or elimination of rumen protozoa leads to lower NDFD and ADFD [55]. In the present meta-analysis, the rumen protozoa were not significantly affected by dietary supplementation with TANs, although the population was reduced by 3.7 % (p = 0.06). This would partially explain the lower NDFD and ADFD observed in TANs-supplemented animals. In addition, it has been reported that TANs can have negative effects on fibrolytic bacteria in the rumen [56], which would also partly explain the lower NDFD and ADFD observed. On the other hand, the lower CPD observed in the response of dietary supplementation with TANs could be explained due to an excessive ruminal protection of TANs on the protein in the diets [5].
The type of TANs used only explained about 7% of the observed heterogeneity in nutrient digestibility, while the TANs’ dose explained between 25 and 69%. An analysis of subgroups revealed that DMD, OMD, and NDFD were affected only when the used dose exceeded 12 g/kg DM, but doses lower than 12 g/kg DM had no significant impact. These results confirm the hypothesis of Aboagye and Beauchemin [25], who suggested that the impact of TANs in ruminants depends on the dose of TANs in the diet rather than the type of TANs used.
Regarding the TANs’ source, it explained between 13 and 48% of the heterogeneity observed for CPD and NDFD. Although most of the TANs’ sources used by the studies included in our investigation reduced CPD, CPD improved when Leucaena leucocephala was used as TANs’ source. This result, together with the higher ruminal concentration of NH3-N observed in the studies using L. leucephala, suggests that TANs from this plant have low capacity for binding to rumen proteins, similar to what has been previously observed in CTs from other plants [57]. It is suggested that TANs with higher molecular weight have a greater capacity to bind to other molecules [21]. Although it has previously been reported that L. leucocephala contains CTs with higher molecular weight [58], it is suggested that the molecular weight of CTs is not the only factor influencing the binding capacity of TANs to the proteins.
Ruminants are inefficient animals for converting the ingested protein into animal product because a large part of this protein is lost as NH3-N in the rumen [54]. In the present meta-analysis, dietary supplementation with TANs reduced rumen NH3-N concentration, indicating a lower protein degradability in the rumen due to the presence of TANs. However, TANs did not influence ADG, FBW, or FE, probably because CPD also decreased in response to dietary supplementation with TANs. Consequently, the beef cattle seem not to better use the protein ingested even in the presence of TANs in the diet. Similar to our results, a meta-analysis by Herremans et al. [31] reported that dietary supplementation with TANs reduced NH3-N ruminal concentration in dairy cows. However, it did not improve the nitrogen utilization efficiency. Furthermore, a meta-analysis of 15 in vivo and 15 in vitro studies showed that NH3-N concentration decreased when increasing TANs’ levels in ruminant diets [59]. The free TANs can bind to the soluble protein in the diet and consequently reduce the NH3-N ruminal concentration [25]. This is to be expected and would partially explain the results observed in this and other studies. However, NH3-N ruminal concentration also appears to decrease when ruminal protozoa are reduced or eliminated [60]. Consequently, in our investigation, the lower NH3-N ruminal concentration could be associated with the 3.7% reduction observed in the rumen protozoan population.
Supplementation with TANs did not alter the ruminal concentration of total VFA. However, it did improve the concentrations of propionate and butyrate, but this last response variable was subject to publication bias, making it difficult to interpret. The absence of significant changes in ruminal concentration of total VFA can be considered desirable when it is accompanied by a reduction in enteric CH4 emissions [61], as observed in our meta-analysis. Similar to our results, Dai and Faciola [62] reported that dietary supplementation with TANs improved ruminal concentration of propionate and butyrate in large and small ruminants and also reduced CH4 production. Because there is a negative correlation between propionate and CH4 production due to the competition for hydrogen [63], the increase in ruminal concentration of propionate observed in our investigation could be associated with the reduction in enteric CH4 emissions observed in response to TANs’ supplementation.
The type, dose, and source of TANs explained between 6 and 34% of the sources of heterogeneity observed in the ruminal concentration of acetate, propionate, and total VFA. This confirms the hypothesis that the effects of TANs on ruminal fermentation may vary according to the source, dose, and type of TANs supplied in the diets [25]. The subgroup analysis revealed that the ruminal concentration of total VFA increased significantly when CTs were used. However, the ruminal concentration of total VFA only improved significantly when the CTs came from the quebracho tree. This could be related to differences in the molecular weight of the CTs contained in the different sources, since in vitro studies have shown that CTs with different molecular weight can act differently on rumen microbial populations [64,65].
Previous studies have reported that TANs from Leucaena leucocephala can reduce the rumen protozoan population [64,66]. However, the mechanisms of action through which these and other TANs act on rumen protozoa are still unknown [67]. Although, in our meta-analysis, the rumen protozoa decreased 3.7% in response to dietary supplementation with TANs, this effect was insignificant, perhaps because only 7.6% of the included studies used L. leucocephala as a source of TANs. Similar to our results, a meta-analysis conducted by Jayanegara et al. [59] reported that inclusion of TANs in ruminant diets did not affect counts of protozoa in rumen fluid under in vivo and in vitro conditions. Similarly, Dai and Faciola [62] also did not observe significant effects of dietary supplementation with TANs on the rumen protozoan population in small and large ruminants.
Enteric CH4 production represents approximately 43% of the greenhouse gases emitted in beef production worldwide [68]. To ensure sustainable livestock production, it is necessary to reduce enteric CH4 emissions [25]. It has been suggested that TANs can be used to minimize the environmental impact of ruminant production because they can improve ruminal fermentation and mitigate CH4 emissions [69]. Some studies have reported that TANs decrease rumen methanogenesis directly by reducing methanogenic bacteria populations [63,66,70]. However, often the effects of TANs on CH4 reduction are more indirect than direct [71]. For example, Fagundes et al. [23] reported that enteric CH4 emissions from beef cattle decreased in response to dietary supplementation with CTs. However, they attributed the CH4 reduction to a decrease in feed intake rather than to direct effects of CTs on rumen methanogenic archaea. In addition, some review articles have suggested that enteric CH4 production may vary depending on the type, dose, and source of TANs employed in the diet [14,25]. However, in our meta-analysis MEDMI was only affected by the source of TANs. This suggests that TANs could improve the environmental sustainability of beef production regardless of the type and dose of TANs used, similar to what has been previously observed in small ruminant production [15].
The period of supplementation with TANs could also contribute to the variability of its effects on methanogenesis [50]. One of the most important problems with the use of phytochemicals in ruminants is the adaptation of ruminal microorganisms to their effects after long periods of supplementation [72]. For example, some essential oils seem to be more effective in reducing CH4 production when used for short periods. However, they lose effectiveness over time [40]. In the present meta-analysis, the period of supplementation showed inconsistent effects on MEDMI. In short-term studies (less than 90 days), the reduction in MEDMI was small (SMD = −0.141) but increased (SMD = −0.791) in animals used in long-term studies (91 to 180 days). These results suggest that in beef cattle, ruminal microorganisms related to CH4 production are not able to adapt to the effects of TANs, even during long periods of supplementation. Similar results were previously reported by Salami et al. [56] in lambs supplemented with different sources of CTs (Castanea sativa and Caesalpinia spinosa) and HTs (Acacia negra and Uncaria gambir) during long periods. In their investigation, they observed that all TANs’ sources had specific antimicrobial activity against methanogenic bacteria and ruminal protozoa during the whole experimental phase.
Since the content and composition of TANs in plants are highly variable and can be affected by various factors, it has been suggested to use extracts to supply TANs to ruminant diets [25]. About 77% of the studies included in the present meta-analysis used TANs extracts. Nevertheless, the reduction of MEDMI was greater and less heterogeneous when animals were supplied with TANs-rich plants than when extracts were used.
Although most of the studies (34%) included in the present meta-analysis used TANs from quebracho tree, the subgroup analysis revealed that the MEDMI decreased significantly only in response to the use of Leucaena leucocephala and tannic acid as TANs’ sources. According to Huang et al. [58], L. leucocephala contains high-molecular-weight CTs, which varies between 2737 and 2872 Da. On the other hand, tannic acid, although it is a typical HT [5,73], has a molecular weight of 1701 Da [74], which is higher than the weight of 939 Da reported for quebracho tree CTs [75]. TANs with a high molecular weight act better than those with a low molecular weight in suppressing ruminal protozoa populations [64], which are correlated with CH4 emissions by the equation: methane (g/kg dry matter intake) = −30.7 + 8.14 × protozoa (log10 cells/mL) [76]. Consequently, the use of L. leucocephala, tannic acid, and other high-molecular-weight TANs’ sources could have a greater impact on reducing enteric CH4 emissions compared to other widely studied TANs (e.g., quebracho).
According to Nichols et al. [77], beef cattle production plays an important role in the N cycle as beef cattle excrete up to 80% of the consumed dietary N through urine and feces, and urinary N accounts for approximately 60–80% of the total N excretion [78]. In the present meta-analysis, no changes in NUE were observed in response to dietary supplementation with TANs. However, the observed values for UNE and FNE indicated a reduction in UNE and an increase in FNE, respectively. Similar to our results, a meta-analysis conducted by Herremans et al. [31] reported that dietary supplementation with TANs reduced UNE (−11%) and increased FNE (+10%) without affecting NUE in dairy cows. According to Singh et al. [79], the excreted N might be lost through nitrate ( NO 3 ) leaching, emissions of N2O, and emissions from ammonia volatilization. Compared with feces, urine could rapidly supply available mineral N for nitrification and denitrification through hydrolysis of urea, leading to higher N2O emissions [80], which has a global warming potential over a 100-year period of 298 times greater than that of carbon dioxide [2]. Therefore, strategies based on changing the composition and concentration of urinary compounds by diet manipulation could be considered potential options to mitigate N2O emissions from urine [4]. Consequently, the shift from urinary to fecal N observed in this study may be beneficial for environment preservation, as urinary N induces more harmful emissions than fecal N.

5. Conclusions

One of the most significant findings to emerge from this study is that the environmental impact of beef production systems can be markedly reduced when tannins are included in the diet. The results of the present meta-analysis indicate that TANs reduce enteric CH4 emissions in beef cattle, particularly when they are supplied naturally as ingredients in the diet, when they are supplemented for long periods, or when Leucaena leucocephala and tannic acid are used as sources of these secondary metabolites. In addition, the shift from urinary to fecal N observed in this study may be beneficial for environment preservation, as urinary N induces more harmful emissions than fecal N. Therefore, the addition of tannins in the diet of beef cattle could be used as a sustainable natural alternative to reduce the environmental impact of beef production without affecting the economic sustainability. However, several issues need to be addressed before specific recommendations for commercial use of TANs to reduce environmental impact.
Our meta-analysis demonstrates that TANs’ supplementation does not affect weight gain, feed intake, or feed efficiency in beef cattle, but reduces diet digestibility at doses above 12 g/kg DM. In addition, TANs’ supplementation improves ruminal fermentation characteristics by reducing ruminal NH3-N concentration and increasing rumen propionate and butyrate concentration. The best result in ruminal propionate and NH3-N concentration is achieved using TANs from pistachio and HTs, respectively.

Supplementary Materials

The following are available online at https://www.mdpi.com/article/10.3390/su13137410/s1. Figure S1: Flow chart of paper selection process. Figure S2: (a) Funnel plot of the effect of dietary supplementation with tannins (TANs) on average daily gain (ADG); (b) funnel plot of the effect of dietary supplementation with TANs on ADG obtained using the trim-and-fill method of Duval and Tweedie. Figure S3: (a) Funnel plot of the effect of dietary supplementation with tannins (TANs) on final body weight (FBW); (b) funnel plot of dietary supplementation with TANs on FBW obtained using the trim-and-fill method of Duval and Tweedie. Figure S4: (a) Funnel plot of the effect of dietary tannins’ supplementation (TANs) on organic matter intake (OMI); (b) funnel plot of the effect of dietary supplementation with TANs on OMI obtained using the trim-and-fill method of Duval and Tweedie. Figure S5: (a) Funnel plot of the effect of dietary supplementation with tannins (TANs) on neutral detergent fiber intake (NDFI); (b) funnel plot of the effect of dietary supplementation with TANs on NDFI obtained using the trim-and-fill method of Duval and Tweedie. Figure S6: (a) Funnel plot of the effect of dietary supplementation with tannins (TANs) on rumen butyrate concentration; (b) funnel plot of the effect of dietary supplementation with TANs on the ruminal concentration of butyrate obtained using the trim-and-fill method of Duval and Tweedie. Figure S7: Forest plot of effect size or standardized mean difference and 95% confidence interval of tannins type on neutral detergent fiber digestibility (NDFD) in beef cattle. Figure S8: Forest plot of effect size or standardized mean difference and 95% confidence interval of tannins type on ruminal ammonia nitrogen (NH3-N) concentration in beef cattle. Figure S9: Forest plot of effect size or standardized mean difference and 95% confidence interval of the chemical or botanical source of tannins on ruminal ammonia nitrogen (NH3-N) concentration in beef cattle. Figure S10: Forest plot of effect size or standardized mean difference and 95% confidence interval of tannins’ inclusion method on crude protein digestibility (CPD) in beef cattle.

Author Contributions

Conceptualization, J.F.O.-O., G.D.-I. and A.L.-B.; methodology and data curation, J.F.O.-O., G.D.-I. and G.D.M.-M.; investigation and formal analysis, J.F.O.-O., L.A.M.-R. and P.A.H.-G.; writing—original draft preparation, J.F.O.-O.; writing—review and editing, J.F.O.-O., G.D.-I., A.L.-B., G.D.M.-M., L.A.M.-R. and P.A.H.-G.; supervision and project administration, A.L.-B. All authors have read and agreed to the published version of the manuscript.

Funding

This research received no external funding.

Institutional Review Board Statement

Not applicable.

Informed Consent Statement

Not applicable.

Data Availability Statement

The data sets used and analyzed during the current study are available from the corresponding author on reasonable request.

Acknowledgments

The first author, José Felipe Orzuna, is a Master of Science student of the Program of Animal Production of the Universidad Autonoma Chapingo and thanks the CONACyT Program for the scholarship.

Conflicts of Interest

All other authors declare no conflicts of interest.

Appendix A

Table A1. Summary of the studies included in the meta-analysis.
AuthorCountryTannin SourceTannin TypeMethod of Inclusion
Aboagye et al. [17]CanadaCH, CH, BL, BLHT, HT, BL, BLE, E, E, E
Aboagye et al. [21]CanadaTA, CHHT, HTE, E
Ávila et al. [81]BrazilAM, AMCT, CTE, E
Avila et al. [20]BrazilAM, AM, AMCT, CT, CTE, E, E
Caetano et al. [82]AustraliaGrapeCTNAT
Dickhoefer et al. [83]GermanyQU, QU, QU, QUBL, BL, BL, BLE, E, E, E
Ebert et al. [84]USQU (n = 10)CT (n = 10)E (n = 10)
Jolazadeh et al. [85]IranPIST, PIST, PISTBL, BL, BLE, E, E
Koenig and Beauchemin [86]CanadaAMCTE
Koenig et al. [87]CanadaAM, AM, AM, AMCT, CT, CT, CTE, E, E, E
Krueger et al. [88]USCH, AMHT, CTE, E
Martello et al. [89]BrazilBL, BLBL, BLE, E
Mezzomo et al. [90]BrazilQU, QUCT, CTE, E
Mezzomo et al. [91]BrazilBL, BL, BLBL, BL, BLE, E, E
Norris et al. [22]USQU, QU, QUCT, CT, CTE, E, E
Norris et al. [92]USQU, QU, QUCT, CT, CTE, E, E
Orlandi et al. [11]BrazilAM, AM, AMBL, BL, BLE, E, E
Piñeiro-Vázquez et al. [19]MexicoQU, QU, QU, QUCT, CT, CT, CTE, E, E, E
Piñeiro-Vázquez et al. [93]MexicoLEU, LEU, LEU, LEUCT, CT, CT, CTN, N, N, N
Piñeiro-Vázquez et al. [94]MexicoQU, QU, QU, QUCT, CT, CT, CTE, E, E, E
Piñeiro-Vázquez et al. [95]MexicoLEU, LEU, LEU, LEUCT, CT, CT, CTN, N, N, N
Poblete et al. [96]PhilippinesAM, AMBL, BLE, E
Rivera-Méndez et al. [97]MexicoQU, QUCT, CTE, E
Rivera-Méndez et al. [18]MexicoQU (n = 4), CH, BLCT (n = 4), HT, BLE, E, E, E, E, E
Shakeri et al. [98]IranPIST, PIST, PISTBL, BL, BLN, N, N
Shakeri et al. [99]IranPIST (n = 9)BL (n = 9)N (n = 9)
Suybeng et al. [24]AustraliaBL, BL, BLCT, CT, CTN, N, N
Tabke et al. [100]USTA, TAHT, HTE, E
Tseu et al. [101]BrazilAM, AM, AMBL, BL, BLE, E, E
Yang et al. [73]ChinaTA, TA, TAHT, HT, HTE, E, E
Yuste et al. [102]SpainBLBLE
Zhou et al. [103]ChinaTA, TAHT, HTE, E
CH: chestnut (Castanea sativa); BL: blend; TA: tannic acid; AM: Acacia mearnsii; QU: quebracho (Schinopsis spp.); PIST: pistachio (Pistacia vera); LEU: Leucaena leucocephala; n: number of comparisons; HT: hydrolysable tannin; CT: condensed tannin; E: extract; N: naturally present.

References

  1. Min, B.R.; Solaiman, S.; Waldrip, H.M.; Parker, D.; Todd, R.W.; Brauer, D. Dietary mitigation of enteric methane emissions from ruminants: A review of plant tannin mitigation options. Anim. Nutr. 2020. [Google Scholar] [CrossRef] [PubMed]
  2. Nunes, S.M.; Bayer, C.; Lassalas, M.; Michelon, G.M.; Schaitz, L.H.; Biasolo, R.; Civiero, M.; Mendonça, H.; Ribeiro-Filho, N. Effects of ground corn and Acacia mearnsii tannin extract supplementation on nitrogen excretion and nitrous oxide emissions from sheep. Livest. Sci. 2021, 246, 104458. [Google Scholar] [CrossRef]
  3. Batista, E.D.; Detmann, E.; Valadares, F.S.C.; Titgemeyer, E.C.; Valadares, R.F.D. The effect of CP concentration in the diet on urea kinetics and microbial usage of recycled urea in cattle: A meta-analysis. Animal 2014, 11, 1303–1311. [Google Scholar] [CrossRef] [PubMed]
  4. Gardiner, C.A.; Clough, T.J.; Cameron, K.C.; Di, H.J.; Edwards, G.R.; de Klein, C.A.M. Potential for forage diet manipulation in New Zealand pasture ecosystems to mitigate ruminant urine derived N2O emissions: A review. N. Z. J. Agric. Res. 2016, 59, 301–317. [Google Scholar] [CrossRef]
  5. Huang, Q.; Liu, X.; Zhao, G.; Hu, T.; Wang, Y. Potential and challenges of tannins as an alternative to in-feed antibiotics for farm animal production. Anim. Nutr. 2018, 4, 137–150. [Google Scholar] [CrossRef]
  6. Naumann, H.D.; Tedeschi, L.O.; Zeller, W.E.; Huntley, N.F. The role of condensed tannins in ruminant animal production: Advances, limitations and future directions. Rev. Bras. Zootec. 2017, 46, 929–949. [Google Scholar] [CrossRef] [Green Version]
  7. Adejoro, F.A.; Hassen, A.; Akanmu, A.M. Effect of Lipid-Encapsulated Acacia Tannin Extract on Feed Intake, Nutrient Digestibility and Methane Emission in Sheep. Animals 2019, 9, 863. [Google Scholar] [CrossRef] [Green Version]
  8. Seoni, E.; Rothacher, M.; Arrigo, Y.; Ampuero Kragten, S.; Bee, G.; Dohme-Meier, F. The Fate of Tannins from Birdsfoot Trefoil and Their Effect on the Nitrogen Balance in Growing Lambs Fed Diets Varying in Protein Level. Animals 2021, 11, 190. [Google Scholar] [CrossRef]
  9. Zhang, J.; Xu, X.; Cao, Z.; Wang, Y.; Yang, H.; Azarfar, A.; Li, S. Effect of Different Tannin Sources on Nutrient Intake, Digestibility, Performance, Nitrogen Utilization, and Blood Parameters in Dairy Cows. Animals 2019, 9, 507. [Google Scholar] [CrossRef] [Green Version]
  10. Fagundes, G.M.; Benetel, G.; Santos, K.C.; Welter, K.C.; Melo, F.A.; Muir, J.P.; Bueno, I.C.S. Tannin-Rich Plants as Natural Manipulators of Rumen Fermentation in the Livestock Industry. Molecules 2020, 25, 2943. [Google Scholar] [CrossRef]
  11. Orlandi, T.; Kozloski, G.V.; Alves, T.P.; Mesquita, F.R.; Ávila, S.C. Digestibility, ruminal fermentation and duodenal flux of amino acids in steers fed grass forage plus concentrate containing increasing levels of Acacia mearnsii tannin extract. Anim. Feed Sci. Technol. 2015, 210, 37–45. [Google Scholar] [CrossRef]
  12. Sarnataro, C.; Spanghero, M. In vitro rumen fermentation of feed substrates added with chestnut tannins or an extract from Stevia rebaudiana Bertoni. Anim. Nutr. 2020, 6, 54–60. [Google Scholar] [CrossRef]
  13. Santos, J.D.C.d.; Saraiva, E.P.; Gonzaga Neto, S.; Saraiva, C.A.S.; Pinheiro, A.d.C.; Fonsêca, V.d.F.C.; Santos, S.G.C.G.d.; Souza, C.G.d.; Almeida, M.E.V.; Veríssimo, T.N.S.; et al. Feeding Behavior of Lactating Dairy Cattle Fed Sorghum-Based Diets and Increasing Levels of Tannic Acid. Agriculture 2021, 11, 172. [Google Scholar] [CrossRef]
  14. Verma, S.; Taube, F.; Malisch, C.S. Examining the Variables Leading to Apparent Incongruity between Antimethanogenic Potential of Tannins and Their Observed Effects in Ruminants—A Review. Sustainability 2021, 13, 2743. [Google Scholar] [CrossRef]
  15. Waghorn, G. Beneficial and detrimental effects of dietary condensed tannins for sustainable sheep and goat production-Progress and challenges. Anim. Feed Sci. Technol. 2008, 147, 116–139. [Google Scholar] [CrossRef]
  16. Adejoro, F.A.; Hassen, A.; Akanmu, A.M.; Morgavi, D.P. Replacing urea with nitrate as a non-protein nitrogen source increases lambs’ growth and reduces methane production, whereas acacia tannin has no effect. Anim. Feed Sci. Technol. 2020, 259, 114360. [Google Scholar] [CrossRef]
  17. Aboagye, I.A.; Oba, M.; Castillo, A.R.; Koenig, K.M.; Iwaasa, A.D.; Beauchemin, K.A. Effects of hydrolysable tannin with or without condensed tannin on methane emissions, nitrogen use, and performance of beef cattle fed a high forage diet. J. Anim. Sci. 2018, 96, 5276–5286. [Google Scholar] [CrossRef]
  18. Rivera-Mendez, C.; Plascencia, A.; Torrentera, N.; Zinn, R.A. Effect of level and source of supplemental tannin on growth performance of steers during the late finishing phase. J. Appl. Anim. Res. 2017, 45, 199–203. [Google Scholar] [CrossRef] [Green Version]
  19. Piñeiro-Vázquez, A.T.; Canul-Solis, J.R.; Alayón-Gamboa, J.A.; Chay-Canul, A.J.; Ayala-Burgos, A.J.; Solorio-Sánchez, F.J.; Aguilar-Pérez, C.F.; Ku-Vera, J.C. Energy utilization, nitrogen balance and microbial protein supply in cattle fed Pennisetum purpureum and condensed tannins. J. Anim. Physiol. Anim. Nutr. 2017, 101, 159–169. [Google Scholar] [CrossRef]
  20. Avila, A.S.; Zambom, M.A.; Faccenda, A.; Fischer, M.L.; Anschau, F.A.; Venturini, T.; Tinini, R.C.R.; Dessbesell, J.G.; Faciola, A.P. Effects of black wattle (Acacia mearnsii) condensed tannins on intake, protozoa population, ruminal fermentation, and nutrient digestibility in Jersey steers. Animals 2020, 10, 1011. [Google Scholar] [CrossRef]
  21. Aboagye, I.A.; Oba, M.; Koenig, K.M.; Zhao, G.Y.; Beauchemin, K.A. Use of gallic acid and hydrolysable tannins to reduce methane emission and nitrogen excretion in beef cattle fed a diet containing alfalfa silage. J. Anim. Sci. 2019, 97, 2230–2244. [Google Scholar] [CrossRef] [PubMed] [Green Version]
  22. Norris, A.B.; Tedeschi, L.O.; Foster, J.L.; Muir, J.P.; Pinchak, W.E.; Fonseca, M.A. AFST: Influence of quebracho tannin extract fed at differing rates within a high-roughage diet on the apparent digestibility of dry matter and fiber, nitrogen balance and fecal gas flux. Anim. Feed Sci. Technol. 2020, 260, 114365. [Google Scholar] [CrossRef]
  23. Fagundes, G.M.; Benetel, G.; Welter, K.C.; Melo, F.A.; Muir, J.P.; Carriero, M.M.; Souza, R.L.M.; Meo-Filho, P.; Frighetto, R.T.S.; Berndt, A.; et al. Tannin as a natural rumen modifier to control methanogenesis in beef cattle in tropical systems: Friend or foe to biogas energy production? Res. Vet. Sci. 2020, 132, 82–93. [Google Scholar] [CrossRef] [PubMed]
  24. Suybeng, B.; Charmley, E.; Gardiner, C.P.; Malau-Aduli, B.S.; Malau-Aduli, A.E.O. Supplementing northern Australian beef cattle with Desmanthus tropical legume reduces in-vivo methane emissions. Animals 2020, 10, 2097. [Google Scholar] [CrossRef]
  25. Aboagye, I.A.; Beauchemin, K.A. Potential of Molecular Weight and Structure of Tannins to Reduce Methane Emissions from Ruminants: A review. Animals 2019, 9, 856. [Google Scholar] [CrossRef] [Green Version]
  26. Zangeneh, M.; Banaeian, N.; Clark, S. Meta-Analysis on Energy-Use Patterns of Cropping Systems in Iran. Sustainability 2021, 13, 3868. [Google Scholar] [CrossRef]
  27. Borenstein, M.; Hedges, L.V.; Higgins, J.P.T.; Rothstein, H.R. Introduction to Meta-Analysis, 1st ed.; John Wiley and Sons, Ltd.: Chichester, UK, 2009; p. 413. [Google Scholar]
  28. Doré, T.; Makowski, D.; Malézieux, E.; Munier-Jolain, N.; Tchamitchian, M.; Tittonell, P. Facing up to the paradigm of ecological intensification in agronomy: Revisiting methods, concepts and knowledge. Eur. J. Agron. 2011, 34, 197–210. [Google Scholar] [CrossRef]
  29. Higgins, J.P.T.; Thompson, S.G.; Deeks, J.J.; Altman, D.G. Measuring inconsistency in meta-analysis. BMJ 2003, 327, 557–560. [Google Scholar] [CrossRef] [Green Version]
  30. Abhijith, A.; Dunshea, F.R.; Warner, R.D.; Leury, B.J.; Ha, M.; Chauhan, S.S. A Meta-Analysis of the Effectiveness of High, Medium, and Low Voltage Electrical Stimulation on the Meat Quality of Small Ruminants. Foods 2020, 9, 1587. [Google Scholar] [CrossRef]
  31. Herremans, S.; Vanwindekens, F.; Decruyenaere, V.; Beckers, Y.; Froidmont, E. Effect of dietary tannins on milk yield and composition, nitrogen partitioning and nitrogen use efficiency of lactating dairy cows: A meta-analysis. J. Anim. Physiol. Anim. Nutr. 2020, 104, 1209–1218. [Google Scholar] [CrossRef]
  32. Lean, I.J.; Thompson, J.M.; Dunshea, F.R. A Meta-Analysis of Zilpaterol and Ractopamine Effects on Feedlot Performance, Carcass Traits and Shear Strength of Meat in Cattle. PLoS ONE 2014, 9, e115904. [Google Scholar] [CrossRef]
  33. Higgins, J.; Thomas, J. Cochrane Handbook for Systematic Reviews of Interventions, 2nd ed.; John Wiley and Sons, Ltd.: Chichester, UK, 2019; pp. 143–176. [Google Scholar]
  34. Wallace, B.C.; Lajeunesse, M.J.; Dietz, G.; Dahabreh, I.J.; Trikalinos, T.A.; Schmid, C.H.; Gurevitch, J. OpenMEE: Intuitive, open-source software for metaanalysis in ecology and evolutionary biology. Methods Ecol. Evol. 2016, 8, 941–947. [Google Scholar] [CrossRef] [Green Version]
  35. Viechtbauer, W. Conducting meta-analysis in R with the metaphor package. J. Stat. Softw. 2010, 36, 1–48. [Google Scholar] [CrossRef] [Green Version]
  36. Hedges, L.V. Distribution theory for Glass´s estimator of effect size and related estimators. J. Educ. Stat. 1981, 6, 107–128. [Google Scholar] [CrossRef]
  37. DerSimonian, R.; Laird, N. Meta-analysis in clinical trials. Control. Clin. Trials 1986, 7, 177–188. [Google Scholar] [CrossRef]
  38. Lean, I.J.; Rabiee, A.R.; Duffield, T.F.; Dohoo, I.R. Invited review: Use of meta-analysis in animal health and reproduction: Methods and applications. J. Dairy Sci. 2009, 92, 3545–3565. [Google Scholar] [CrossRef] [Green Version]
  39. SAS (Statistical Analysis System). SAS/STAT User’s Guide (Release 6.4); SAS Institute: Cary, NC, USA, 2017. [Google Scholar]
  40. Torres, R.N.S.; Moura, D.C.; Ghedini, C.P.; Ezequiel, J.M.B.; Almeida, M.T.C. Meta-analysis of the effects of essential oils on ruminal fermentation and performance of sheep. Small Rumin. Res. 2020, 189. [Google Scholar] [CrossRef]
  41. Higgins, J.P.T.; Thompson, S.G. Quantifying heterogeneity in a meta-analysis. Stat. Med. 2002, 21, 1539–1558. [Google Scholar] [CrossRef]
  42. Egger, M.; Smith, G.D.; Altman, D.G. Systematic Reviews in Health Care, 2nd ed.; MBJ Publishing Group: London, UK, 2001; pp. 109–121. [Google Scholar]
  43. Littell, J.H.; Corcoran, J.; Pillai, V. Systematic Reviews and Meta-Analysis, 1st ed.; Oxford University Press: Oxford, UK, 2008; pp. 111–132. [Google Scholar]
  44. Sterne, J.A.C.; Harbord, R.M. Funnel plots in meta-analysis. Stata J. 2004, 4, 127–141. [Google Scholar] [CrossRef] [Green Version]
  45. Egger, M.; Smith, G.D.; Schneider, M.; Minder, C. Bias in meta-analysis detected by a simple, graphical test. BMJ 1997, 315, 629–634. [Google Scholar] [CrossRef] [Green Version]
  46. Begg, C.B.; Mazumdar, M. Operating Characteristics of a Rank Correlation Test for Publication Bias. Biometrics 1994, 50, 1088–1101. [Google Scholar] [CrossRef]
  47. Ioannidis, J.P.A.; Trikalinos, T.A. The appropriateness of asymmetry tests for publication bias in meta-analyses: A large survey. CMAJ 2007, 176, 1091–1096. [Google Scholar] [CrossRef] [PubMed] [Green Version]
  48. Duval, S.; Tweedie, R. A nonparametric “trim and fill” method of accounting for publication bias in meta-analysis. J. Amer. Statist. Assoc. 2000, 95, 89–98. [Google Scholar] [CrossRef]
  49. Capper, J.L.; Hayes, D.J. The environmental and economic impact of removing growth-enhancing technologies from U.S. beef production. J. Anim. Sci. 2012, 90, 3527–3537. [Google Scholar] [CrossRef] [Green Version]
  50. Hassan, F.; Arshad, M.A.; Ebeid, H.M.; Rehman, M.S.; Khan, M.S.; Shahid, S.; Yang, C. Phytogenic Additives Can Modulate Rumen Microbiome to Mediate Fermentation Kinetics and Methanogenesis Through Exploiting Diet–Microbe Interaction. Front. Vet. Sci. 2020, 7, 575801. [Google Scholar] [CrossRef]
  51. Mendez-Ortiz, F.A.; Sandoval-Castro, C.A.; Ventura-Cordero, J.; Sarmiento-Franco, L.A.; Torres-Acosta, J.F.J. Condensed tannin intake and sheep performance: A meta-analysis on voluntary intake and live weight change. Anim. Feed Sci. Technol. 2018, 245, 67–76. [Google Scholar] [CrossRef]
  52. Kenny, D.; Fitzsimons, C.; Waters, S.; McGee, M. Invited review: Improving feed efficiency of beef cattle–the current state of the art and future challenges. Animal 2018, 12, 1815–1826. [Google Scholar] [CrossRef] [Green Version]
  53. Johnson, K.A.; Johnson, D.E. Methane emissions from cattle. J. Anim. Sci. 1995, 73, 2483–2492. [Google Scholar] [CrossRef]
  54. Tedeschi, L.O.; Muir, J.P.; Naumann, H.D.; Norris, A.B.; Ramírez-Restrepo, C.A.; Mertens-Talcott, S.U. Nutritional Aspects of Ecologically Relevant Phytochemicals in Ruminant Production. Front. Vet. Sci. 2021, 8, 628445. [Google Scholar] [CrossRef]
  55. Li, Z.; Deng, Q.; Liu, Y.; Yan, T.; Li, F.; Cao, Y.; Yao, J. Dynamics of methanogenesis, ruminal fermentation and fiber digestibility in ruminants following elimination of protozoa: A meta-analysis. J. Anim. Sci. Biotech. 2018, 9, 89. [Google Scholar] [CrossRef] [Green Version]
  56. Salami, S.A.; Valenti, B.; Bella, M.; O’Grady, M.N.; Luciano, G.; Kerry, J.P.; Jones, E.; Priolo, A.; Newbold, C.J. Characterisation of the ruminal fermentation and microbiome in lambs supplemented with hydrolysable and condensed tannins. FEMS Microbiol. Ecol. 2018, 94. [Google Scholar] [CrossRef]
  57. Jayanegara, A.; Goel, G.; Makkar, H.P.; Becker, K. Divergence between Purified Hydrolysable and Condensed Tannin Effects on Methane Emission, Rumen Fermentation and Microbial Population in vitro. Anim. Feed Sci. Technol. 2015, 209, 60–68. [Google Scholar] [CrossRef]
  58. Huang, X.D.; Liang, J.B.; Tan, H.Y.; Yahya, R.; Khamseekhiew, B.; Ho, Y.W. Molecular weight and protein binding affinity of Leucaena condensed tannins and their effects on in vitro fermentation parameters. Anim. Feed Sci. Technol. 2010, 159, 81–87. [Google Scholar] [CrossRef]
  59. Jayanegara, A.; Leiber, F.; Kreuzer, M. Meta-analysis of the relationship between dietary tannin level and methane formation in ruminants from in vivo and in vitro experiments. J. Anim. Physiol. Anim. Nutr. 2012, 96, 365–375. [Google Scholar] [CrossRef]
  60. Jouany, J.P. Effect of rumen protozoa on nitrogen utilization by ruminants. J. Nutr. 1996, 126, 1335S–1346S. [Google Scholar] [CrossRef] [Green Version]
  61. Belanche, A.; Newbold, C.J.; Morgavi, D.P.; Bach, A.; Zweifel, B.; Yáñez-Ruiz, D.R. A meta-analysis describing the effects of the essential oils blend agolin ruminant on performance, rumen fermentation and methane emissions in dairy cows. Animals 2020, 10, 620. [Google Scholar] [CrossRef] [Green Version]
  62. Dai, X.; Faciola, A.P. Evaluating strategies to reduce ruminal protozoa and their impacts on nutrient utilization and animal performance in ruminants—A meta-analysis. Front Microbiol. 2019, 10, 2648. [Google Scholar] [CrossRef] [Green Version]
  63. Bhatta, R.; Uyeno, Y.; Tajima, K.; Takenaka, A.; Yabumoto, Y.; Nonaka, I.; Enishi, O.; Kurihara, M. Difference in the Nature of Tannins on in vitro Ruminal Methane and Volatile Fatty Acid Production and on Methanogenic Archaea and Protozoal Populations. J. Dairy Sci. 2009, 92, 5512–5522. [Google Scholar] [CrossRef] [Green Version]
  64. Saminathan, M.; Gan, H.M.; Abdullah, N.; Wong, C.M.V.L.; Ramiah, S.K.; Tan, H.Y.; Sieo, C.C.; Ho, Y.W. Changes in rumen protozoal community by condensed tannin fractions of different molecular weights from a Leucaena leucocephala hybrid in vitro. J. Appl. Microbiol. 2017, 123, 41–53. [Google Scholar] [CrossRef]
  65. Saminathan, M.; Ramiah, K.S.; Gan, H.M.; Abdullah, N.; Wong, C.M.V.L.; Ho, Y.W.; Idrus, Z. In vitro study on the effects of condensed tannins of different molecular weights on bovine rumen fungal population and diversity. Ital. J. Anim. Sci. 2019, 18, 1451–1462. [Google Scholar] [CrossRef] [Green Version]
  66. Tan, H.Y.; Sieo, C.C.; Abdullah, N.; Liang, J.B.; Huang, X.D.; Ho, Y.W. Effects of condensed tannins from Leucaena on methane production, rumen fermentation and populations of methanogens and protozoa in vitro. Anim. Feed Sci. Technol. 2011, 169, 185–193. [Google Scholar] [CrossRef]
  67. Patra, A.K.; Saxena, J. Exploitation of dietary tannins to improve rumen metabolism and ruminant nutrition. J. Sci. Food Agric. 2011, 91, 24–37. [Google Scholar] [CrossRef]
  68. Gerber, P.J.; Steinfeld, H.; Henderson, B.; Mottet, A.; Opio, C.; Dijkman, J.; Falcucci, A.; Tempio, G. Tackling Climate Change through Livestock: A Global Assessment of Emissions and Mitigation Opportunities; FAO: Rome, Italy, 2013. [Google Scholar]
  69. Ugbogu, E.A.; Elghandour, M.M.M.Y.; Ikpeazu, V.O.; Buendía, G.R.; Molina, O.M.; Arunsi, U.O.; Emmanuel, O.; Salem, A.Z.M. The potential impacts of dietary plant natural products on the sustainable mitigation of methane emission from livestock farming. J. Clean. Prod. 2019, 213, 915–925. [Google Scholar] [CrossRef]
  70. Saminathan, M.; Sieo, C.C.; Gan, H.M.; Abdullah, N.; Wong, C.M.V.L.; Ho, Y.W. Effects of condensed tannin fractions of different molecular weights on population and diversity of bovine rumen methanogenic archaea in vitro, as determined by high-throughput sequencing. Anim. Feed Sci. Technol. 2016, 216, 146–160. [Google Scholar] [CrossRef]
  71. Ku-Vera, J.C.; Jiménez-Ocampo, R.; Valencia-Salazar, S.S.; Montoya-Flores, M.D.; Molina-Botero, I.C.; Arango, J.; Gómez-Bravo, C.A.; Aguilar-Pérez, C.F.; Solorio-Sánchez, F.J. Role of Secondary Plant Metabolites on Enteric Methane Mitigation in Ruminants. Front. Vet. Sci. 2020, 7, 584. [Google Scholar] [CrossRef]
  72. Kholif, A.E.; Olafadehan, O.A. Essential oils and phytogenic feed additives in ruminant diet: Chemistry, ruminal microbiota and fermentation, feed utilization and productive performance. Phytochem. Rev. 2021. [Google Scholar] [CrossRef]
  73. Yang, K.; Wei, C.; Zhao, G.Y.; Xu, Z.W.; Lin, S.X. Effects of dietary supplementing tannic acid in the ration of beef cattle on rumen fermentation, methane emission, microbial flora and nutrient digestibility. J. Anim. Physiol. Anim. Nutr. 2016, 101, 302–310. [Google Scholar] [CrossRef]
  74. Kardel, M.; Taube, F.; Schulz, H.; Schütze, W.; Gierus, M. Di_erent approaches to evaluate tannin content and structure of selected plant extracts–review and new aspects. J. Appl. Bot. Food Qual. 2013, 86, 154–166. [Google Scholar] [CrossRef]
  75. Venter, P.B.; Sisa, M.; Van Der Merwe, M.J.; Bonnet, S.L.; Van Der Westhuizen, J.H. Analysis of commercial proanthocyanidins. Part 1: The chemical composition of quebracho (Schinopsis lorentzii and Schinopsis balansae) heartwood extract. Phytochemistry 2012, 73, 95–105. [Google Scholar] [CrossRef]
  76. Guyader, J.; Eugène, M.; Nozière, P.; Morgavi, D.P.; Doreau, M.; Martin, C. Influence of rumen protozoa on methane emission in ruminants: A meta-analysis approach. Animal 2014, 8, 1816–1825. [Google Scholar] [CrossRef]
  77. Nichols, K.L.; Del Grosso, S.J.; Derner, J.D.; Follett, R.F.; Archibeque, S.L.; Stewart, C.E.; Paustian, K.H. Nitrous oxide and methane fluxes from cattle excrement on C3 pasture and C4-dominated shortgrass steppe. Agric. Ecosyst. Environ. 2016, 225, 104–115. [Google Scholar] [CrossRef] [Green Version]
  78. Erickson, G.; Klopfenstein, T. Nutritional and management methods to decrease nitrogen losses from beef feedlots. J. Anim. Sci. 2010, 88, E172–E180. [Google Scholar] [CrossRef] [Green Version]
  79. Singh, B.P.; Cowie, A.L.; Chan, K.Y. Soil Health and Climate Change, 1st ed.; Springer: Berlin, Germany, 2011; p. 403. [Google Scholar]
  80. Wecking, A.R.; Wall, A.M.; Liáng, L.L.; Lindsey, S.B.; Luo, J.; Campbell, D.I.; Schipper, L.A. Reconciling annual nitrous oxide emissions of an intensively grazed dairy pasture determined by eddy covariance and emission factors. Agric. Ecosyst. Environ. 2020, 287, 106646. [Google Scholar] [CrossRef]
  81. Avila, S.C.; Kozloski, G.V.; Orlandi, T.; Mezzomo, M.P.; Stefanello, S. Impact of a tannin extract on digestibility, ruminal fermentation and duodenal flow of amino acids in steers fed maize silage and concentrate containing soybean meal or canola meal as protein source. J. Agric. Sci. 2015, 153, 943–953. [Google Scholar] [CrossRef]
  82. Caetano, M.; Wilkes, M.J.; Pitchford, W.S.; Lee, S.J.; Hynd, P.I. Effect of ensiled crimped grape marc on energy intake, performance and gas emissions of beef cattle. Anim. Feed Sci. Technol. 2019, 247, 166–172. [Google Scholar] [CrossRef]
  83. Dickhoefer, U.; Ahnert, S.; Susenbeth, A. Effects of quebracho tannin extract on rumen fermentation and yield and composition of microbial mass in heifers. J. Anim. Sci. 2016, 94, 1561–1575. [Google Scholar] [CrossRef] [Green Version]
  84. Ebert, P.J.; Bailey, E.A.; Shreck, A.L.; Jennings, J.S.; Cole, N.A. Effect of condensed tannin extract supplementation on growth performance, nitrogen balance, gas emissions, and energetic losses of beef steers. J. Anim. Sci. 2017, 95, 1345–1355. [Google Scholar] [CrossRef]
  85. Jolazadeh, A.; Dehghan-Banadaky, M.; Rezayazdi, K. Effects of soybean meal treated with tannins extracted from pistachio hulls on performance, ruminal fermentation, blood metabolites and nutrient digestion of Holstein bulls. Anim. Feed Sci. Technol. 2015, 203, 33–40. [Google Scholar] [CrossRef]
  86. Koenig, K.M.; Beauchemin, K.A. Effect of feeding condensed tannins in high protein finishing diets containing corn distillers’ grains on ruminal fermentation, nutrient digestibility, and route of nitrogen excretion in beef cattle. J. Anim. Sci. 2018, 96, 4398–4413. [Google Scholar] [CrossRef] [PubMed] [Green Version]
  87. Koenig, K.M.; Beauchemin, K.A.; McGinn, S.M. Feeding condensed tannins to mitigate ammonia emissions from beef feedlot cattle fed high-protein finishing diets containing distillers grains. J. Anim. Sci. 2018, 96, 4414–4430. [Google Scholar] [CrossRef] [PubMed] [Green Version]
  88. Krueger, W.K.; Gutierrez-Bañuelos, H.; Carstens, G.E.; Min, B.R.; Pinchak, W.E.; Gomez, R.R.; Anderson, R.C.; Krueger, N.A.; Forbes, T.D.A. Effects of dietary tannin source on performance, feed efficiency, ruminal fermentation, and carcass and non-carcass traits in steers fed a high-grain diet. Anim. Feed Sci. Technol. 2010, 159, 1–9. [Google Scholar] [CrossRef]
  89. Martello, H.F.; De Paula, N.F.; Teobaldo, R.W.; Zervoudakis, J.T.; Fonseca, M.A.; Cabral, L.S.; Rocha, J.K.L.; Mundim, A.T.; Moraes, E.H.B.K. Interaction between tannin and urea on nitrogen utilization by beef cattle grazing during the dry season. Livest. Sci. 2020, 234, 103988. [Google Scholar] [CrossRef]
  90. Mezzomo, R.; Paulino, P.V.R.; Detmann, E.; Valadares Filho, S.C.; Paulino, M.F.; Monnerat, J.P.I.S.; Duarte, M.S.; Silva, L.H.P.; Moura, L.S. Influence of condensed tannin on intake, digestibility, and efficiency of protein utilization in beef steers fed high concentrate diet. Livest. Sci. 2011, 141, 1–11. [Google Scholar] [CrossRef]
  91. Mezzomo, R.; Paulino, P.V.R.; Barbosa, M.M.; da Silva-Martins, T.; Paulino, M.F.; Alves, K.S.; Gomes, D.I.; Monnerat, J.P.I.S. Performance and carcass characteristics of young cattle fed with soybean meal treated with tannins. Anim. Sci. J. 2016, 87, 775–782. [Google Scholar] [CrossRef]
  92. Norris, A.B.; Crossland, W.L.; Tedeschi, L.O.; Foster, J.L.; Muir, J.P.; Pinchak, W.E.; Fonseca, M.A. Inclusion of quebracho tannin extract in a high-roughage cattle diet alters digestibility, nitrogen balance, and energy partitioning. J. Anim. Sci. 2020, 3, 1–12. [Google Scholar] [CrossRef]
  93. Pineiro-Vázquez, A.T.; Canul-Solis, J.R.; Jiménez-Ferrer, G.O.; Alayón-Gamboa, J.A.; Chay-Canul, A.J.; Ayala-Burgos, A.J.; Aguilar-Pérez, C.F.; Ku-Vera, J.C. Effect of condensed tannins from Leucaena leucocephala on rumen fermentation, methane production and population of rumen protozoa in heifers fed low-quality forage. Asian Australas J. Anim. Sci. 2018, 31, 1738–1746. [Google Scholar] [CrossRef] [Green Version]
  94. Piñeiro-Vázquez, A.T.; Jiménez-Ferrer, G.; Alayon-Gamboa, J.A.; Chay-Canul, A.J.; Ayala-Burgos, A.J.; Aguilar-Pérez, C.F.; Ku-Vera, J.C. Effects of quebracho tannin extract on intake, digestibility, rumen fermentation, and methane production in crossbred heifers fed low-quality tropical grass. Trop. Anim. Health Prod. 2018, 50, 29–36. [Google Scholar] [CrossRef]
  95. Piñeiro-Vázquez, A.T.; Jiménez-Ferrer, G.O.; Chay-Canul, A.J.; Casanova-Lugo, F.; Díaz-Echeverría, V.F.; Ayala-Burgos, A.J.; Solorio-Sánchez, F.J.; Aguilar-Pérez, C.F.; Ku-Vera, J.C. Intake; digestibility; nitrogen balance and energy utilization in heifers fed low-quality forage and Leucaena leucocephala. Anim. Feed Sci. Technol. 2017, 228, 194–201. [Google Scholar] [CrossRef]
  96. Poblete, J.B.; Angeles, A.A.; Agbisit, J.E.M.; Espaldon, M.V.O. Response of Growing Dairy Bulls to Dietary Tannin in Rations with Varying Energy Levels. Trop. Anim. Sci. J. 2020, 43, 50–56. [Google Scholar] [CrossRef] [Green Version]
  97. Rivera-Méndez, C.R.; Plascencia, A.; Torrentera, N.; Zinn, R.A. Influence of tannins supplementation on growth performance, dietary net energy and carcass characteristics of yearling steers fed finishing diet containing dried distillers grains with solubles. Indian J. Anim. Sci. 2016, 86, 108–111. [Google Scholar]
  98. Shakeri, P.; Riasi, A.; Alikhani, M.; Fazaeli, H.; Ghorbani, G.R. Effects of feeding pistachio by-products silage on growth performance, serum metabolites and urine characteristics in Holstein male calves. J. Anim. Physiol. Anim. Nutr. 2013, 97, 1022–1029. [Google Scholar] [CrossRef] [PubMed]
  99. Shakeri, P.; Riasi, A.; Alikhani, M. Effects of long period feeding pistachio by-product silage on chewing activity, nutrient digestibility and ruminal fermentation parameters of Holstein male calves. Animal 2014, 8, 1826–1831. [Google Scholar] [CrossRef] [Green Version]
  100. Tabke, M.C.; Sarturi, J.O.; Galyean, M.L.; Trojan, S.J.; Brooks, J.C.; Johnson, B.J.; Martin, J.; Baggerman, J.; Thompson, J. Effects of tannic acid on growth performance, carcass characteristics, digestibility, nitrogen volatilization, and meat lipid oxidation of steers fed steam-flaked corn–based finishing diets. J. Anim. Sci. 2017, 11, 5124–5136. [Google Scholar] [CrossRef] [Green Version]
  101. Tseu, R.J.; Junior, F.P.; Carvalho, R.F.; Sene, G.A.; Tropaldi, C.B.; Peres, A.H.; Rodrigues, P.H.M. Effect of tannins and monensin on feeding behaviour, feed intake, digestive parameters and microbial efficiency of nellore cows. Ital. J. Anim. Sci. 2020, 19, 262–273. [Google Scholar] [CrossRef] [Green Version]
  102. Yuste, S.; Amanzougarene, Z.; de la Fuente, G.; de Vega, A.; Fondevila, M. Rumen protozoal dynamics during the transition from milk/grass to high-concentrate based diet in beef calves as affected by the addition of tannins or medium-chain fatty acids. Anim. Feed Sci. Technol. 2019, 257, 114273. [Google Scholar] [CrossRef]
  103. Zhou, K.; Bao, Y.; Zhao, G. Effects of dietary crude protein and tannic acid on rumen fermentation, rumen microbiota and nutrient digestion in beef cattle. Arch. Anim. Nutr. 2019, 73, 30–43. [Google Scholar] [CrossRef]
Figure 1. Forest plot of the effect size or standardized mean difference and 95% confidence interval of tannin type on crude protein digestibility (CPD) in beef cattle. The solid vertical black line represents the mean difference of zero or no effect. Points to the left of the solid vertical line represent reduction of total CPD, while points to the right of the line indicate increase in total CPD concentration.
Sustainability 13 07410 g001
Figure 2. Forest plot of effect size or standardized mean difference and 95% confidence interval of tannin type on ruminal concentration of total volatile fatty acids (VFA) in beef cattle. The solid vertical black line represents the mean difference of zero or no effect. Points to the left of the solid vertical line represent reduction of total VFA, while points to the right of the line indicate increase in total VFA concentration.
Sustainability 13 07410 g002
Figure 3. Forest plot of the effect size or standardized mean difference and 95% confidence interval of the source of chemical or botanical origin of tannin on crude protein digestibility (CPD) in beef cattle. The solid vertical black line represents the mean difference of zero or no effect. Points to the left of the solid vertical line represent reduced CPD, while points to the right of the line indicate increased CPD.
Sustainability 13 07410 g003
Figure 4. Forest plot of the effect size or standardized mean difference and 95% confidence interval of the source of chemical or botanical origin of tannin on neutral detergent fiber digestibility (NDFD) in beef cattle. The solid vertical black line represents the mean difference of zero or no effect. Points to the left of the solid vertical line represent reduced NDFD, while points to the right of the line indicate increased NDFD.
Sustainability 13 07410 g004
Figure 5. Forest plot of the effect size or standardized mean difference and 95% confidence interval of the source of chemical or botanical origin of tannin on ruminal concentration of total volatile fatty acids (VFA) in beef cattle. The solid vertical black line represents the mean difference of zero or no effect. Points to the left of the solid vertical line represent reduction in ruminal concentration of total VFA, while points to the right of the line indicate increase in total VFA.
Sustainability 13 07410 g005
Figure 6. Forest plot of the effect size or standardized mean difference and 95% confidence interval of the source of chemical or botanical origin of tannin on ruminal propionate concentration in beef cattle. The solid vertical black line represents the mean difference of zero or no effect. Points to the left of the solid vertical line represent reduction of ruminal propionate, while points to the right of the line indicate increase of propionate.
Sustainability 13 07410 g006
Figure 7. Forest plot of the effect size or standardized mean difference and 95% confidence interval of the source of botanical or chemical origin of tannin on enteric methane emissions per unit dry matter intake (MEDMI) in beef cattle. The solid vertical black line represents the mean difference of zero or no effect. Points to the left of the solid vertical line represent reduction in MEDMI, while points to the right of the line indicate increase in MEDMI.
Sustainability 13 07410 g007
Figure 8. Forest plot of the effect size or standardized mean difference and 95% confidence interval of the source of botanical or chemical origin of tannin on urine nitrogen excretion (UNE) in beef cattle. The solid vertical black line represents the mean difference of zero or no effect. Points to the left of the solid vertical line represent reduction in UNE, while points to the right of the line indicate increase in UNE.
Sustainability 13 07410 g008
Figure 9. Forest plot of the effect size or standardized mean difference and 95% confidence interval of the source of botanical or chemical origin of tannin on fecal nitrogen excretion (FNE) in beef cattle. The solid vertical black line represents the mean difference of zero or no effect. Points to the left of the solid vertical line represent reduction in FNE, while points to the right of the line indicate increase in FNE.
Sustainability 13 07410 g009
Figure 10. Forest plot of the effect size or standardized mean difference and 95% confidence interval of the tannin inclusion method on enteric methane emissions per unit dry matter intake (MEDMI) in beef cattle. The solid vertical black line represents the mean difference of zero or no effect. Points to the left of the solid vertical line represent reduction in MEDMI, while points to the right of the line indicate increase in MEDMI.
Sustainability 13 07410 g010
Table 1. Descriptive statistics of the complete data set for the effect of tannins’ supplementation to beef cattle diets.
ParameterNCMeanMedianMinimumMaximumSD
Dietary FeaturesControlTanninControlTanninControlTanninControlTanninControlTannin
Forage g/kg DM105506.9509.1498.0425.050.030.010001000358.9372.5
DM, g/kg80647.8645.7700.0702.5256.0256.0927.0928.0211.7210.5
OM, g/kg DM50927.5928.3936.0936.4835.1835.8953.0953.030.2430.10
CP, g/kg DM105124.4129.0132.5134.530.1030.10204.0205.040.6036.46
EE, g/kg DM6138.3139.5232.1035.5017.5017.5061.061.013.9813.68
NDF, g/kg DM97430.5 a423.7 b409.0404.4163.0163.0763.5770.0177.2172.8
ADF, g/kg DM73259.1259.7226.5224.582.1082.10468.5487.0117.7120.2
Starch, g/kg DM31364.8362.9415.8422.648.023.0575.0575.0180.6183.3
Ca, g/kg DM416.186.335.556.155.305.307.507.500.8360.792
P, g/kg DM414.114.104.204.103.603.604.504.500.3190.313
Tannin, g/kg DM105-14.61-12.10-0.46-60-12.29
Duration, days9993902818033.38
Extracted response parameters
FBW, kg31457.5458.2443.5437189.5204.3621616122.1122.6
DMI, kg/d738.3578.1368.207.843.803.6012.6012.762.2672.456
OMI, kg/d466.8376.8206.5406.6901.1851.15512.44012.4802.3212.391
CPI, kg/d260.8280.9570.7050.9900.1940.1672.0902.2000.5130.494
EEI, kg/d80.2320.2320.1700.1800.1600.1500.4100.3900.0960.098
NDFI, kg/d383.6793.5243.7603.7401.8101.9004.6304.7300.9590.835
ADFI, kg/d172.5212.4532.8502.5001.2601.2803.5003.6200.6740.664
ADG, kg/d371.2581.2731.3701.3200.0180.1202.0802.1400.5890.545
FE, kg/kg220.1530.1500.1630.1590.0920.0920.2060.1980.0370.033
DMD, g/kg DM 49622.0594.3628.0601.9411.9428.5810.5797.777.5795.08
OMD, g/kg DM59660.1632.0660.0646.3451.7442.0820.0810.084.48100.4
CPD, g/kg DM43571.6541.2679.0635.0276.279.57767.6770.9183.9226.1
EED, g/kg DM23689.4679.4713.0699.0447.0435.0857.3891.0112.7116.7
NDFD, g/kg DM47561.4534.9576.0518.1385.0405.0771.0776.990.1180.54
ADFD, g/kg DM24494.1415.4532.0413.6403.0219.1549.1561.054.7288.33
Ruminal pH576.6376.6216.7006.6805.8105.8907.1907.4300.3370.356
NH3-N, mg/dL5711.2510.5910.638.162.481.7330.4036.506.3387.673
Total VFA, mM5484.7286.4974.0178.4235.8032.7215814129.3028.81
Acetate, % molar5460.3960.6767.8066.0931.4238.4174.1074.4011.5410.41
Propionate, % molar5419.3919.8518.7418.476.589.2536.8038.06.9876.505
Butyrate, % molar5411.9412.3810.3311.706.105.3019.4019.773.7993.866
Protozoa, log10/mL265.5085.3065.4805.5951.3100.93011.9010.603.5403.161
CH4, L/d26150.6135.7128.8107.044.1629.20331.7302.480.8688.44
CH4, L/DMI2819.9318.7620.1014.785.605.4331.2251.809.3512.38
UNE, g/d3556.6454.9554.8046.04.309.0168.0167.047.8844.48
FNE, g/d3157.1066.7349.8862.016.2019.50126.0146.032.6438.04
NUE, %2225.7620.7525.3416.4516.896.2039.1539.07.4311.62
NC: number of comparisons; SD: standard deviation; DM: dry matter; OM: organic matter; CP: crude protein; EE: ether extract; NDF: neutral detergent fiber; ADF: acid detergent fiber; Ca: calcium; P: phosphorus; ADG: average daily gain; FE: feed efficiency; FBW: final body weight; DMI: DM intake; OMI: OM intake; CPI: CP intake; NDFI: NDF intake; ADFI: ADF intake; EEI: EE intake; DMD: DM digestibility; OMI: OM digestibility; CPD: CP digestibility; NDFD: NDF digestibility; ADFD: ADF digestibility; EED: EE digestibility; NH3-N: nitrogen ammonia; VFA: volatile fatty acids; CH4: methane; FE: determined as weight gain/feed intake (G:F), kg/kg; UNE: urinary nitrogen excretion; FNE: fecal nitrogen excretion; NUE: nitrogen use efficiency; a, b: in the same row (only applies to dietary features), means followed by different letters differ significantly by the Tukey’s test (p < 0.05).
Table 2. Growth performance and nutrient intake of beef cattle supplemented with tannins.
VariableNNCSMDSE95% CIp-ValueHeterogeneity
LowerUpperQp-ValueI2 (%)
Final bodyweight1131−0.0410.102−0.2410.1580.6838.6420.1322.36
Dry matter intake2573−0.0100.078−0.1630.1440.90102.879<0.0530.01
Organic matter intake16460.0620.086−0.1060.2300.4722.5260.990
Crude protein intake9260.3210.171−0.0140.6570.0646.693<0.0546.46
Ether extract intake38−0.0260.241−0.4990.4470.916.7230.450
Neutral detergent fiber intake1438−0.1670.096−0.3550.0220.0820.0420.990
Acid detergent fiber intake617−0.1890.135−0.4530.0750.164.2410.990
Average daily gain13370.0590.083−0.1040.2220.4735.490.490
Feed efficiency722−0.2870.150−0.5810.0070.0643.045<0.0551.21
N: number of studies; NC: number of comparisons; SMD: standardized mean difference; CI: confidence interval of SMD; SE: standard error; Q: chi-squared statistic and associated significance level (p-value); I2: percentage of variation.
Table 3. Nutrient digestibility, rumen parameters, and enteric methane emissions of beef cattle supplemented with tannins.
ParameterNNCSMDSE95% CIp-ValueHeterogeneity
LowerUpperQp-ValueI2 (%)
Dry matter digestibility1749−0.5890.124−0.833−0.346<0.00197.833<0.00150.94
Organic matter digestibility2159−0.6120.108−0.825−0.400<0.001108.599<0.00146.59
Crude protein digestibility1543−0.9030.210−1.315−0.492<0.001173.687<0.00175.82
Ether extract digestibility823−0.3280.215−0.7500.0940.1261.615<0.00164.29
NDFD1847−0.3700.150−0.644−0.0760.01127.334<0.00163.87
ADFD924−0.7160.151−1.012−0.419<0.00137.107<0.0538.02
Ruminal pH2057−0.1710.099−0.3640.0220.0898.287<0.00143.02
Ruminal NH3-N2057−0.5080.128−0.759−0.258<0.001148.223<0.00162.22
Total VFA19540.0210.124−0.2230.2650.86139.359<0.00161.97
Acetate19540.0410.115−0.1840.2670.72120.090<0.00155.87
Propionate19540.2500.1070.0400.4600.02103.404<0.00148.74
Butyrate19540.1980.0790.0420.3540.0161.2040.2013.40
Protozoa826−0.7450.397−1.5230.0330.06235.732<0.00189.39
Methane emissions/day926−0.4740.155−0.178−0.1710.00250.007<0.0548.01
Methane emissions/unit of DMI1028−0.4080.155−0.712−0.1050.00856.848<0.00152.50
Urinary nitrogen excretion1235−0.3380.149−0.630−0.0460.02383.931<0.00159.49
Fecal nitrogen excretion11310.8600.1380.5891.131<0.00148.3040.01837.89
Nitrogen use efficiency822−0.2730.262−0.7860.2390.29675.726<0.00172.27
N: number of studies; NC: number of comparisons; SMD: standardized mean difference; CI: confidence interval of SMD; SE: standard error; Q: chi-squared statistic and associated significance level (p-value); I2: percentage of variation; NDFD: neutral detergent fiber digestibility; ADFD: acid detergent fiber digestibility; NH3-N: ammonia nitrogen; VFA: volatile fatty acids; DMI: dry matter intake.
Publisher’s Note: MDPI stays neutral with regard to jurisdictional claims in published maps and institutional affiliations.

