Article

Diversity of Sources of Income for Smallholder Farming Communities in Malawi: Importance for Improved Livelihood

1
Department of International Environment and Development Studies (Noragric), LANDSAM, Norwegian University of Life Sciences, P.O. Box 5003, 1432 Ås, Norway
2
Graham Centre for Agricultural Innovation, Charles Sturt University, Wagga Wagga, NSW 2650, Australia
3
School of Computing, Mathematics and Engineering, Charles Sturt University, Wagga Wagga, NSW 2650, Australia
4
Norwegian Church Aid (NCA), Lilongwe P.O. Box 322, Malawi
5
Programmes Coordinating Office, Lilongwe University of Agriculture and Natural Resources, Lilongwe P.O. Box 219, Malawi
6
Department of Animal and Aquacultural Sciences, Faculty of Biosciences, Norwegian University of Life Sciences, P.O. Box 5003, 1432 Ås, Norway
*
Author to whom correspondence should be addressed.
Sustainability 2021, 13(17), 9599; https://doi.org/10.3390/su13179599
Submission received: 16 July 2021 / Revised: 15 August 2021 / Accepted: 24 August 2021 / Published: 26 August 2021
(This article belongs to the Special Issue Sustainable Livestock Production)

Abstract

:
Agriculture is vital to global food production. Around 550 million smallholding households produce most of the world’s food, and many rely on livestock rearing for a living. Smallholder farms must survive and thrive to maintain and increase food production. Baseline information is vital for further extension service interventions. The goal of this Malawian study was to collect quantitative baseline data on crop and livestock production, agriproduct sales, and other indicators through a household survey, and to compare the efficacy (in terms of income) of using the concept of “Lead and Follow” farmer training programs. The baseline study survey was carried out in 44 sections of 11 extension planning areas from Malawi’s five districts (Dowa, Kasungu, Mchinji, Mzimba, and Rumphi). In total, 1131 smallholder households were interviewed. Crop production, livestock farming, and providing casual labor for others were all identified as significant sources of income for smallholders, implying that all agriproducts (the whole-farm approach) is equally important for improving smallholder livelihoods. On the one hand, the whole-farm approach should improve smallholders’ resilience regarding climate change and poverty. Lower agriproduct sales, on the other hand, indicated that links to the market were frequently poor but an increased market focus should help smallholders sell their produce at a fair margin. In terms of best practices adoption, both Lead and Follow farmers adopted similar farm practices (crops and livestock) to increase income. In general, no significant difference in income was calculated from many farm enterprises for both Lead and Follow farmers. However, the income from pigs and firewood was significantly higher for Follow farmers than for Lead farmers. Lead farmers reported significantly higher off-farm income sources. Significant changes are proposed to the “Lead farmer extension approach”.

1. Introduction

Agriculture provides the foundational basis for food supply [1,2], and this is particularly true in developing regions. Sub-Saharan Africa must significantly improve productivity in the agricultural sector to combat issues of rapid population growth and climate change. According to the United Nations, small-scale family farms account for more than half of the world’s food production [3]. About 1.5 billion people live on smallholder farms, of which half a billion are completely or partially dependent on livestock. Approximately two-thirds of the African population relies on smallholder agriculture. It is estimated that 73% of the food consumed in Asia and sub-Saharan Africa is produced by these farming communities [4,5]. Many farmers who grow smaller quantities of produce often do not rely much on the market but retain their produce for their own use [6]. Cattle herders in Africa, relying heavily on grazing areas for fodder, use small-scale farming as a means of providing feed for their livestock. Livestock often struggle to maintain body condition during the dry season, especially in places where rainfall is erratic, and decreases in milk availability result in malnourishment in the family and in particular in infants [7]. Local food resources are also scarce in the marketplace.
Malawi is a landlocked country with a large freshwater reservoir; Lake Malawi, the third-largest freshwater lake in Africa, is the eleventh largest in the world. It constitutes 20% of Malawi’s total area [8,9]. More than 19 million people in Malawi live on a per capita gross national income (GNI) of USD 380 per annum basis, making the country the sixth poorest in the world [10,11,12]. An overwhelming majority rely on farming for their livelihood [13], with 70% of the population living on less than USD 1.08 per day. Half of Malawi‘s population earns less than the estimated costs of a diet providing minimum calorie intake, and about half of the children are malnourished [13,14]. Whether in rural or urban areas, households use 48–53% of the average monthly budget to buy maize; meat comes the second, with milk and eggs the next [15]. Livestock are mostly used as a form of financial insurance against drought, erratic rainfall, and flooding in farm fields [16]. They are essential for the population’s ability to recover from unfavorable climate conditions, and to maintain food security.
Food production is dependent on rainfall and is, thus, susceptible to droughts and inconsistent rainfall [17]. In recent years, more frequent severe weather-related shocks and stresses, including erratic rainfall, flooding and prolonged dry spells, attest to the impact of climate change [18]. Malawi has experienced high rates of climate vulnerability, with significant disparities between urban and rural areas, and between regions, with the south of the country being the worst affected. In 2015, 2016 and 2019, Malawi experienced serious and unprecedented consecutive floods and droughts, with consequent adverse effects on key socio-economic sectors and on the economy overall.
It is important to develop a detailed understanding of any farming system before exploring opportunities to improve it. The smallholder farming systems of Sub-Saharan Africa (SSA) and the disparate extension services supporting them have received very little attention. A better understanding of the type and scale of extension protocols required for smallholder farming communities in this challenging environment is of prime concern. The extension was originally intended as a “service” to farmers to improve their livelihoods by disseminating research-based knowledge [19]. Davis [19] briefly described the possible causes of extension service failure, including a lack of relevant technology, a failure to consider the clientele in defining and solving problems, and weak linkages between extension, research, and farming practitioners. Critical analysis is required before future interventions can be prioritized. The most appropriate extension methodologies for any farming community should improve the productivity of smallholders. Once their productivity is improved, a sustainable linkage with a market free of political interference is vital to selling the agriproducts at prices that yield a profit for the farmer. It is believed that smallholder producers have failed to attain reasonable market prices due to their naivety with marketing and also from inept government controls on pricing. Linkages with the private sector (private enterprises) are essential to support sustainable production and profit margins to maintain smallholders’ livelihoods.
This study aimed to establish a baseline related to the TRANSFORM program (designed to focus on sustainable food systems for rural resilience and transformation in Malawi). The objective of the TRANSFORM program is to strengthen local food systems in selected extension planning areas (EPAs) in five of Malawi’s rural districts and to demonstrate a sustainable improvement in food and nutrition security, resilience to climate change and improvements in income among agriculture-dependent rural households. The TRANSFORM program is being implemented under the Malawian context, based on low incomes and high poverty levels. Over 80% of Malawi’s rapidly growing population relies on subsistence rain-fed agriculture, and limited economic diversification is needed. While some development programs have had a tangible and measurable impact on household resilience, to date, none have reached a scale at which they make a significant impact on poverty levels. If the cycle of hunger and crisis is to be permanently disrupted, a truly transformational program is required.
The objective of this study was to collect quantitative baseline data on crop and livestock production, market access, and other indicators through a household survey. In addition, the effectiveness of the strategy of training Lead Farmers and Follow Farmers was checked. A Lead Farmer (LF) is defined as someone who motivates other farmers to try new technologies [20]; a Follow Farmer (FF) is one who observes the farming practices used by others and then selectively adopts those practices that, in their own opinion, will improve the productivity of their farm (further defined in the next section). The TRANSFORM program Consortium will use this baseline information to compare the project status before and after the implementation of TRANSFORM program activities. Identifying the areas of intervention in crops, livestock production and marketing that can improve the livelihoods of smallholder farmers was our main goal. An important aim of this study was to investigate the income gains based on the LF-led extension approach and compare the earnings of LF and FF groups. This will help to provide further directions for the TRANSFORM program.

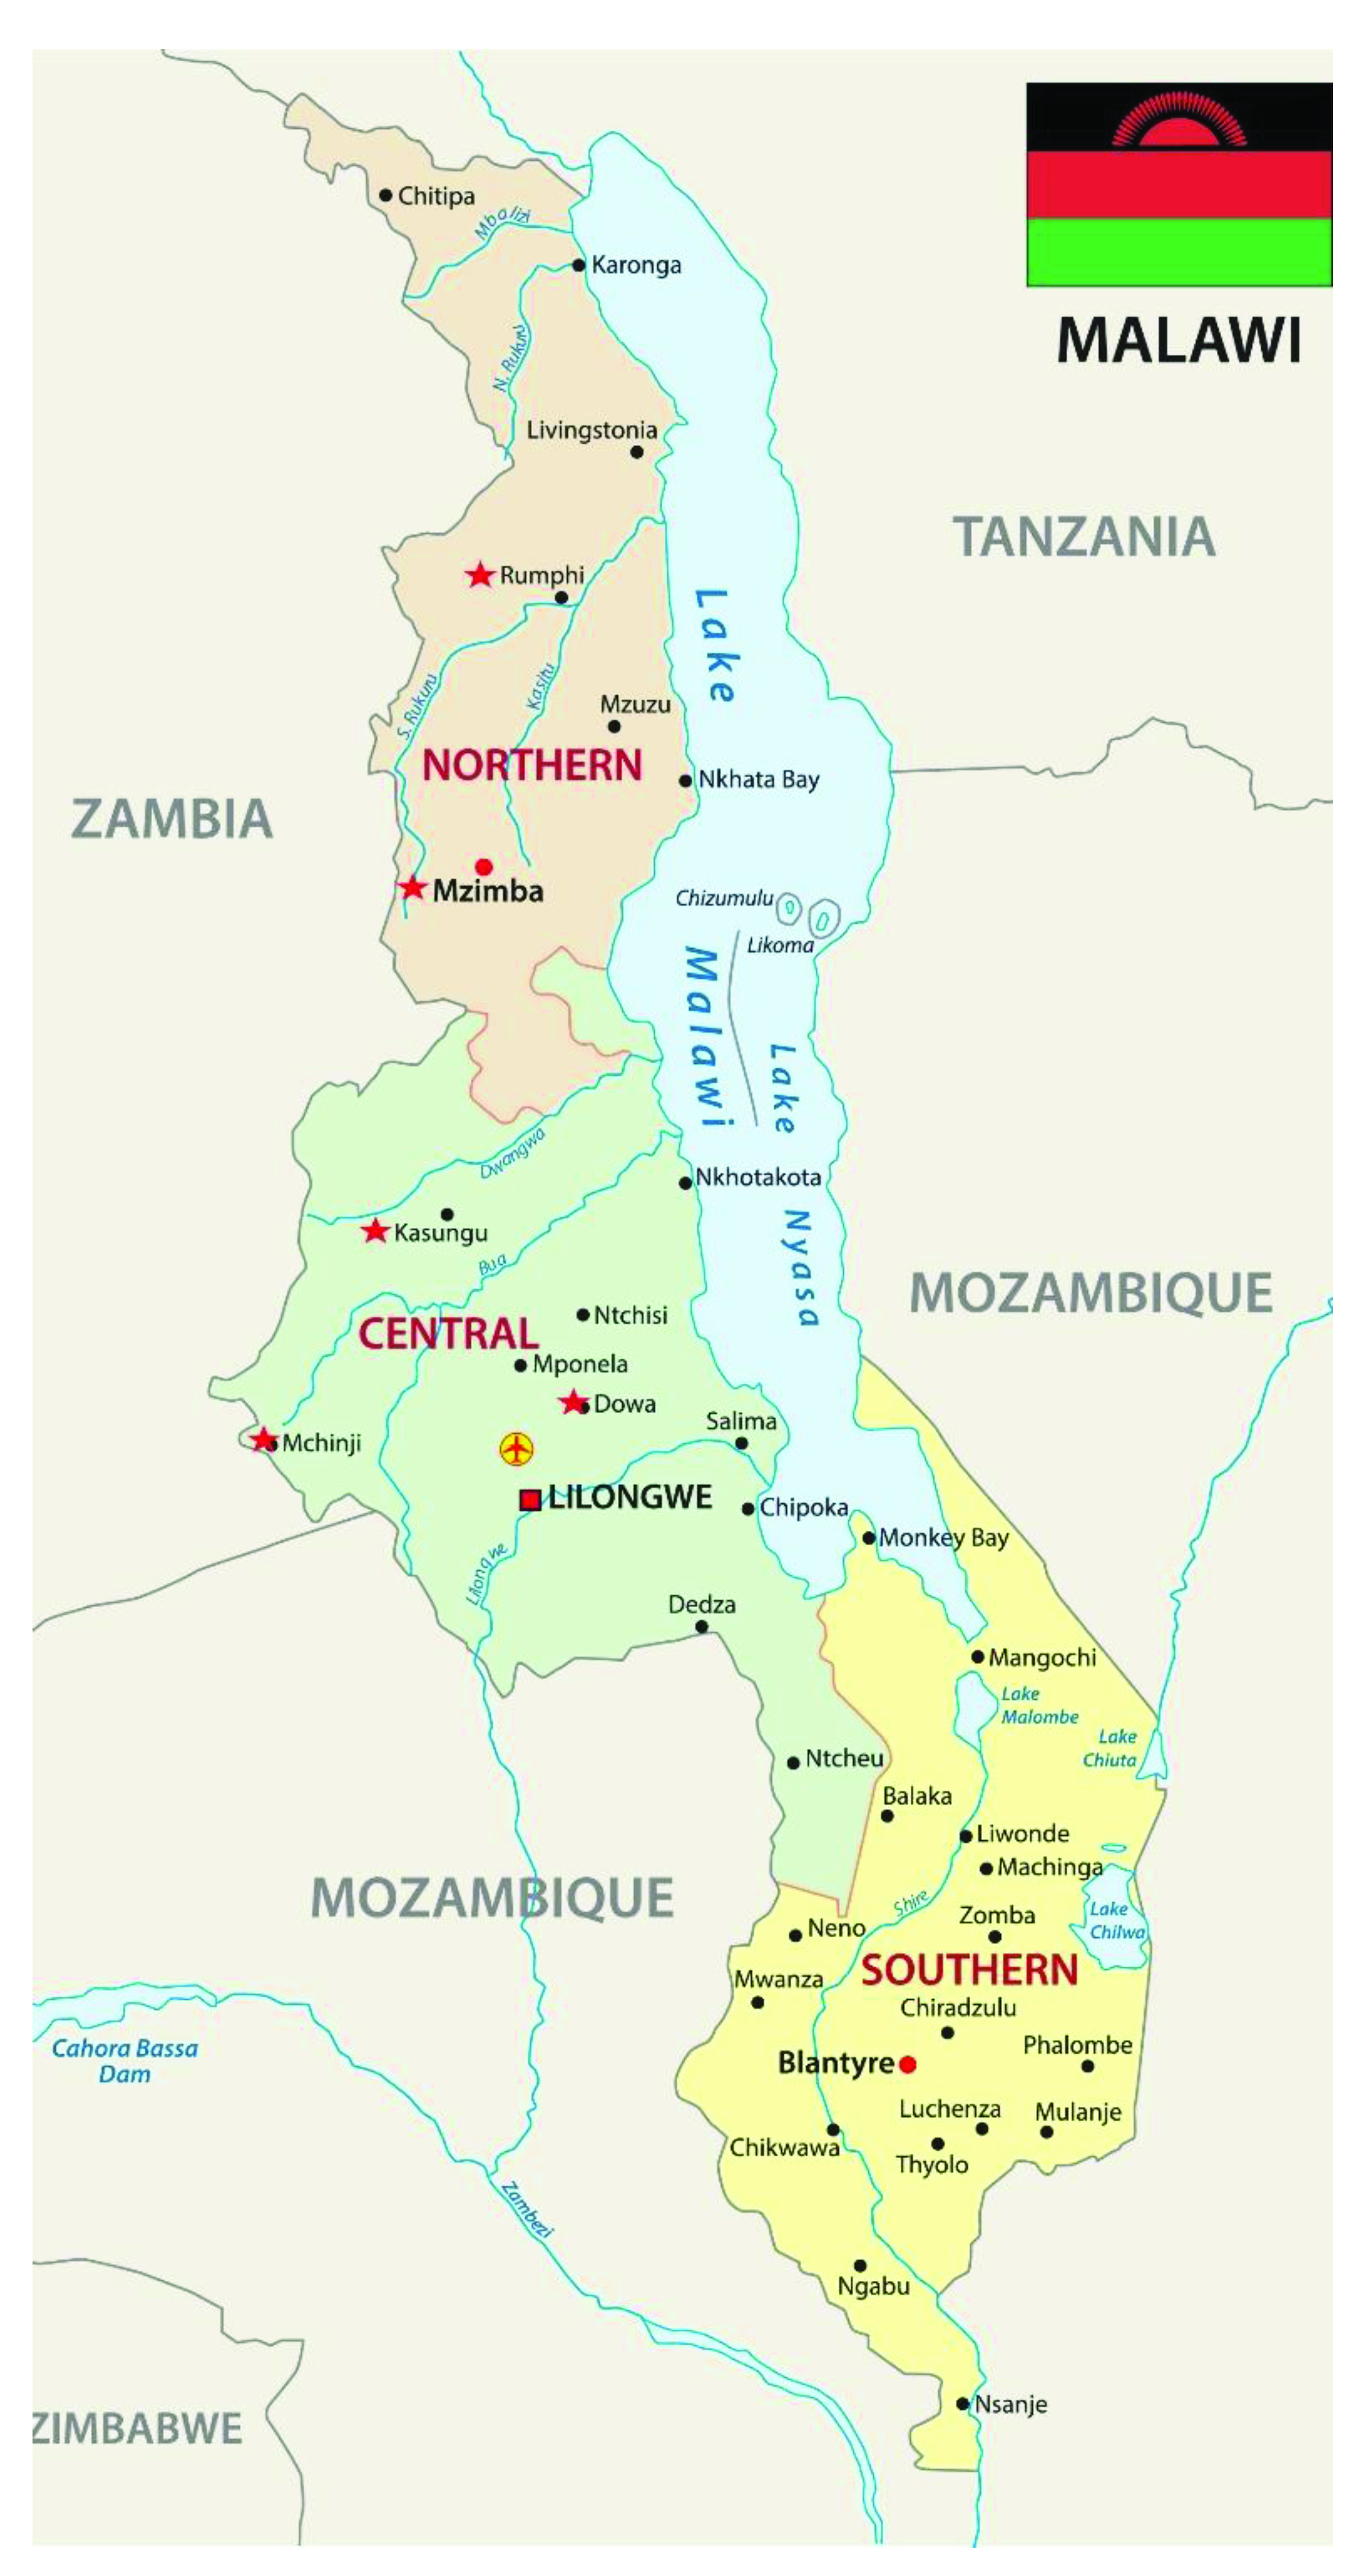
2. Material and Methods

The baseline study survey was conducted in the 44 sections of 11 EPAs from 5 districts (of a total of 28 districts) of Malawi (Table 1). The districts were selected to cover the TRANSFORM project. The five districts were: Dowa, Kasungu and Mchinji from the central region; and Mzimba and Rumphi from the northern region (Figure 1).
Methodology: Quantitative data were collected by administering a semi-structured questionnaire to the households in the five study districts of Malawi. After pre-testing, the final questionnaire was structured to acquire information on basic demographics, household assets and income sources, food production and availability, livestock production, marketing, agro-processing and value addition, the adoption of climate-smart agriculture technologies, and access to credit/loans. In this study, data related to the demographics, crop and livestock production, sources of livelihoods, and income comparison for LFs and FFs were analyzed and presented. The TRANSFORM program’s partners, and consortium members, had previously worked in Malawi on LF extension programs (such as the Sustainable Agriculture Lead Farmer Program). In a Malawian study, Fisher, Holden [21] used the term “Lead farmers” to refer to farmer trainers. In a report, Regine Andersen [22] has described the detailed procedure for the selection of LFs in Malawi. The income disparity between existing LFs and FFs was used to verify the efficiency of the strategy. The survey questionnaire asked if the respondent was an LF or not.
Sampling techniques: The sampling process for the baseline survey was designed based on the selected EPAs in the program target districts. The study used a multi-stage sampling process to determine the sample of farming families that participated in the household survey. This included purposive, stratified, and simple random samplings. The rationale for adopting multi-stage sampling was to target the potential project beneficiaries across a wide geographic area over the five study districts (Table 1).
Firstly, purposive sampling was adapted for all the project districts where the project has been implemented. Secondly, a stratified sampling technique was used, with extension planning areas (EPAs) as strata. Villages within the targeted EPAs were selected based on a probability proportional to size (PPS), using the size and number of villages in each EPA. Two EPAs were selected in each district except Mzimba, where 3 EPAs were selected, based on the subdivision of the district, into southern and northern zones. Thirdly, a simple random sampling technique was used to select farming households from each participating village to participate in the baseline survey. The survey participants were from a list of farm-family households obtained from the Agricultural Extension Development Coordinator (AEDC) of the respective EPA.
Sample size (SS): To capture the current demographic, socio-economic, agronomic and nutritional status of the participants in the project, the study unit for the survey was the individual farming family household. The number of households included in the study was determined using the following statistical formula (from Creative Research Systems, Sebastopol, CA 95472 [23]):
S S = Z 2 × p × ( 1 p ) C 2
where Z is the z-score used for creating a 95% confidence interval, p is the proportion picking a choice, expressed as a decimal (0.5 was used for the sample size needed), and C is the confidence interval expressed as a decimal.
Electronic household data collection and capturing: The KoBo Software (KoBo Toolbox at the Harvard Humanitarian Initiative, Cambridge, MA 01138, USA) was used to upload, collect and manage the household data collection. The pre-programmed questionnaire was loaded onto tablets for data collection, and the enumerators were instructed to upload the data onto a server. Most of the 15 research assistants collecting the household data were graduates who were able to speak the local dialects, Chichewa and Tumbuka, so that they were able to communicate well with the interviewees. They underwent a 3-day training course to understand the survey questionnaire and other operational tasks, such as data collection using KOBO and the ethics required during data collection. Before starting the actual data collection, the questionnaire was pre-tested in Waliranji Village (district Mchinji), which was not part of the selected EPAs used for this baseline study. In all, 1131 questionnaires were completed and considered for further analysis.
Data analysis: Welch’s two-sample t-tests were used to compare numerical variables between two groups. For the comparison of numerical variables from more than two groups, an analysis of variance followed by Tukey’s honest significant difference (HSD) tests were used. The level of significance and the family-wise error rate was set to 5%.
Income sources were grouped based on the number of people who relied on each source, and the average income generated by the corresponding income source was calculated. This means that the income sources shown in the tables below involved the majority of people and generated the most income.
Participation in the study was voluntary. Before each interview, either at the household or community level, a brief introduction about the purpose of the study was given. Verbal consent for participation was sought before starting the survey. Similarly, participants were assured of confidentiality and that the information collected would only be used for the purposes of the survey. Interviewers were also instructed to be neutral and were trained to respect the respondents’ dignity and culture.

3. Results and Discussion

The results of this baseline study were limited to the following: basic demographic characteristics, smallholder agriculture produce, livestock ownership and animal products, ranking of important income sources for smallholder farmers, mean income from all kinds of sources for smallholders across all five districts, and mean income comparison between LFs and FFs (all kinds of income) were presented.
In this survey, 663 women (58.6%) and 468 men (41.4%) were interviewed (Table 2), including 56 LFs, implying that one LF is available for every twenty FFs in the study districts. All respondents were smallholder farmers, so the average land size across all districts was 2.7 hectares. In all districts, only 18.7% (n = 211) of farmers hired labor for farm activities. Rumphi district had the highest percentage (26.5%, n = 56) of farmers involved in hiring labor among the five study districts. The baseline data (Table 1) revealed the variety of different sources of income for smallholder farmers.

3.1. Crops and Vegetables Growing

The surveyed smallholder farmers were growing crops of many kinds.
Maize: Most (99%) of all surveyed smallholder households who were growing any crop or vegetable reported growing maize. Maize flour is used as a staple food in Malawi.
Soya: With 52% of the surveyed households reporting growing soya, this was the second most popular crop. Households from Mzimba South had most (25%) of the soya growers in the survey, while smallholder farmers from the Kasungu (24%) and Dowa (18%) districts ranked second and third, respectively.
Groundnuts: Groundnuts were the third most popular crop, with around 44% of smallholder farmers growing them. Dowa district had the most (25%), while smallholder farmers from Mchinji (24%) and Rumphi (19%) were the second and third most important groundnut growers in the survey, respectively.
Sweet potatoes: Around one-quarter (25%) of the households grew sweet potatoes. Of these, smallholder farmers from Rumphi comprised 57%, followed by growers from the Mzimba South (15%) and Kasungu (11%) districts.
Tobacco: About 20% of all surveyed farmers reported growing tobacco. The Rumphi district contributed 40% of these, while Dowa and Mzimba North provided 25% and 15% of these, respectively.
Vegetables: About 11% of all surveyed smallholder farmers reported the cultivation of vegetables. These were most prevalent in Mzimba South (21%), followed by Mchinji (20%) and Mzimba North (16%).

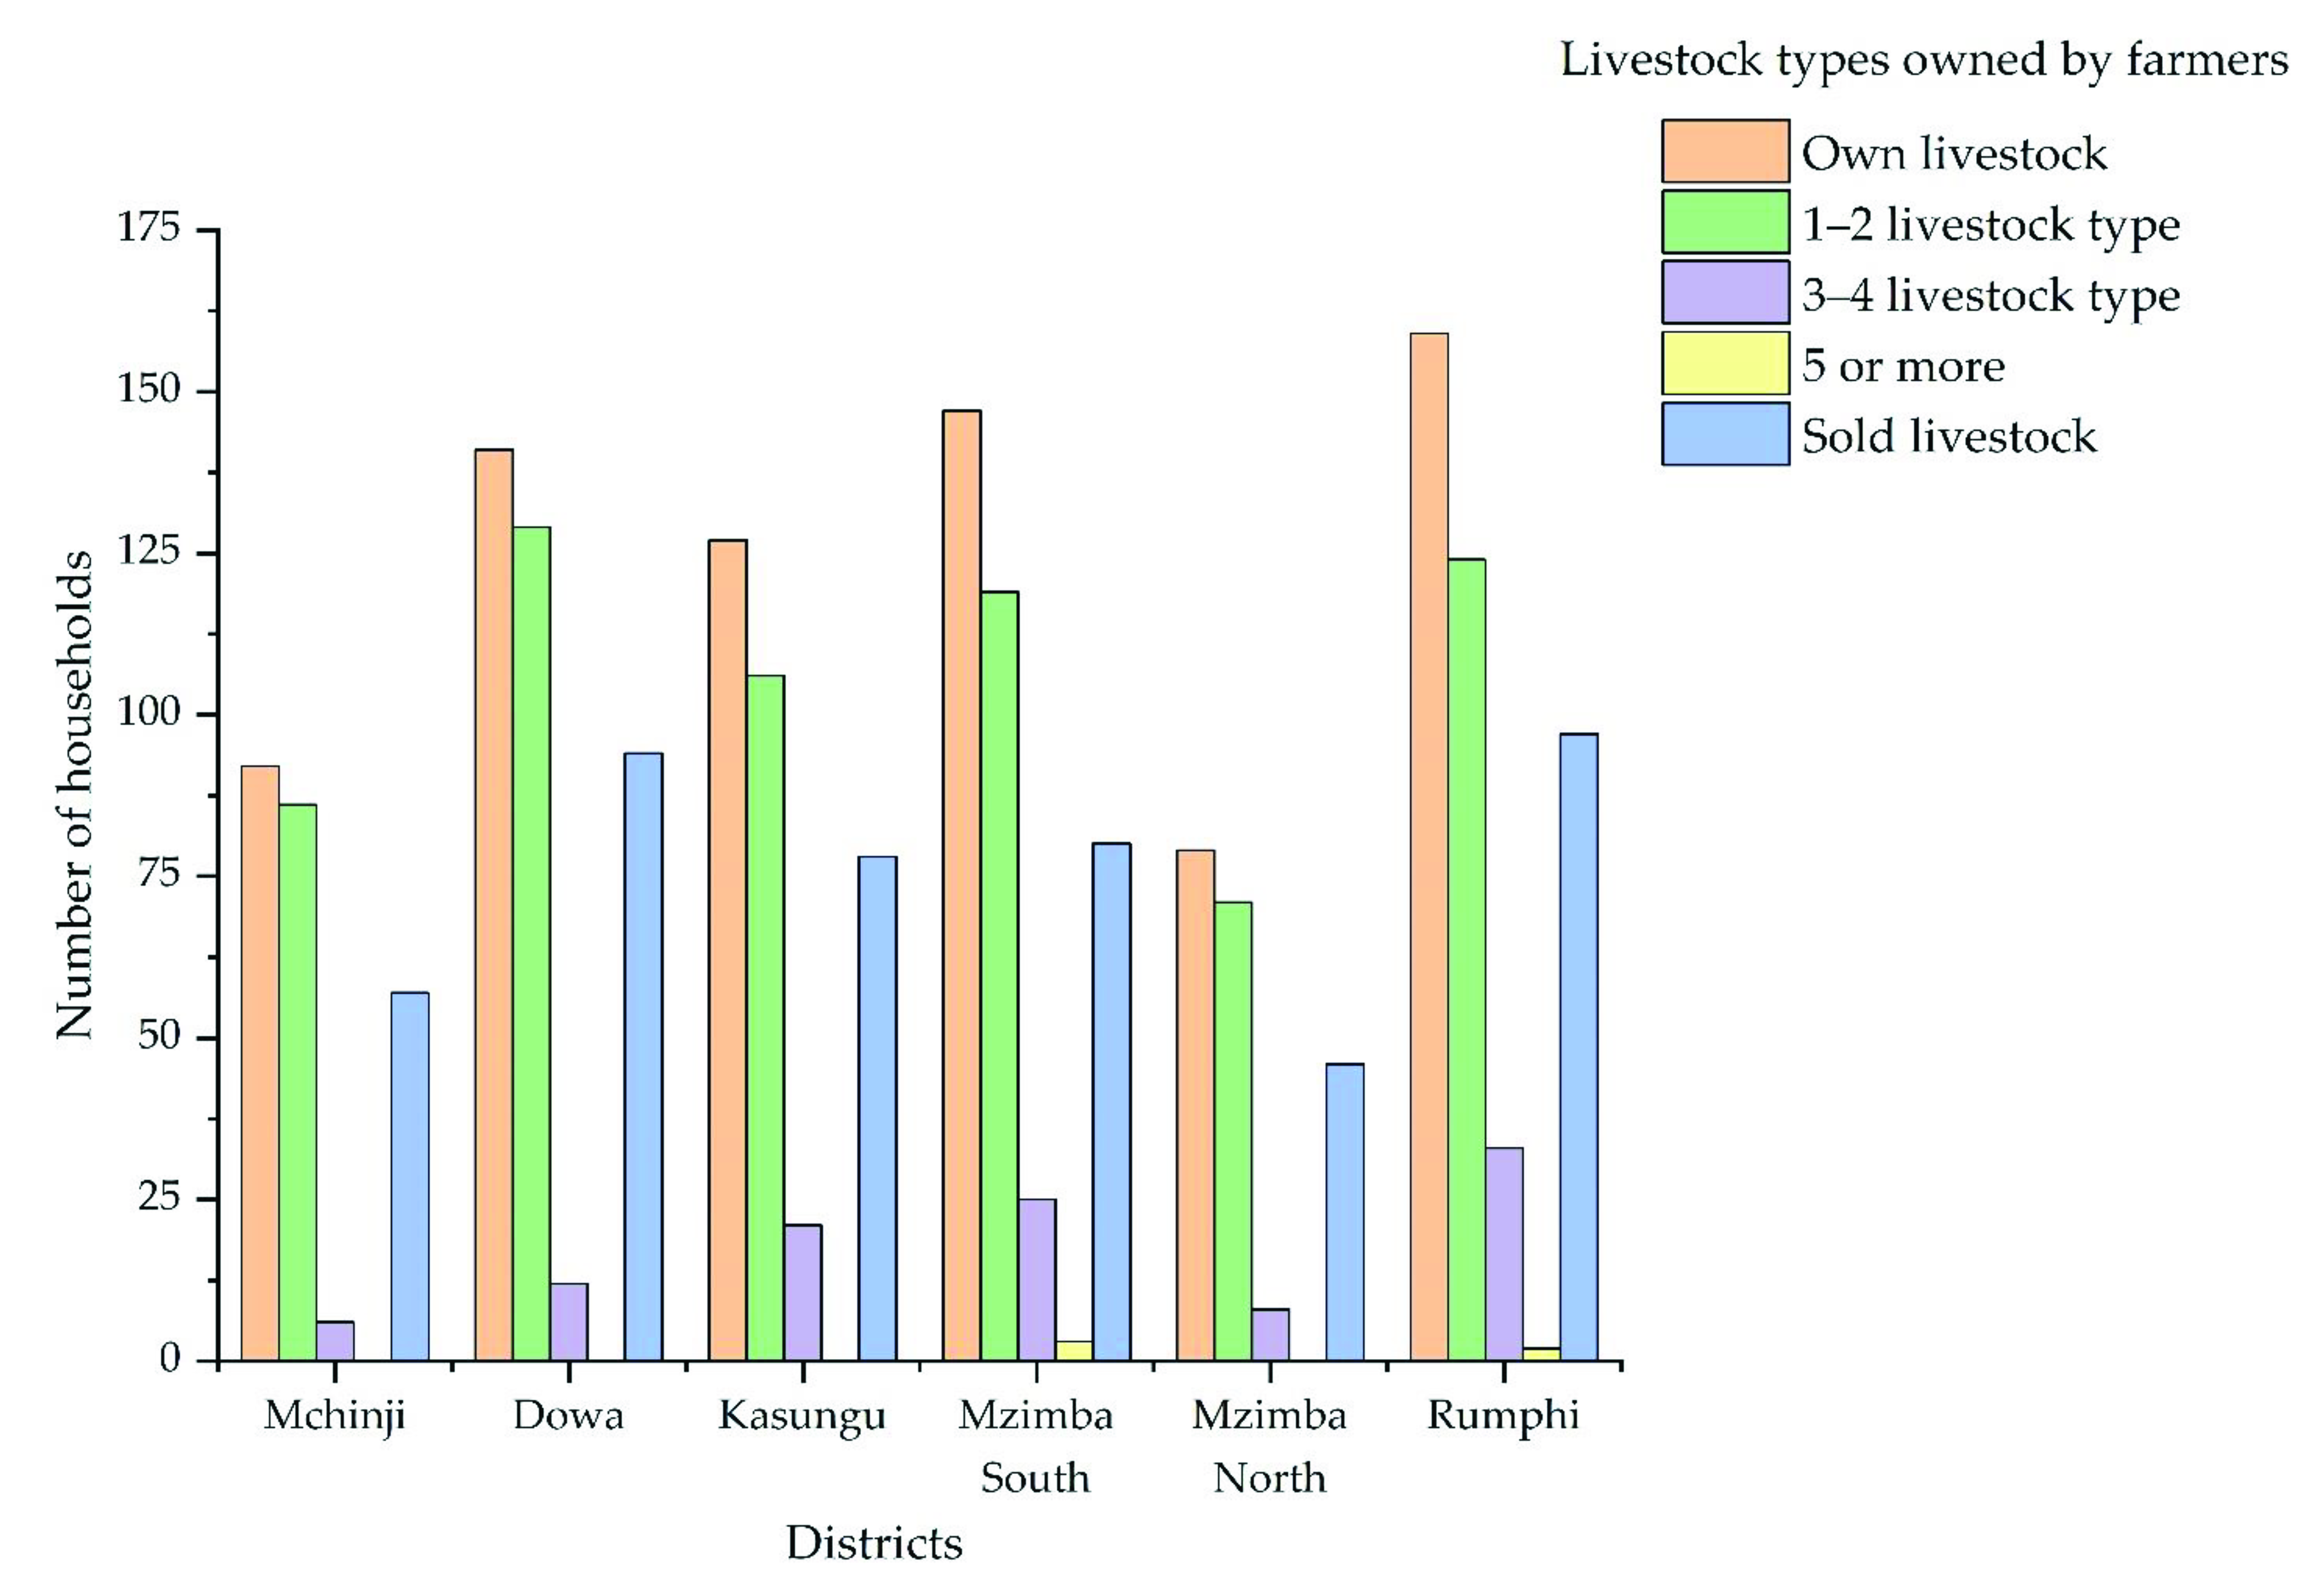
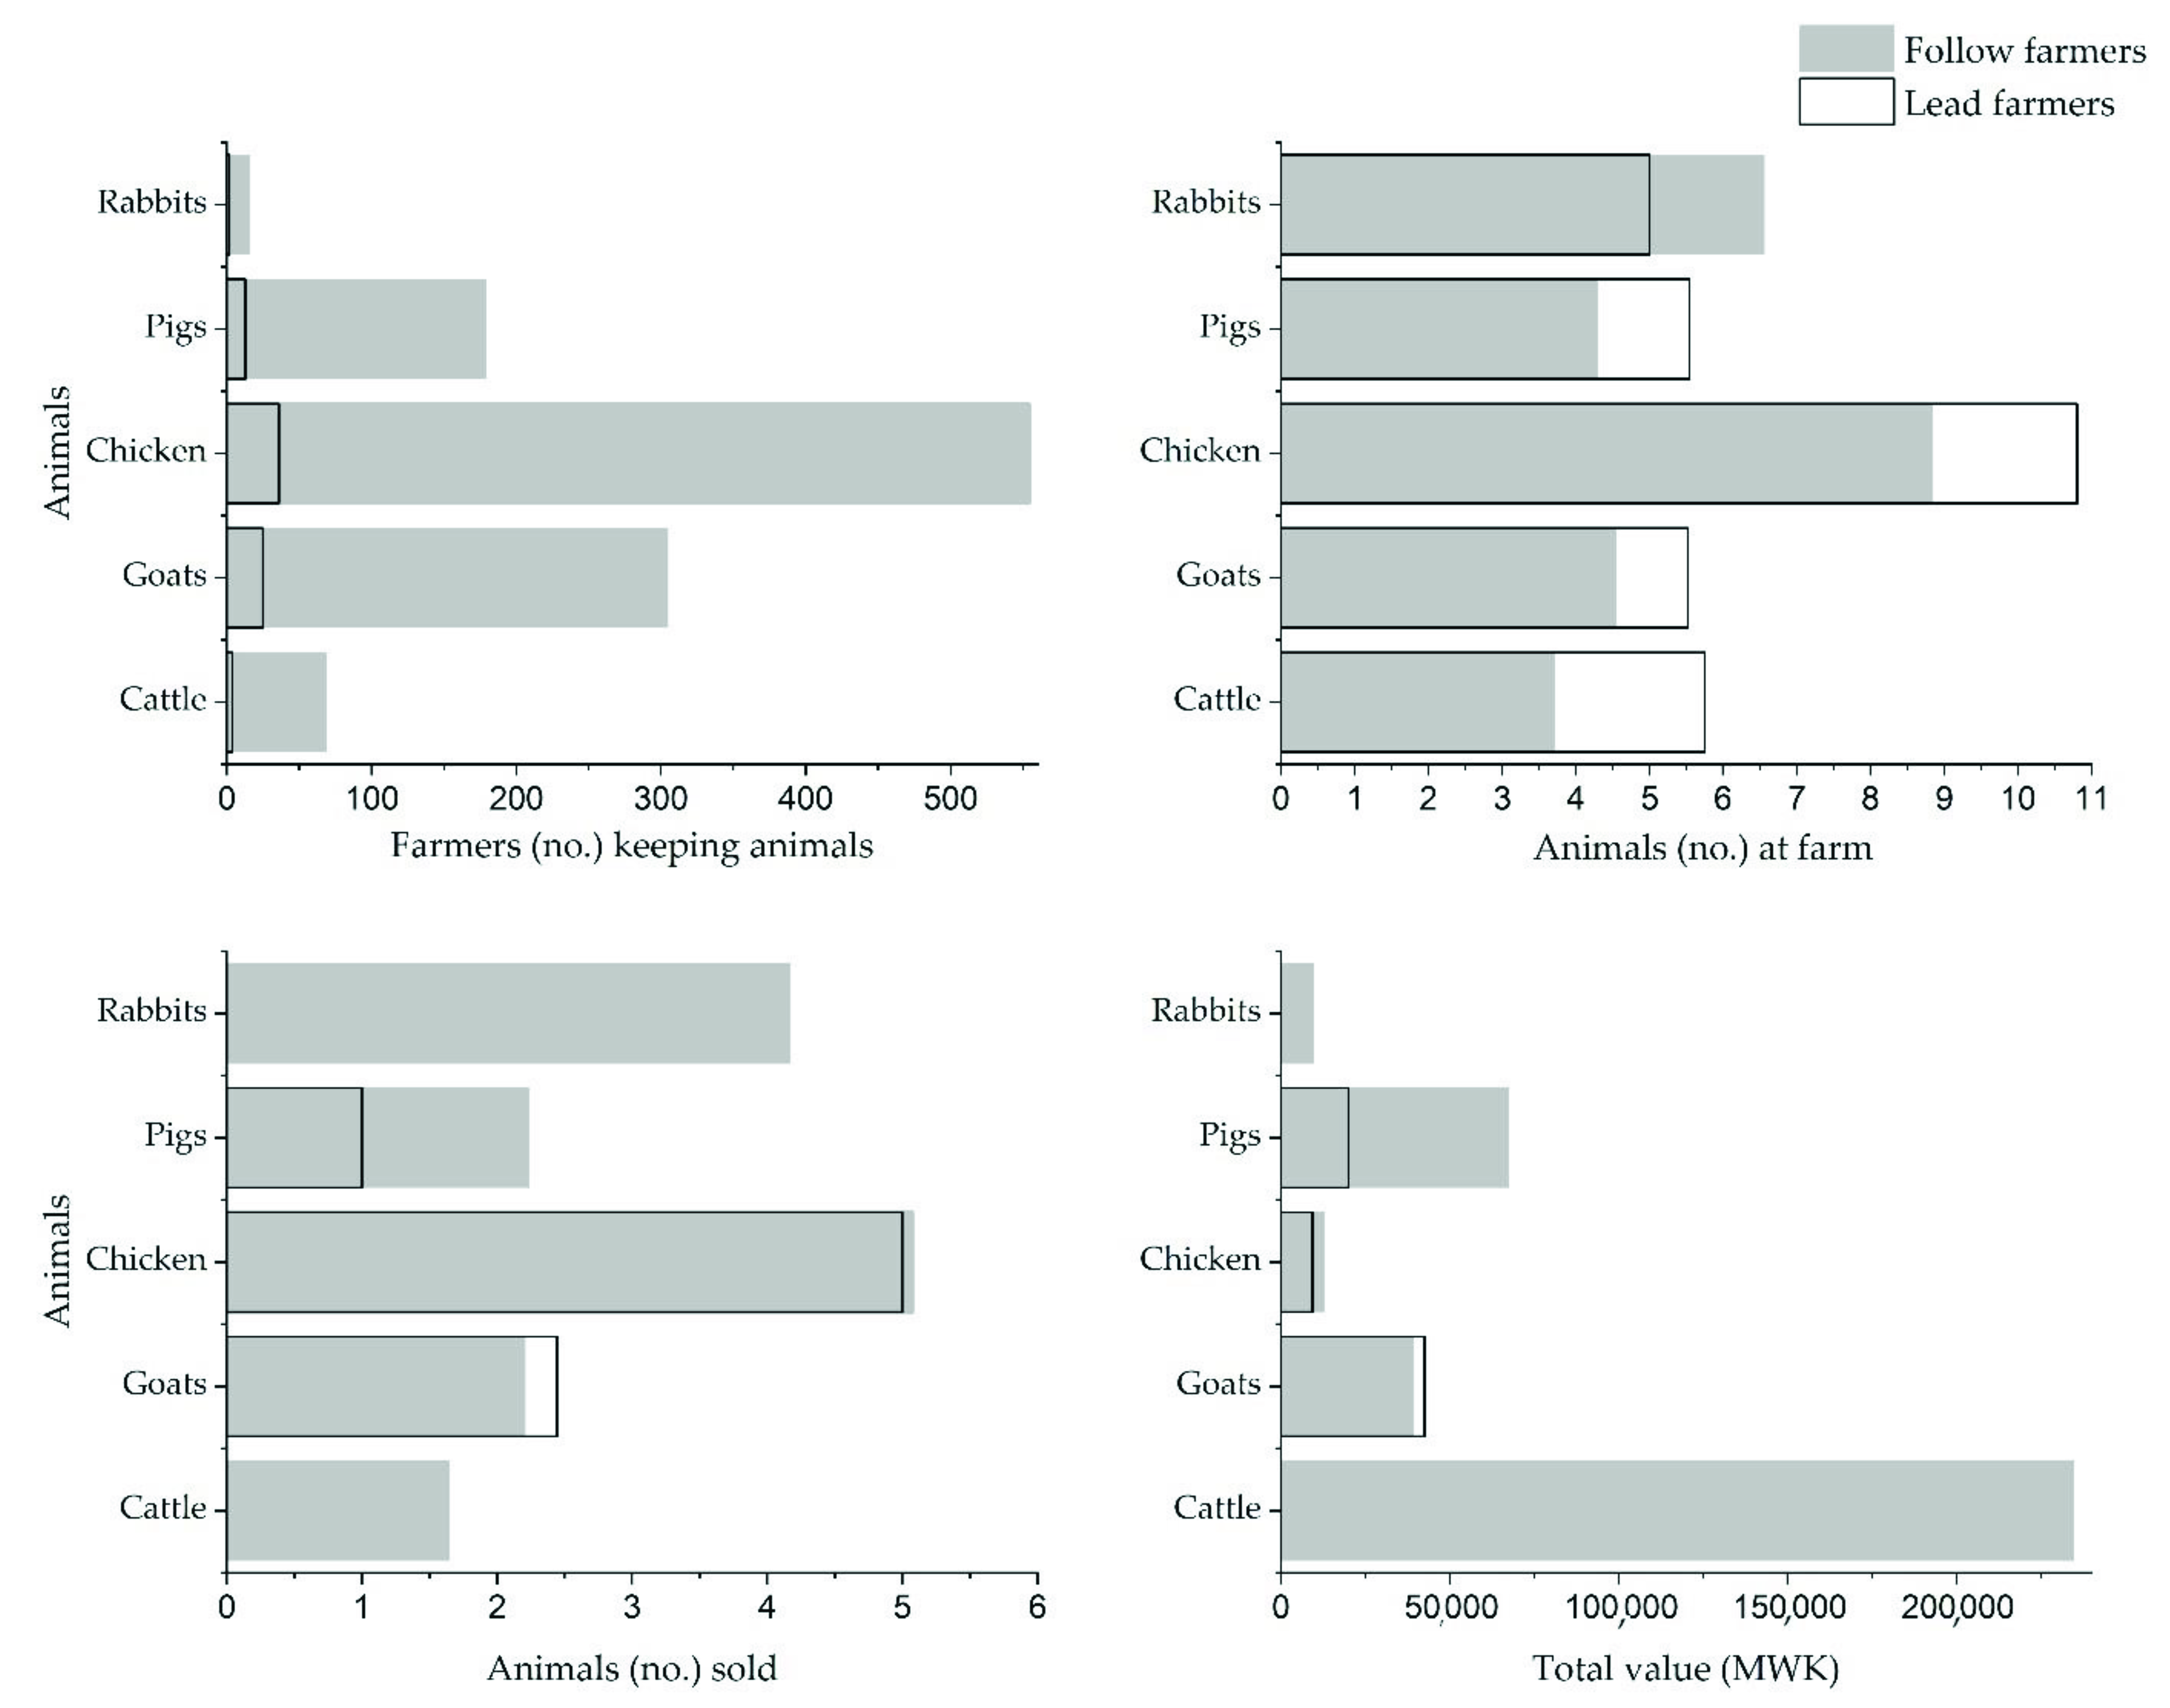
3.2. Livestock Ownership, Sales of Livestock and Livestock Products

Livestock provides an important component of the livelihoods of smallholder households (Figure 2). Different classes of livestock were found, including dairy cattle, crossbred goats (local goats and Boer goats), guinea fowls, rabbits, and crossbred chickens (local chicken with Black Australorp). The prevalence of each of these classes in each district was assessed.
Overall, 67% of the households owned some type of livestock (Table 3). In Rumphi, this figure was 81%, in Mzimba North, 78%, and in Mzimba South, 71%. In contrast, only 92 (45%) of the 205 respondents in Mchinji owned livestock. The communities reported that the variation in livestock numbers is largely due to drought and the incidence of diseases, such as Newcastle disease in chickens. For example, households sold a high proportion of their livestock in the second half of 2019 because of major feed shortages and a lack of market infrastructure, poor veterinary services, and access to improved breeds. An overview of livestock ownership is shown in Figure 2.
The majority of livestock holders (85.2%) owned only one or two kinds of livestock, while 14.1% of farmers were able to generate income from 3–4 different classes of livestock. A very small proportion (0.7%) owned five or more livestock types (Figure 2). Among all districts, farmers from Rumphi, Mzimba South and Dowa districts owned the highest livestock numbers.

3.2.1. Livestock Sale

Livestock sale was widespread across the sampled districts, with slightly over 60% of the respondents owned livestock and/ or had livestock sold in the past 12 months. Among smallholder farmers that owned livestock in the respective districts, livestock sales were the most common in Dowa (67%), Mchinji (62%), Rumphi (61%) and Kasungu (61%), and the least common in Mzimba (54%).
A reason for livestock sales being somewhat more common in Dowa and Rumphi (close to the central and northern capitals, respectively) could be that a number of fast-growing trading centers (such as Mponela) are located there, offering an active and competitive livestock market for farmers. Dowa is also closer to the capital city of Lilongwe, while Rumphi is closer to the northern capital of Mzuzu, where restaurants and hotels have a high demand for local chicken and cattle meat. Farmers in other districts sold chickens and other livestock during the lean dry season (February–March) to be able to buy staple foods to feed their families.

3.2.2. Livestock Product Sale

Livestock products were milk, meat and eggs, with Rumphi district being a leading source of these to service the growing market in Mzuzu (the northern capital city) (Table 2). However, very few households (29 of 1131) reported selling livestock products.
The livestock ownership and sale of livestock in each district are presented in Table 3.

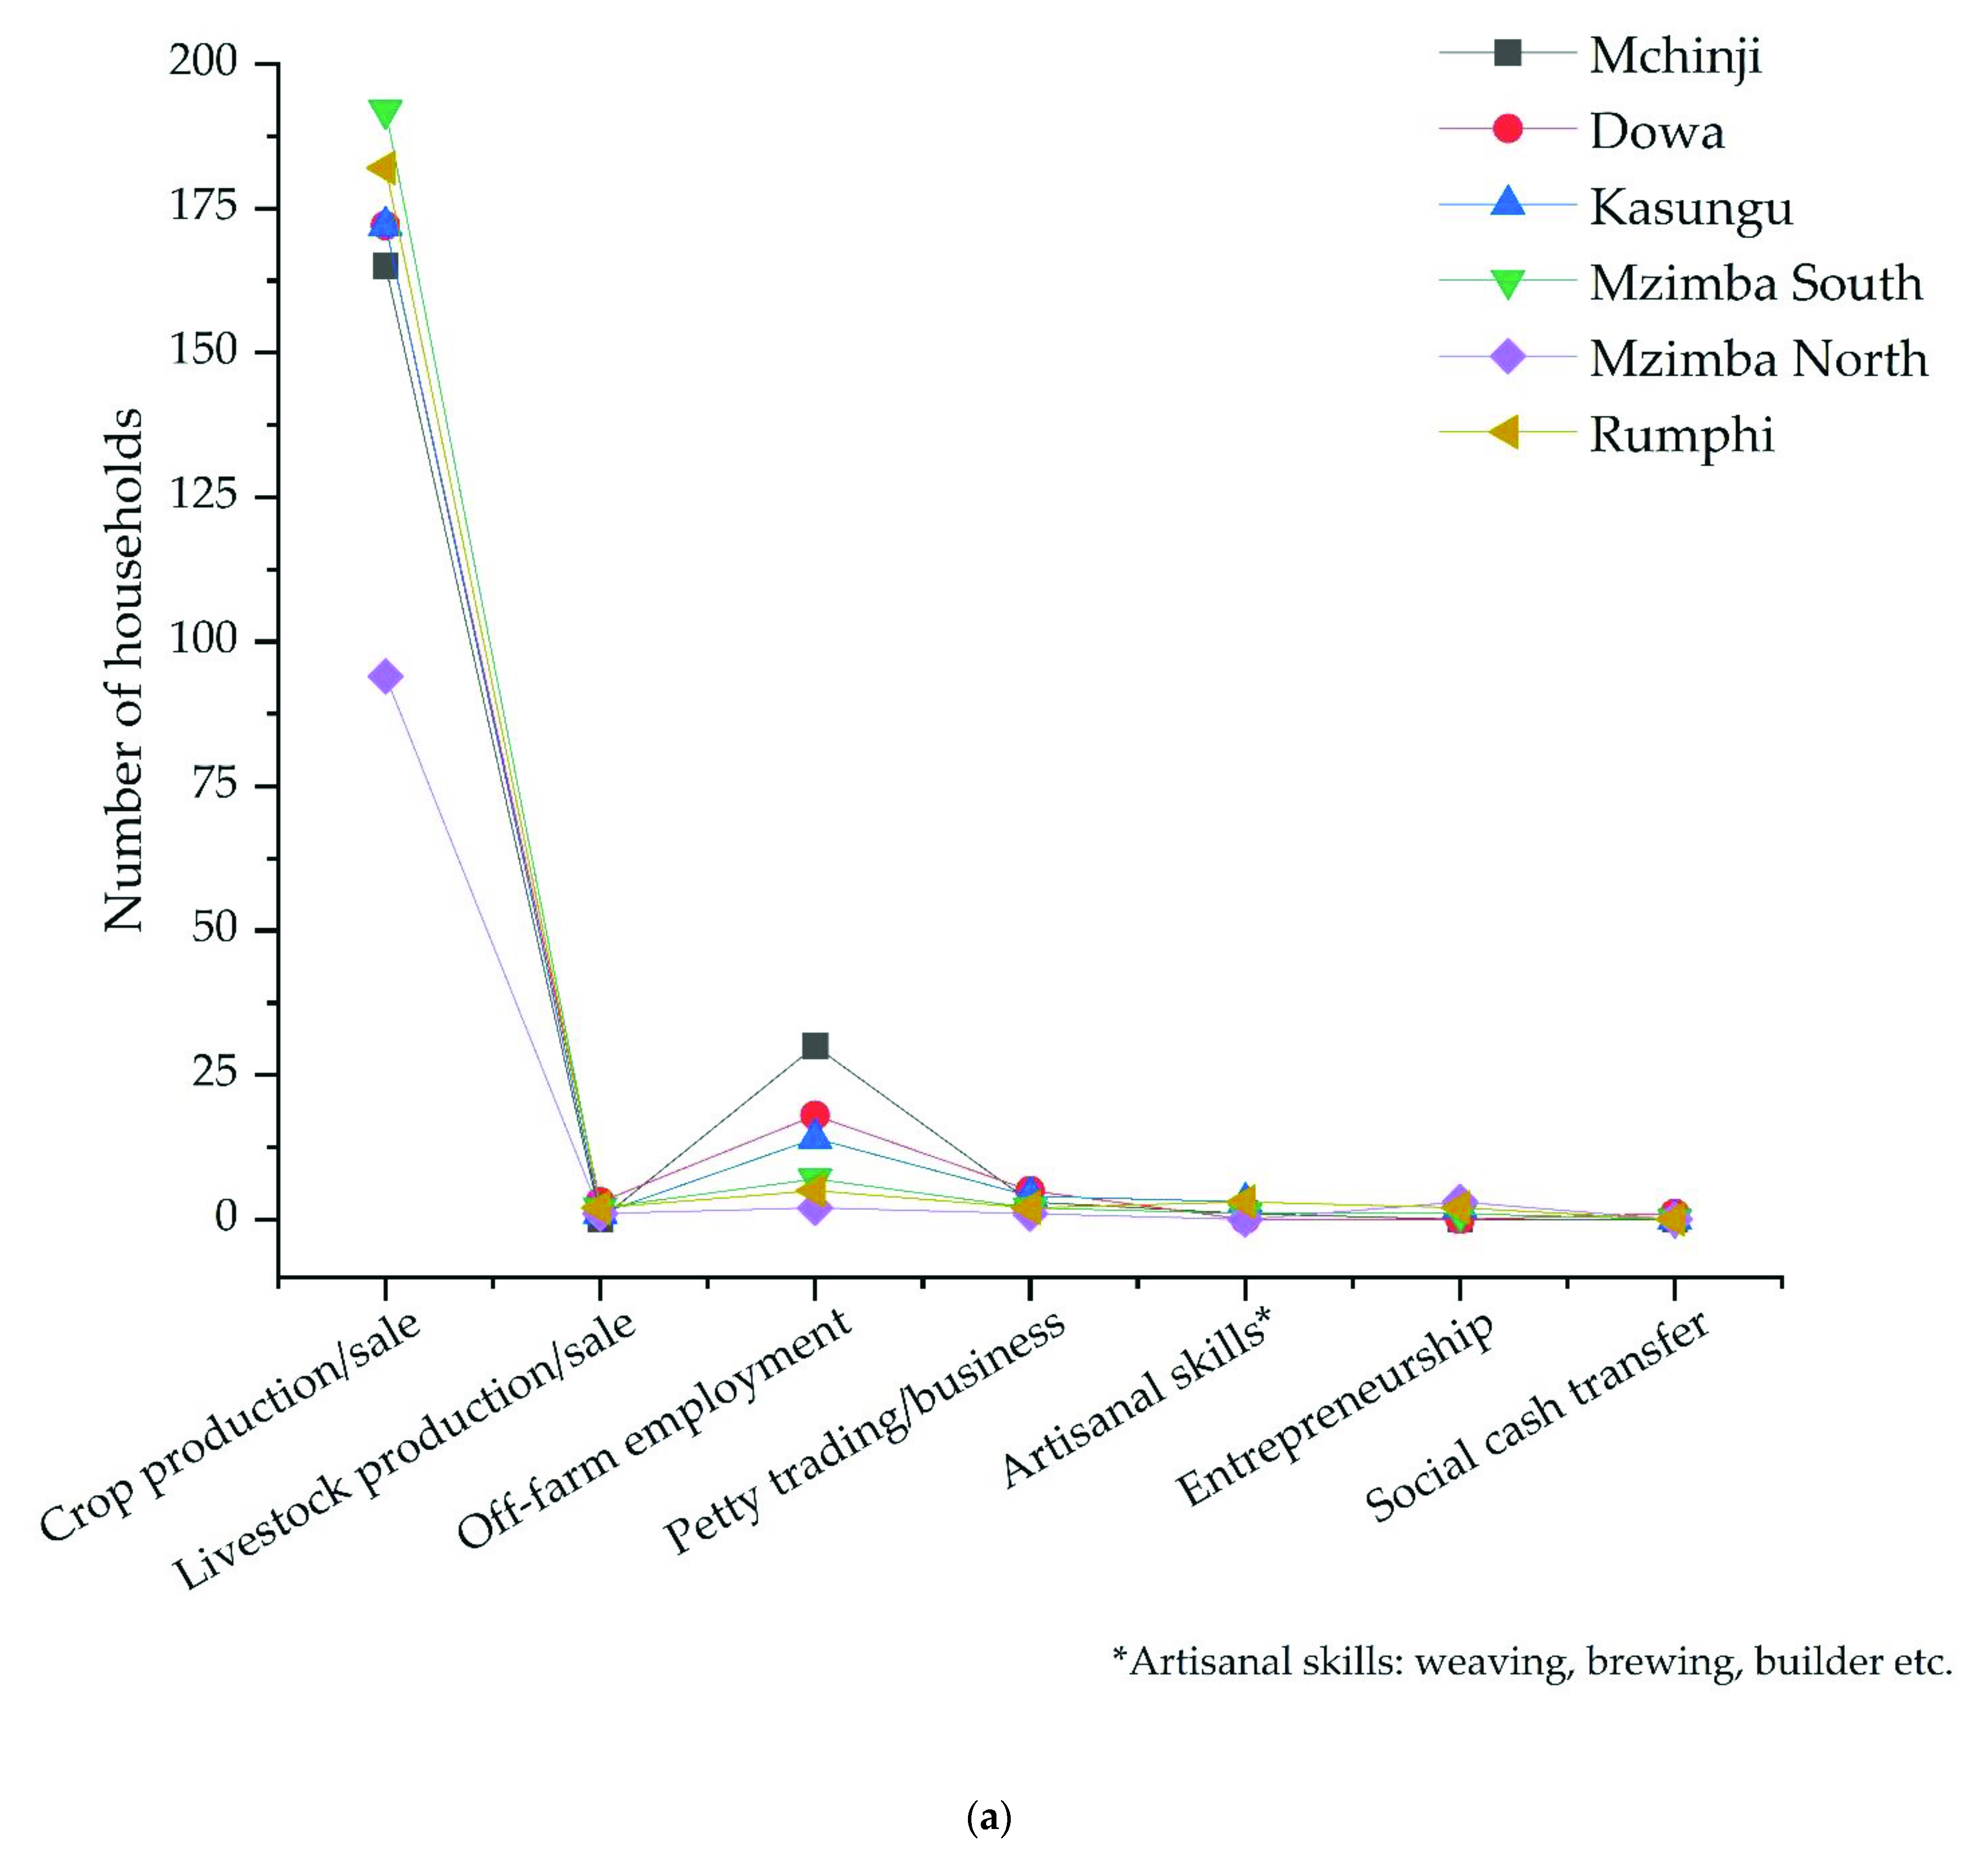
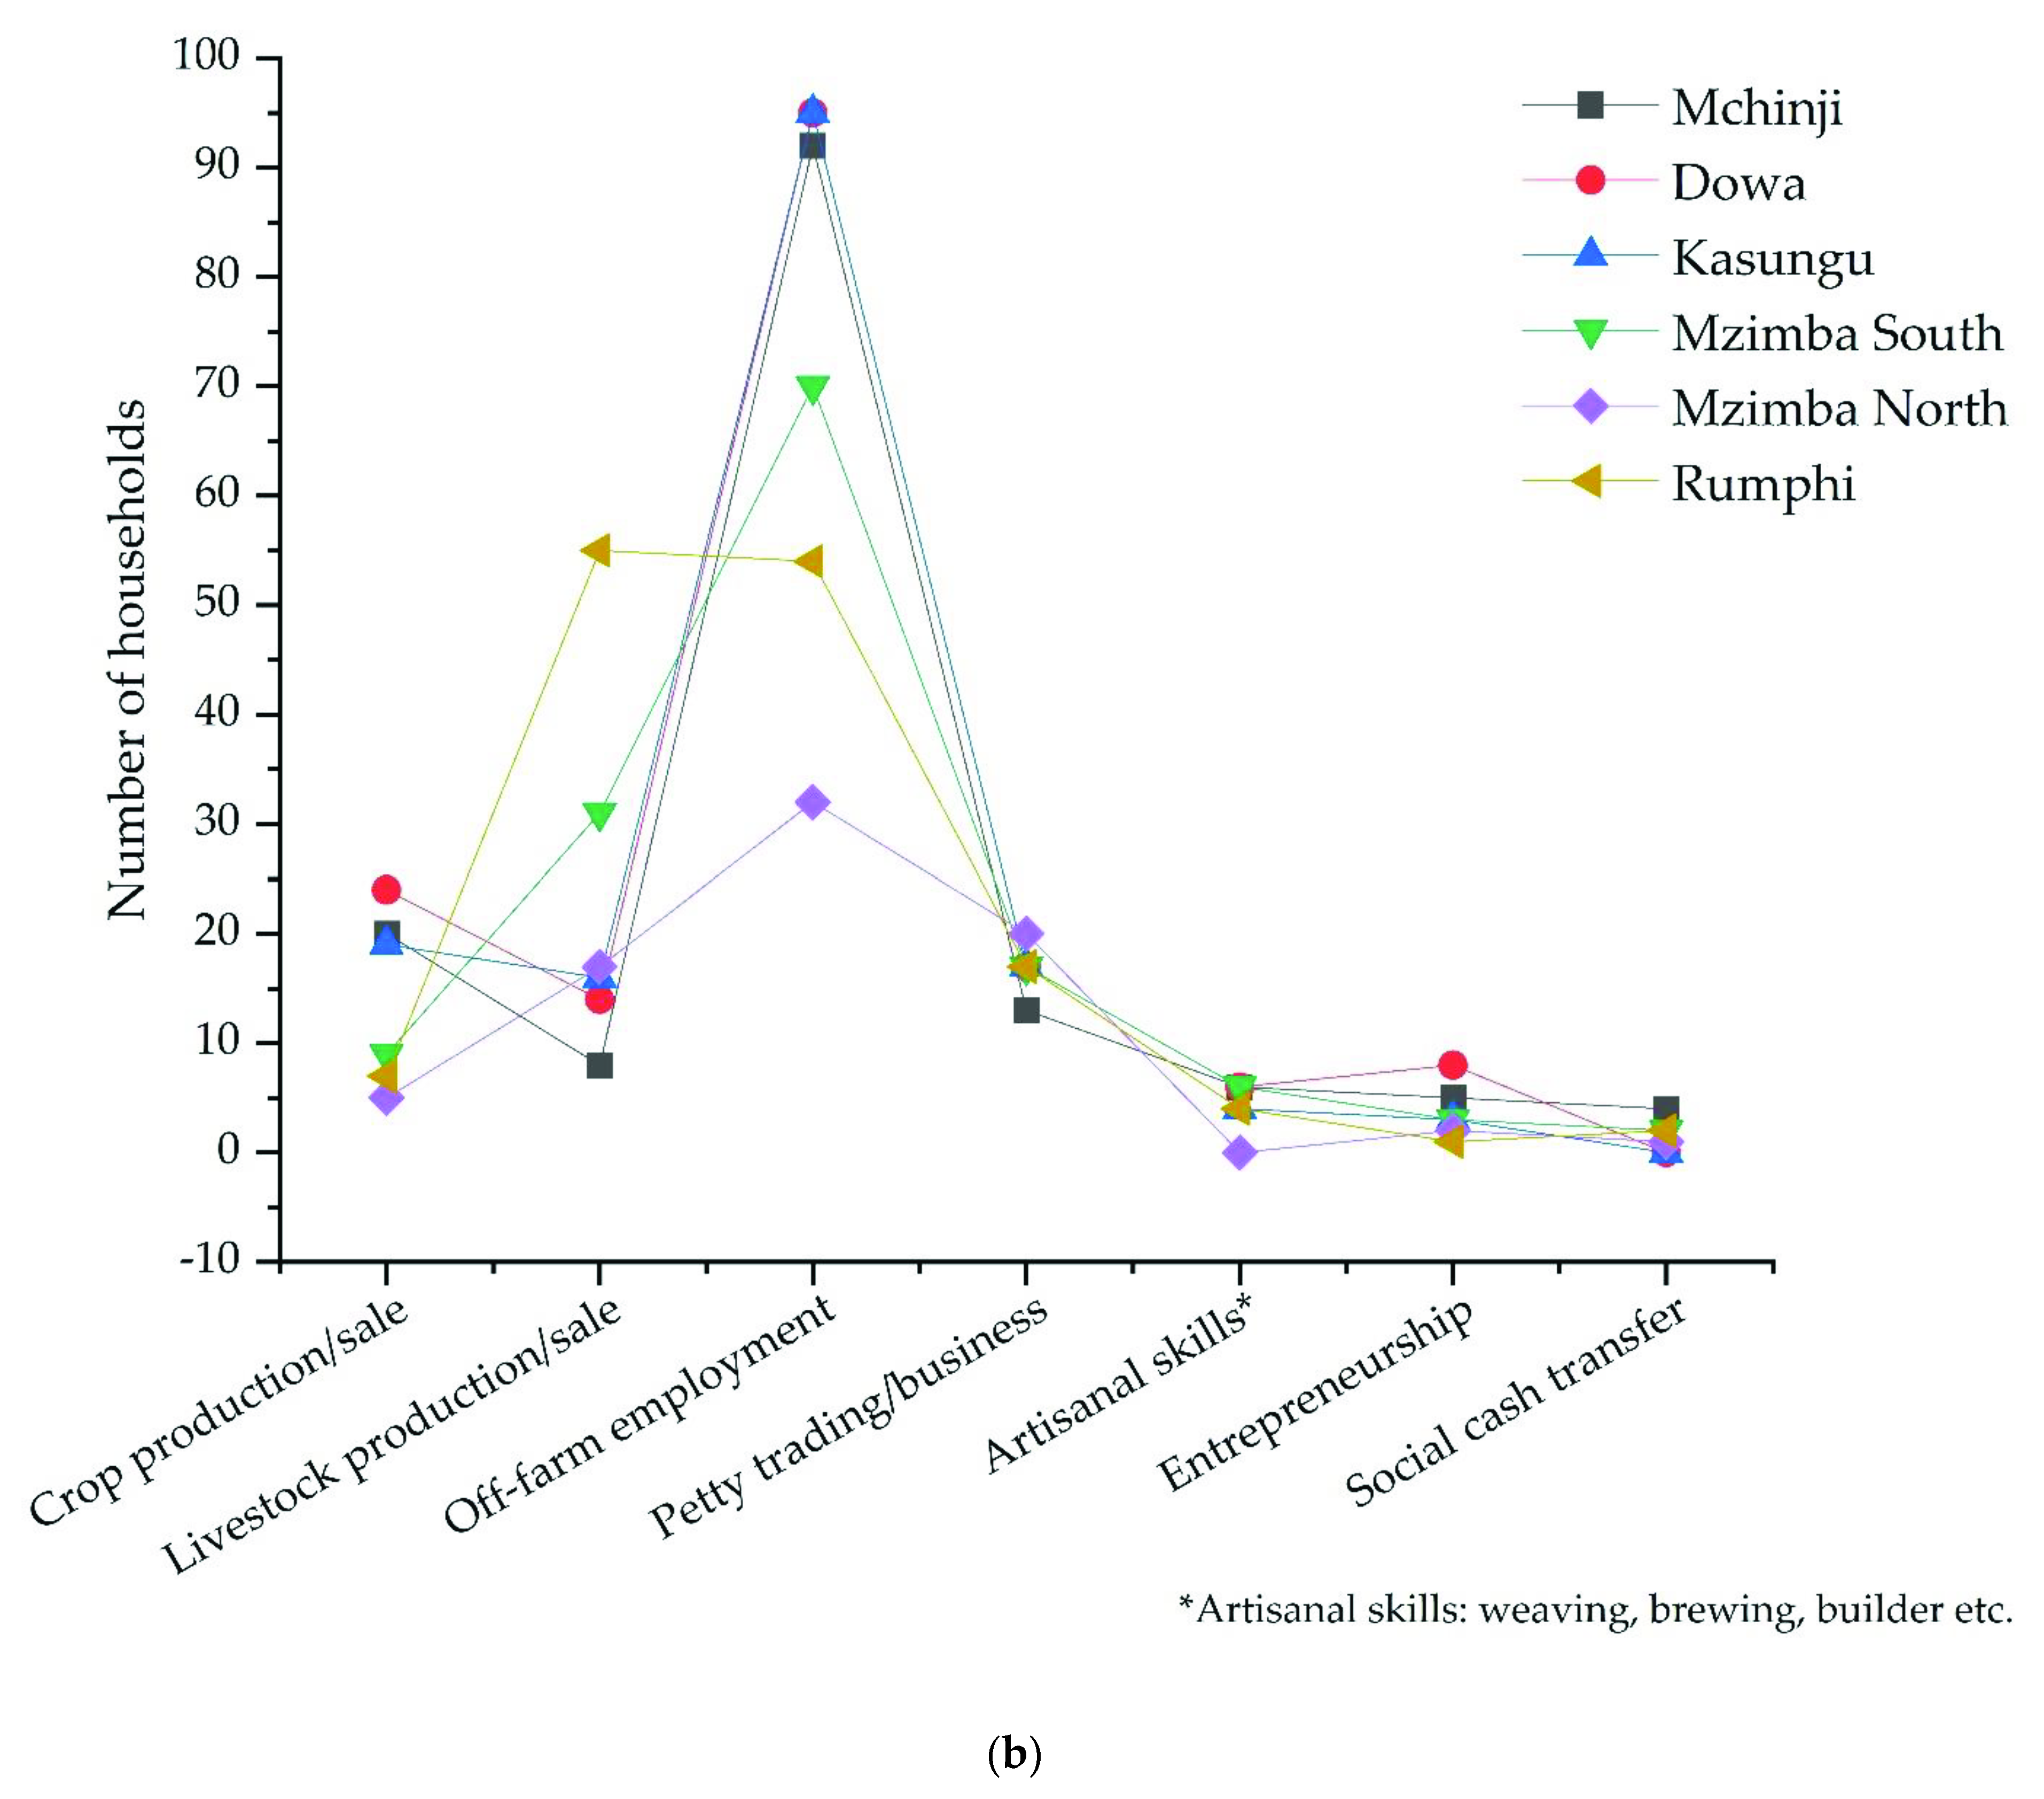
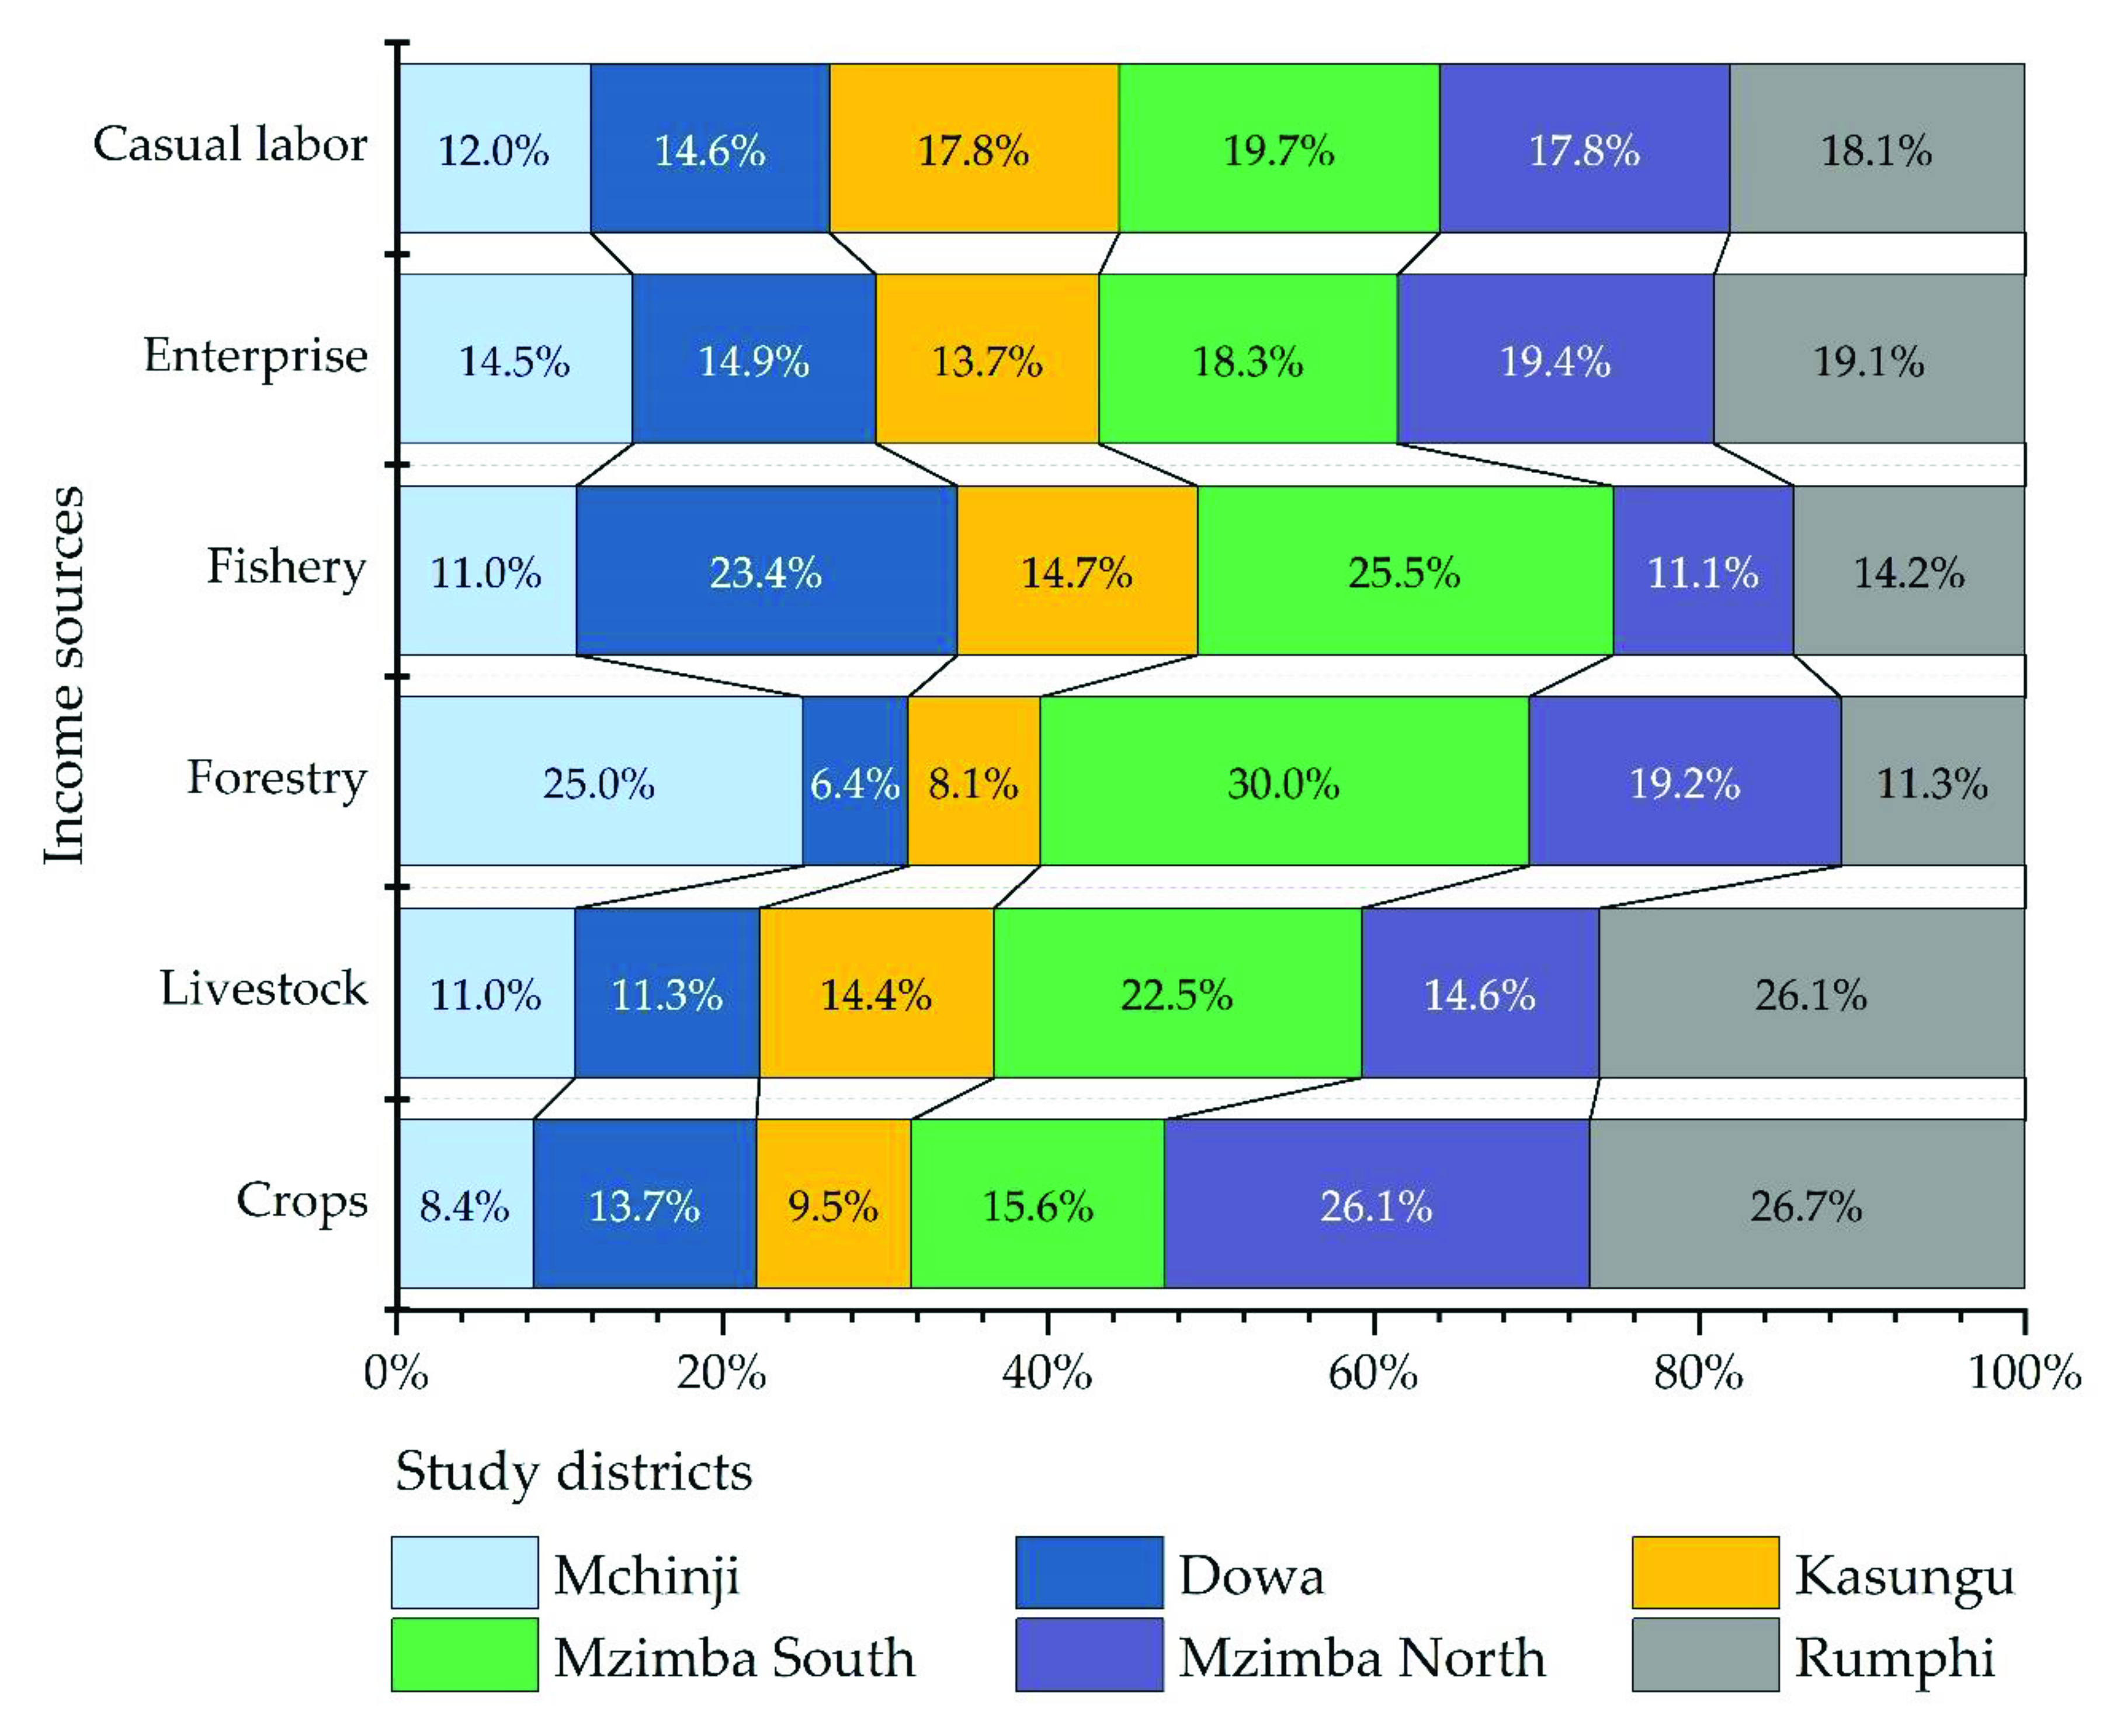
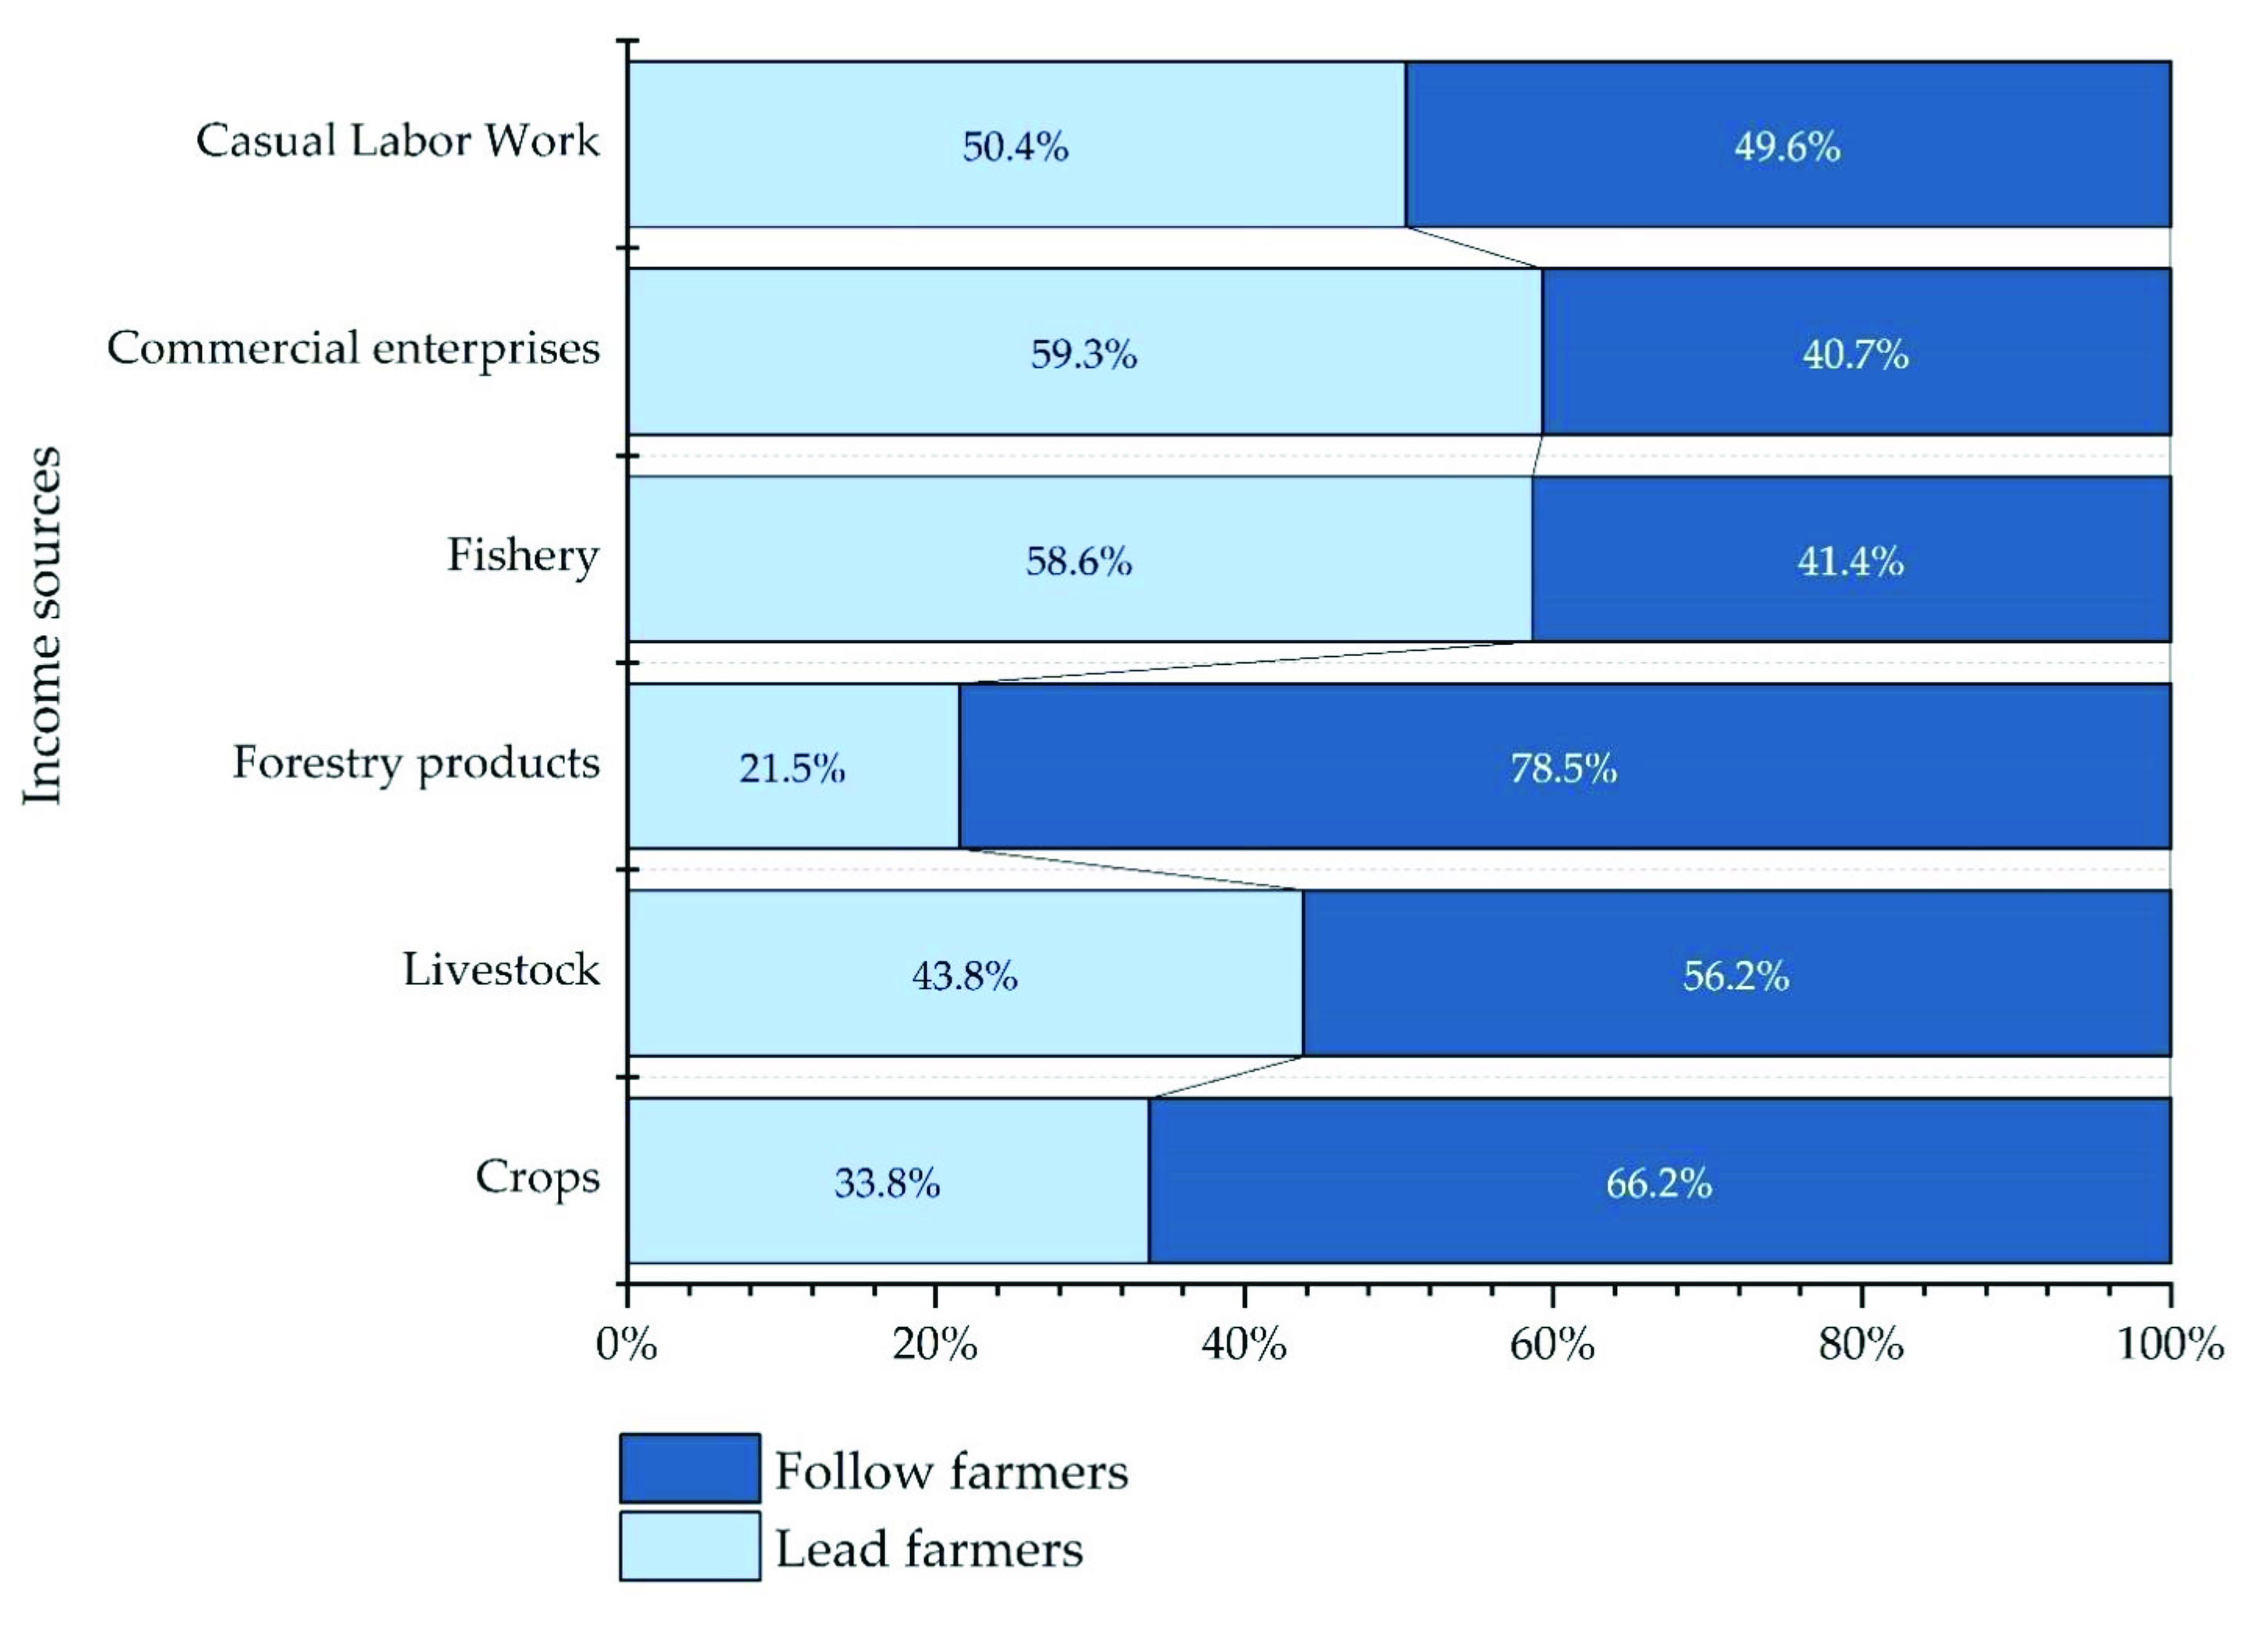
3.3. Important Sources of Income for Malawian Smallholder Farmers

The smallholder farmers were asked to prioritize their sources of income to support their livelihoods, such as crop production and sale, livestock rearing and sale, off-farm employment, petty trading/business, artisanal skills, entrepreneurship, and social cash transfer. The majority of the respondents ranked “crop production/sale” as the most important source of livelihood, followed by “off-farm employment” and “livestock production/sale” (Figure 3). Within the agri-production system, livestock was ranked as their second most important source of income.
Means of incomes per household from livestock (animals and products), forestry products, fishery and small business operations were not significantly different across districts (Table 4 and Figure 4). The farmers of Rumphi had the highest average income (MWK 257,138) from crops, which comprised 66% of their total income (MWK 387,934). People from Mzimba North and Rumphi districts derived more revenue from crops than farmers from Mchinji and Kasungu. In general, crops, fishery, and small businesses of any kind at the local level provided a higher income than other sources in all districts.

3.4. Mean Income Comparison between LFs and FFs Producing Crops and Vegetables

The incomes of Lead and Follow farmers were compared on the basis of average quantity produced (kg), average quantity sold (kg), unit sale price (MWK) and an average value of all the commodities (Figure 5). LFs were on average producing more of all crops and vegetables except sugarcane and banana. FFs were selling a larger quantity of cassava, banana, Irish potato, and sugarcane compared to LFs. There was a difference in the quantities of crops and vegetables produced and sold, which could be based on the fact that some agriproduct was consumed at home. FFs gained higher sale prices for vegetables, bananas, Irish potato, cassava, soya, groundnuts and sugarcane. The cumulative income from bananas, cassava, and sugarcane was higher for FFs, while for vegetables, sweet potatoes, Irish potato, maize, beans, groundnut, soya, and tobacco income was higher for LFs (Figure 5).

3.5. Mean Income Comparison between LFs and FFs Producing Livestock

For livestock numbers and income, among all the surveyed households, the proportion of FFs keeping livestock was higher than for LFs. LFs, in contrast, on average maintained larger herds, with the exception of rabbits. Both classes of farmers were selling more chickens. FFs were selling more rabbits, pigs and cattle, while LFs sold more goats. The cumulative income gained from animal sales was higher for FFs in the cases of rabbits, pigs and chickens, while LFs made more from goats (Figure 6). In particular, the average income gained from selling pigs for FFs was significantly higher than that of LFs (p = 0.0009; Table 5). An overview of the average income (in percent) comparison (between LF and FF) from various sources is presented in Figure 7.

3.6. Mean Income Comparison between LFs and FFs Having Income from Other Sources

Table 5 shows that income from most other sources and businesses was not significantly different between LFs and FFs. Significant differences were found for firewood (p = 0.0276) and beer-brewing (p = 0.0038).
Overall, LFs often had a wider range of income sources (6 vs. 4, p < 0.0001) and the cumulative income from all sources was significantly higher (469343 vs. 239837 MWK, p = 0.0006) than that of FFs (Table 5).
The utility of LFs as a mechanism for agricultural extension should facilitate knowledge transfer to a higher number of FFs and, thus, increase the adoption of best practices in any specific area. However, this study mostly showed that existing LFs were similar to the FFs and had not improved significantly in regard to adopting best practices. Ragasa [24] reported that the majority of smallholder farmers gave a good rating to all questions about production performance, including questions about the performance of LFs in terms of conveying messages, but a major discrepancy was found when LFs were double-checked for their adoption rate.
Due to their low adoption rate for best agricultural practices, there was not much difference between Lead and Follow farmers’ income from farm activities. However, the current study found statistically significant, higher total income (average) for LFs due to off-farm activities such as beer brewing (p = 0.003). This is consistent with the findings of Ragasa [24], and Holden, Fisher [25]. Ragasa [26] checked the effectiveness of the LF approach for technology awareness and adoption by modeling the data of 531 randomly selected LFs. To gain a higher adoption rate, LFs should adapt and implement the best practices on their farms (hence, receiving better economic gains) before conveying their messages to the FFs [26]. In the current study, higher income from off-farm activities revealed that LFs were not implementing best agricultural practices, resulting in lower profitability and less interest in farm activities. Rather than simply delivering “extension messages” to FFs via LFs or extension workers, the focus of the “Lead farmer extension approach” should be on boosting the adoption of best agriculture practices to have a long-term impact on smallholder livelihoods. As a result, when FFs will witness best practices being implemented in the field, they are more inclined to adopt them. Following that process, documenting the adoption of those best practices in the form of “success stories” will have a ripple effect, resulting in increased adoption by the FFs.
Additionally, it is understood that since (in the case of Malawi) the majority of the LFs and FFs are illiterate, concise and innovative, visualized messages, such as diagrams and storytelling, should be used consistently and as often as possible. The purpose of all research-based extension messages and other interventions is to improve production, profitability, and livelihoods. Research institutes are vital to the development of extension materials and protocols, keeping in mind the priority areas of smallholders for extension. Therefore, based on the results (Figure 5 and Figure 6), a strong focus should be placed on linking smallholders with the private sector to increase the profitability of agriproducts. This is the first study of its kind from Malawi that highlights the importance of farmer activities in maintaining the sustainability of their farming enterprises, particularly for small-scale farmers and especially in terms of coping with climate change and increasing production and profitability. The model could be replicated in developing countries where the majority of the population lives in rural areas and where agriculture contributes a significant portion of the country’s GDP.
This baseline study serves as a foundation for potential future interventions across Malawi’s five districts as part of the TRANSFORM program initiative (2020–2024). A follow-up study should be conducted with a greater emphasis on the linkages established between smallholders and operators in the private sector to improve their livelihoods.

4. Conclusions

The surveyed smallholder households were subsistence farmers with limited direct market orientation and access. Crops, vegetables, and livestock production are all important for smallholders’ livelihoods, and some agriproducts are consumed in the smallholders’ household. Adopting best practices to increase agriproduct production will increase sales and, thus, profitability. A significant portion of respondents did not report any sales whatsoever. The sales of both raw and value-added products are often lacking. Among the farm activities, crops were the most important, followed by livestock and off-farm work. Groundnuts, soya beans and maize were essential cash crops when considering both the quantities produced and the market price value. For livestock, cattle production gave the highest return, followed by pigs, goats, and poultry. Farmers mostly sold live animals, but not their produce (meat, milk, processed commodities). Thus, there is an absence of product value-addition and contemporary production skills. The focus should be on commodities that bring the highest income for smallholders, coupled with a needs assessment, systems approaches and farmer-participatory decision making. Farmers rely on a diverse range of products for their livelihood; rather than promoting specific interventiaons, the emphasis should be on the whole-farm approach. The focus of the “Lead farmer extension approach” should be on the adoption of best practices and increasing the long-term impact on smallholders’ livelihoods. Furthermore, there is a need to tailor research-extension messages to accommodate the limited education of the farmers.

Author Contributions

Conceptualization, M.A.B., S.S.G., R.H.L.I., C.K., H.H., P.C.W., T.Å. and L.O.E.; methodology, M.A.B., L.J.B., M.L., C.K., H.H. and L.O.E.; software, M.A.B., S.S.G. and R.H.L.I.; validation, M.A.B., S.S.G., R.H.L.I. and T.Å.; formal analysis, M.A.B., S.S.G. and R.H.L.I.; investigation, M.A.B., C.K., H.H. and L.O.E.; resources, H.H. and L.O.E.; data curation, M.A.B., S.S.G. and R.H.L.I.; writing—original draft preparation, M.A.B., S.S.G., L.O.E., H.H. and T.Å.; writing—review and editing, M.A.B., S.S.G., L.O.E., P.C.W., C.K., H.H., L.J.B., M.L. and T.Å.; visualization, M.A.B., S.S.G. and L.O.E.; project administration, L.O.E. and H.H.; funding acquisition, L.O.E. and H.H. All authors have read and agreed to the published version of the manuscript.

Funding

This research was funded by the Royal Norwegian Embassy, Lilongwe Malawi, funded project “TRANSFORM”, grant number TRANSFORM and “The APC was funded by TRANSFORM (NMBU)”.

Institutional Review Board Statement

The study was conducted according to the guidelines of General Data Protection Regulation (GDPR), and approved by Kirk Development Research and Training Consultant, Plot No. 47/2/378, Lilongwe Malawi. (Baseline study for TRANSFORM program, 26 July 2020).

Informed Consent Statement

Informed consent was obtained from all subjects involved in the study.

Data Availability Statement

The data presented in this study are available on request from the corresponding author. TRANSFORM program has all the rights and ownership of all data collected in this study.

Acknowledgments

The authors would like to express their gratitude to the TRANSFORM program consortium members: Norwegian Church Aid (NCA), Development Fund (DF) and Norwegian University of Life Sciences (NMBU). The authors are grateful to the donor, the Royal Norwegian Embassy in Lilongwe, Malawi, for funding the TRANSFORM program. Furthermore, the authors would like to thank all of the anonymous smallholder farmers who took part in this study and Kirk Development Research and Training Consultant for data collection. Finally, the authors would like to thank all Lilongwe University of Agriculture and Natural Resources (LUANAR) colleagues who were involved in this study. The authors are grateful for the valuable comments from all the anonymous reviewers.

Conflicts of Interest

The authors declare no conflict of interest.

References

  1. Del Ninno, C.; Dorosh, P.A.; Subbarao, K. Food aid, domestic policy and food security: Contrasting experiences from South Asia and sub-Saharan Africa. Food Policy 2007, 32, 413–435. [Google Scholar] [CrossRef]
  2. Ellis, F.; Kutengule, M.; Nyasulu, A. Livelihoods and rural poverty reduction in Malawi. World Dev. 2003, 31, 1495–1510. [Google Scholar] [CrossRef]
  3. Lowder, S.K.; Skoet, J.; Raney, T. The number, size, and distribution of farms, smallholder farms, and family farms worldwide. World Dev. 2016, 87, 16–29. [Google Scholar] [CrossRef] [Green Version]
  4. Altieri, M.A.; Koohafkan, P. Enduring Farms: Climate Change, Smallholders and Traditional Farming Communities: Third World Network (TWN). 2008. Available online: http://agroeco.org/wp-content/uploads/2010/11/Enduring-farms.pdf (accessed on 2 July 2021).
  5. Otte, M.; Chilonda, P. Cattle and Small Ruminant Production Systems in Sub-Saharan Africa. A Systematic Review . Livestock Information Sector Analysis and Policy Branch, FAO Agriculture Department. 2002. Available online: http://www.fao.org/3/y4176e/y4176e.pdf (accessed on 10 July 2021).
  6. Singh, R.; Kumar, P.; Woodhead, T. Smallholder farmers in India: Food security and agricultural policy. RAP Publ. 2002, 3, 20–27. [Google Scholar]
  7. Klinedinst, P.L.; Wilhite, D.A.; Hahn, G.L.; Hubbard, K.G. The potential effects of climate change on summer season dairy cattle milk production and reproduction. Clim. Chang. 1993, 23, 21–36. [Google Scholar] [CrossRef] [Green Version]
  8. Frenken, K. Irrigation in Africa in Figures: AQUASTAT Survey, 2005: Food & Agriculture Organization. 2005. Available online: https://agris.fao.org/agris-search/search.do?recordID=SO2005100059 (accessed on 12 June 2021).
  9. O’Reilly, C.M.; Alin, S.R.; Plisnier, P.-D.; Cohen, A.S.; McKee, B.A. Climate change decreases aquatic ecosystem productivity of Lake Tanganyika, Africa. Nature 2003, 424, 766–768. [Google Scholar] [CrossRef] [PubMed]
  10. United Nations. World Population Prospects 2019. Available online: https://population.un.org/wpp/ (accessed on 19 May 2021).
  11. World Bank Data. World Bank Country and Lending Groups. Available online: https://datahelpdesk.worldbank.org/knowledgebase/articles/906519 (accessed on 19 May 2021).
  12. World Bbank. DataBank. Available online: https://databank.worldbank.org/home.aspx (accessed on 19 May 2021).
  13. Malawi. 2006. Available online: http://www.fao.org/ag/agp/agpc/doc/counprof/malawi/Malawi.htm (accessed on 14 November 2016).
  14. The UN NEWS Centre. Malawi Must Reassess Its Agricultural Policies to Break Cycle of Poverty 2013. Available online: http://www.un.org/apps/news/story.asp?NewsID=45467 (accessed on 12 July 2021).
  15. Banda, J.W. Revolutionalising the Livestock Industry in Malawi. In Proceedings of the 12th University of Malawi Inaugural Lecture, Crossroads Hotel, Lilongwe, Malawi, 7 November 2008. [Google Scholar]
  16. Menon, R. Famine in Malawi: Causes and Consequences. Occassion Paper Human Development Report Office. Available online: http://hdrundporg/en/reports/global/hdr2007-2008/papers/menon_roshni_2007a_malawipdf (accessed on 10 June 2021).
  17. You, L.; Ringler, C.; Wood-Sichra, U.; Robertson, R.; Wood, S.; Zhu, T. What is the irrigation potential for Africa? A combined biophysical and socio-economic approach. Food Policy 2011, 36, 770–782. [Google Scholar] [CrossRef] [Green Version]
  18. Morton, J.F. The impact of climate change on smallholder and subsistence agriculture. Proc. Natl. Acad. Sci. USA 2007, 104, 19680–19685. [Google Scholar] [CrossRef] [PubMed] [Green Version]
  19. Davis, K. Extension in sub-Saharan Africa: Overview and assessment of past and current models and future prospects. J. Int. Agric. Ext. Educ. 2008, 15, 15–28. [Google Scholar]
  20. Chabata, I.; de Wolf, J. The lead Farmer Approach: An Effective Way of Agricultural Technology Dissemination. International Centre Tropical Agriculture, Putting Nitrogen Fixation to Work for Smallholder Farmers in Africa. 2013. Available online: https://www.n2africa.org/sites/default/files/N2Africa%20Poster%20Isaac%20.pdf (accessed on 12 June 2021).
  21. Fisher, M.; Holden, S.T.; Thierfelder, C.; Katengeza, S.P. Awareness and adoption of conservation agriculture in Malawi: What difference can farmer-to-farmer extension make? Int. J. Agric. Sustain. 2018, 16, 310–325. [Google Scholar] [CrossRef]
  22. Regine, A. The Impact of the Lead Farmer Extension Approach Implemented by the Development Fund of Norway in Malawi; FNI Report 5/2019; Fridtjof Nansen Institute: Lysaker, Norway, 2019. [Google Scholar]
  23. Creative Research Systems. Sample Size Formulas for Our Sample Size Calculator. Available online: https://www.surveysystem.com/sample-size-formula.htm (accessed on 1 May 2020).
  24. Ragasa, C. Effectiveness of the lead farmer approach in agricultural extension service provision: Nationally representative panel data analysis in Malawi. Land Use Policy 2020, 99, 104966. [Google Scholar] [CrossRef]
  25. Holden, S.T.; Fisher, M.; Katengeza, S.P.; Thierfelder, C. Can lead farmers reveal the adoption potential of conservation agriculture? The case of Malawi. Land Use Policy 2018, 76, 113–123. [Google Scholar] [CrossRef]
  26. Ragasa, C. Modeling the Effectiveness of the Lead Farmer Approach in Agricultural Extension Service Provision: Nationally Representative Panel Data Analysis in Malawi: Intl Food Policy Res Inst; International Food Policy Research Institute: Washington, DC, USA, 2019. [Google Scholar]
Figure 1. Map of Malawi: The study area districts (Mchinji, Dowa, Kasungu, Mzimba and Rumphi) for the survey are shown by red-colored stars.
Sustainability 13 09599 g001
Figure 2. An overview of livestock ownership in study districts, as reported by the surveyed smallholders.
Sustainability 13 09599 g002
Figure 3. (a) Ranking of smallholder livelihood sources: The first most important source of livelihood for surveyed smallholding households (n = 1096) from all study districts in Malawi. (b) Ranking of smallholder livelihood sources: the third most important source of income for surveyed smallholder households (n = 290) across all study districts in Malawi. (c) Ranking of smallholder livelihood sources: the third most important source of income for surveyed smallholder households (n = 290) across all study districts in Malawi.
Sustainability 13 09599 g003aSustainability 13 09599 g003bSustainability 13 09599 g003c
Figure 4. The average percentage of income from various sources, as reported by smallholder farmers in Malawi’s five surveyed districts.
Sustainability 13 09599 g004
Figure 5. A comparison of income sources for Follow farmers and Lead farmers measured as average quantity produced (kg), average quantity sold (kg), average unit price in Malawian Kwacha (MWK) (USD 1 = MWK 790), and average cumulative value (in MWK) from various crops and vegetables cultivated by smallholder farmers in all study districts in Malawi. Sugarcane values for Lead farmers were not reported.
Sustainability 13 09599 g005
Figure 6. A comparison of the number of livestock and poultry kept by Follow and Lead farmers (average for all farms), as well as the total sale value of animals in Malawian Kwacha (MWK) (USD 1 = MWK 790) across all study districts. Lead farmers’ cattle sales and total cattle value were not reported.
Sustainability 13 09599 g006
Figure 7. A comparison of Lead and Follow farmers in Malawi in terms of average income (in percent) from various sources, reported by smallholder farmers in all five surveyed districts.
Sustainability 13 09599 g007
Table 1. List of Extension Planning Areas (EPAs) 1.
District *EPAList of Sections in EPAs
MchinjiMkandaMkanda East, Mkanda North, Mkanda South, Mkanda Central
KaluluKalulu, Chitunda, Mchakanga, Mchakanga, Kapiri South
DowaMndoleraDzoole, Katchitsa, Lipili, Msese
MadisiKatalima, Kalonga A, Madisi A, Madisi B
KasunguLisasadziMponda West, Kasera, Kawamba North, Kawamba Central
KalulumaChamakala East, Chamakala West, Kamwalembo, Kaluluma Central
Mzimba South LuwereziLuwerezi, Ngoli, Chirawegu, Mphazi
ChamphiraChamphira Central, Chamanji, Luviri, Kaulusi
Mzimba NorthEngucwiniEngucwini, Emayaleni, Madise
RumphiBoleroBolero, Lundu, Jallira, Chirambo
MhujuChimyanga, Phwamphwa, Mwakhunikira, Ng’onga
1 Sampled from the study districts, including section names from the respective EPAs. * Malawi has a four-tier administrative structure: agricultural development divisions (ADDs, 8), districts (28) and extension planning areas (EPAs, 187).
Table 2. Demographics of interviewed smallholder farmers, land, grown crops and vegetables, livestock owned, and products sold (from livestock and forestry).
DescriptionAll DistrictsMchinjiDowaKasunguMzimba SouthMzimba NorthRumphi
Number1131205218204206101197
Male468819591703794
Female66312412311313664103
Lead farms5612898811
Average land size (ha)2.72.52.82.932.32.7
Hire labor211233635412056
Grow crops and vegetables
Grow any crop1108199205201206101196
Tobacco224115622123390
Sugar cane15134322
Groundnut48811612078285294
Soya578891051391434755
Beans10265556624
Maize109819621119820399191
Cassava3231113311
Irish potato533204512
Sweet potato2791419314312160
Banana11202313
Vegetables119241617251918
Spice6000006
Own livestock
Cattle73871123222
Goats330446953533873
Sheep4102010
Chicken5905911510411764131
Pigs19252934581353
Rabbits18425142
Sell products (livestock and forest)
Milk6021201
Meat7100123
Eggs16253114
Timber17521414
Poles16442105
Firewood56518121164
Honey2000101
Mushroom3101100
Table 3. The number of farmers who reported owning and selling livestock of various types (on an annual basis) in the study districts listed. (MWK is the Malawian Kwacha, which is equivalent to 0.0012 USD).
Number of FarmersMchinjiDowaKasunguMzimba SouthMzimba NorthRumphiTOTAL
Farmers owning livestock9214112714779159745
1–2 livestock types8612910611971124635
3–4 livestock types6122125833105
5 or more 0003025
Farmers selling livestock579478804697452
Types of livestock
Farmers owning cattle87112322273
Number owned (average)1.92.92.63.85.05.53.6
Sale of cattle2561521747
Number of cattle sold (average)1.01.03.01.62.01.71.7
Total Value (MWK)190,000111,750240,000262,000520,000249,571262,220
Farmers owning goats446753533873328
Number owned3.93.64.04.75.16.24.6
Sale of goats345239372854244
Number of goats sold (average)1.72.12.32.12.42.72.2
Total Value (MWK)31,34431,50038,43736,70346,68453,50039,695
Farmers owning chickens (broiler)5910910411764131584
Number owned (average)8.37.77.49.58.011.68.7
Sale of chickens377762633879356
Number of chickens sold (average)4.55.34.75.44.95.35.0
Total Value (MWK)96168619985422,89411,01714,58312,764
Farmers owning pigs52734581353190
Number owned (average)1.62.34.65.02.95.33.6
Sale of pigs5202833631123
Number of pigs sold (average)4.31.81.62.71.32.12.3
Total Value (MWK)74,66636,55547,46193,69524,66665,18157,037
Table 4. Mean income from various sources for households (n = 1118) reporting such income across different districts. For each income source, mean values with different letters (a, b, c) are significantly different based on Tukey’s HSD test.
Income Source MchinjiDowaKasunguMzimba SouthMzimba NorthRumphiAll
Districts
CropsMean80,923 a131,476 ab91,658 a149,767 ab250,881 bc257,138 c151,688
SD215,411326,323140,433293,269776,823456,820378,396
(n)1992052012061011961108
LivestockMean19,409 a19,934 a25,460 a39,777 a25,848 a46,159 a30,956
SD50,54930,11263,419106,46765,875113,59481,850
(n)9314112714779160747
ForestryMean35,152 a9050 a11,412 a42,215 a26,971 a15,941 a24,028
SD118,11216,33217,43270,87616,8662234666,070
(n)25241622717111
FisheryMean171,000 a362,000 a227,983 a394,933 a172,400 a219,600 a260,233
SD131,256285,926306,643494,39092,955169,119289,992
(n)13101295655
Enterprise
(small business)
Mean120,660 a124,266 a113,518 a152,400 a161,422 a158,986 a136,586
SD196,437179,733145,886233,967213,949194,028193,008
(n)466756533551308
Casual laborMean25,871 a31,632 ab38,418 a42,619 b38,516 ab39,254 ab35,058
SD26,9883137645,5796224646,00968,21246,888
(n)1561561431166195727
TotalMean149,488 a228,590 ab178,559 a263,124 abc360,704 bc387,934 c351,333
SD266,924380,601224,569415,698802,816579,443452,026
(n)2052052042061011971118
Table 5. Mean income ( ± SD) in Malawian Kwacha (MWK) from Lead farmers and Follow farmers from June 2019 to June 2020. The sample sizes (households) are represented by the numbers in parentheses. The p-values are based on Welch’s two-sample t-test.
ProductLead Farmer ± SD (n)Follow Farmer ± SD (n)p-Value
Crops
Groundnuts49,575 ± 109,287 (26)31,009 ± 45,919 (457)0.3968
Irish potato87,375 ± 121,445 (2)62,344 ± 94,587 (51)0.8197
Maize35,687 ± 83,814 (56)15,669 ± 62,669 (1033)0.0835
Soya beans44,501 ± 46,962 (41)40,630 ± 57,737 (533)0.6195
SpiceNA82,700 ± 117,608 (6)NA
Sugarcane50,000 ± NA (1)48,485 ± 63,575 (14)NA
Sweet potato15,294 ± 28,964 (17)1,283,652 ± 26,249 (141)0.7422
Tobacco649,007 ± 730,522 (13)395,033 ± 682,512 (207)0.2434
Other crops *49,206 ± 128,413 (30)41,477 ± 110,432 (304)0.7523
Livestock
Eggs500 ± NA (1)12,880 ± 28,893 (15)NA
Meat120,000 ± NA (1)115,166 ± 93,317 (6)NA
MilkNA260,950 ± 241,782 (5)NA
CattleNA234,700 ± 140,262 (20)NA
Chickens9433 ± 13,806 (21)13,026 ± 26,441 (248)0.3049
Goats42,611 ± 35,298 (18)39,455 ± 38,165 (178)0.7233
Pigs20,000 ± 7071 (2)67,614 ± 99,888 (70)0.0009
Other livestock **7000 ± 5656 (2)7666 ± 6146 (15)0.8970
Forestry products
Firewood7650 ± 3457 (4)14,688 ± 17,320 (51)0.0276
MushroomNA56,300 ± 65,010 (4)NA
Poles15,250 ± 10,253 (2)7592 ± 8874 (13)0.4725
Seedlings10,000 ± NA (1)28,187 ± 41,629 (4)NA
Timber1600 ± 282 (2)72,266 ± 164,966 (15)0.1193
Other forestry ***1500 ± NA (1)8508 ± 5176 (12)NA
Fishery
Fish sales340,000 ± 197,989 (2)203,200 ± 123,904 (3)0.4986
Fish vending298,850 ± 347,695 (8)247,265 ± 292,878 (12)0.7025
Commercial enterprises
Artwork62,500 ± 24,748 (2)115,469 ± 16,2000 (3)0.1860
BarbershopNA151,000 ± 105,090 (4)NA
Beer brewing269,000 ± 26,870 (2)75,247 ± 102,006 (36)0.0038
Grocery business215,000 ± 177,974 (3)256,030 ± 296,670 (26)0.7483
Petty trading115,633 ± 46,671 (3)98,959 ± 81,400 (44)0.6138
Value-added products172,412 ± 203,048 (10)86,262 ± 119,171 (89)0.2182
Others ****307,500 ± 466,413 (4)152,410 ± 218,057 (84)0.5546
Casual laboring work
Laboring Work35,716 ± 48,514 (30)35,079 ± 46,867 (696)0.9443
Number of sources6 ± 2 (56)4 ± 1 (1062)<0.0001
Total income469,342 ± 594,435 (56)239,837 ± 440,628 (1062)0.0006
* Includes beans, cassava, rice, sorghum, banana, vegetables, and fruits. ** Includes sheep, rabbit, pigeon, ducks. *** Includes honey, wild fruits. **** Includes selling of charcoal and bicycle taxi.
Publisher’s Note: MDPI stays neutral with regard to jurisdictional claims in published maps and institutional affiliations.

