Article

Contribution of Earth Observation and Geospatial Information for Urban Planning of Historic Cities’ Centres: The Case Study of Nicosia, Cyprus

1
Department of Architecture, Built Environment and Construction Engineering, Politecnico di Milano, 20133 Milan, Italy
2
Department of Civil Engineering and Geomatics, Faculty of Engineering and Technology, Cyprus University of Technology, 3036 Limassol, Cyprus
3
Eratosthenes Centre of Excellence, 3036 Limassol, Cyprus
*
Author to whom correspondence should be addressed.
Sustainability 2021, 13(13), 7023; https://doi.org/10.3390/su13137023
Submission received: 10 May 2021 / Revised: 16 June 2021 / Accepted: 18 June 2021 / Published: 22 June 2021

Abstract

:
The Sustainable Development Goals (SDGs) of the United Nations state that cities and human settlements need to be more inclusive, safe and resilient. In Europe cities have experienced dramatic physical, social and economic changes during the last decades while historic centres of European cities, among the most important assets of the European cultural heritage, are living paradoxes. They are defined as “a collection of beauty, icon of well-being, model of sustainability, but abandoned”. This study investigates the changes in the urban landscape of Nicosia, a particular historical centre in the Mediterranean region (Cyprus). The city centre is characterised by exceptionally well-preserved Venetian fortifications. Due to political circumstances, the capital of Cyprus, Nicosia, is still divided and has been ruled by two different administrations for several decades. This study used optical multi-spectral satellite datasets processing, like the Landsat and the most recent Sentinel-2 products, to detect, identify and characterise significant morphological transformations within the walled city and around it. This paper’s central thesis promotes a more systematic use of earth observation products and derivatives in decision-making processes that regard planning, use and management of urban resources in Europe, especially in support of urban planning strategies of historic cities.

1. Introduction

“Sustainable cities and communities”, as Goal n. 11 of the United Nations’ (UN) Sustainable Development Goals (SDGs), states that cities and human settlements need to be more inclusive, safe and resilient [1]. In particular, Goal 11.3 mentions that inclusive and sustainable urbanisation and the capacity for participatory, integrated and sustainable human settlement planning and management in all countries should be enhanced by the end of this decade (2030).
The current study focuses on the dimension of cities, as these are exposed to the various transformations and changes resulting from socio-economic and other dynamic activities. During the last few decades, European cities have experienced physical, social and economic changes due to relocations, conflicts and economic crises [2]. At the same time, historic centres of European cities are considered as important elements of the European cultural heritage, which are affected by tourist pressure [3]. The assumption is that cities’ centres have been well-studied as they promote sustainability; however, the study of Pellegrini and Micelli [4] characterise them as living paradoxes, “a collection of beauty, icon of well-being, model of sustainability, but abandoned”.
A critical component for studying city centres and urban planning concerns geospatial data collection and management. A facilitated accessibility to this type of information is necessary for mapping the city centres’ diachronic changes and further planning and implementation of urban interventions. In order to ensure a sustainable urbanisation process and inclusive management for cities and regions, public administrations increasingly rely on structured geo-spatial information. Experts have defined spatial information as “one of the categories of public sector information of which exchange is particularly important” [5]. More specifically, geo-information produced by public authorities is often structured and made available through Spatial Data Infrastructures (SDIs). SDIs are increasingly conceived as the ‘geo-information technology realm’ of e-Government and linked to Government Digital Transformation [6]. In Europe, several directives have regulated initiatives that tackle the use and access to (geo) spatial information, like the Open Data Directive [7], replacing the Public Sector Information (PSI) Directive [8], and the INSPIRE Directive [9]. Benefits of geo-portals linked to publicly owned databases have been widely examined under aspects of economic and sustainable territorial development [10].
Geo-spatial information include data and products deriving from space-based technologies. This type of information is defined as “high-value” by the Open Data Directive, as these datasets can be re-used, with substantial benefits for society, the environment and the economy. This statement is true due to their suitability for creating added-value services and applications [7]. Earth observation (EO) data repositories, products and services are becoming increasingly accessible for research and commercial applications, providing access to freely distributed multi-spectral datasets; their use can be beneficial for urban planning practice at the same time.
Studies exploring the use of multi-spectral and multi-temporal imagery can be found in the literature [11,12,13], indicating the recent years’ trend of their exploitation for mapping purposes. Indeed, during the last few years, considerable work has been carried out on this research domain. A 2014 review regarding how remotely sensed data have been used in the past to understand the impact of urbanisation on global environmental change is presented in [14]. Urban growth-related imperviousness in Western Germany is presented by [15] following a classification strategy of archive multi-temporal Landsat data. Various spectral indices extracted from more than 90 Landsat images have been studied in regards to the phenomenon of the anthropogenic heat island intensity [16], while spatial urban dynamics at an intercontinental scale are presented in [17]. An interesting study regarding the characterisation of built-up areas and bare land in Mediterranean cities using Sentinel-2A imagery is presented in [18]. As the authors of that study argue, similar studies “can support the policy and science communities’ increasing need for detailed and up-to-date information on the multiple dimensions of cities, including their social, biological, physical, and infrastructural characteristics. Because the interactions between urban and surrounding areas are complex, a synoptic and spatial view offered from remote sensing is integral to measuring, modeling, and understanding these relationships.” Therefore, including EO and other remotely sensed datasets within public SDIs can enable better analysis of urban management and promote more sustainabile interventions.
The current study aims to investigate and understand urban landscape changes and urban dynamics beyond traditional historical cities. Compared to many other European historical centers, the city centre under investigation, namely Nicosia (Cyprus), may be considered as an exception: the city has been divided and ruled by two different administrations for several decades (see Section 2). In addition, the interaction and relationship between Nicosia’s historical city center and the rest of the modern sub-urban fabric is achieved though specific “gates”, due to the radial alignment of the road network, since the city centre is characterised by an extremely well-preserved Venetian work of fortifications, an asset of high cultural value. This makes the case study unique, as we are aiming to understand how EO datasets and SDIs can support urban planning practices, given political constraints (the administrative division of the city) and the physical presence of an exceptional cultural asset (the Venetian fortifications).
In this study, we examine the changes in the urban fabric of Nicosia that occurred in the past. The study has been carried out using the Landsat and the most recent Sentinel-2 optical satellite datasets to detect, identify and characterise the significant morphological transformations within and around the walled city (Section 3). As discussed in Section 4, the objectives of the study, therefore, are the following: (i) Identify areas within and around the walls of Nicosia undergoing major changes occurring over the last 36 years; (ii) Identify the nature of these changes in specific areas; and (iii) Hence, observe possible city planning differences occurring within and around the Venetian walls (comparison of morphological changes). The previous objective would like to highlight the paper’s central thesis for promoting a more systematic use of EO products and derivatives in decision-making processes regarding planning, use and management of urban resources. For this purpose, the National SDI of Cyprus was used as one of the primary references for evaluating the results of this paper (Section 5). The possibilities offered by the EO imagery analysis are hence discussed within a larger geo-spatial data framework as well as regarding their contribution to the urban planning strategies of historic cities.

2. Case Study

2.1. Nicosia Historic City Centre

The main feature that characterises the Cypriot capital’s shape and urban structure, namely Nicosia, is the Venetian walls that have maintained their geometric integrity for almost five centuries. Some historical details are provided below to describe the walls’ setup and emphasise the significance of this structure.
The island of Cyprus was under Venetian rules in two distinct periods: during the first period from 1474 until 1489, the island was under the Venetian protectorate, while from 1489 until 1570, it was under Venetian direct sovereignty. Due to the rising power of the Ottoman Turks, Venice agreed to strengthen Nicosia’s defence system; in 1567, the construction of the “royal fortress” began. For defence strategy purposes, the walled city’s epicentre was shifted to the west while the circular perimeter, perhaps of Byzantine origin, was abandoned. Nicosia’s Venetian walls were characterised by 11 equal bulwarks, “an impeccable topographic work”, as stated by Marchesi in [19]. With that new defence system, the initial eight gates of the city were reduced to three: the gate of Saint Dominique (today known as Paphos gate), the gate of the Supervisor (today known as Kyrenia gate) and gate Gulia (today known as Famagosta gate). In the same period, the Pedieos river that was initially flowing through the centre of now fortified city, was diverted northwards by the Venetians for two reasons: to protect the residents from possible flooding and to fill the newly created moat encircling the new walls with water, therefore strengthening the defence system.
In the recent history of Cyprus, Nicosia was divided into the Greek and Turkish quarters in 1963. Since 1974, the whole island has been divided due to a Turkish military intervention. Today Nicosia remains a divided capital: the two parts of the city have been ruled by different administrations for more than four decades, and hence underwent dissimilar urban development changes. The central area of the city (as well as the whole island) is divided by a buffer zone (also known as the Green line), established in 1974 and under patrol of the “United Nations Peacekeeping Force in Cyprus”, known as UNFICYP [20] (see Figure 1 in red). The Venetian walls surrounding the historic city, which have been exceptionally well-preserved for centuries, are under control of both parties on the north and on the south of the island [19].
The neighbourhood’s division of the historic town also contemporarily divides the city’s area beyond the fortifications. This fact influences some crucial city functions, such as the existing built environment, transportation, planning and other infrastructures. For example, in the case of road traffic, three gates are still in use as the main contemporary traffic hinges between the walled city and the surrounding areas. The Kyrenia gate is situated on the north side of the city. It is ruled by the Turkish Cypriot administration, while the Paphos and the Famagusta gates are situated respectively on west and east ends of the south part of the city that remained under the Government of the Republic of Cyprus. The three gates are illustrated in Figure 2.

2.2. National Spatial Data Infrastructures: Brief State of the Art in Cyprus

In Cyprus, the National SDI (NSDI) that fulfils the requirements of the European INSPIRE Directive [10] is coordinated by the Land and Surveyors Department (LSD). In 2011, the INSPIRE State of the art report evaluated the ‘Cyprus Integrated Land Information System (CILIS)’ as “an initiative considered to as an important step towards the development of a National SDI”. The Cyprus LIS project was an umbrella program aiming to reduce duplication of land administration work among government agencies and to develop a Digital Cadastral Database (DCDB), a Survey Database (SDB) and a Topographical Database (TDB), suitable to support an integrated Land Information System. CILIS was defined as a tool for legal, administrative and economic decision-making and as an aid for planning and development [21]. The spatial data were documented and published in a catalogue, and these metadata were posted in January 2016 on the geoportal of the Republic of Cyprus [22]. As requested by the INSPIRE Directive, this geoportal is the main point for acquiring information regarding the implementation of INSPIRE in Cyprus [23]. It is also the main access point for e-services and geospatial data of the central government and semi-government organisations. The responsible Authority for the directive’s implementation is the Ministry of Interior. At the same time, the INSPIRE Management Team in Cyprus is composed of the Department of Lands and Surveys, the Department of Environment and the Department of Information Technology Services. Town Planning and Housing Department are also included as key stakeholders and working groups.

3. Datasets and Methodology

3.1. Data Selection Over Time Period 1984–2020

The current study is focused on the changes observed in the urban fabric within and around the walled city of Nicosia over the last 36 years, using space-based observations. To minimise the impact due to seasonal vegetation changes, within and outside the historical centre, satellite images were selected over the year (the months May-June). The cloud coverage was set to be less than 5% for the scene of interest.
For these needs, the Landsat archive images of the NASA/USGS were explored. The Landsat science program offers the longest continuous global record of the Earth’s surface, providing multi-spectral images at a medium resolution. In addition, the choice of Landsat imagery for urban changes referred to previous examples found in the literature, specifically on the consequences of urban sprawl [24,25,26,27].
The year selected referred to the less recent imagery available (1984), to the period of a few years before Cyprus has joined the European Union and to the year in which the study was conducted (2020). The imagery used was retrieved from the USGS data repository [28]. Table 1 shows some details regarding the images used in this paper.

3.2. Methodology

The workflow involved three processing phases. The first phase involves satellite data preparation. This includes the implementation of spectral indices relevant for the built environment and the data fusion using a literature-recommended band combination (Landsat 5 TM B7-B4-B2 combination). The second phase was focused on analysis and detection of areas subject to major changes using statistical methods such as the Standard Deviation (SD) and Principal Component Analysis (PCA). Finally, the third phase involved the assessment of the changes using high-resolution optical imagery from the Copernicus contributing missions and ground truth data from official publicly available INSPIRE data layers (3b). The overview of the workflow is illustrated in Figure 3.
Regarding spectral indices in more detail, the normalised difference vegetation index (NDVI) takes into account the spectral difference between the red and the near-infrared (NIR) bands [29], while the NDBI exploits the short-wave infrared and NIR bands. Finally, the BUI is estimated as the difference between the NDVI and the NDBI indices. The “built-up indices” were chosen as these can distinguish the urban areas against the water bodies and vegetated area. This unsupervised classification brings the advantage of limiting the operator’s subjective intervention in the mapping process [30]. The normalised difference built-up index (NDBI) [31] and the built-up index (BUI) [32] were used here are based on the spectral response of built-up areas due to their higher reflectance in the middle infrared wavelength range than in the near-infrared wavelength range. It should be stressed that all indices are normalised and provide results with a range of −1 to +1, thus minimising any seasonal differences between the different observation dates. Table 2 provides a summary and the equations of the indices used.

4. Results

4.1. Spectral Signatures

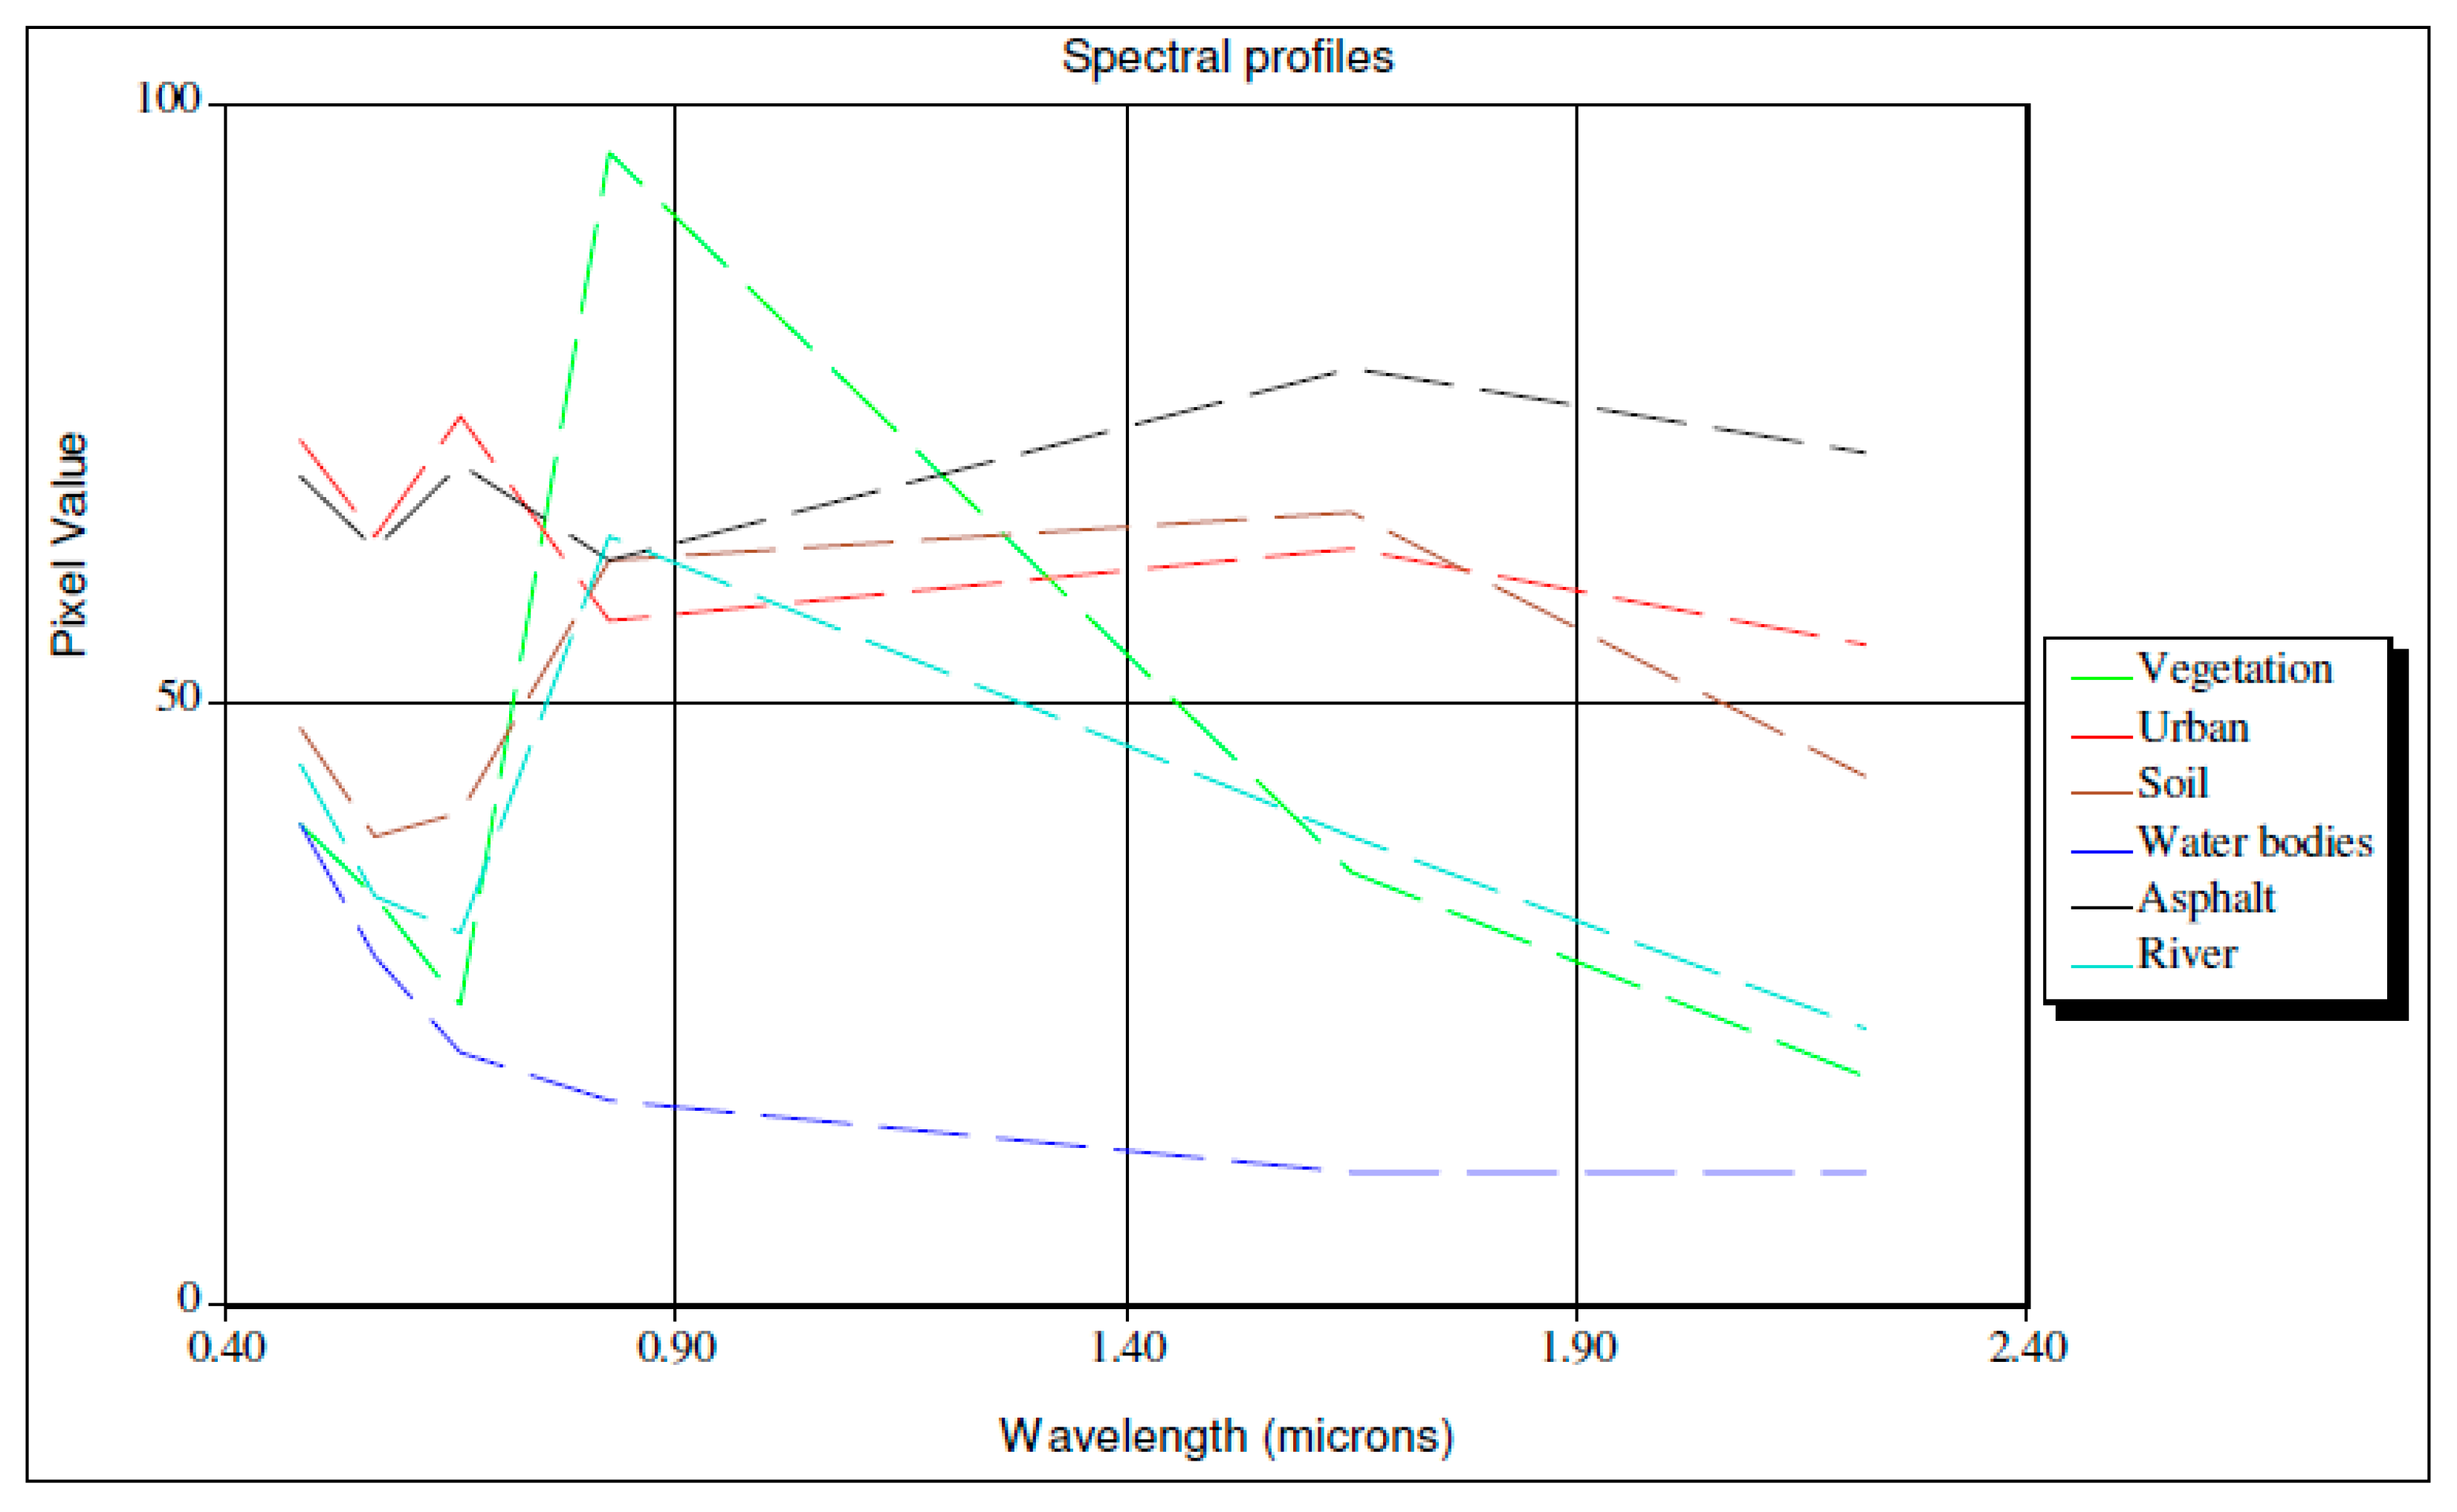
Spectral signature diagrams were drawn based on the full spectrum of the images to identify potential spectral regions that could discriminate between the various targets (pixels) shown in the satellite images. Figure 4 presents indicative spectral signatures over six different targets as follow: vegetation (with green colour), urban areas (with red colour), soil areas (with brown colour), water bodies (with blue colour), asphalt targets (with black colour) and rivers (with cyan colour). The x-axis of Figure 4 shows the various wavelengths regions in terms of a micron (μm). As we see, water bodies tend to give relatively low pixel values, especially as we move on towards the near and the middle infrared part of the spectrum (after 0.80 μm). Vegetation shows a peak at the near-infrared part of the spectrum (at around 0.80 μm), and low values at the red part of the spectrum (0.60–0.70 μm), both indicative of spectral profile of healthy vegetated areas. A similar pattern to the one of vegetation was observed for the river target. This is because rivers are covered with dense vegetation. Urban areas show a decrease in the green part of the spectrum (at around 0.52–0.60 μm) and another decrease at the near-infrared part. An increase was also observed in the middle infrared part.
Findings from Figure 4 indicate that the various targets can be discriminated in the various parts of the spectrum, while the most appropriate to work with them are the green (0.52–0.60 μm), near-infrared (0.76–0.90 μm) and short-wave infrared (2.08–2.35 μm) wavelengths.

4.2. Comparison of Indices Used for Enhancement of Built-Up Areas

As already mentioned, for investigating land-use/land-cover changes and changes caused by urban sprawl, classification-based methods are commonly employed on remote sensing imagery. In [33], the authors compare environmental consideration and critical requirements between optical and non-optical sensors for urban change detection and monitor cities’ expansion. Optical sensors used for change detection can provide information regarding detection and mapping of artificial changes, change rate, the spatial distribution of change types, analysis of urban change and growth, prediction of long-term trends of urban growth, etc. [33].
The second part of the analysis regarded the analysis using several indices, namely NDVI, NDBI and BUI. A comparison of existing built-up indices for urban area mapping, including NDBI and BUI, have been already examined on build-up areas of Mediterranean cities [18], while NDVI has been employed on multi-temporal Landsat TM imagery to derive overall trend changes in [29].
An overview of the three above mentioned indices in three distinct moments 1984, 2000 and 2020, is presented in Figure 5. More specifically, the NDVI index shows how non-built up areas within the walls (NDVI high values, i.e., white pixels) visible in 1984 (Figure 5a) increase over time and can be distinguished for the years 2000 and 2020 (Figure 5b,c). This is also evident in the “the buffer zone” area and around the Venetian walls of Nicosia: while in 2000, the southern part of the walls seemed to be more affected, in 2020, brighter pixels can be seen around the fortifications. As illustrated in Figure 5, in Nicosia, the land cover classes distinction considers mostly built areas and urban green areas.
NDBI results show a similar interpretation to the NDVI. The dark pixels correspond to low values ranging from −0.1 to −0.4, indicating no water bodies in the area. The interpretation of the NDBI outcomes seems to confirm NDVI findings and aligned with the BUI index results: the buffer zone located in the middle of the walled city and surrounding Venetian walls have been subject to changes and an increase of (presumably urban) vegetation. However, in the southern part of the city, the vegetation tends to be visible around the walls; these are more clearly detected around the Kyrenia gate (see Section 5 for more details).
As far as the built-up areas, changes are visible over time in NDBI and BUI results. It could be argued that while in 1984 the urban district seemed to be more cohesive (Figure 5d,g), in the following years, the division due to the buffer zone is more evident. The built-up areas emerge as more highly concentrated in the centre of the historical city in the northern part and more distributed around main arteries and road connections in the city’s southern part, even outside the city walls. In addition, some considerations can be made on Pedieos river as the riverbed used to cross the Nicosia city centre in a west-east direction (roughly corresponding to today’s “buffer zone”): this area is today visible with high tones (white pixels) in NDVI figures (especially in the latest Sentinel image at Figure 5c). The same feature is detectable with dark tones of grey in both NDBI and BUI, indicating the absence of any built-up areas.
It is important to note the difference in terms of spatial resolution highlighted in this step. Images acquired in 1984 and 2000 have a spatial resolution of 30 m (Landsat-5), while the 2020 Sentinel-2 provides a 10 m resolution (see Table 1). Such an increase in spatial resolution offers an added value for investigating both differences in land use/land cover and the morphological changes occurring within and around the city walls. Interesting features to observe in this sense include the road network and the distinction of single districts: in 1984 and 2000, a feature such as the Digeni Akrita street can be noticed in BUI (lighter pixels were surrounding the Venetian walls in the south-east, Figure 5g,h respectively), though it remains indistinct; in 2020, however, both the street and the existence of a dense urban fabric around it are visible in both NDBI and BUI (Figure 5f,i, respectively). Other important traffic arteries such as Larnakos Avenue, Pouliou-Kapota street (later Agiou Andreou) and Archiepiskopuo Makariou avenue can easily be identified, suggesting that a 10 m terrain pixels resolution is suitable for monitoring of the road network and hence possible respective changes in urban structure.

4.3. Diachronic Spatial Analysis

4.3.1. Standard Deviation Analysis over the Year-Pairs

A subsequent analysis involved a diachronic analysis, i.e., comparing the situation and changes over time in pairs of images (one per specific year) with a specific band selection. In this case, the combination B7-B4-B2 (concerning the Landsat-5 sensor) was used. The literature suggests this pseudo-composite as the most promising one for urban area enhancement and it was already tested on other urban areas [34]. The analysis hence regarded artificially produced six-band multi-temporal images (see the workflow in Figure 3 for details).
Figure 6 shows the results of Standard Deviation (SD) analysis performed on these images for pairs 1984–2000 (Figure 6a), 2000–2020 (Figure 6b) and 1984–2020 (Figure 6c). The results were expected to enhance the changes in the built-up areas over time. In the first period of 16 years considered (1984–2000, Figure 6a), changes could be observed in the city’s historic centre and the south side. Also, some changes could also be noticed around the walls, such as the Famagusta gate (western part of the Walls) and in the south-west area around Digeni Akrita street. The second part of the time-lapse, from 2000 to 2020, seems to identify specific areas—one in the centre of the historic walled city and several cases around the Venetian walls. The central area could be referring to the change caused by the Ledra street passage between north and south Nicosia. In contrast, the changes around the Venetian walls seem to relate to specific interventions.
Considering the period 1984 to 2020, the previously mentioned assumptions appeared to be confirmed: constant moderate changes occurred in the city within the walls with some “highlights” on both sides. The changes near the walls seem to have occurred on both sides on specific spots. In contrast, the urban fabric in a larger radius around the fortifications (circa 0.5 km) seemed to behave slightly differently. There are fewer changes that were observed by SD on the north, while on the south morphological changes seemed to follow some of the main city arteries.

4.3.2. Principal Component Analysis (PCA) over the Year-Pairs

In addition, the Principal Component Analysis (PCA) was performed on all three pairs: 1984–2000, 2000–2020 and 1984–2020. The paper examines the results of PCA in more detail on the pair 1984–2020 (Figure 7). Figure 7a shows the RGB natural colour composite of the Nicosia city centre, using the Sentinel-2 image. Similarly, Figure 7b shows the NIR-R-G pseudo colour composite of the same area. Pixels highlighted with red colour are used in the areas that are covered with healthy vegetation. From this view, the vegetated areas in the southern part of Nicosia are evident just outside of the Venetian walls. At the same time, the area of Pediaios river that crossed Nicosia is also clearly detectable. Figure 7c shows the RGB pseudo colour composite using the first three principal components of the pair 1984–2020 as follows: a red colour covers areas with high values in the first principal component (PC1), while a green colour indicates pixels with high values in the second principal component (PC2); finally, a blue colour shows areas with high values at the third principal component (PC3). Individual results for the first three principal components (PC1-PC2 and PC3) are shown in Figure 7d, Figure 7e and Figure 7f, respectively. Figure 7d is the most important outcome of this analysis, as it highlights pixels with a red colour that have changed throughout the observation period. Having a closer look at this figure, we could extract areas of interest where this change was significant. As can be seen in Figure 7d, such hot-spot areas can be observed both within and outside the city walls of Nicosia.

4.4. Comparisson of the Results with Openily Available Geo-Spatial Information

To demonstrate how scientific findings in satellite remote sensing can be helpful, the study results include openly available repositories of other geo-spatial information, namely: (i) digital globes repositories and (ii) Open Data found in geo-portals that public administrations provide.

4.4.1. Evaluation of Results through HR Imagery and Digital Globes Repositories

Previous findings have revealed areas that changed dramatically throughout the observation period. These changes can be due to land-use change as well as other seasonal changes or agricultural practices. To validate these findings, an archived high-resolution multi-spectral available from the Google Earth digital globe was used. Using the results obtained in PCA Component 1, six areas were selected for these purposes, as shown in Figure 8.
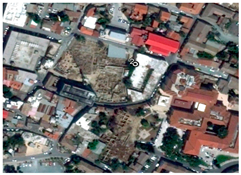
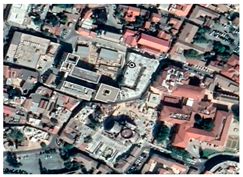
Table 3 shows various screenshots from these selected areas during 2011–2013 (middle column of Table 3) and recent satellite images of 2020 (right column of Table 3). For the area near point 1, we could not see any land-use changes; instead, there are some changes over the roof of the buildings. Small scale changes can be seen in the empty plot in the western part of this screenshot: today it is used as a parking place, while back in 2013 this was still an empty plot. Moving to the area around point 2, we can observe substantial changes, as the area was excavated (2013) and then was successively subject to a new construction intervention (2020). This is where the new Nicosia Municipality building is currently being constructed, preventing space observation of the excavated areas.
Changes observed near points 3 and 6 are similar to point 1, whereas changes could be detected regarding the buildings’ roof materials. New constructions are also visible in the centre of the area of interest, near point 4. Several new buildings were constructed during the last decade in this area. Small scale constructions can be detected near point 5.

4.4.2. Evaluation of Results Using Open Geospatial Data and NSDI Services

Additional validation of results was done employing open geospatial data and services from the National Spatial Data Infrastructure (National INSPIRE geoportal). In particular, the data considered are shown in Table 4.
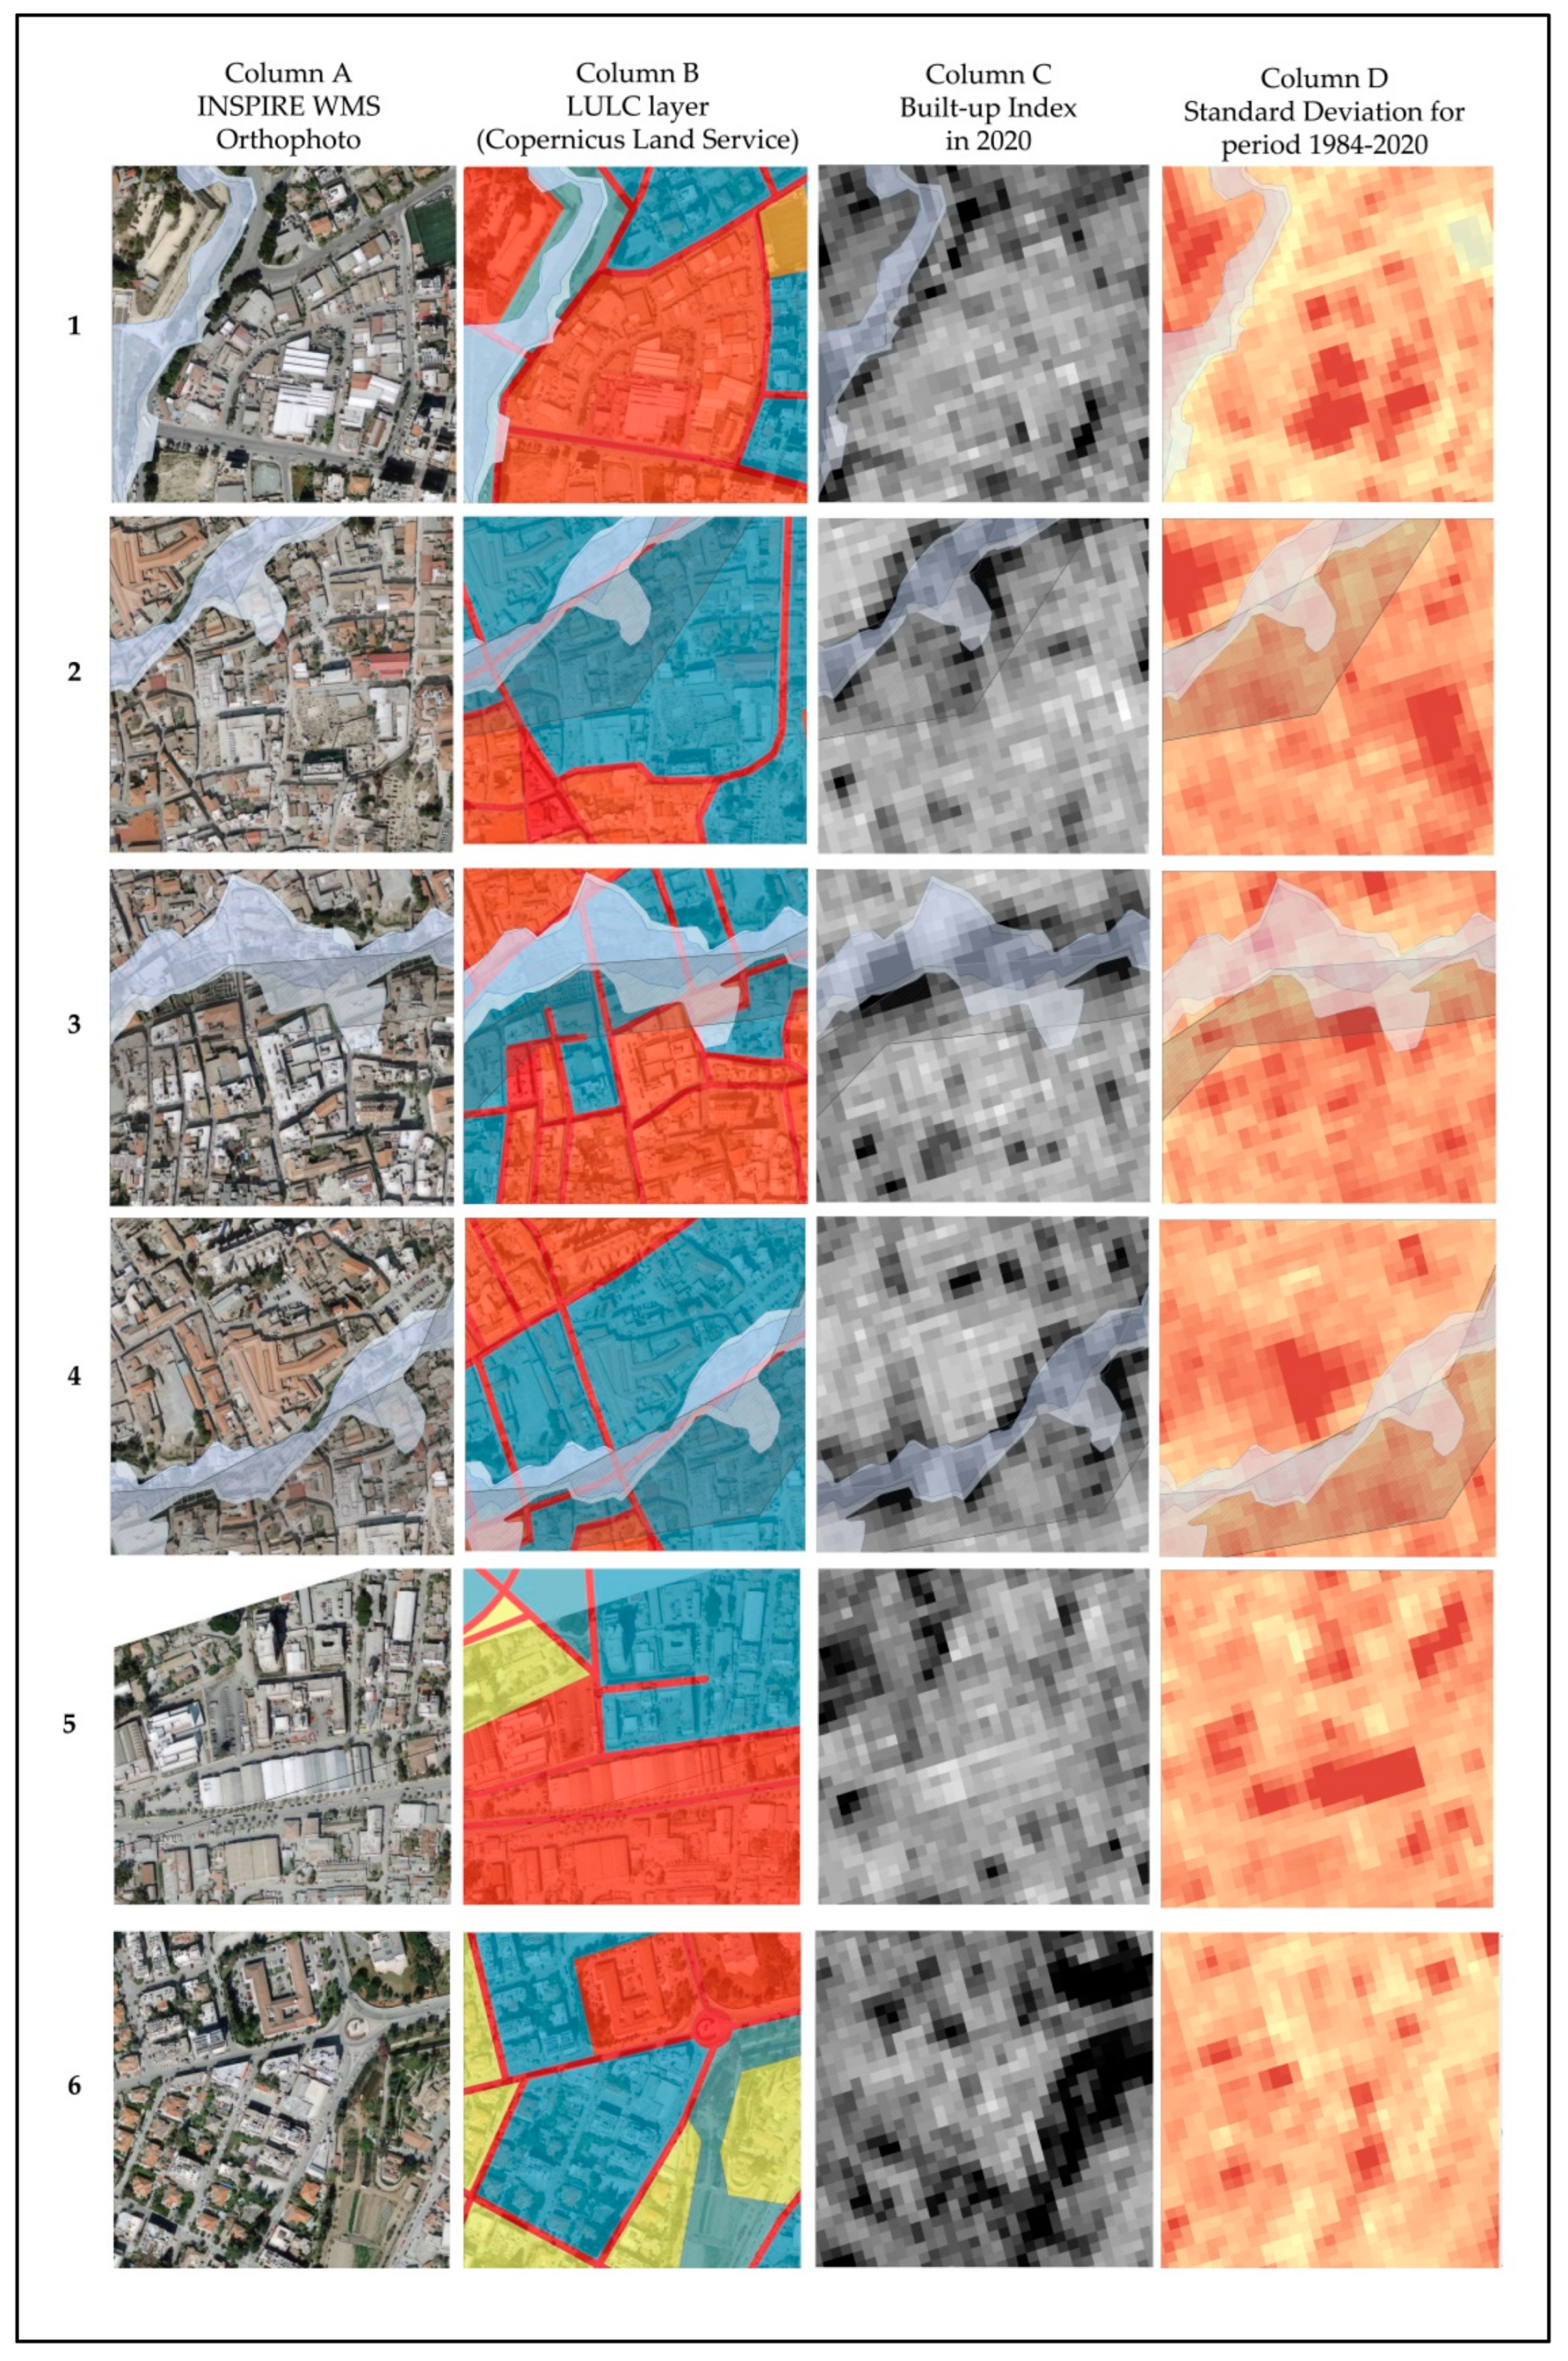
The comparison of different layers is illustrated in Figure 9, specifically on six selected areas, the so-called “hot-spots” (Figure 8).
All images contain the layers provided by the NSDI with a WMS protocol. In particular, Natural Risk Zone layer, as proposed by the Water Development Department illustrates the Flood Plain boundary with 100 year return period (darker blue) and Flood Plain boundary with 500 year return period (lighter blue), as defined for Cyprus for the implementation of the EU Floods Directive [35]. The “buffer zone” area is represented with a grey-hatched layer.
Column A illustrates the hot-spots as seen on the Orthophoto WMS; column B shows the Land Use Land Cover layer (LULC); column C illustrates the Built-up index across all points for the year 2020; in column D, the close-up was made on the Standard Deviation (SD) image for the years 1984–2020. Images of the last two columns (C and D) were developed for this paper and have a resolution of 10 m (see Figure 5 and Figure 6).
Looking into the six specific points, it can be noticed that points 1–4 are all near the areas identified as Natural Risk Zones, referring to flooding. In contrast, only points 5 and 6 are not in close proximity to these features. Points 2 and 4 are near the “buffer zone” area, while point 3 falls partially within these boundaries. In terms of land use, districts of points 1 and 5 refer to the LULC nomenclature “Industrial, commercial, military, public and private units”; points 2, 4 and 6 refer to a “Discontinuous dense urban fabric” (SL 50% to 80%); meanwhile, the district of point 3 refers to the category of “Continuous fabric” (with SL more than 80%). All points are well identifiable as white (light) pixels of column C (built-up areas) and red pixels of column D (significant changes in the urban fabric).

5. Discussion

This paper supports the thesis that EO data and products can be used in urban planning and management practices, as well to contribute to socio-economic benefits in specific domains. In fact, public administrations have an increasing need for updated information on land use/land cover transformations in order to better tackle environmental policies.
For example, the results of this study could further investigate cluster analysis and spatial analysis to emphasise morphological changes, as have been conducted on other cities in Europe [36]. At the same time, a number of studies have been conducted regarding the use of space-based solutions for landscape pattern and vegetation fragmentation studies [37]. Additional applications on Nicosia could foresee the investigation of environmental “health” of the city and evaluation of quality of urban public green areas [38].
Observing the results of this paper, indices and statistics methods show specific changes over time, employing diachronic analysis of the same area across three different time thresholds. Diachronic analysis date back to the second half of the 18th century when the first cases of “diachronic” drawings of maps started to appear in urban cartography. Such drawings were illustrating the pre-existing territorial urban planning of a space and the projects intended for its reorganization, even if the latter was not yet implemented [39]. The experiments conducted here show how significant changes in the urban fabric (“hot-spots”) can be identified and compared to other sources of information to better understand their nature and purpose within future interventions.
The data evaluation confirms that the changes identified correspond to changes in the urban fabric (sometimes even in very densely urbanised districts) or a specific event with effects on the same fabric (e.g., excavation activities in the city center, point 4). Also, it could be noticed that many interventions involve very core districts of the Nicosia historic centre, on both the southern and northern side. In addition, two points (namely 1 and 6) were found in direct proximity to the Venetian walls, meaning that significant changes in the urban fabric have occurred respectively at a distance of 200 m and less than 100 m from this important cultural heritage asset and an urban landmark of the capital.
Specifically regarding the management of historic cities, these kinds of studies could be important when evaluating and planning the buffer-zone around Nicosia’s Venetian walls. The term used here is not to be confused with the previously mentioned buffer-zone of the overall Nicosia context but rather as intended by the UNESCO’s definition for cultural heritage sites—an area to protect sites from negative influences [40]. In 2017, “The Venetian Works of Defence between 16th and 17th Centuries” was inscribed on the UNESCO World Heritage list. The existence of appropriate boundaries and buffer zones and protective measures were taken into account when evaluating integrity and authenticity of the selected monuments [41].

6. Conclusions

This study investigates the changes in the urban landscape of the historical centre of Nicosia, a Mediterranean capital characterised by an extremely well-preserved Venetian work of fortifications, an asset of high cultural value.
Some of the main conclusions of this paper are:
-
The study was conducted using free, full and open (FFO) earth observation data (namely Landsat and Sentinel-2 multi-spectral optical imagery). Free distribution satellite imagery can foster a better uptake of such information for targeted solutions and applications;
-
The study detects and characterises some major morphological transformations within the walled city and around it. Main changes in the urban fabric were identified, underlining that significant changes occur in already dense urban areas and in a close proximity to an extremely well preserved cultural heritage monument i.e., Nicosia Venetian walls;
-
The limitation of this research involves the evaluation of changes that was only conducted visually on previously collected datasets. Further investigations could employ the use of spectro-radiometers for ground-truth data collection, satellite image calibration and elaboration of supervised classification products;
-
In terms of drawbacks, in order to process and interpret satellite imagery, high technical capacity is needed both in terms of software licences and processor capability as well as skilled personnel; these could often be the main weaknesses when not employing space-based data more systematically within public administration bodies;
-
The results were further been compared to (i) to high-resolution imagery, and digital globes repositories and (ii) specific layers provided as WMS by the NSDI. These last steps highlight how satellite-based products can easily be consulted within GIS environments by professionals with no compulsory prior knowledge of remote sensing data elaboration;
-
In addition, the results of this paper can be provided as WMS within existing geo-spatial repositories in order to integrate already freely available geospatial information provided by public administrations.
As governments and local administrations are asked to promote and implement policies for more inclusive, safe and resilient cities in the future, integrated technological solutions should be put in practice to support decision-making processes that involve planning, use, and management of our urban resources. Inserting EO more frequently and more systematically within a larger geo-spatial data framework could provide a significant contribution to more sustainable urban planning strategies of the historic European cities, even in cities such as Nicosia, which are constrained by specific political situations but are rich in monuments with a high cultural importance and value.

Author Contributions

Conceptualisation, B.C. and A.A.; methodology, B.C. and A.A.; software, B.C.; validation, B.C. and A.A.; resources, B.C. and A.A.; data curation, B.C.; writing—original draft preparation, B.C.; writing—review and editing, B.C. and A.A.; visualisation, B.C. and A.A. All authors have read and agreed to the published version of the manuscript.

Funding

This research received no external funding.

Institutional Review Board Statement

Not applicable.

Informed Consent Statement

Not applicable.

Data Availability Statement

Publicly available datasets were analyzed in this study. This data can be found here: Satellite imagery: https://earthexplorer.usgs.gov/ (accessed on 30 April 2021). Open geospatial information on Cyprus: https://eservices.dls.moi.gov.cy/#/national/inspiregeoportalmapviewer (accessed on 30 April 2021).

Acknowledgments

Figure 5, Figure 6, Figure 7 and Figure 9 contain modified Copernicus Sentinel-2 data (2020); original data was provided by USGS Archives.

Conflicts of Interest

The authors declare no conflict of interest.

References

  1. United Nations: Sustainable Development Goals. Available online: https://www.un.org/sustainabledevelopment/cities/ (accessed on 30 April 2021).
  2. Tanrıkul, A.; Hoşkara, Ş. A New Framework for the Regeneration Process of Mediterranean Historic City Centres. Sustainability 2019, 11, 4483. [Google Scholar] [CrossRef] [Green Version]
  3. García-Hernández, M.; De la Calle-Vaquero, M.; Yubero, C. Cultural Heritage and Urban Tourism: Historic City Centres under Pressure. Sustainability 2017, 9, 1346. [Google Scholar] [CrossRef] [Green Version]
  4. Pellegrini, P.; Micelli, E. Paradoxes of the Italian Historic Centres between Underutilisation and Planning Policies for Sustainability. Sustainability 2019, 11, 2614. [Google Scholar] [CrossRef] [Green Version]
  5. Janssen, K.; Kuczerawy, A. Increasing the availability of spatial data held by public sector bodies: Some experiences and guidelines from the OneGeology-Europe Project. Int. J. Spat. Data Infrastruct. 2012, 7, 249–276. [Google Scholar]
  6. Georgiadou, Y.; Rodriguez-Pabón, O.; Lance, K.T. Spatial Data Infrastructure (SDI) and E-governance: A Quest For Appropriate Evaluation Approaches. URISA J. 2006, 18, 43–55. [Google Scholar]
  7. European Parliament. Directive 2007/2/EC of the European Parliament and of the Council of 14 March 2007 Establishing an Infrastructure for Spatial Information in the European Community (INSPIRE). 2007. Available online: https://eur-lex.europa.eu/legal-content/EN/TXT/?uri=CELEX%3A32007L0002&qid=1617356484780 (accessed on 30 April 2021).
  8. European Parliament. Directive (EU) 2019/1024 of the European Parliament and of the Council of 20 June 2019 on Open Data and the Re-Use of Public Sector Information (Open Data Directive). 2019. Available online: https://eur-lex.europa.eu/legal-content/EN/TXT/?qid=1561563110433&uri=CELEX:32019L1024 (accessed on 30 April 2021).
  9. European Parliament. Directive 2003/98/EC of the European Parliament and of the Council of 17 November 2003 on the re-use of public sector information. 2003. Available online: https://eur-lex.europa.eu/legal-content/en/ALL/?uri=CELEX:32003L0098 (accessed on 30 April 2021).
  10. Campagna, M.; Craglia, M. The socio-economic impact of the spatial data infrastructure of Lombardy. Environ. Plan. B Plan. Des. 2010, 39, 1069–1083. [Google Scholar] [CrossRef]
  11. Palafox-Juárez, E.B.; López-Martínez, J.O.; Hernández-Stefanoni, J.L.; Hernández-Nuñez, H. Impact of Urban Land-Cover Changes on the Spatial-Temporal Land Surface Temperature in a Tropical City of Mexico. ISPRS Int. J. Geo-Inf. 2021, 10, 76. [Google Scholar] [CrossRef]
  12. Moise, C.; Dana Negula, I.; Mihalache, C.E.; Lazar, A.M.; Dedulescu, A.L.; Rustoiu, G.T.; Inel, I.C.; Badea, A. Remote Sensing for Cultural Heritage Assessment and Monitoring: The Case Study of Alba Iulia. Sustainability 2021, 13, 1406. [Google Scholar] [CrossRef]
  13. Feng, D.; Bao, W.; Fu, M.; Zhang, M.; Sun, Y. Current and Future Land Use Characters of a National Central City in Eco-Fragile Region—A Case Study in Xi’an City Based on FLUS Model. Land 2021, 10, 286. [Google Scholar] [CrossRef]
  14. Wentz, E.A.; Anderson, S.; Fragkias, M.; Netzband, M.; Mesev, V.; Myint, S.W.; Quattrochi, D.; Rahman, A.; Seto, K.C. Supporting Global Environmental Change Research: A Review of Trends and Knowledge Gaps in Urban Remote Sensing. Remote Sens. 2014, 6, 3879–3905. [Google Scholar] [CrossRef] [Green Version]
  15. Ghazaryan, G.; Rienow, A.; Oldenburg, C.; Thonfeld, F.; Trampnau, B.; Sticksel, S.; Jürgens, C. Monitoring of Urban Sprawl and Densification Processes in Western Germany in the Light of SDG Indicator 11.3.1 Based on an Automated Retrospective Classification Approach. Remote Sens. 2021, 13, 1694. [Google Scholar] [CrossRef]
  16. Firozjaei, M.K.; Fathololoumi, S.; Mijani, N.; Kiavarz, M.; Qureshi, S.; Homaee, M.; Alavipanah, S.K. Evaluating the Spectral Indices Efficiency to Quantify Daytime Surface Anthropogenic Heat Island Intensity: An Intercontinental Methodology. Remote Sens. 2020, 12, 2854. [Google Scholar] [CrossRef]
  17. Banzhaf, E.; Wu, W.; Luo, X.; Knopp, J. Integrated Mapping of Spatial Urban Dynamics—A European-Chinese Exploration. Part 1—Methodology for Automatic Land Cover Classification Tailored towards Spatial Allocation of Ecosystem Services Features. Remote Sens. 2021, 13, 1744. [Google Scholar] [CrossRef]
  18. Ettehadi Osgouei, P.; Kaya, S.; Sertel, E.; Alganci, U. Separating Built-Up Areas from Bare Land in Mediterranean Cities Using Sentinel-2A Imagery. Remote Sens. 2019, 11, 345. [Google Scholar] [CrossRef] [Green Version]
  19. Marchesi, P. Fortezze Veneziane (1508–1797), 1st ed.; Rusconi Libri: Milan, Italy, 1984; pp. 84–93. [Google Scholar]
  20. UNFICYP. About the Buffer Zone. Available online: https://unficyp.unmissions.org/about-buffer-zone (accessed on 5 April 2021).
  21. Spatial Data Infrastructures in Cyprus: State of Play 2011. Available online: https://inspire.ec.europa.eu/reports/stateofplay2011/rcr11CYv120.pdf (accessed on 5 April 2021).
  22. INSPIRE in Your Country, Cyprus Country Fiche 2020. Available online: https://inspire.ec.europa.eu/sites/default/files/inspire_-_cyprus_-_2020_country_fiche.pdf (accessed on 30 April 2021).
  23. Geospatial Information Portal of Cyprus. Available online: http://www.geoportal.gov.cy/MOI/DLS/geoportal/geoportal.nsf/index_en/index_en?OpenDocument (accessed on 30 April 2021).
  24. Ji, W.; Ma, J.; Twibell, R.W.; Underhill, K. Characterising urban sprawl using multi-stage remote sensing images and landscape metrics. Comput. Environ. Urban Syst. 2006, 30, 861–879. [Google Scholar] [CrossRef]
  25. Bhatta, B. Remote Sensing, GIS, and Urban Analysis. In Analysis of Urban Growth and Sprawl from Remote Sensing Data; Advances in Geographic Information Science; Springer: Berlin/Heidelberg, Germany, 2010; pp. 49–63. [Google Scholar] [CrossRef]
  26. El Garouani, A.; Mulla, D.J.; El Garouani, S.; Knight, J. Analysis of urban growth and sprawl from remote sensing data: Case of Fez, Morocco. Int. J. Sustain. Built. Environ. 2017, 6, 160–169. [Google Scholar] [CrossRef]
  27. Agapiou, A.; Alexakis, D.D.; Lysandrou, V.; Sarris, A.; Cuca, B.; Themistocleous, K.; Hadjimitsis, D.G. Impact of Urban Sprawl to archaeological research: The case study of Paphos area in Cyprus. J. Cult. Herit. 2015, 16, 671–680. [Google Scholar] [CrossRef]
  28. United States Geological Survey (USGS). Earth Explorer Service. Available online: https://earthexplorer.usgs.gov/ (accessed on 2 April 2021).
  29. Du, P.; Li, X.; Cao, W.; Luo, Y.; Zhang, H. Monitoring urban land cover and vegetation change by multi-temporal remote sensing information. Min. Sci. Technol. (China) 2010, 20, 922–932. [Google Scholar] [CrossRef]
  30. Polydoros, A.; Cartalis, C. Assessing the impact of urban expansion to the state of thermal environment of peri-urban areas using indices. Urban Clim. 2015, 14, 166–175. [Google Scholar] [CrossRef]
  31. Zha, Y.; Gao, J.; Ni, S. Use of normalized difference built-up index in automatically mapping urban areas from TM imagery. Int. J. Remote Sens. 2003, 24, 583–594. [Google Scholar] [CrossRef]
  32. He, C.; Shi, P.; Xie, D.; Zhao, Y. Improving the normalized difference built-up index to map urban built-up areas using a semiautomatic segmentation approach. Remote Sens. Lett. 2010, 1, 213–221. [Google Scholar] [CrossRef] [Green Version]
  33. Kadhim, N.; Mourshed, M.; Bray, M. Advances in remote sensing applications for urban sustainability. Euro-Mediterr. J. Environ. Integr. 2016, 1, 7. [Google Scholar] [CrossRef] [Green Version]
  34. Cuca, B. Evaluation of Changes in the City Fabric Using Multispectral Multi-temporal Geospatial Data: Case Study of Milan, Italy. In International Conference on Computational Science and Its Applications; Lecture Notes in Computer Science; Springer: Cham, Switzerland, 2020; Volume 12252, pp. 813–828. [Google Scholar] [CrossRef]
  35. European Parliament. Directive 2007/60/EC of the European Parliament and of the Council of 23 October 2007 on the Assessment and Management of Flood Risks. 2007. Available online: https://eur-lex.europa.eu/legal-content/EN/TXT/?uri=celex:32007L0060 (accessed on 30 April 2021).
  36. Kukulska-Kozieł, A.; Szylar, M.; Cegielska, K.; Noszczyk, T.; Hernik, J.; Gawroński, K.; Dixon-Gough, R.; Jombach, S.; Valánszki, I.; Kovács, K.F. Towards three decades of spatial development transformation in two contrasting post-Soviet cities—Kraków and Budapest. Land Use Policy 2019, 85, 328–339. [Google Scholar] [CrossRef]
  37. Kowe, P.; Mutanga, O.; Dube, T. Advancements in the remote sensing of landscape pattern of urban green spaces and vegetation fragmentation. Int. J. Remote Sens. 2021, 42, 3797–3832. [Google Scholar] [CrossRef]
  38. Salata, S. The Utilization of Supervised Classification Sampling for Environmental Monitoring in Turin (Italy). Sustainability 2021, 13, 2494. [Google Scholar] [CrossRef]
  39. Empler, T. La rappresentazione del paesaggio: Dal sincronico al diacronico. In Il Prossimo Paesaggio; Banconi, F., Filippucci, M., Eds.; Gangemi Editore Spa: Rome, Italy, 2018; pp. 45–50. [Google Scholar]
  40. UNESCO. World Heritage and Buffer Zones; World Heritage Papers (25); Martin, O., Piatti, G., Eds.; UNESCO World Heritage Centre: Paris, France, 2009; Available online: https://whc.unesco.org/en/series/25/ (accessed on 16 June 2021).
  41. UNESCO World Heritage List, The Venetian Works of Defence between 15th and 17th Centuries (Italy, Croatia, Montenegro). Available online: https://whc.unesco.org/en/list/1533/ (accessed on 16 June 2021).
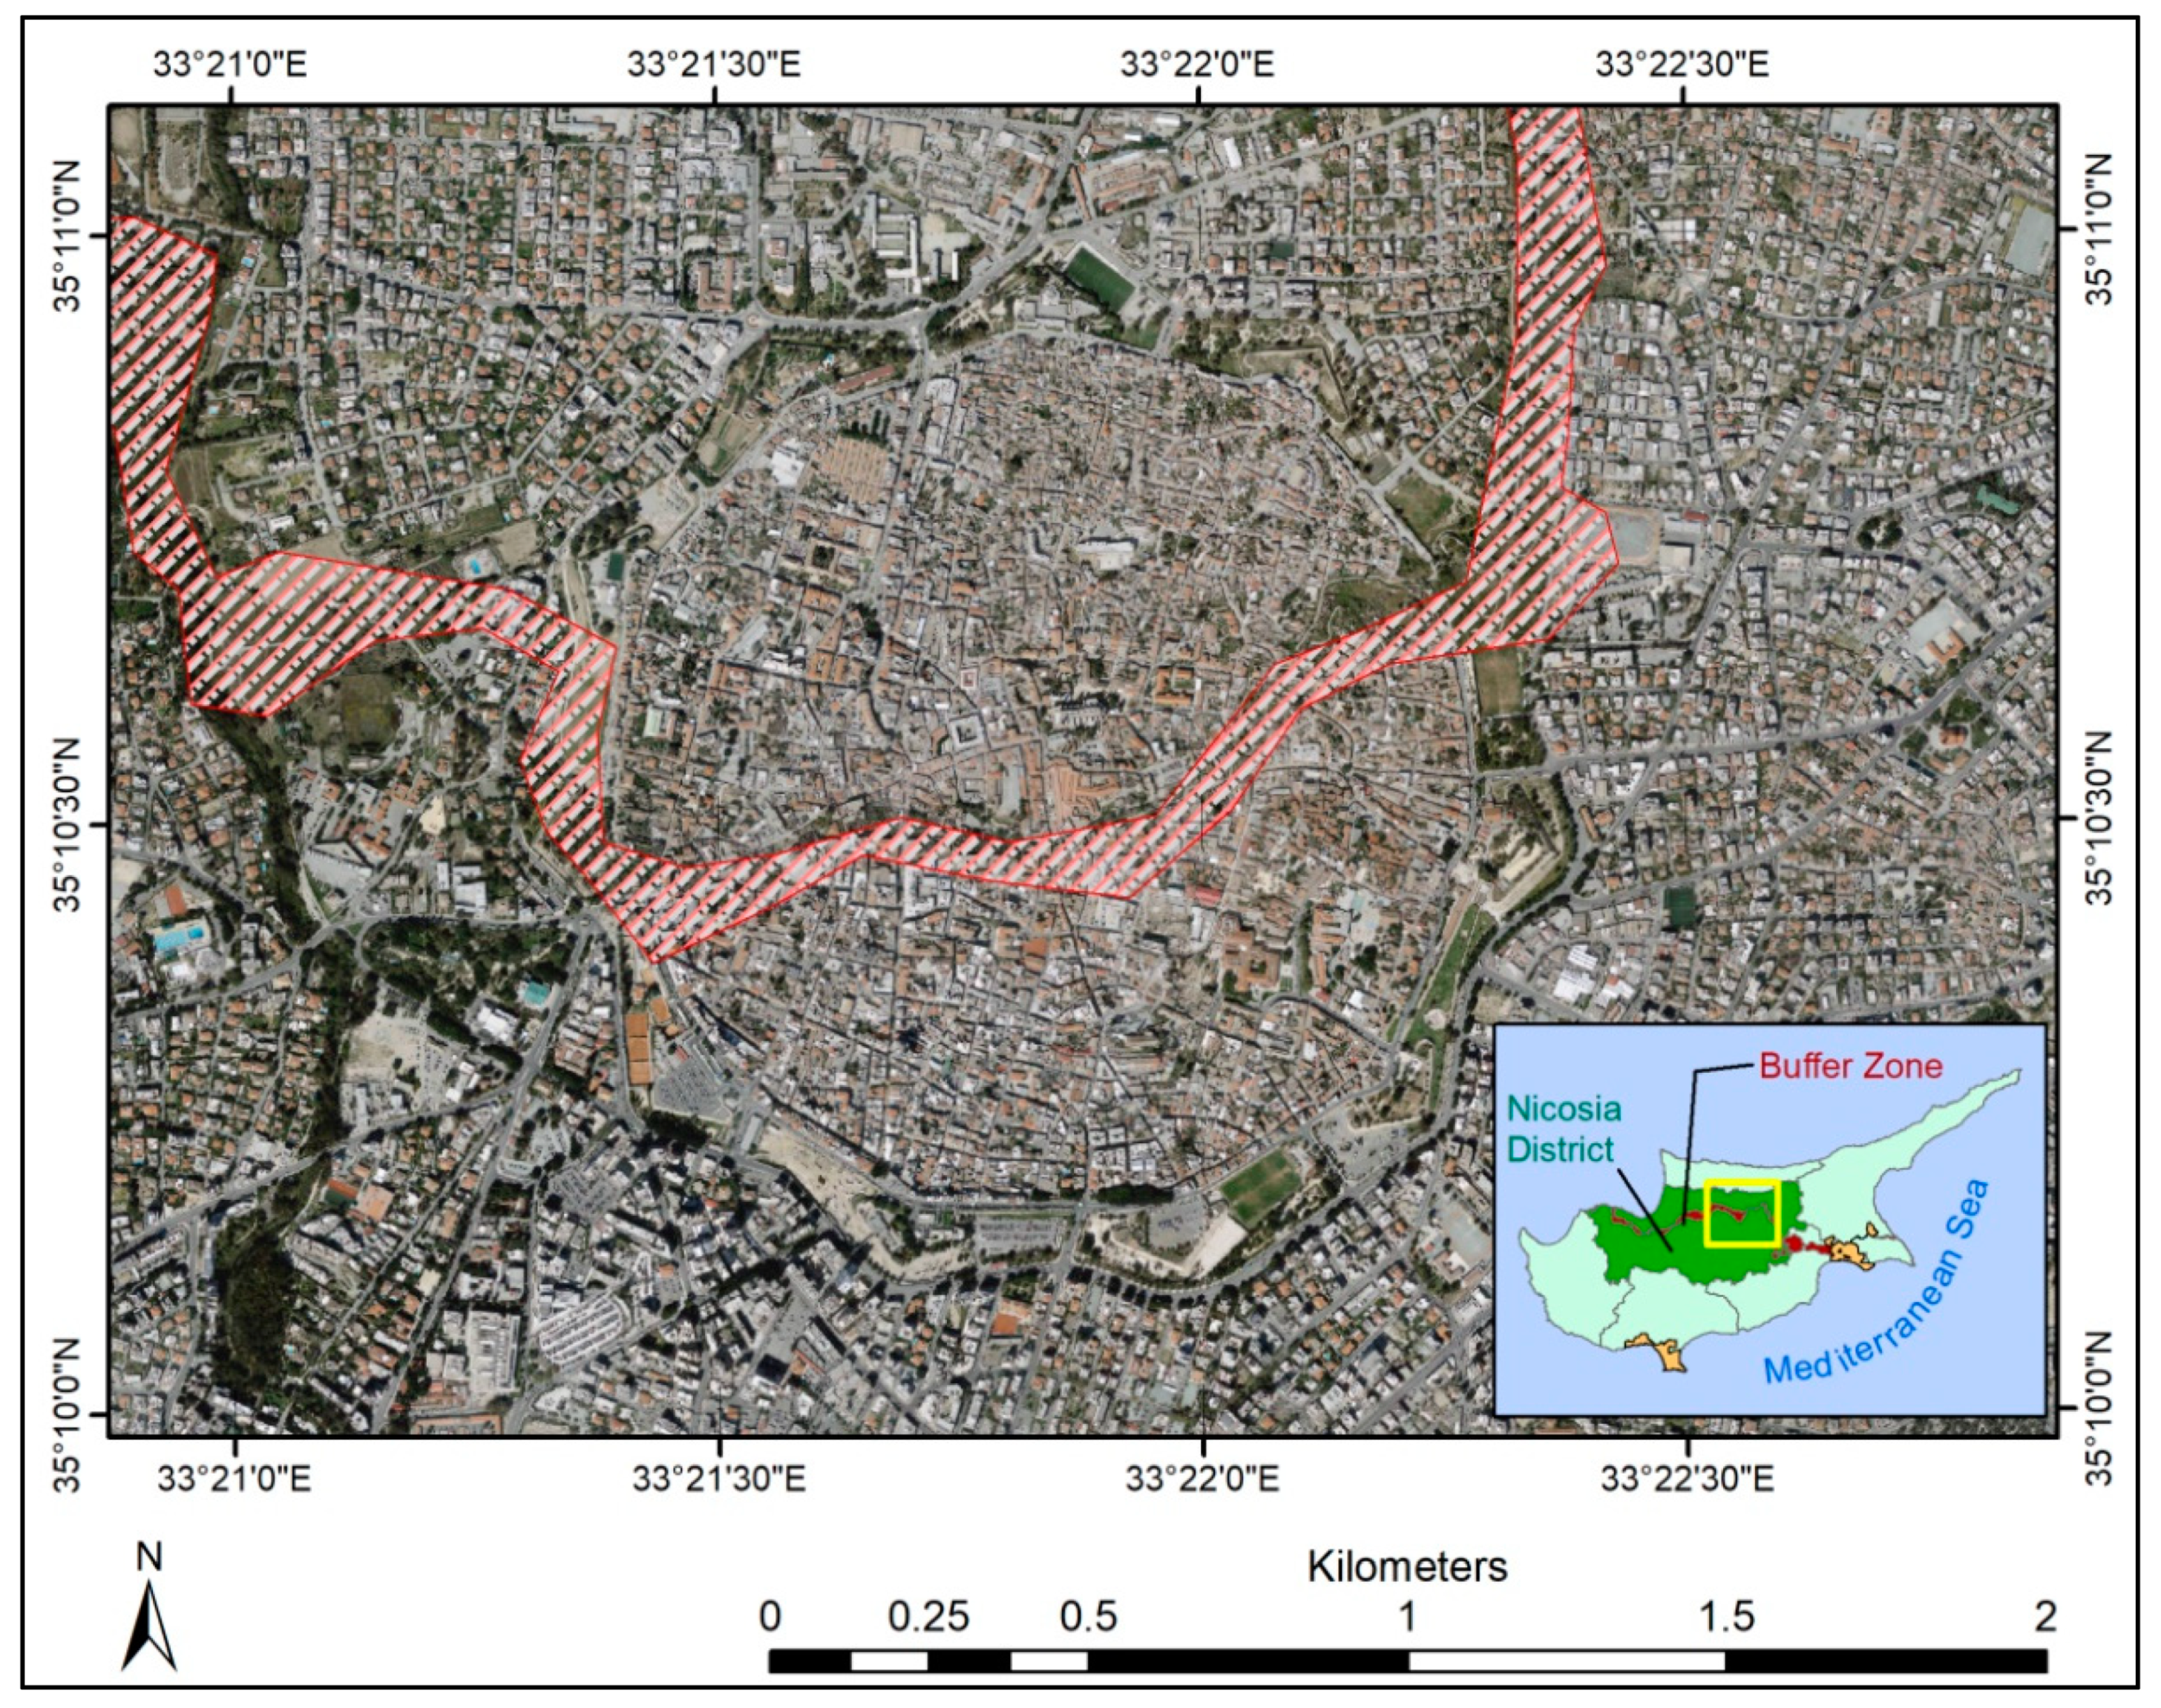
Figure 1. Orthophoto over the city centre of Nicosia, indicating the Venetian walls. The buffer zone that divides Nicosia city’s south and northern areas is also shown with a red polygon (orthophoto from Department of Land and Surveyors Department, Cyprus).
Sustainability 13 07023 g001
Figure 2. Nicosia Venetian walls: the structure is made of 11 bulwarks. Three gates are still used for road traffic today: (a) Kyrenia gate in the northern part of the city; (b) Famagousta gate; and (c) Paphos gate, the last two are located south of the “buffer zone”. Images source: Google Maps and Google StreetView©.
Sustainability 13 07023 g002
Figure 3. Evaluation of changes in the urban fabric of Nicosia: an overview of the workflow.
Sustainability 13 07023 g003
Figure 4. Indicative spectral signatures profile over various targets within and outside the Venetian walls of Nicosia.
Sustainability 13 07023 g004
Figure 5. Spectral indices over Nicosia historic city centre: normalised-difference vegetation index (NDVI); normalised-difference built-up index (NDBI) and built-up index (BUI) are shown respectively for years 1984 (a,d,g), 2000 (b,e,h) and 2020 (c,f,i).
Sustainability 13 07023 g005
Figure 6. Standard Deviation of three-band artificial composite images (LS5 B7-B4-B2) for couples 1984–2000 (a), 2000–2020 (b) and 1984–2020 (c).
Sustainability 13 07023 g006
Figure 7. Sentinel-2 image (left panel) in RGB visible (a) and NIR-Red-Green colour composite (b); Principal component analysis (right panel) in RGB over Components 1, 2 and 3 (c), first principal component (d), second principal component (e), third principal component (f).
Sustainability 13 07023 g007
Figure 8. Selected areas (points 1 to 6) shown from the statistical analysis with spectral differences throughout the observation period.
Sustainability 13 07023 g008
Figure 9. Details of Orthophoto over Nicosia in 2014 (column A); LULC Copernicus Land Monitoring service (column B); Built-up Index illustrated in Figure 5 (column C) and Standard Deviation 1984–2020 illustrated in Figure 6 (column D). The point number corresponds to Figure 8.
Sustainability 13 07023 g009
Table 1. Satellite imagery for the Nicosia case study in the period 1984–2020.
Year
(Month-Date)
Image Type (Sensor)Spatial Resolution in VIS/NIRSpatial
Resolution in SWIR
Spectral Resolution (μm)
(Listed only Green-NIR-SWIR)
15 May 1984Landsat-530 m30 mGreen: 0.52–0.60
NIR: 0.76–0.90
SWIR: 2.08–2.35
12 June 2000Landsat-530 m30 mGreen: 0.52–0.60
NIR: 0.76–0.90
SWIR: 2.08–2.35
18 May 2020Sentinel-2A10 m20 mGreen: 0.56
NIR: 0.83
SWIR: 2.20
Table 2. Details on existing build-up indices used in this paper.
Index NameIndex IDBands UsedFormulaApplicationReference
Normalised difference vegetation indexNDVINIR and Red NIR Red NIR + Red Mapping urban land cover and vegetation change[29]
Normalised difference built-up indexNDBISWIR and NIR SWIR NIR SWIR + NIR Automatically mapping urban areas[31]
Built-up index BUISWIR, NIR and REDNDBI−NDVIMapping urban built-up areas[32]
Table 3. Screenshots from a pansharpened IKONOS satellite image over Nicosia during 2001 (left), high-resolution satellite images from Google Earth digital globe during the periods 2011–2013 (middle column) and 2020 (right column). The point number corresponds to Figure 8.
Point 20012011–20132020
1 Sustainability 13 07023 i001 Sustainability 13 07023 i002 Sustainability 13 07023 i003
2 Sustainability 13 07023 i004 Sustainability 13 07023 i005 Sustainability 13 07023 i006
3 Sustainability 13 07023 i007 Sustainability 13 07023 i008 Sustainability 13 07023 i009
4 Sustainability 13 07023 i010 Sustainability 13 07023 i011 Sustainability 13 07023 i012
5 Sustainability 13 07023 i013 Sustainability 13 07023 i014 Sustainability 13 07023 i015
6 Sustainability 13 07023 i016 Sustainability 13 07023 i017 Sustainability 13 07023 i018
Table 4. A list of open geo-spatial data used for validation of study results.
Type of Data/Theme NameType of AccessSourceYear of Reference
Urban Atlas layerOpen geospatial data (download upon request as a registered user)Copernicus Land
Monitoring service
2012
Orthoimagery
(INSPIRE theme, DLS)
Web Map ServiceNSDI *2014
Natural risks zones
(INSPIRE theme; Water development Department)
Web Map ServiceNSDI *2015
Hydrography
(INSPIRE theme; Water development Department)
Web Map ServiceNSDI *2015
* National INSPIRE geo-portal managed by the Department of Land and Surveying (DLS), Ministry of Interior.
Publisher’s Note: MDPI stays neutral with regard to jurisdictional claims in published maps and institutional affiliations.