1. Introduction
How does a person in a city, e.g., a resident or a tourist, decide which mode of transportation (or a combination thereof) to choose for a given trip? Likely, the decision-making process is guided by personal preferences. These might be tied to external factors: perhaps the sun is shining today, or some exercise might be good. In such a scenario, one might choose to travel, for example, by bicycle as opposed to by car, bus, or train. Moreover, more people would perhaps also cycle more regularly if there was reliable bicycle parking at public transport stations or if more free-floating bike sharing systems were available [
1]. By virtue of focusing on modeling individual entities and their autonomous behavior, agent-based models (ABMs) are a promising tool for studying these kinds of human decisions, thresholds, and processes. Particularly, models that are designed to simulate the future of their real-world counterparts might provide valuable predictive insights, which might serve as decision support for organizations and policymakers. However, a model’s inherent tendency to be a simplified representation of reality (especially when its goal is to model parts of a highly complex system such as a big city) introduces uncertainty and limitations to its prediction horizon. Along with designing models that are truthful and capable representations of reality, we therefore consider it necessary to actively increase the certainty of (and the potential confidence in) predictive statements that are based on model output data. Together, quality in design and quality in prediction can yield high value for decision-makers and other stakeholders.
To mitigate the uncertainty that is concomitant with simulations of the future, we promote a corrective mechanism that streams real-time data into an ongoing simulation of an ABM. We propose the hypothesis that ABMs are especially well-suited for integrating sensor data, and that considering real-time data within ABMs can help reduce uncertainties of simulation results, thereby increasing their credibility and trustworthiness in the eyes of decision-makers and stakeholders. Additionally, we intend to analyze the related impact of streaming real-time data into simulation runs.
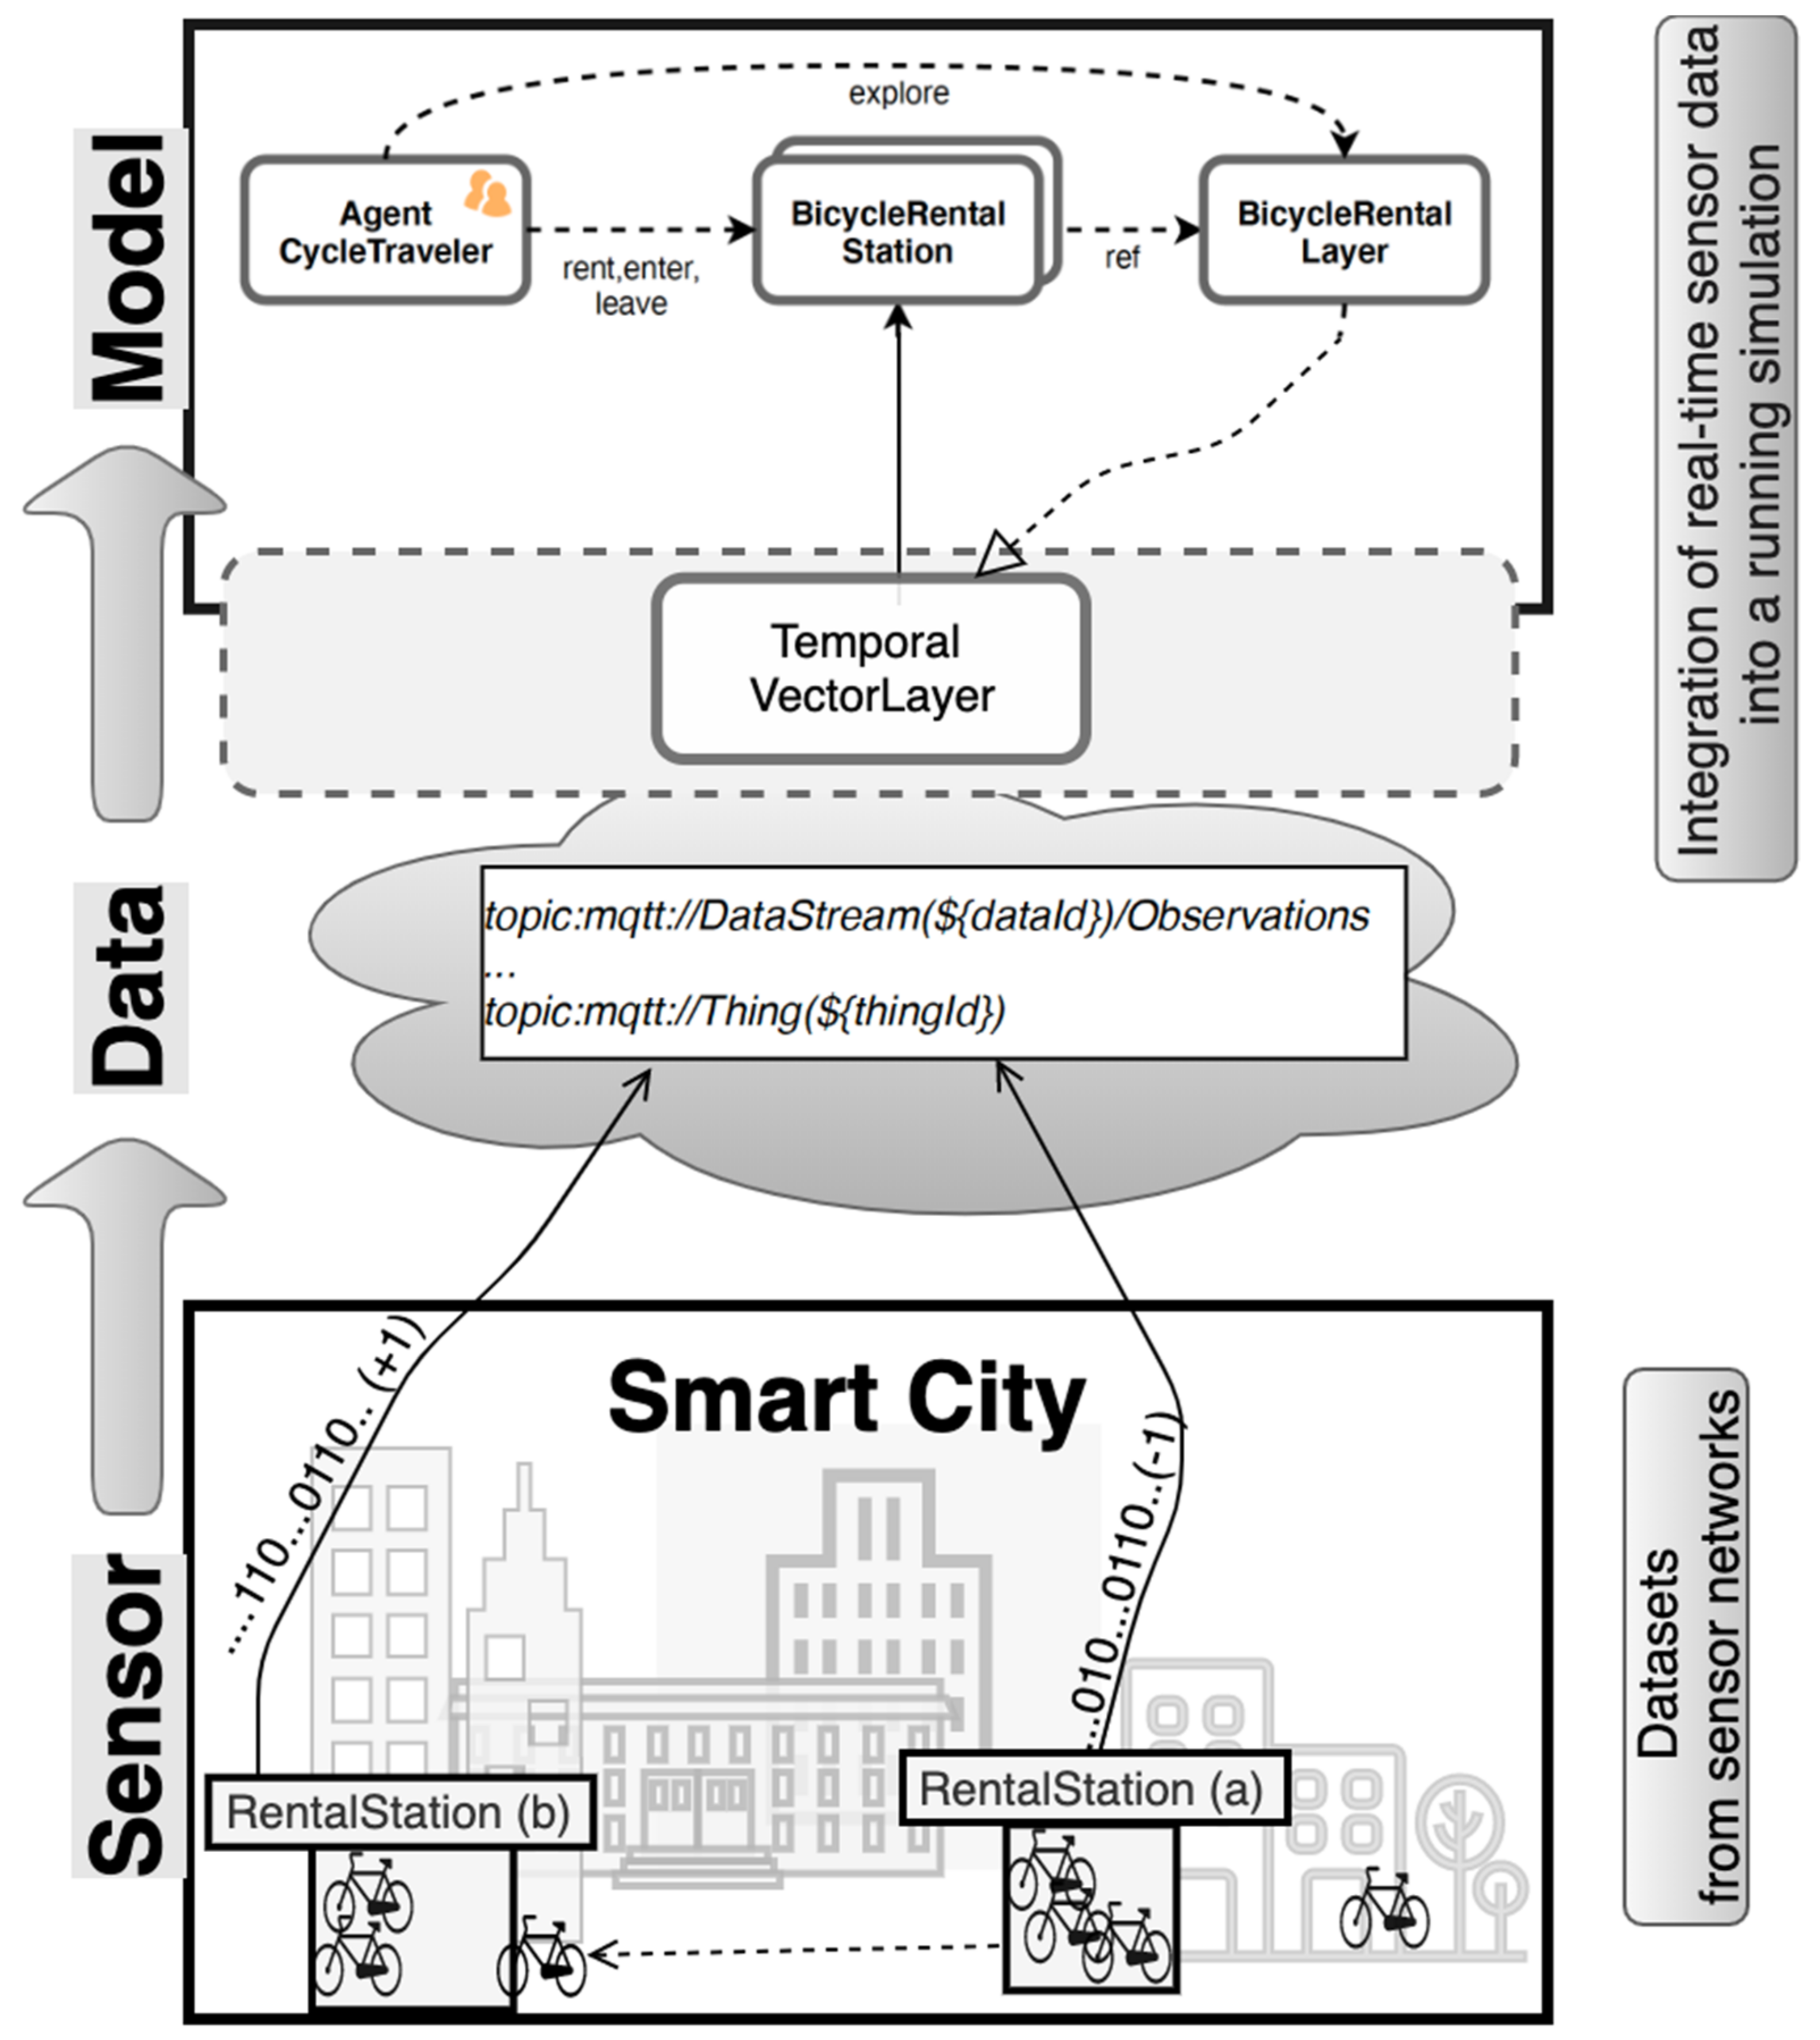
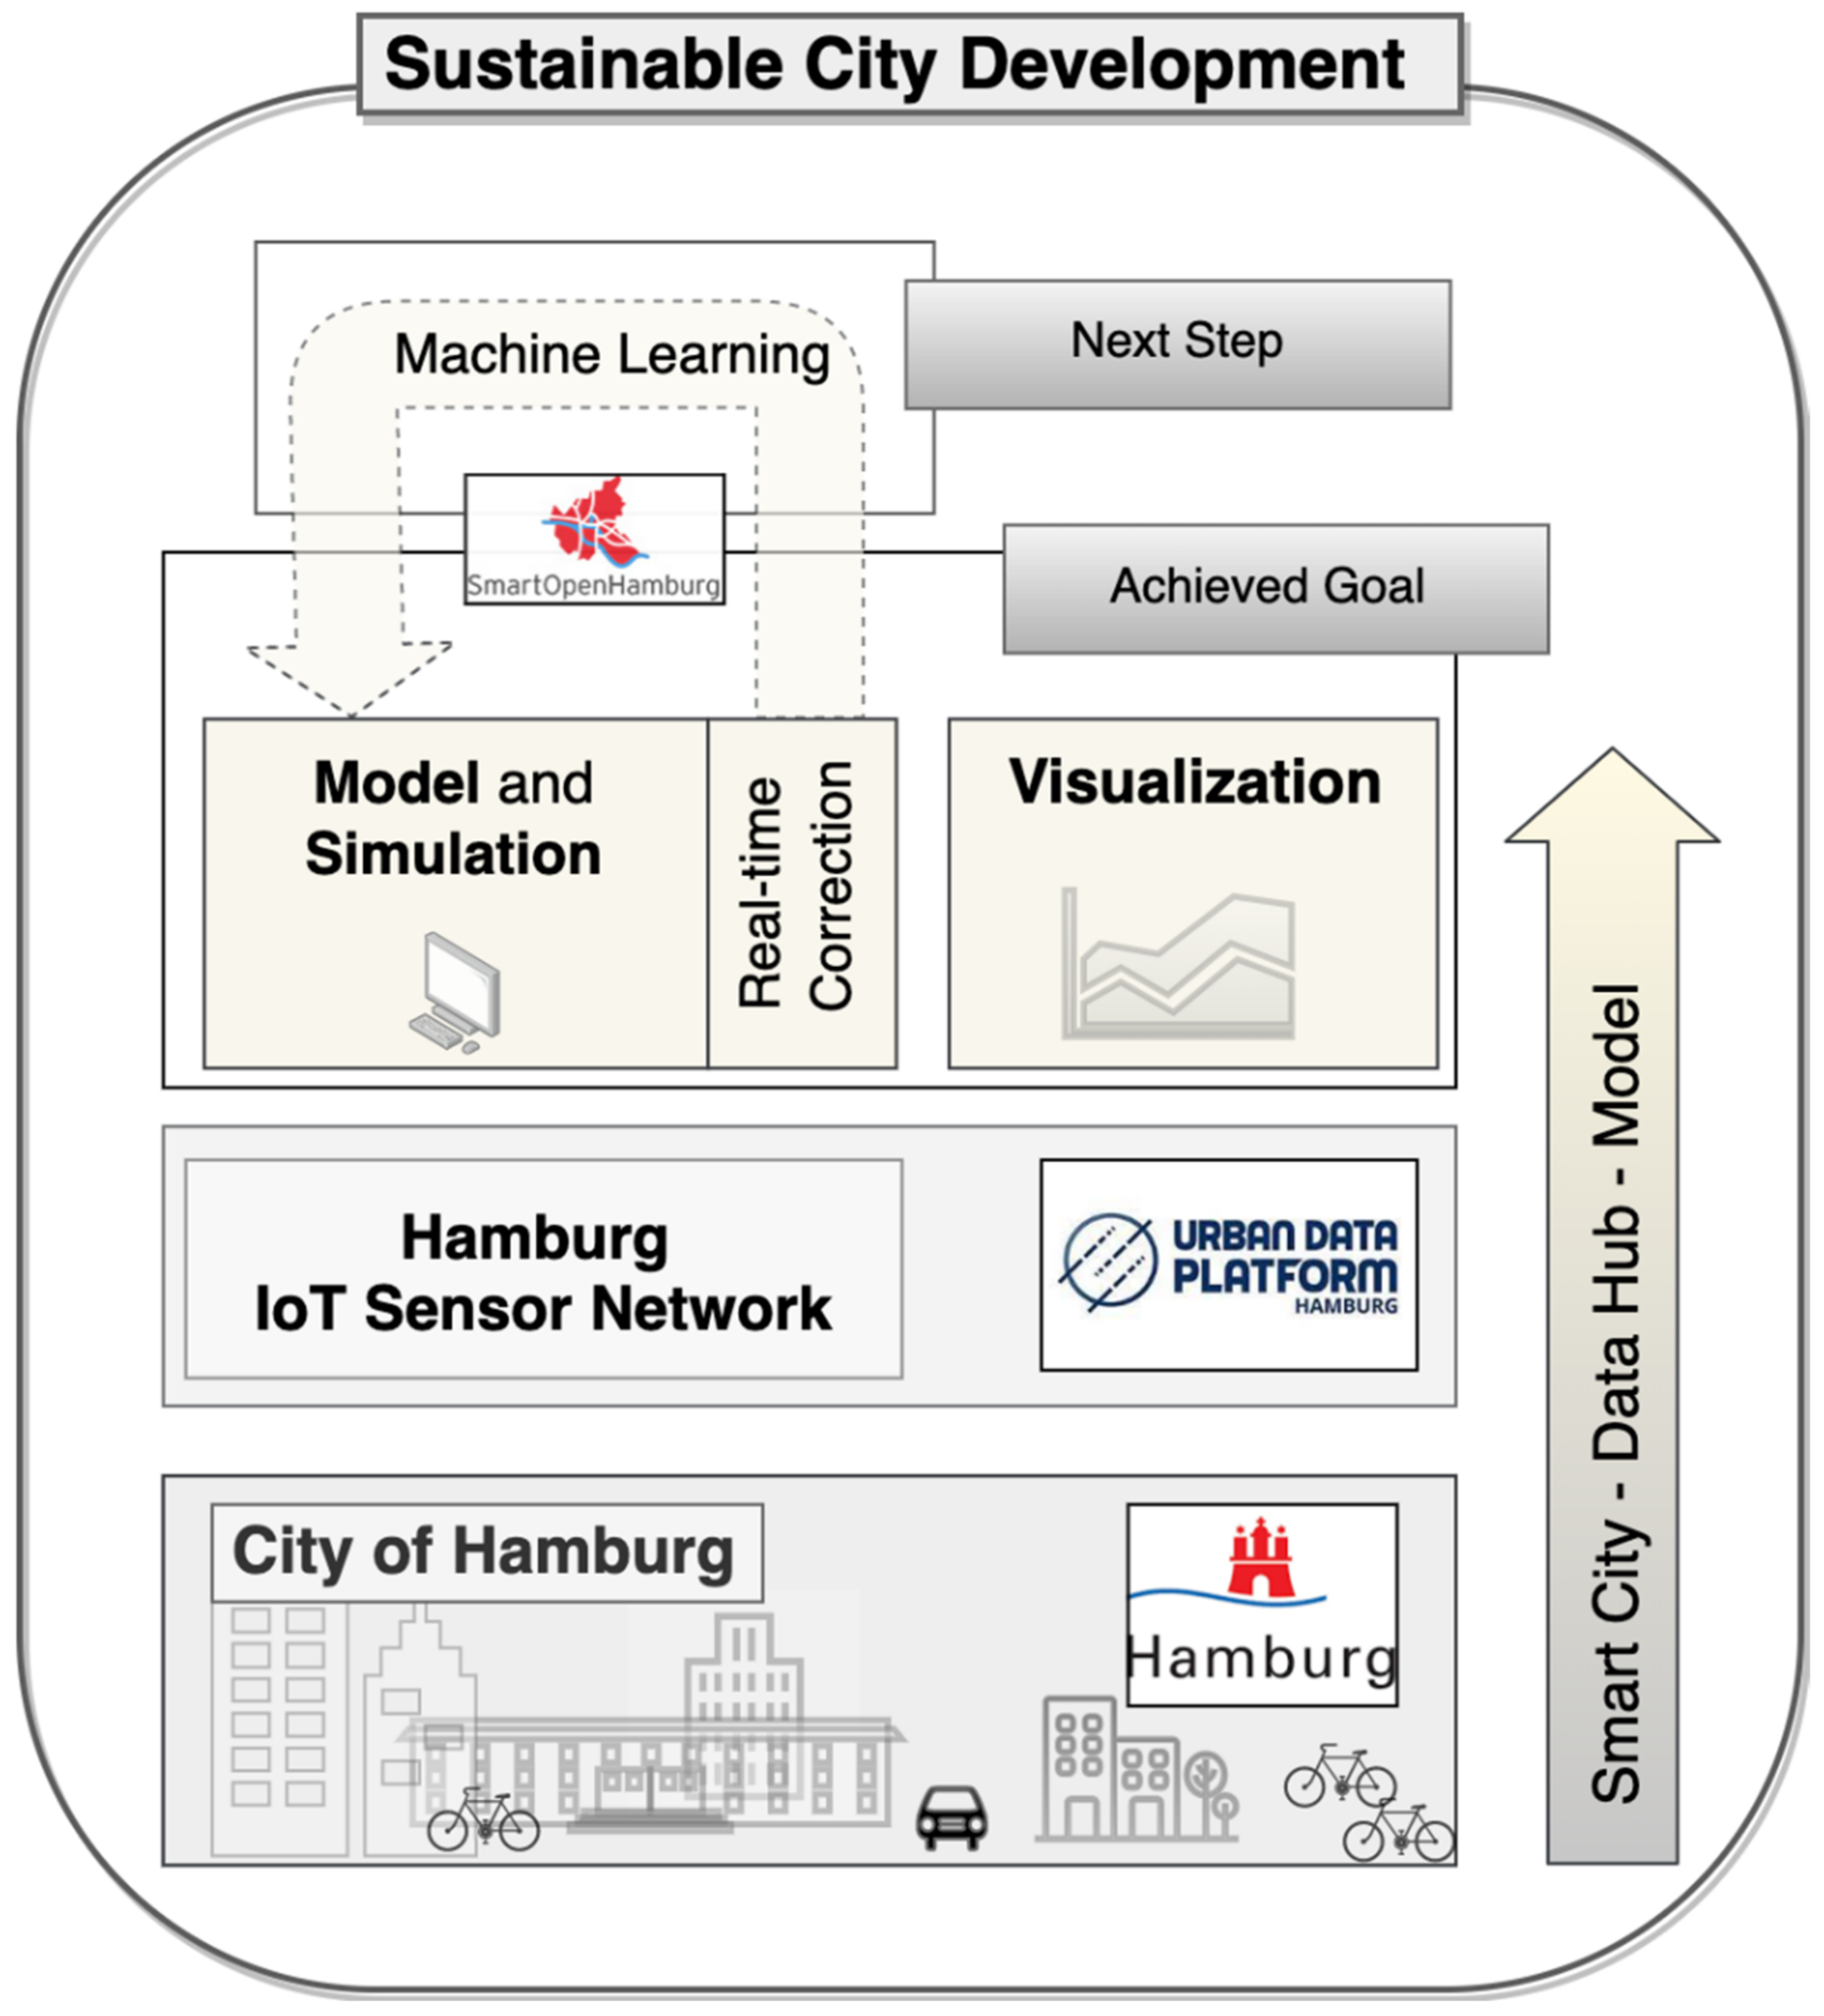
Figure 1 illustrates the high-level building blocks and components of our setup for this research: we linked a large-scale ABM of the City of Hamburg, Germany, with the Internet of Things (IoT) sensor network provided by the city’s administration, creating a submodel of the traffic system through that agents can navigate based on individual decisions and via multiple traffic modalities. Given that the model receives real-world data as input to integrate into its simulation runs, we consider it a digital twin (for more information, see [
2]). As multi-modality is one of the key components of the model, bicycle rental stations (RS) are taken as an example of a physical asset that is represented virtually within the model. By design, the use of a rental bicycle occurs in a larger multimodal context, given that a user must travel to and from a RS using other modes of transport.
We felt that modeling bicycle travel provides a well-suited context of study because it inherently involves human–environment interactions that are influenced by environmental factors such as weather and road conditions. It is important to note, however, that the proposed mechanism is not limited to Hamburg and bicycle sharing. Rather, it is transferrable to a wide range of geographic contexts and use cases, given the necessary geodata and sensor data required to model the environment of interest and perform corrections to simulations. As such, many issues related to sustainability, environmental health, and urban planning that can be tackled with a model-driven approach can also be supported by the proposed mechanism.
Figure 1 also illustrates a future potential of the type of corrective mechanism we propose and examine in this work. Given the proper tools from the fields of artificial intelligence (AI) and machine learning, corrections that were made to simulations of a model can be fed back into the model to train it. Such learning would be based on the model’s shortcomings that were observed during past simulations. The shortcomings, in turn, are derived from a comparison between the trajectory of simulation runs to the course of the model’s real-world counterpart, informed by real-world data. Since the present research is limited to correcting simulation runs only, it can be considered as a springboard to a way of developing learning models in future research.
There exists a good number of specialized, large-scale modeling and simulation frameworks for city traffic scenarios. MATSim [
3] and SUMO [
4] are prominent examples, each with a usage record spanning many cities globally. The underlying model structure is well-adapted to intermodal traffic solutions and allows for quick, special-purpose model development. However, we are not aware of existing software frameworks that cover the linkage between such a model and IoT sensors in a generalized way. The idea of linking software agents and IoT technology is relatively recent. Neyama et al. [
5] combine driving behavior in a vehicular IoT system with an ABM. Krivic et al. [
6] propose the use of an agent-based approach for the discovery and management of IoT services. Zheng et al. [
7] describe a universal smart home control platform architecture based on an ABM. Pico-Valencia and Holgado-Terriza [
8] and Savaglio et al. [
9] provide a good overview of systems and technologies in that context. Another promising approach to describe the interaction between a simulation model and its physical counterpart is ’symbiotic simulation’ [
10]. Such simulation systems are designed to support decision-making at an operational level by making use of (near) real-time data generated by the physical system and streamed to the development of the simulation model [
11].
Still, the ongoing utilization of real-world spatio-temporal data within simulation models holds many challenges. It is therefore advisable to create small and manageable models, constructing a virtual representation of a small subset of the real modeling space and growing it incrementally. Zaballos [
12] demonstrated an example of this by deliberately designing a smart campus digital twin that makes up only a subset of the entire university grounds. Zhang [
13] attempted to use models to optimize the communication between garbage collection trucks and garbage cans that are equipped with sensors. Lavalle [
14] did a recent exploration of information acquisition from and visualization of big data sources specifically for decision support. Sanchez-Iborra [
15] states that both rental bicycles and owned bicycles must be considered to accomplish meaningful change in the mobility and modality landscape of urban environments. Bačić [
16] observed that sensor systems can serve as a first step in the development of smart cities whose potential can be harnessed by models if they can interact with the data sources effectively. Saltelli [
17] expands on this thought by identifying the potential of datasets that emerge from sensor networks to increase model accuracy by allowing for better calibration. Yet, Clay et al. [
18] and Kieu et al. [
19] state that it is currently not possible to use ABMs for real-time simulation due to the absence of established mechanisms for dynamically incorporating real-time data.
The remaining paper is structured as follows.
Section 2 gives an overview of the technologies employed, the model used, and the data integration mechanism implemented to realize a means of performing simulation course correction with real-time data.
Section 3 provides a description of a proof-of-concept that serves to illustrate the capabilities of the implemented mechanism by applying it to a specific simulation scenario. In
Section 4, the results of the proof-of-concept are discussed and some challenges and implications of correctively intervening into the trajectory of an ongoing simulation are highlighted.
Section 5 offers conclusive thoughts on this contribution and suggests some avenues for future research in simulation correction and the mitigation of model uncertainty in general.
2. Materials and Methods
As part of the SmartOpenHamburg (SOHH) project, we developed a base model for individual urban mobility in Hamburg, Germany [
20] in which agents are virtual representations of people who travel within the city using a variety of modalities—bicycles and cars, among others. In this section, we provide a brief overview of the Multi-Agent Research and Simulation (MARS) framework, which was used to implement the model. Based on the framework’s components, the model design and the data integration mechanism are then described in turn.
2.1. The MARS Framework
The free (GNU General Public License) and large-scale, agent-based framework MARS [
21] has a history of applications in a variety of disciplines, e.g., climate change mitigation [
22], the modeling of adaptive human behavior [
23,
24], and traffic simulation [
20]. MARS comprises three core concepts: agents, entities, and layers.
Agents are autonomous software components that generally represent physical concepts with well-defined boundaries. In the given example, humans who are residents or visitors of Hamburg are modeled as agents.
Entities are essentially passive agents. Unable to act or move autonomously, they conceptualize objects like bikes, cars, or buses that can be utilized by agents.
Layers are made up of a set of spatio-temporal data. They describe the immediate surrounding environment that agents can interact with. Besides standard GIS formats like ESRI shape and raster-layer formats (e.g., ASC and GeoTiff), MARS also supports vector-layer formats such as GeoJSON and GraphML data. Georeferenced time series, e.g., precipitation or temperature, can be easily incorporated into a simulation run [
25].
The MARS runtime system has been implemented in C#, whereas models can be written in C# or in the MARS DSL, a domain-specific language [
21]. Simulations can be executed either on a local computer or in a cloud environment [
20].
2.2. Model Design
To integrate real-time data in the system, we created a model that uses only a subset of the available base model components. The model’s protagonists are agents named
CycleTraveler, each moving from a source coordinate to a destination coordinate on foot or, if feasible, using an entity called
RentalBicycle. Agents are spawned by the
SchedulerLayer that holds their temporal descriptions with, inter alia, their area of spawning and their area of destination. Within these areas, each agent’s exact start and goal coordinate is chosen randomly. An agent’s movement occurs on multiple spatial graph environments, each designated for a distinct travel modality (here: walking and cycling). The
SpatialGraphEnvironment (SGE) [
20] manages this graph, supervises all movement with respect to consistency (e.g., collision prevention), and allows exploration queries to collect information about surrounding agents. The SGE provides route searching capabilities and k-nearest neighbors (k-NN) queries to resolve nearest nodes. The spawning and destination areas may, however, lie beyond the SGE’s extent. To reach the graph (or their goal outside the graph), agents use entry (or exit) points, respectively. These points are defined in the
GatewayLayer, which contains gateway points between different sections of the city’s travel network (e.g., suburban railway stations). A threshold is defined within which the agents may enter the graph via the nearest node. If the distance to such a node is greater than the threshold, the agent enters the graph using the gateway point that is located closest to its goal. Similarly, an agent whose goal is beyond the graph’s periphery uses the closest gateway point if the threshold is exceeded (for more technical details see [
2]).
Within the simulation area, agents always start moving on foot. Each agent checks if switching to available transportation devices would make for a faster route to its destination. For example, entities called BicycleRentalStations can be explored by querying the BicycleRentalLayer to check if they currently hold a RentalBicycle. This action represents the real-world process of a person checking the availability of rental bikes remotely via a smartphone app. The agent chooses to switch if at least one RentalBicycle is available and if the time consumption for the detour to the BicycleRentalStation and from the target BicycleRentalStation to the goal is smaller than the expected time saved due to increased traveling speed. Bicycle rental occurs on a first-come-first-served basis; hence, renting a bicycle is possible only if a bicycle entity is available at the time the agent reaches the BicycleRentalStation. It is possible that all RentalBicycles available at a BicycleRentalStation are in use by the time an agent reaches it. The agent then must continue its trip on foot, either directly to the goal or to the next BicycleRentalStation with free RentalBicycles.
Deciding which modalities to use is part of an agent’s trip planning process. An agent searches for routes using the SGE and chooses different modalities depending on its capabilities and personal preferences. The fastest trip is constructed depending on the current situation, including the position and availability of vehicles. As the situation might change over time, a rerouting and replanning might be necessary when a RS is reached and no bicycle is available. Walking is the fallback modality and is always available to an agent.
2.3. Data Integration
The model’s connection to the real world occurs via a link between a BicycleRentalStation and the real-world RS that it models.
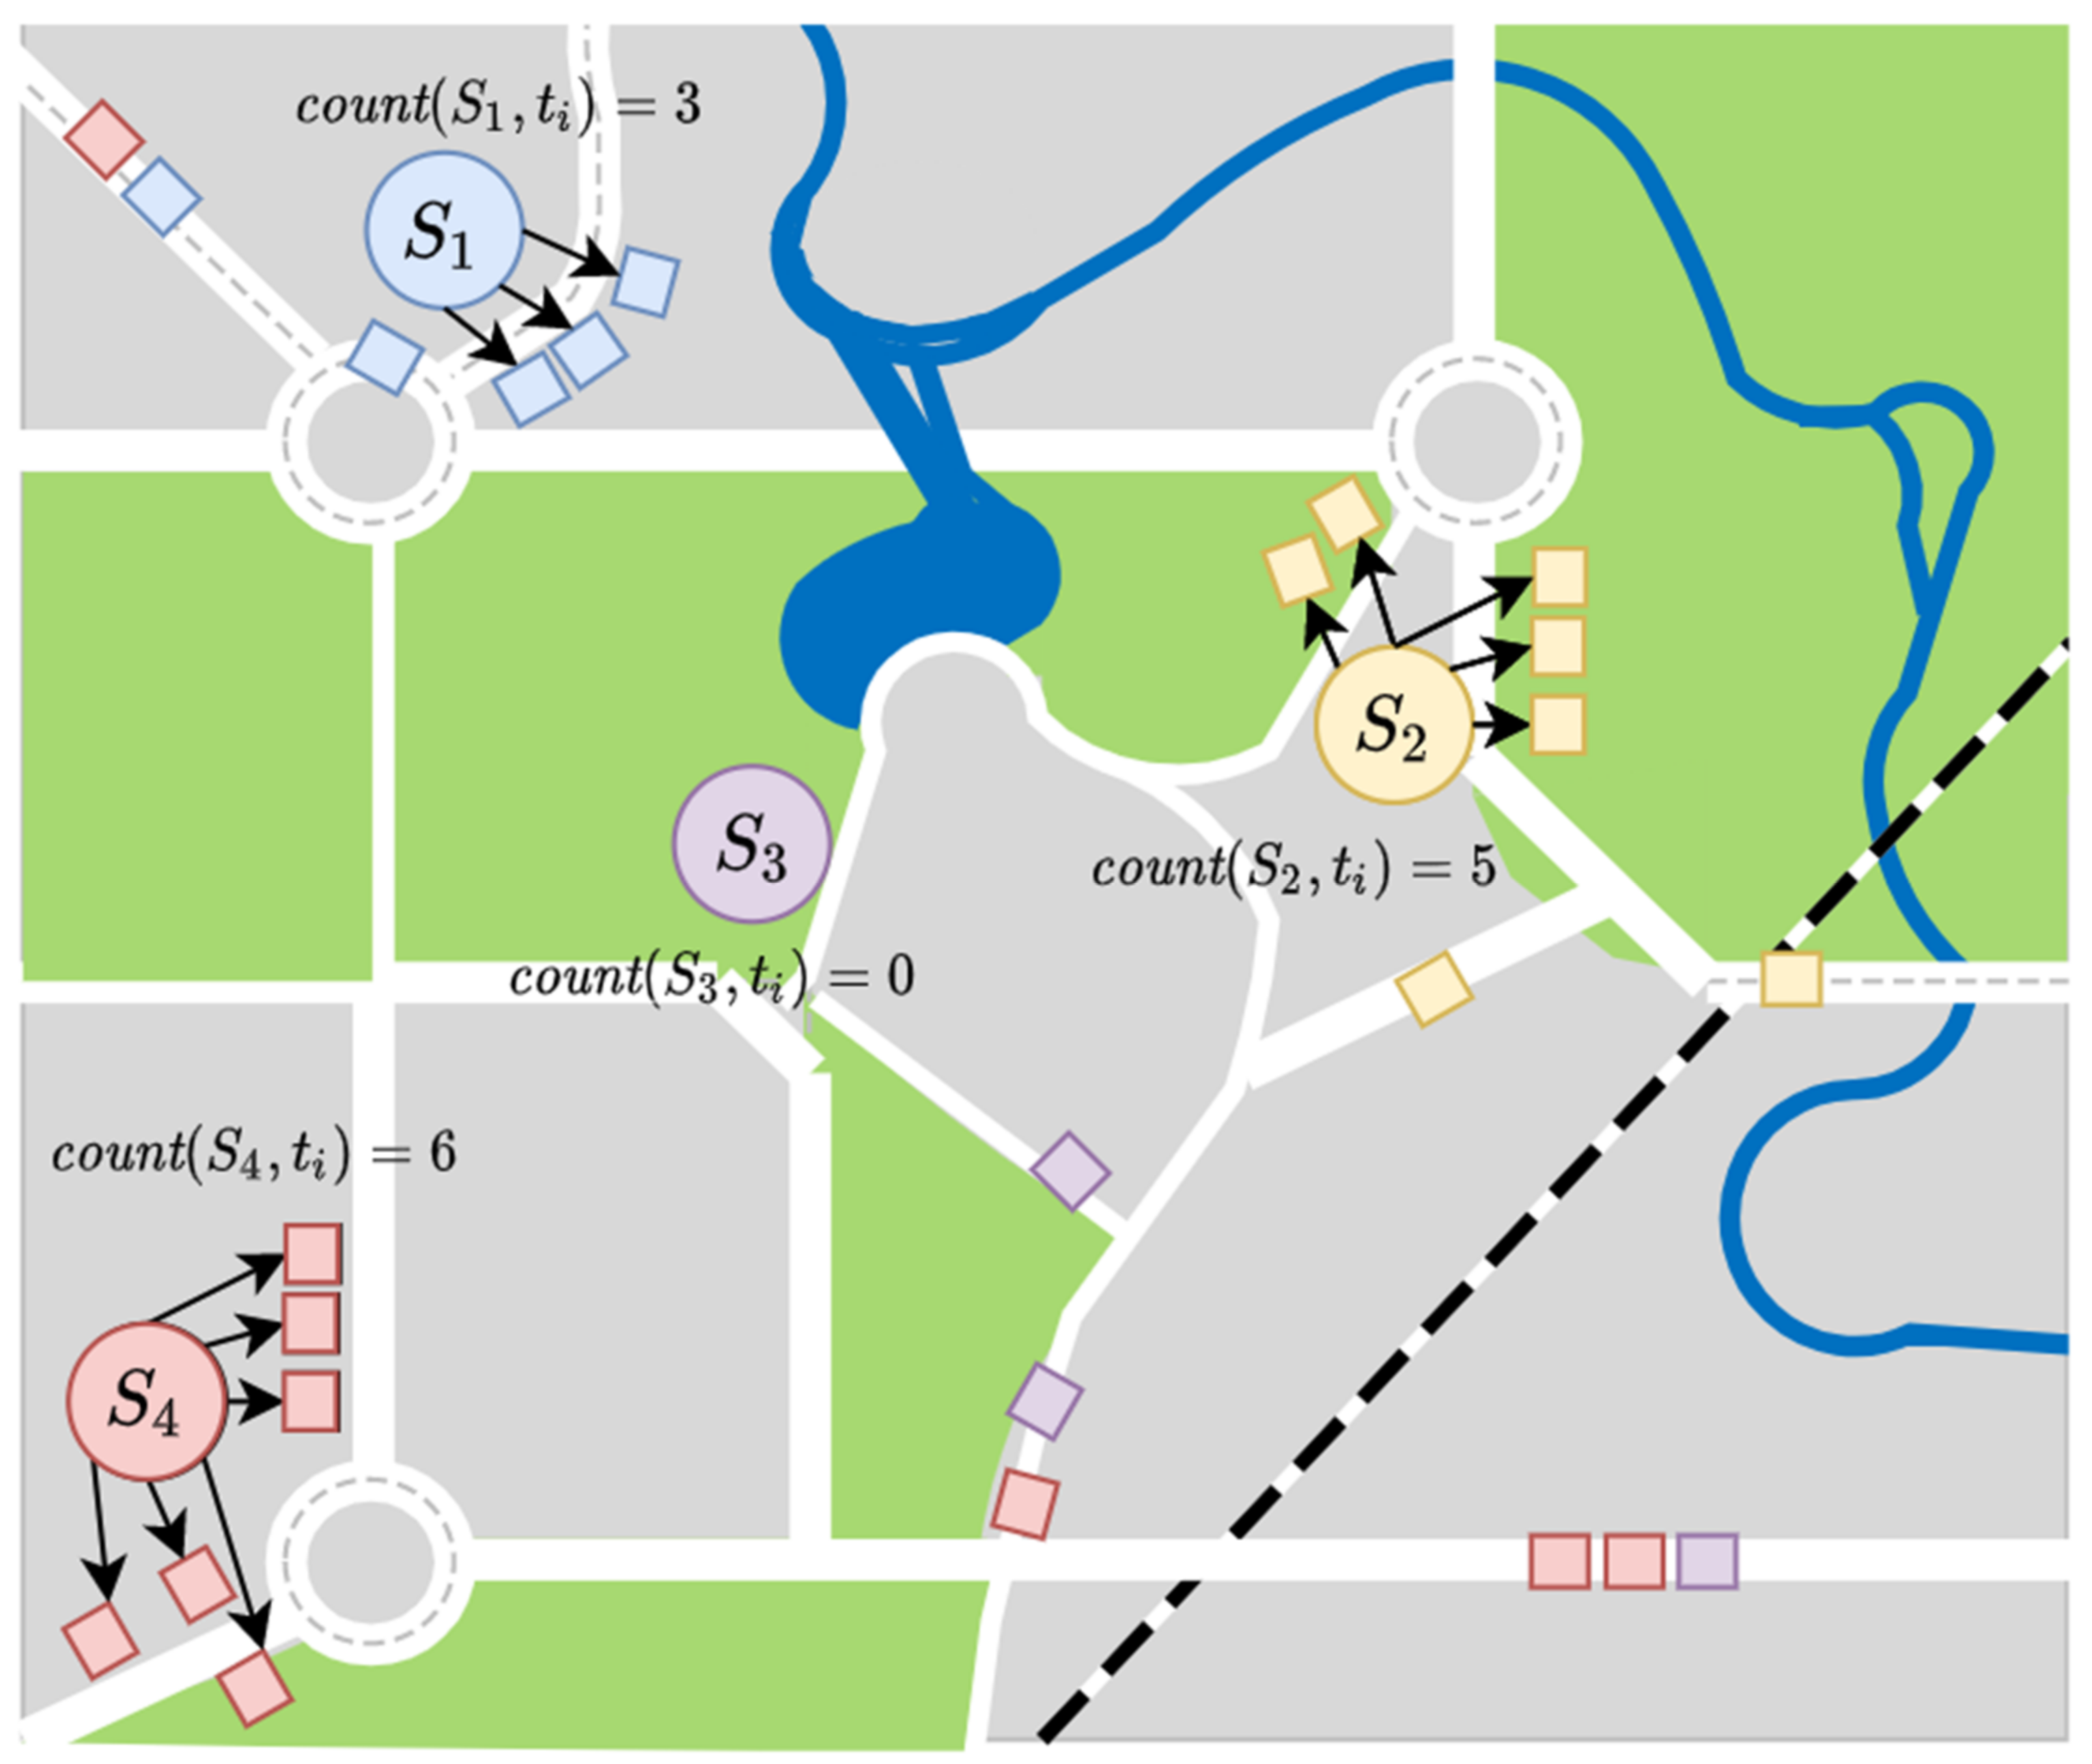
Figure 2 illustrates the flow of external data into the model. The RS retrieves information from the city’s sensor network and forwards it to the model, where it can be used by the agents during their travel planning and execution. Before being integrated in the model, however, the data require a mapping phase consisting of validation and sorting into a chronological catalogue (managed by the BicycleRentalLayer and TemporalVectorLayer). It is withheld from a given BicycleRentalStation until its phenomenon time (the timestamp from which the information is valid) and the simulation time intersect. The BicycleRentalStation may then integrate the information in its state. However, we implemented synchronization time points that notify a BicycleRentalStation to integrate the most up-to-date information in its state. Therefore, all BicycleRentalStations are synchronized at the same time point and not individually, even if new information for a particular BicycleRentalStation might already be available. Generally, such updates result in changes to the model that originate from an external source—in this case, the sensor infrastructure. Alternatively, internal changes (e.g., an agent taking the last RentalBicycle from a BicycleRentalStation) can impact the overall state of the model as well. In both cases, subsequent actions by agents are affected, propagating events independently so that new actions emerge and interact with spatial model object. In our model, the decisions and movements of CycleTraveler agents are affected, guiding them to currently available bicycle resources adaptively.
Generally, all model objects that are part of the simulation have a life cycle that depends on the creation time (see SchedulerLayer) and their deletion in conjunction with their specific purpose. However, BicycleRentalStations as temporal-dependent entities are created with the arrival of the first valid values and end when the last valid time range has been exceeded. Thus, BicycleRentalStations in the model are made available ad-hoc to new incoming data. Both the start time and end time are managed distinctly, employing valid and invalid time windows that run along with the simulation time (for more information and technical details, see [
2]).
The connection of the sensors is made additively by selecting and exchanging a key candidate in the input. For the scenario, a set of topic or device endpoints is assigned using parameterizable URIs (e.g.,
http://host.de/DataStream(${variable}/Observations, accessed on 10 June 2021) that is valid for each station or is bound individually by the BicycleRentalStation, populating the values for the containing parameters. Since MARS allows multi-source binding, it can be used to obtain key candidates from other external sources. For dynamic data in MARS, inputs are handled similarly to static inputs (such as constants, files, or database queries). MARS currently supports connection to native message queuing telemetry transport (MQTT) endpoints, SenorThings APIs (build upon MQTT), and Constrained Application Protocol (CoAP) as a means of direct connection from IoT devices. Apart from the push-based connection for new messages to a desired topic or device, only the SenorThings API currently allows queries via the Odata model.
For each monitored sensor, the simulation receives a new state from the SensorThings API wrapper when a state changes externally on the participating sensor object. SensorThings states are encoded as JavaScript Open Notation ((JSON), which is a standard file/data exchange format) and logically combine information from multiple sensors into a virtual thing. Things contain any number of observable attributes related to one or more previous geographic locations, each containing a geometric instance (e.g., polygon, point, and line). Monitorable properties are measured individually by one or more concrete sensors, where multiple sensory measurements for a property are aggregated to form a factual observation. A data stream provides observations and participation in changes from outside, associating the validity time and creation time with it. The aggregation with the validity time is called “feature of interest.”
All connectors are coupled to the simulation system via a mediator-wrapper system and connect the sources to a subset of its properties (
Figure 3). Each source abstracts from its schema and their location where it obtains the data, resulting in location transparency for the models. The SensorThings application programming interface (API) provides a spatiotemporal interface for monitoring sensors and observing changes in values of interest. The SensorThings API broker registers states’ change, and the observer receives the entirely new valid state for a given record time. For initialization before forecasting, given the scenario start time and studied location, MARS loads the spatiotemporal subset from the SensorThings API and adjusts the run for prognostic processing. When reaching the point in time at which the first forecasts are made, the simulation either couples to real-time and computes simultaneously to real-time or stops monitoring because new incoming external data and the validity period no longer intersect with the simulation time.
2.4. Simulation Scenario
After coupling the data integration architecture with the ABM, a scenario was prepared to serve as a proof-of-concept for the mechanism by which deviations accrued during a simulation can be corrected. The mechanism is applied to sensors of RS. The proof-of-concept strives to use the data integration mechanism to adjust, i.e., correct, if necessary, the number of
RentalBicycles per
BicycleRentalStation at the end of a simulation using real-time and historical data provided by the city’s sensor network. In particular, the Hamburg SensorThings API platform is integrated, though the set of sensors providing real data is presently still very limited. We distinguish between, on the one hand, the model design and description and, on the other hand, a simulation scenario of the model. The former (described in
Section 2) provides the general structure and functionality of the model, whereas the latter (described below) contains parametrizations and configurations for a particular execution of the model.
There are different synchronization strategies that can be pursued to mitigate the corridor of uncertainty that tends to widen over the course of a simulation. The approach presented here aims for synchronization via integration of external real-time data to adapt to the ground truth. In this sense, the implemented data integration mechanism can broadly be categorized as performing a mixture of soft and hard correction: on the one hand, the numbers of
RentalBicycles at
BicycleRentalStations are directly updated (hard) and, on the other hand, bicycles that are currently in use by agents are not affected until they are returned to a
BicycleRentalStation (soft) [
2].
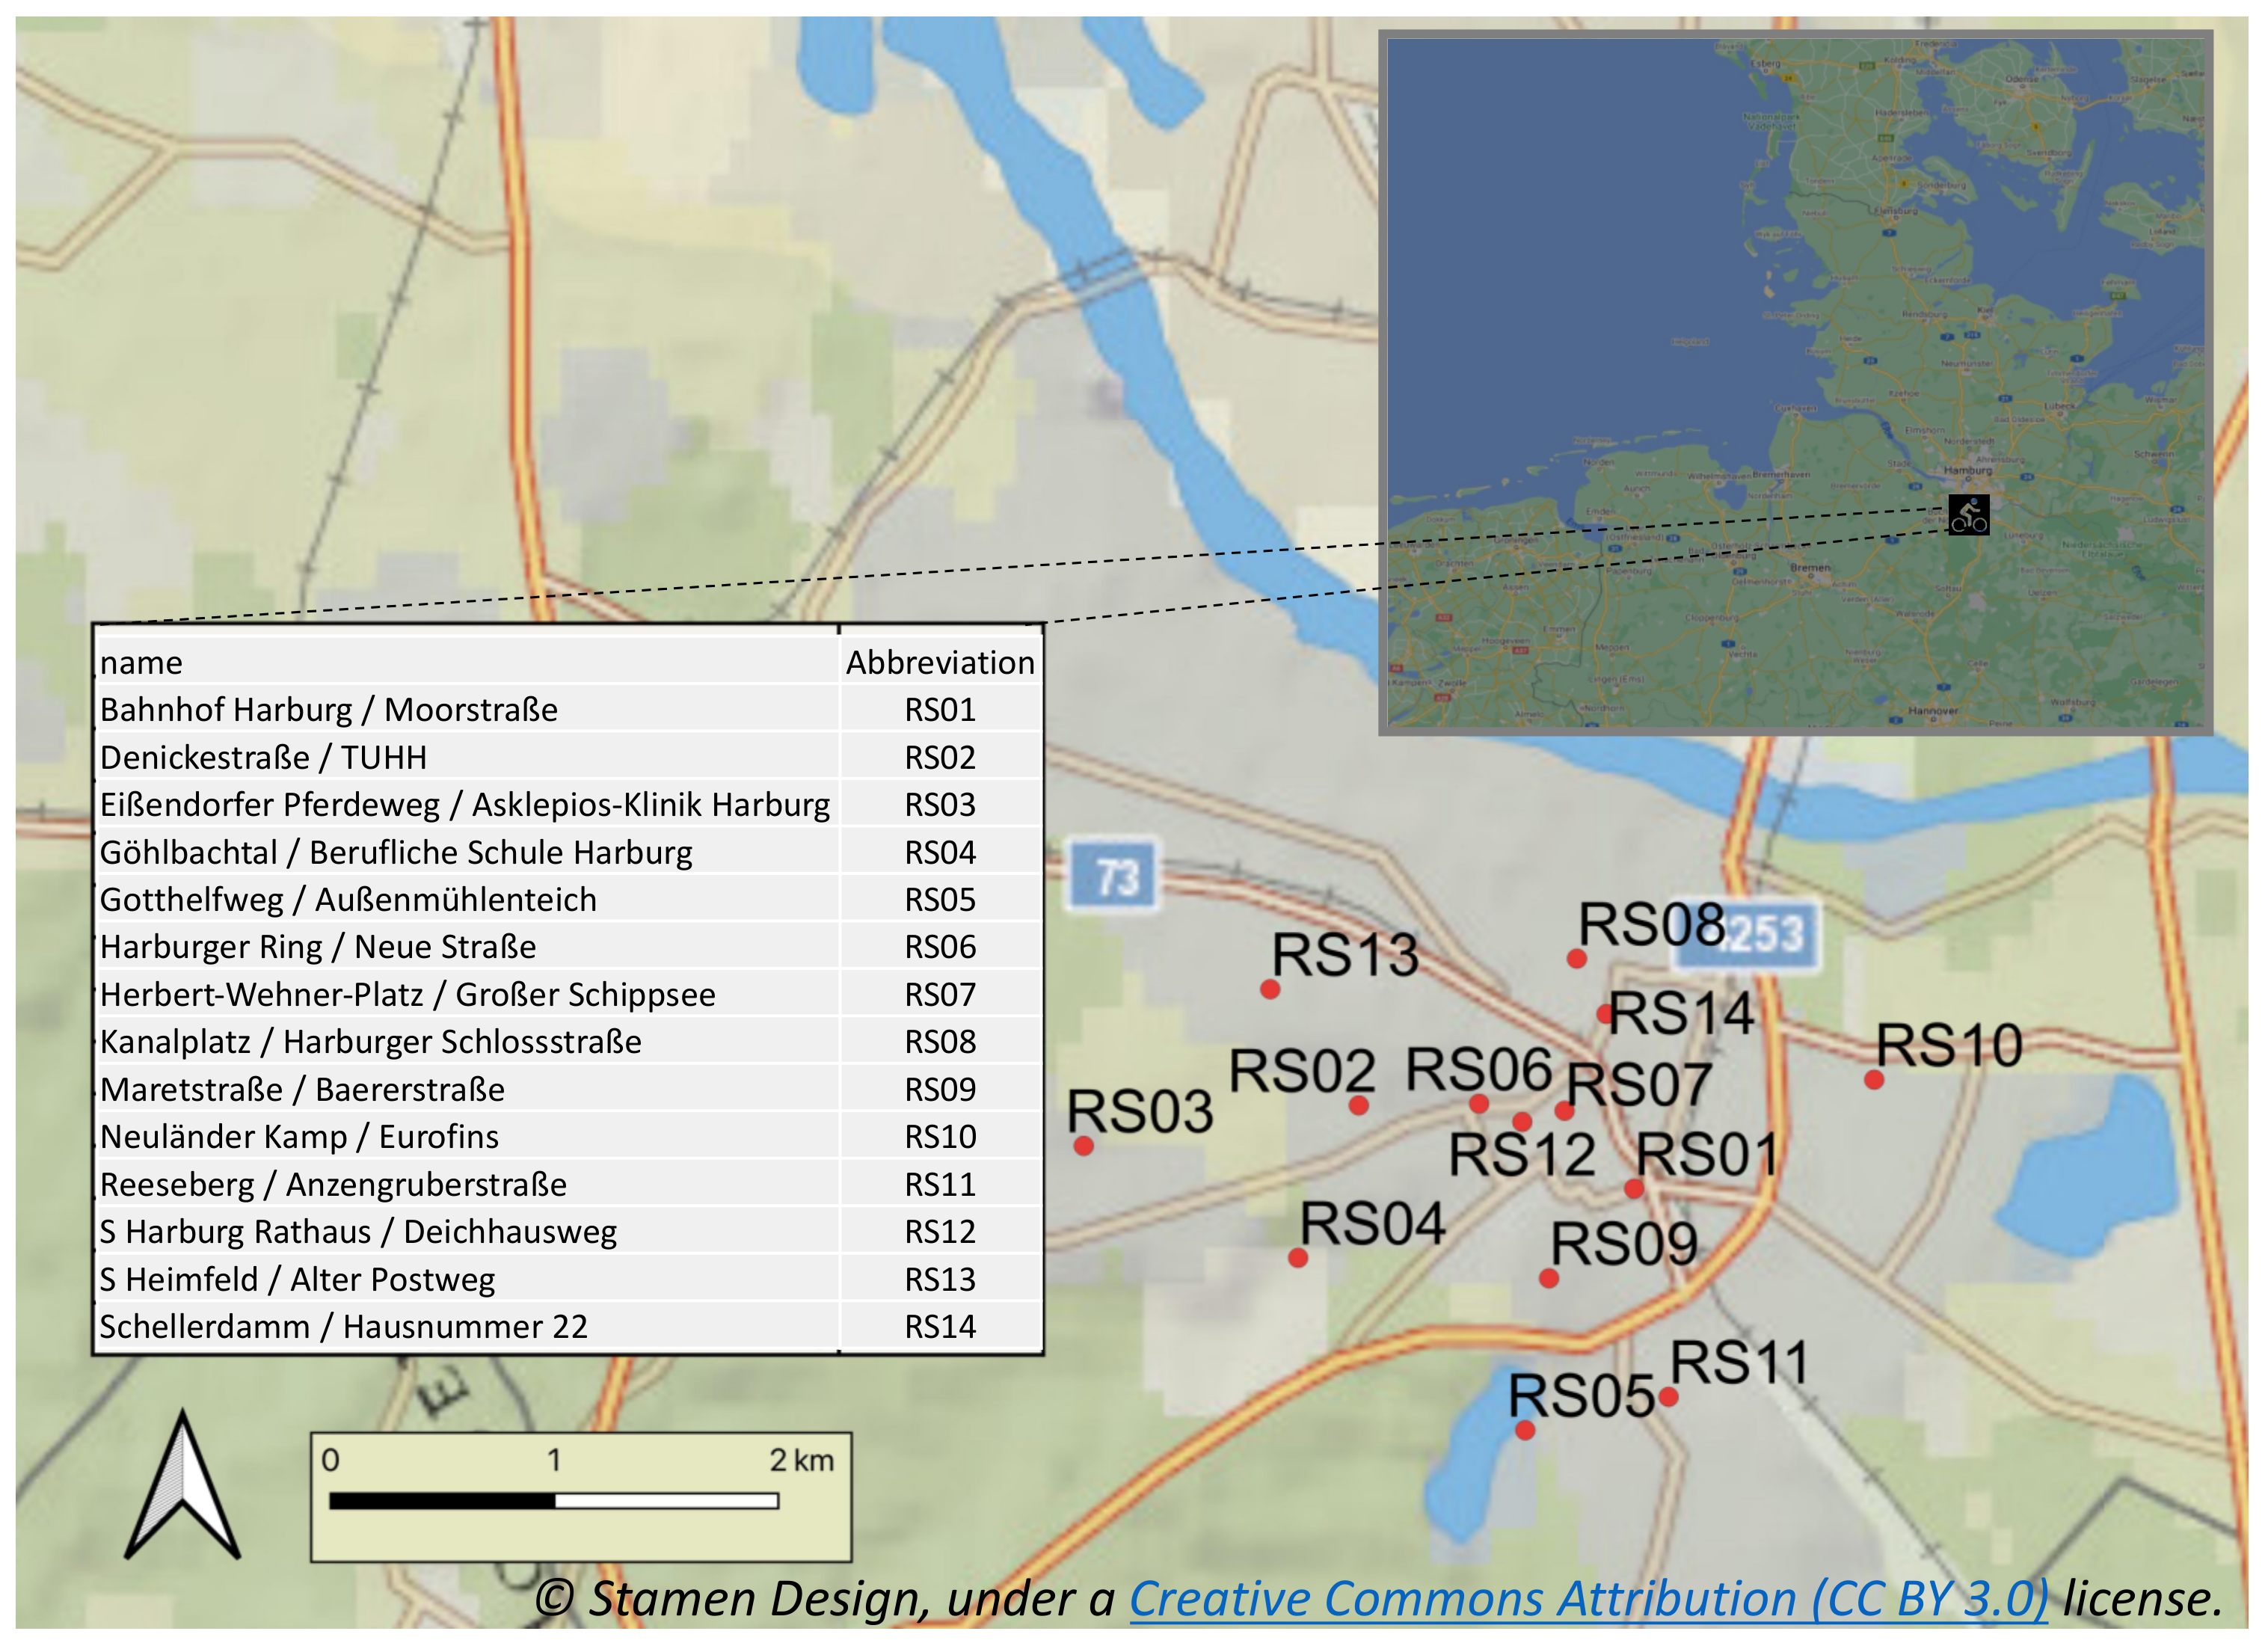
In the district of Hamburg-Harburg (the simulation area), there are 14 RS, making up 5.6% of all RS in Hamburg as of 2020 (
Figure 4). Between 4:00 p.m. and 6:00 p.m., there are, on average, 1,045 trips made by bicycle in Hamburg-Harburg, 20% of which (roughly 320) are made using a bicycle from a RS. On a monthly scale, this number is further reduced by 50%: people who use a bicycle from a RS do so less than once a month (data from mobility report MiD 2017 [
26]). Therefore, at most, 160 trips using a bicycle from a RS are expected to occur during the simulation window. There are three trip categories—local, outbound, and inbound [
27]—among which the number of trips is divided evenly. Given the upper bound of 160, the extent of under-usage of bicycles from RS is to be determined.
4. Discussion
This research presents a novel approach that integrates real-time data from the IoT into an ongoing simulation run of an ABM. The model’s connection to the real world occurs via an interface between real bicycle rental stations and
BicycleRentalStations in the model (
Figure 2). Based on the simulation results generated by the described proof-of-concept, different corrections of the modelled numbers of bicycles per
BicycleRentalStation were needed.
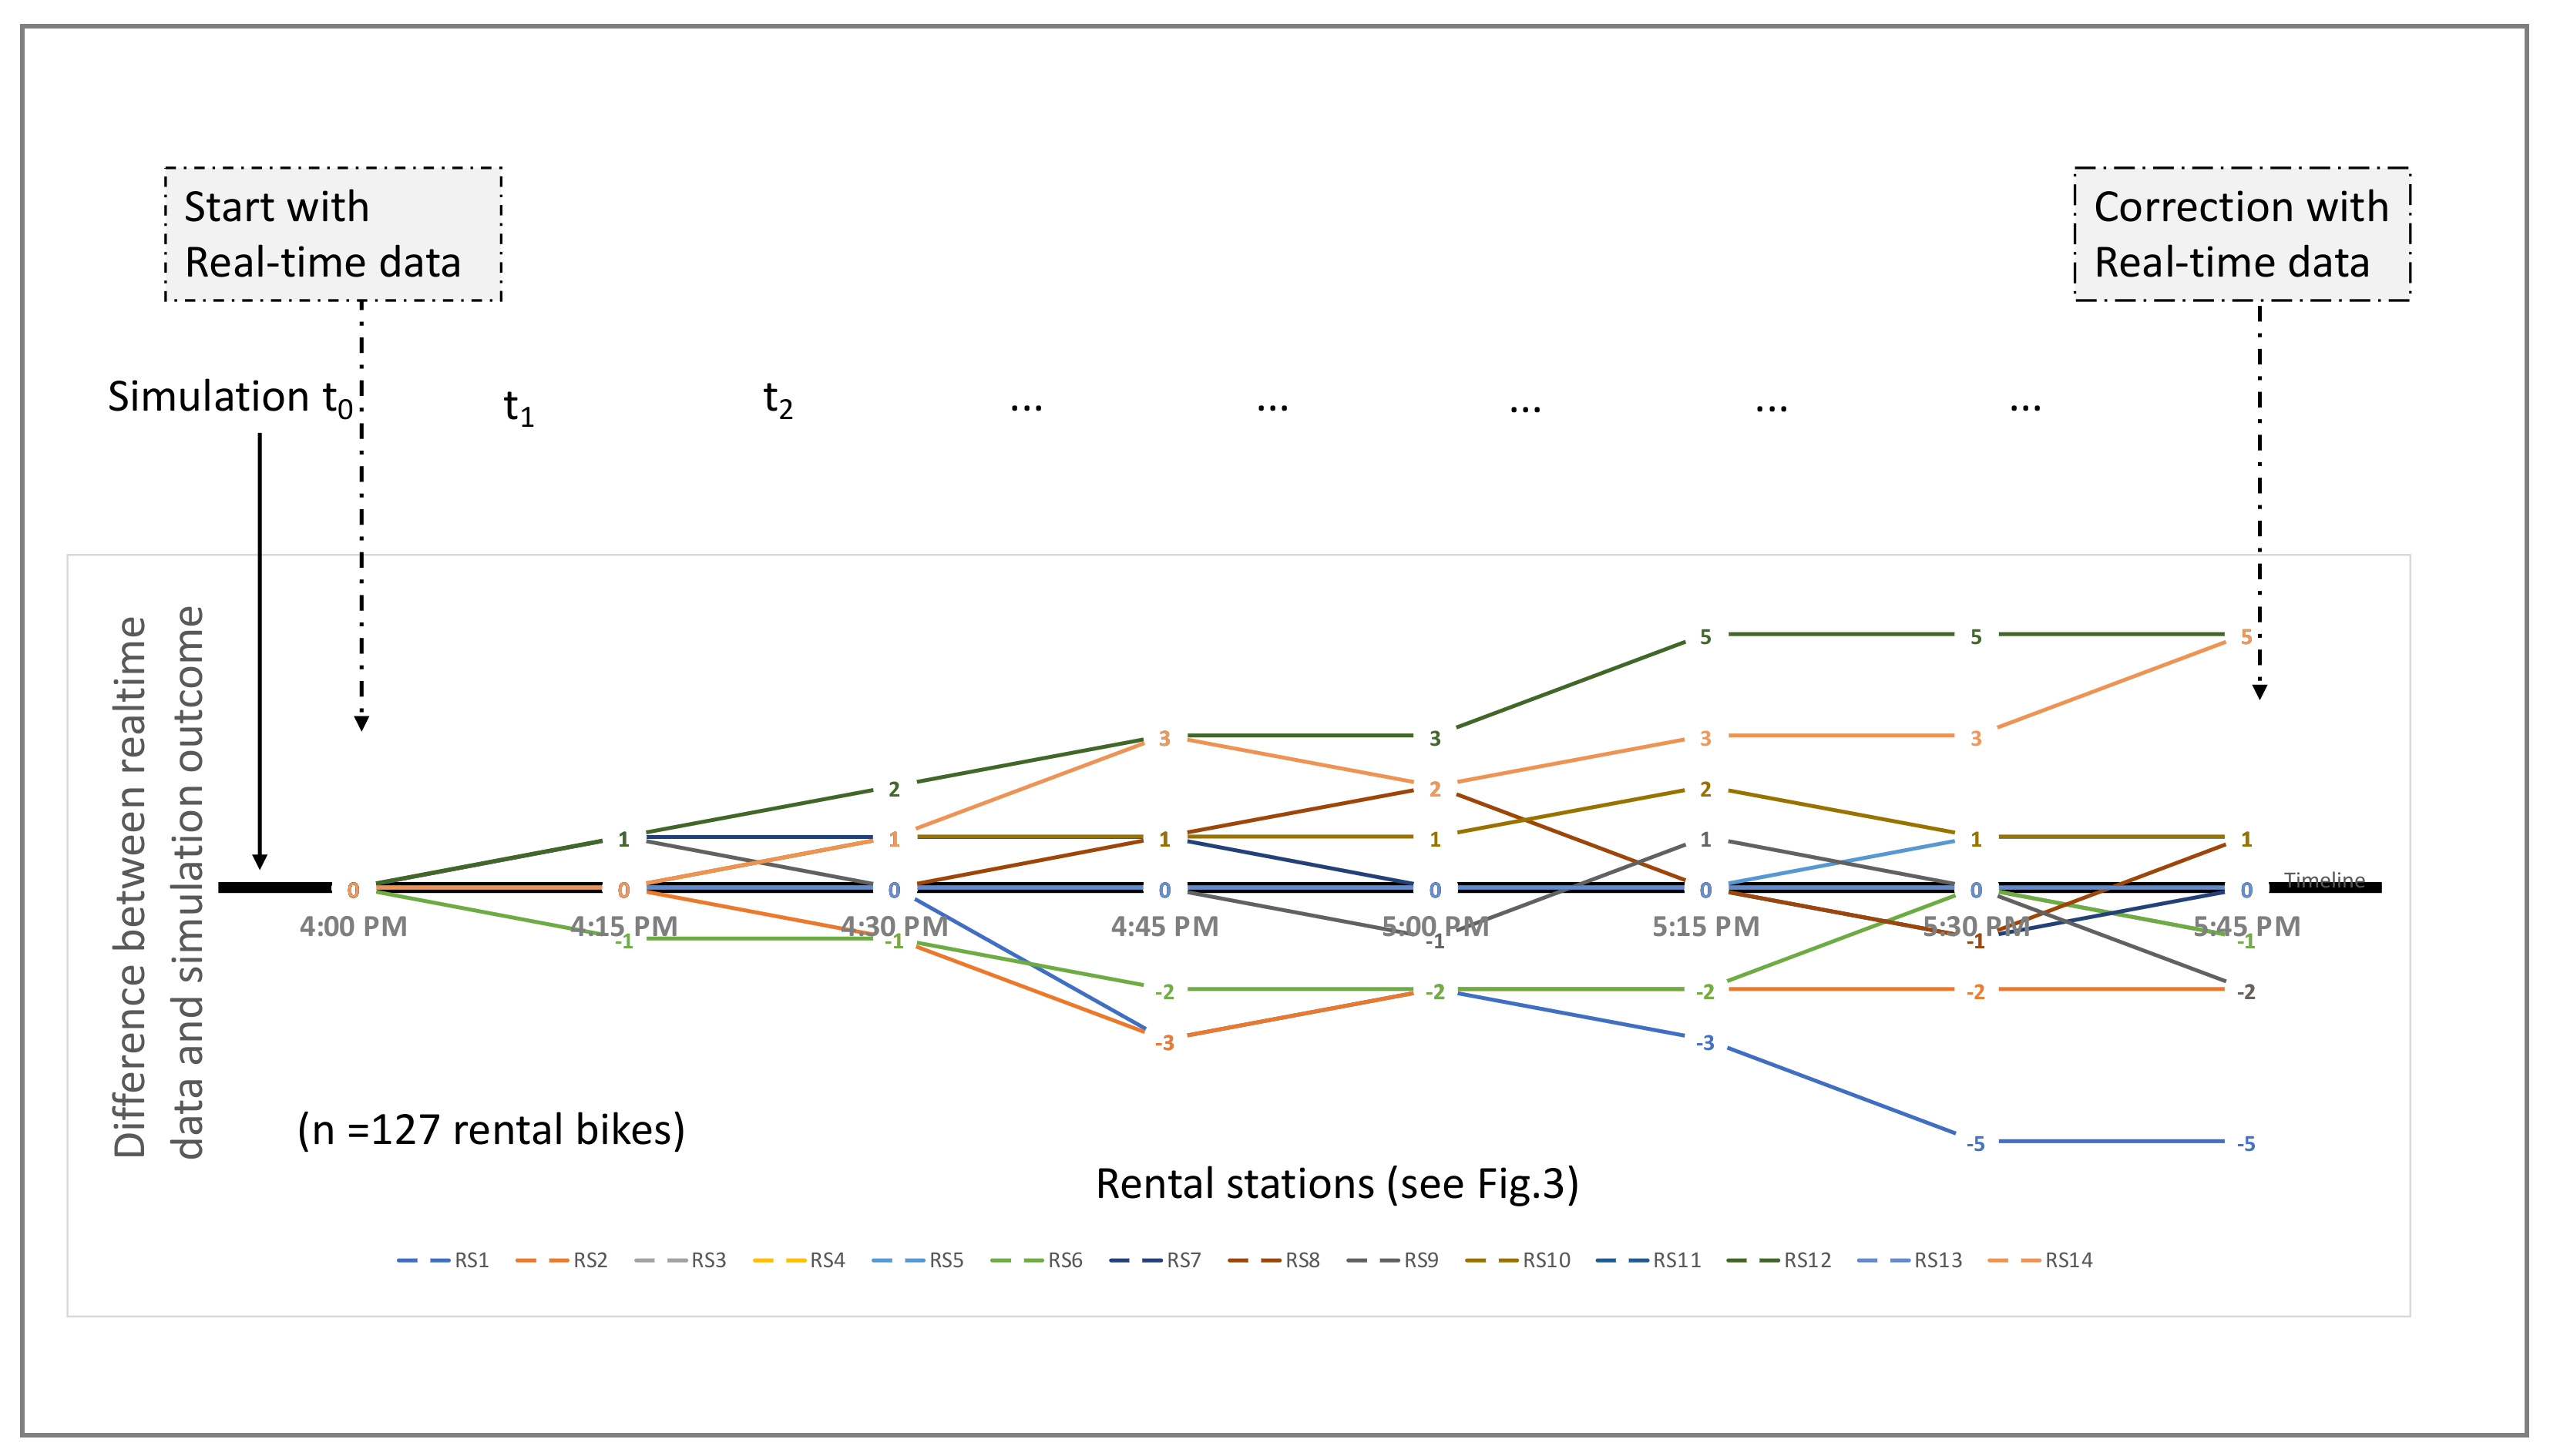
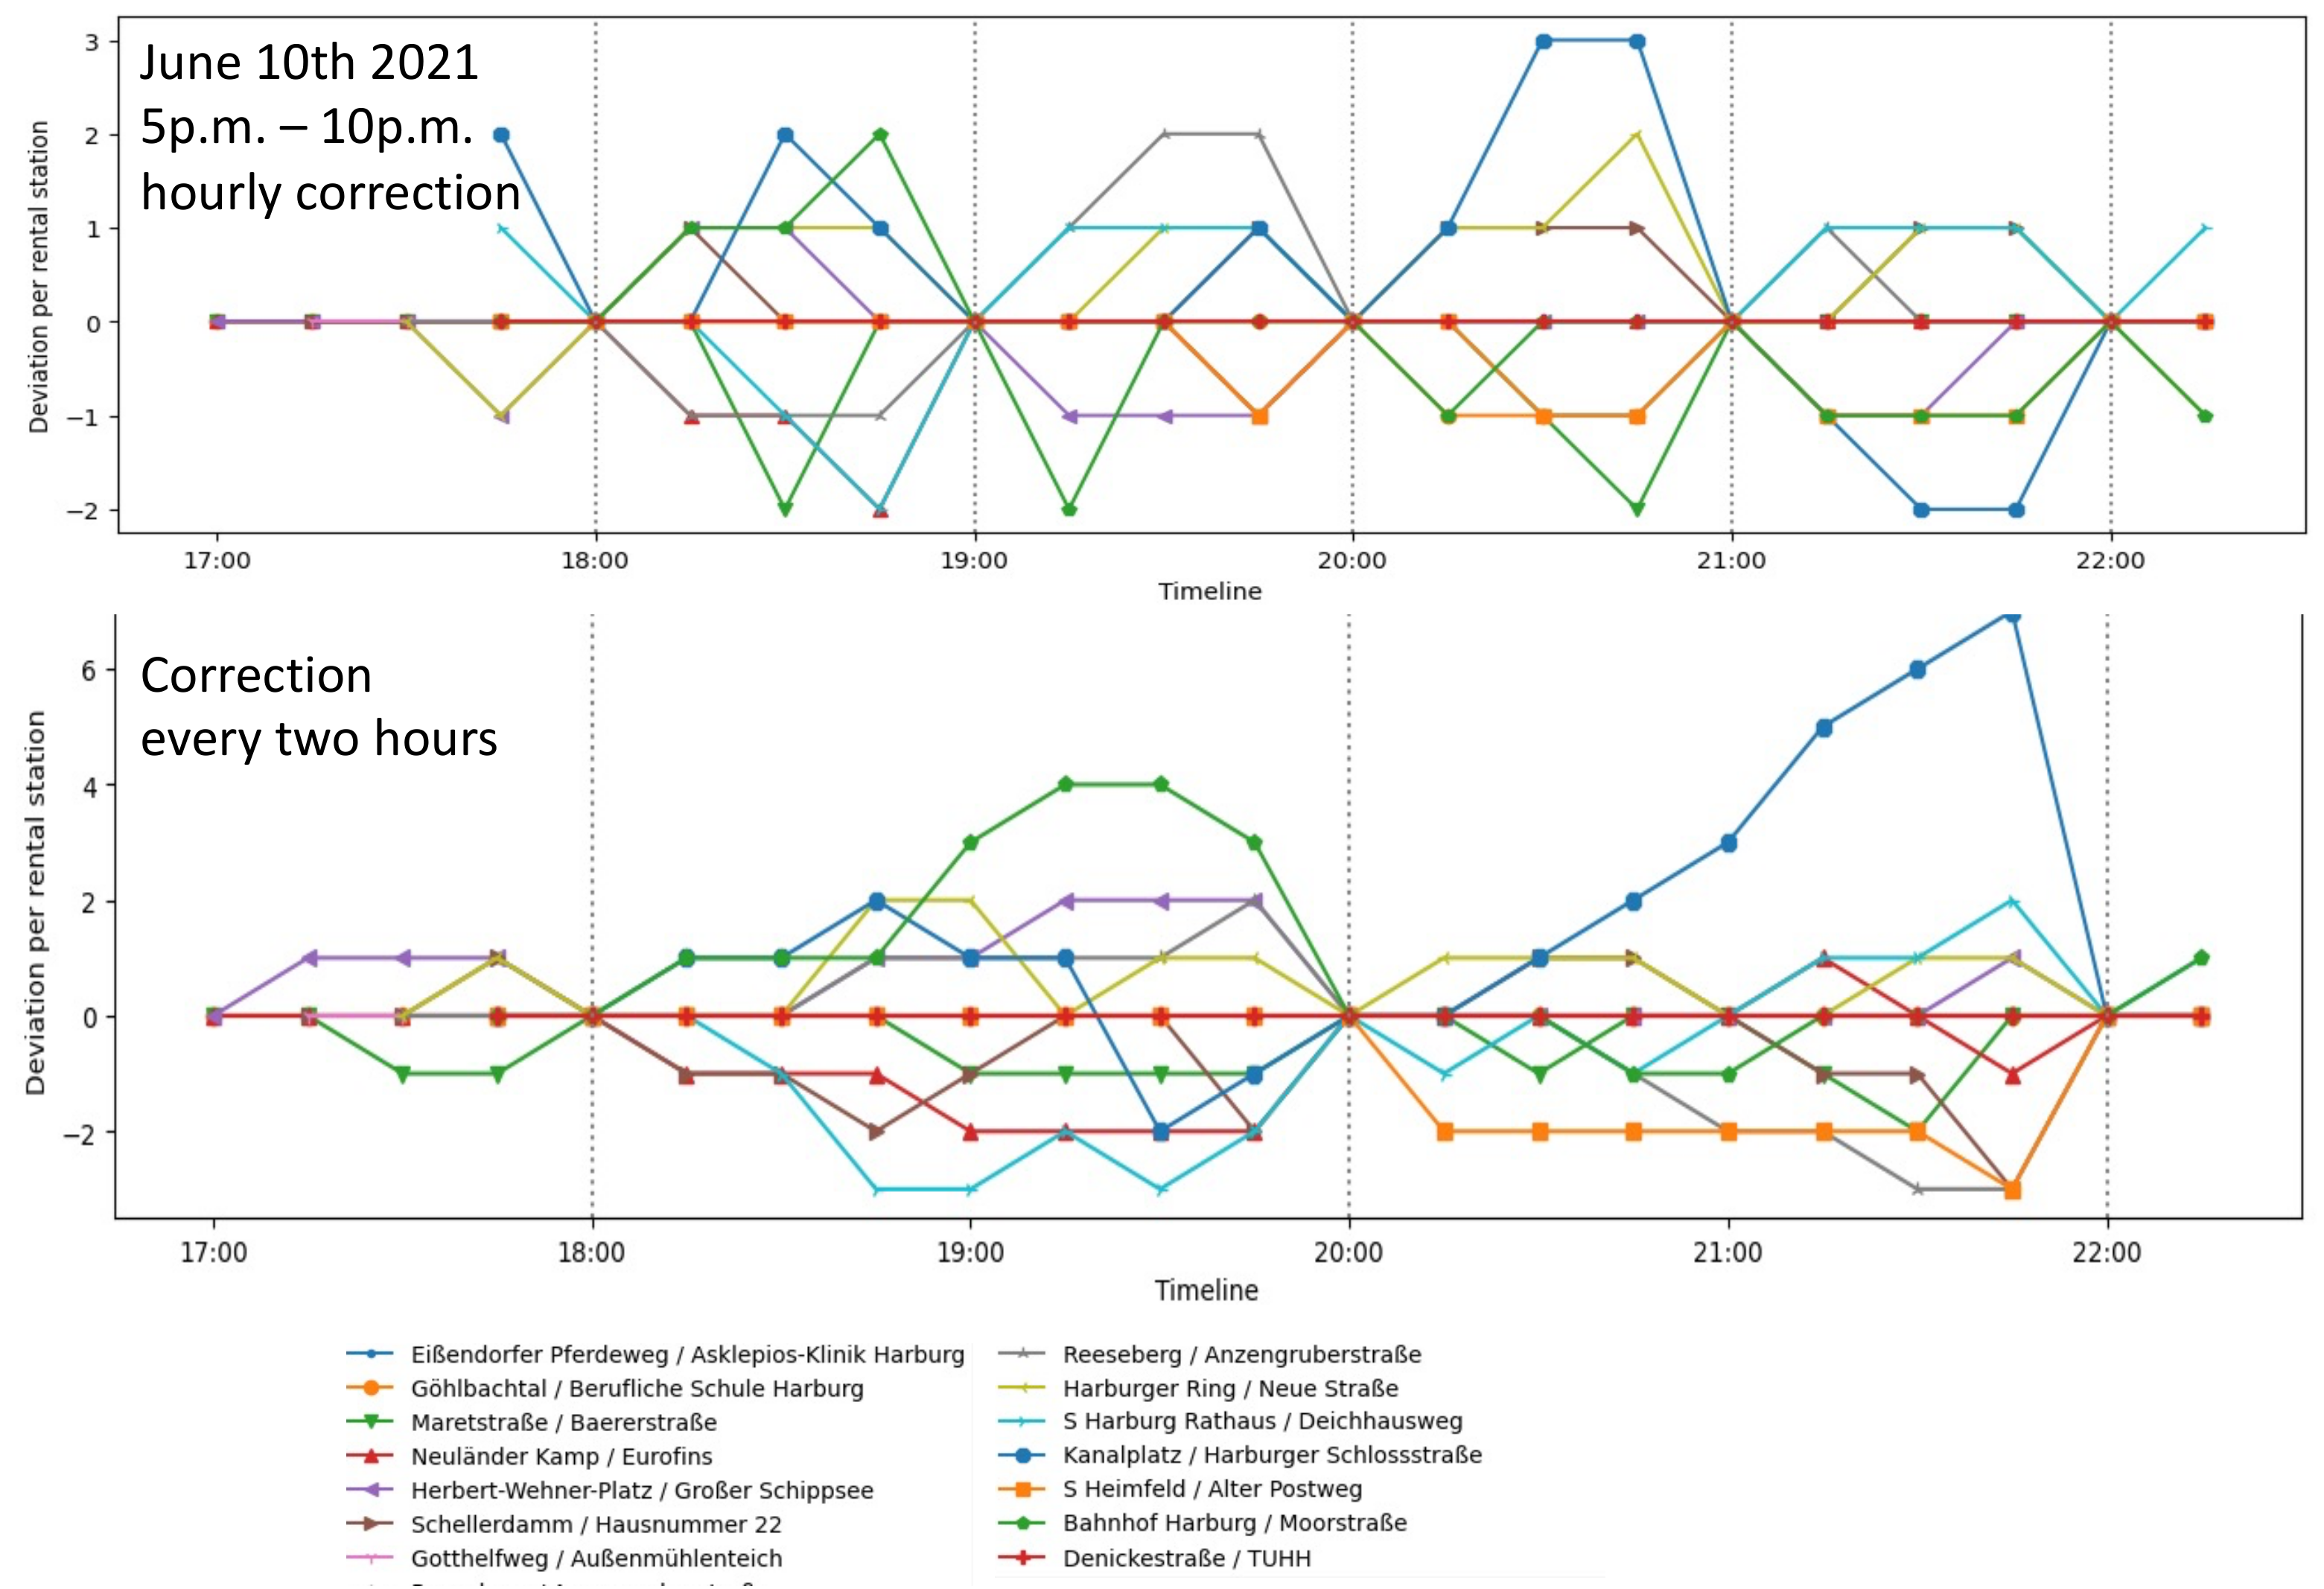
Figure 5 illustrates that the variance of the simulated values from the real world increases over simulation time. The synchronization with the real-time data potentially offers a corrective effect. However, as expected, the data generally overestimate the use of bicycles from RS on the particular winter day that was chosen for the simulation run. Although we are aware that temperature and precipitation have a significant impact on cycling [
28], the simulation does not consider weather data yet. In total, after two hours of simulation time, 11 bicycles were removed from the simulation at some RS, 13 bicycles were added to the simulation at other RS, and no bicycles were removed at still other RS (since their bicycle counts matched that of their real-world counterparts) (
Figure 5). These results are highly dynamic. Each simulation run will produce slightly different data, and due to the use of real-time data, the simulation always needs a current time frame or must import historical data. In this study, we focused on the integration of real-time data.
The simulation scenario displays the potential of temporal data for reducing the corridor of uncertainty at multiple synchronization points before predicting future states. The data trajectories shown in
Figure 4 and
Figure 5 indicate that the extent of the corridor may grow over the course of a simulation. The approach of coupling
BicycleRentalStations in the model with real-world sensors and getting updates from their physical counterparts led to corrected model states and simulation outputs. Furthermore, as expanded on during the description of the data integration mechanism (see
Section 2.3), it offers a means to dynamically affect agent behavior (in this case, adaptive replanning during travel) via external data that is related and relevant to the model.
One major challenge in creating a general-purpose integration was to join the real-world data objects with the model objects. We decided to increase or decrease the number of available RentalBicycles at the corresponding BicycleRentalStations. The model did not prevent CycleTravelers from using non-corrected station states. Therefore, RentalBicycles that are currently in use remain unaffected. As mentioned in the model description, we consider this approach a mixture of soft and hard correction due to missing information about current rentals. A hard correction would correct all model parts that are dependent on the data inputs (i.e., also remove RentalBicycles that are on the road at the time of correction). Having implemented a relatively hard correction mechanism (by adjusting the bicycle counts at each RentalBicycleStation to exactly the number provided in the data for its real-world counterpart) enabled us to obtain a quantitative measure of the corridor of uncertainty over simulation time. This measure has the potential to serve as a validation tool during model development and simulation. Generally, all synchronization strategies aim, at least in part, to increase or maintain the validity of the simulation. Other strategies may prove more useful depending on the domain or scenario at hand. Alternatively, a tougher condition would be to select the maximum/minimum as well as simply assigning them and removing all dependent objects. An analysis of different update strategies and their impacts on a given scenario is a promising area for future research and experimentation.
The overarching integration with its temporal change is practically domain-independent and transparent, but there are several aspects that still need to be realized by the domain model. This includes the integration of new data in the entities with its effects on the agents.
5. Conclusions
Smart and sustainable cities are considered by some authors as ‘deeply political projects’ [
29]. In fact, the UN Sustainable Development Goal 11 (SDG 11) is about sustainable cities and communities, making them more inclusive, safe, resilient, and socially inhabitable. Individual mobility plays a vital role in that concept. Kandt and Betty (2020) state: “the Mobilities paradigm offers a recent, practice-based perspective through which the embedding of digital technology in cities can be conceptualized.”
Given the exponential increase of data availability in many areas of society and research as well as the increasing number of technological possibilities in which data sources can be interacted with, the potential for integrating real-world data into models of real-world systems is apparent. We find that even our very basic proof-of-concept demonstrates that such an integration is a highly non-trivial task that holds great potential for improving the quality and efficacy of model outputs. The scientific community experiences growing demand for predictive capability, driven mainly by the interest in and necessity of providing policy stakeholders, planners, and city managers with reliable information. Model output data increasingly contribute to the bedrock of information on which stakeholders in a wide range of settings base their reasoning and decision-making processes. The use case presented in this contribution—smart traffic management in big cities—is merely one example. However, reliance on models implies an acceptable of the uncertainty that is inherent to them by design. Any effective mitigation of such uncertainty can result in reasonably increased confidence in model data and more robust recommendations that stem from that data.
Therefore, we assert that it is worthwhile to not only design semantically solid and sound models but to also design ways to dynamically correct divergent model states and maintain the integrity of simulation trajectories with respect to real-world parameters. The corrective mechanism using real-time data presented in this paper is an example of dynamic simulation correction. Particularly, the use of such a mechanism in the context of ABMs is promising because such models tend to have a probabilistic component due to their goal and ability to model individual human behavior and decision-making, which, viewed from the outside, is intended to appear non-deterministic. As the expressiveness and capabilities of ABMs increase, so does the possibility to equip agents with an increasingly high number of degrees of freedom (to create more accurate virtual representations of human behavior). Corrective real-time data streaming into simulation runs can prove to be a powerful tool for, on the one hand, allowing such complexity to express itself in model design while, on the other hand, managing the resultantly large state space of simulation runs and minimizing divergences from semantically valid states. However, an essential next step in developing the model further is the creation of a feedback loop which helps the model learn from past divergences, e.g., by utilizing a backpropagation algorithm like those found in machine learning.
Following SDG 11, smart and sustainable cities should be considered as complex adaptive systems. Therefore, the approach presented in this paper can also be seen as a technology that enables urban analytics that addresses the epistemological, practical, and normative challenges that arise in the context of urban policy [
29]. Sensors range from personal devices, such as smart watches, to air quality measurement devices, self-driving cars, and drones. Building collaborative and AI-based software components around them will certainly uplift the value of management dashboards and other tools.
It is apparent that the planning, building, and operating sustainable cities requires further transdisciplinary research from a large variety of disciplines to realize the vision behind SDG 11. Multi-scale dynamics—ranging from long-term trends to high-frequent, real-time dynamics [
29]—demand enormous efforts in the fields of modeling and simulation, artificial intelligence, and big data management, among others. The physical world needs to be linked adequately with its virtual counterpart. Our approach can be seen as one step towards realizing such a link. Other cities—besides Hamburg—are invited to join the initiative.


 ,
, 


