Article

Improving Irrigation Water Use Efficiency of Robusta Coffee (Coffea canephora) Production in Lam Dong Province, Vietnam

by
Duyen Nhat Lam Tran
1,
Tien Dinh Nguyen
2,
Thuy Thu Pham
3,
Roberto F. Rañola, Jr.
4 and
Thinh An Nguyen
2,*
1
VNU School of Interdisciplinary Studies, Vietnam National University, Hanoi 100000, Vietnam
2
VNU University of Economics and Business, Vietnam National University, Hanoi 100000, Vietnam
3
Center for International Forestry Organization Research (CIFOR), Bogor 16115, Indonesia
4
College of Economics and Management, University of the Philippines Los Baños 4031, Philippines
*
Author to whom correspondence should be addressed.
Sustainability 2021, 13(12), 6603; https://doi.org/10.3390/su13126603
Submission received: 8 April 2021 / Revised: 20 May 2021 / Accepted: 25 May 2021 / Published: 9 June 2021

Abstract

:
Recent prolonged dry periods and lack of irrigation water have severely affected the productivity of coffee farms in the Central Highlands of Vietnam. This paper analyzes the efficiency of irrigation water use for Robusta coffee (Coffea canephora) in the Lam Dong province. A Cobb–Douglas production function was used to determine coffee productivity’s response to the application of irrigation water and other production factors using data collected from 194 farmers, while the technical efficiency (TE) and irrigation water use efficiency (IWUE) were analyzed using a data envelopment analysis (DEA) model. The correlation of different factors to IWUE was determined using the Tobit model. The production function analysis using Cobb–Douglas shows that the volume of irrigation water, amount of working capital, labor, and farm size significantly influence coffee productivity. Indigenous farmers are more efficient in utilizing irrigation water than migrant farmers. The Tobit result indicates that farmers’ experience, education level, the distance of farm to water sources, security of access to water sources, extension contact, and credit access significantly affect IWUE. The study findings further suggest that mitigating water shortages in coffee farms require subregional and national policy support such as better access to credit and extension services, training, land management, and household-level efforts to improve farming practices through the application of appropriate technologies and traditional knowledge.

1. Introduction

Vietnam and Brazil both share the status of being the world’s top producers of Robusta coffee (Coffea canephora). Coffee is the second highest export-earning crop of Vietnam, which supports the livelihood of over two million people in rural areas. In 2018, the value of coffee exported was USD 3.54 billion, accounting for 2.5% of national GDP [1]. The coffee industry also plays an important role in reducing poverty incidence in the rural areas of Vietnam [2,3]. The majority of Vietnam’s coffee-producing area is concentrated in the Central Highlands, with 95% of Robusta coffee planted mainly in the provinces of Dak Lak, Gia Lai, Kon Tum, and Lam Dong [4,5,6].
Robusta coffee is profitable when produced intensively, utilizing large amounts of fertilizer, water, and labor [4]. In the Central Highlands of Vietnam, irrigation water is scarce, given the competing demands from other agriculture crops, industry, and households, as well as the poor irrigation management [1,7]. About 57% to 95% of the water used to irrigate the coffee farms comes from groundwater reserves [4,5], much of which is wasted due to over-irrigation by farmers [1,8,9,10]. In 2016, the amount of water in the West Highlands and Southeast region was not sufficient to irrigate about 470 hectares of coffee farms during the dry season [11]. According to the West Highlands Agriculture and Forestry Science Institute (2016), only about 72% of the regions’ households had a sufficient supply of water to irrigate their coffee farms.
To address this irrigation water scarcity [10,12,13], national programs, such as the Vietnam-Netherlands Partnership on Water for Food & Ecosystems (WFE) and the German-Vietnam Project-Integrated Water Resources Management Vietnam for Planning and Decision Support Tools, have been implemented to promote the sustainable use of water resources in the agricultural sector [14]. Through these programs, the levels of water supply and demand and consequent water surpluses or deficits were determined [15]. However, such studies did not provide information on the efficiency of water use nor its key determinants. A better understanding of the efficiency of irrigation water use for coffee production is important to improve the productivity of coffee farms and efficient water resources management.
Among the various indicators of efficiency of irrigation water use, the three most popular indicators used by international scholars are: (i) the ratio of water used to the amount of water supplied for a crop [16,17,18,19]; (ii) the ratio of crop productivity to the amount of water applied for a crop [20,21,22]; and (iii) economic return per unit of water used for crop production [18]. Among the internationally recognized mathematical models used for determining technical efficiency and irrigation water efficiency are the non-radial data envelopment analysis (DEA) and stochastic frontier analysis (SFA) methods. A non-radial DEA method allows us to reduce in different proportions the various inputs used in the production system [18]. A non-radial efficiency approach has a higher discriminating power in estimating the efficiencies of production units. These types of models are more effective for evaluating economic and environmental performance. In recent years, therefore, a number of studies have used the non-radial DEA approach [23,24,25,26,27,28,29]. While this approach serves as an important tool for identifying economic efficiency in the public sector (gas, water, heat, hospitals, etc.) and the private sector (banking, post, insurance, farms, etc.) [30], it is also widely applied in agricultural sectors [31].
The non-radial DEA measurement technique has never been used to determine the technical efficiency of irrigation water use for Robusta coffee production in Vietnam. This paper aims to calculate technical efficiency (TE) using irrigation water use efficiency (IWUE) as a measure for sustainable water use for Robusta coffee production in the Lam Dong province, Central Highlands of Vietnam [32].
This paper is organized as follows: Section 2 provides information on the research area, data source and sampling, data analysis, and empirical model specification; the main findings are indicated in Section 3; the discussions and conclusions are presented in Section 4 and Section 5. Main scientific terms used in this paper are listed in Table 1.

2. Materials and Methods

2.1. Study Area

The Lam Dong province is located in the southern part of the Central Highlands of Vietnam. The province has fertile, high plateaus with a large percentage of the province being forested [15]. In 2017, the total cultivated area in the province was 279,000 ha, of which 160,000 ha was planted with coffee trees. Since 2010, the total area of coffee plantations has increased by 12,000 ha. By 2020, the total area planted with coffee over 20 years of age, will be 60,000 ha [33].
The Lam Dong province, with its warm tropical climate and distinct dry and rainy seasons influenced by the South Asian monsoon, is suitable for coffee production. The average rainfall per month of the province ranged from 130 to 180 mm (1750 to 3150 mm a year) in the period of 2002–2018. The temperature slightly increased from 18 °C in 2002 to 18.4 °C in 2018, which peaked at 19 °C in 2016. The temperature changes resulted in water resource scarcity for coffee production.
Coffee is a key cash crop for Vietnam, as 23% of the total national land area is allocated to coffee production. In Lam Dong, coffee production generates the highest gross output in comparison to other crops such as rice, tea, and cashews. However, coffee production is severely constrained by the lack of irrigation water, especially during the dry season when the level of groundwater drops significantly. Currently, the main water supply source for coffee is surface water (80%), while the remaining 20% is sourced from groundwater. Currently, extended irrigation is the usual method of distributing irrigation water in the province’s coffee-growing areas. Notwithstanding, only about 40% to 50% of coffee-producing areas are serviced by irrigation systems, while the rest use groundwater for irrigation [33]. During the dry season of November 2013 to April 2014, for example, the amount of coffee produced from about 3600 ha of the planted area was reduced by 20%, while agricultural crop production from 36,200 ha dropped by 5% due to the shortage of irrigation water. Inefficient use of water resources further put the coffee sector in a vulnerable position. Based on the studies of West Highlands Agriculture and Forestry Science Institute, the standard volume of water required for coffee ranges from 650 to 800 m3/ha. Currently, however, about 72% of coffee households in the province irrigate twice the standard water requirement for coffee (ex: 1200 to 1500 m3/ha), which not only increases input costs but also contributes to a depletion of water resources. Only a few areas utilize other irrigation systems such as furrow irrigation that would conserve water. Both surface and groundwater have become so polluted from intensive agricultural production that they have affected coffee productivity [33].
The Lam Dong province has suffered from drought since 2010, with the majority of the coffee area (78%) using surface water (water from lakes and ponds) and the rest utilizing groundwater [34]. The majority of coffee farmers in Lam Dong continue to use the overflow irrigation method, using pumps to harvest water from rivers and lakes. Together, they comprise approximately 71.51% of the coffee area in the Lam Dong province [35].

2.2. Data Collection and Sampling

A simple random sampling method was employed to selected coffee farmer respondents for the survey. The sample size for farmers was calculated based on [36]:
n 0 = Z 2 p q e 2
where n0 is the sample size; Z2 is the abscissa of the normal curve that cuts off an area α at the tails (1 − α), which equals the desired confidence level (e.g., 95%); e is the desired level of precision (sampling error); p is the estimated proportion of an attribute that is present in the population; q is 1 − p. The value for Z refers to the area under the normal curve found in statistical tables.
Then, the finite population correction for proportions method to adjust n0 achieved from Equation (1) is as follows:
n = n 0 1 + n 0 1 N
where n is the sample size after adjustment and N is the population size of Robusta coffee households in the Lam Dong province, Vietnam.
In order to ensure its homogeneity in land use policies and weather conditions such as rainfall, a total of 194 coffee households in Di Linh, Lam Ha, and Bao Lam districts were selected to gather primary data from the 2016/2017 crop seasons in the province through face-to-face interviews using household questionnaires. These districts which are increasingly facing problems of water scarcity have an average rainfall per month ranging from 130 to 180 mm. The main water sources for coffee production in these districts are surface and groundwater. The questions covered by the interview include general information of household heads, family members and laborers, coffee production output, input costs, and irrigation systems. The coffee household heads were randomly selected from the list of coffee household producers in each district. Three focus group discussions that were participated by 40 coffee farmers in the province were organized to identify the coffee irrigation practices of coffee farmers as well as the challenges of coffee production.

2.3. Empirical Models

2.3.1. Data Envelopment Analysis (DEA)

The level of efficiency can be determined by estimating the production function from the sample data, using either the parametric (SFA) or non-parametric DEA methods [37]. The advantage of the SFA approach is that the frontier is stochastic and allows the effects of noise to be separated from the effects of inefficiency. However, it needs prior specification of the functional form of the production function and the distribution of the one-sided error term [38]. The non-parametric DEA approach can avoid these limitations but assigns all deviations to inefficiencies, therefore becoming likely to be sensitive to outliers [39]. The deterministic DEA does not impose any assumptions about functional form; hence, it is less prone to misspecification [40]. The DEA is a linear programming-based technique for evaluating the relative efficiency of decision-making units (DMUs) and is used to construct a piecewise frontier of the data. Terms like DMU are used to emphasize that the interest is centered on decision making by not-for-profit entities, rather than more customary firms and industries [41]. The best way to introduce DEA is via the ratio form of all outputs to all inputs for each farm/DMU. The optimal weight may be derived by specifying the mathematical programming problem.

Determining Technical Efficiency (TE)

In the context of increasing water scarcity, TE was measured using input-oriented DEA models because they are more relevant for considering potential decreases in water use than increases in output [39]. To develop the input orientated variable return to scale (VRS) DEA framework, we define the following:
j farms (j = 1…n);
k = 1 to K inputs;
m = 1 to M outputs;
xk,j = the amount of input k utilized on farm j; xk,i = the amount of input k used on farm i;
ym,j = the amount of output m produced on farm j; ym,i = the amount of output m produced on farm i;
λj = (λ1………λn) (row) vector of non-negative weights such that:
j = 1 n λ j = 1
θ is a scalar “shrinking factor” and a technical efficiency score of farm j, with a value of 1, indicating a technically efficient field and a value less than 1 indicating a technically inefficient field [39].
Moreover, with (xk,i, ym,i) as the actual firm under consideration, the weighting vector λ can be extracted as follows:
j λ j x k , j x k , j j λ j y m , j y m , j j = 1 n λ j = 1
The farm (xk,i, ym,i) is inefficient if a weighted combination of firms uses more inputs with no change in the level of outputs, or less output with no change in the level of inputs.
The empirical (piecewise linear) efficient frontier described by Equation (3) can be estimated by adopting either an input- or output-oriented approach. We now rewrite (3) as the linear programming problem:
T E = min θ , λ θ
Subject to : j = 1 n λ j y m , j y m , j j = 1 n λ j x k , j θ x k , i j = 1 n λ j = 1 λ j 0
Problem (4) is called the input-oriented DEA model. The value of θ obtained will be the TE score for each DMU. This will satisfy θ ≤ 1, with a value of 1 indicating technical efficiency. Since θ = 1, the input levels cannot be reduced further without changing the level of output, indicating that DMU lies on the efficient frontier. If θ < 1, then DMU is dominated by the efficient frontier, implying that it is inefficient. Note that the linear programming problem must be solved N times. A value of the θ is then obtained for each DMU. DEA comprises several models, depending on the assumptions that are made about the nature of the returns to scale. Equation (4) has a variable return-to-scale (VRS) specification, which includes a convexity constraint (Σλj = 1). Without that constraint, Equation (4) would have a constant return-to-scale specification (CRS).

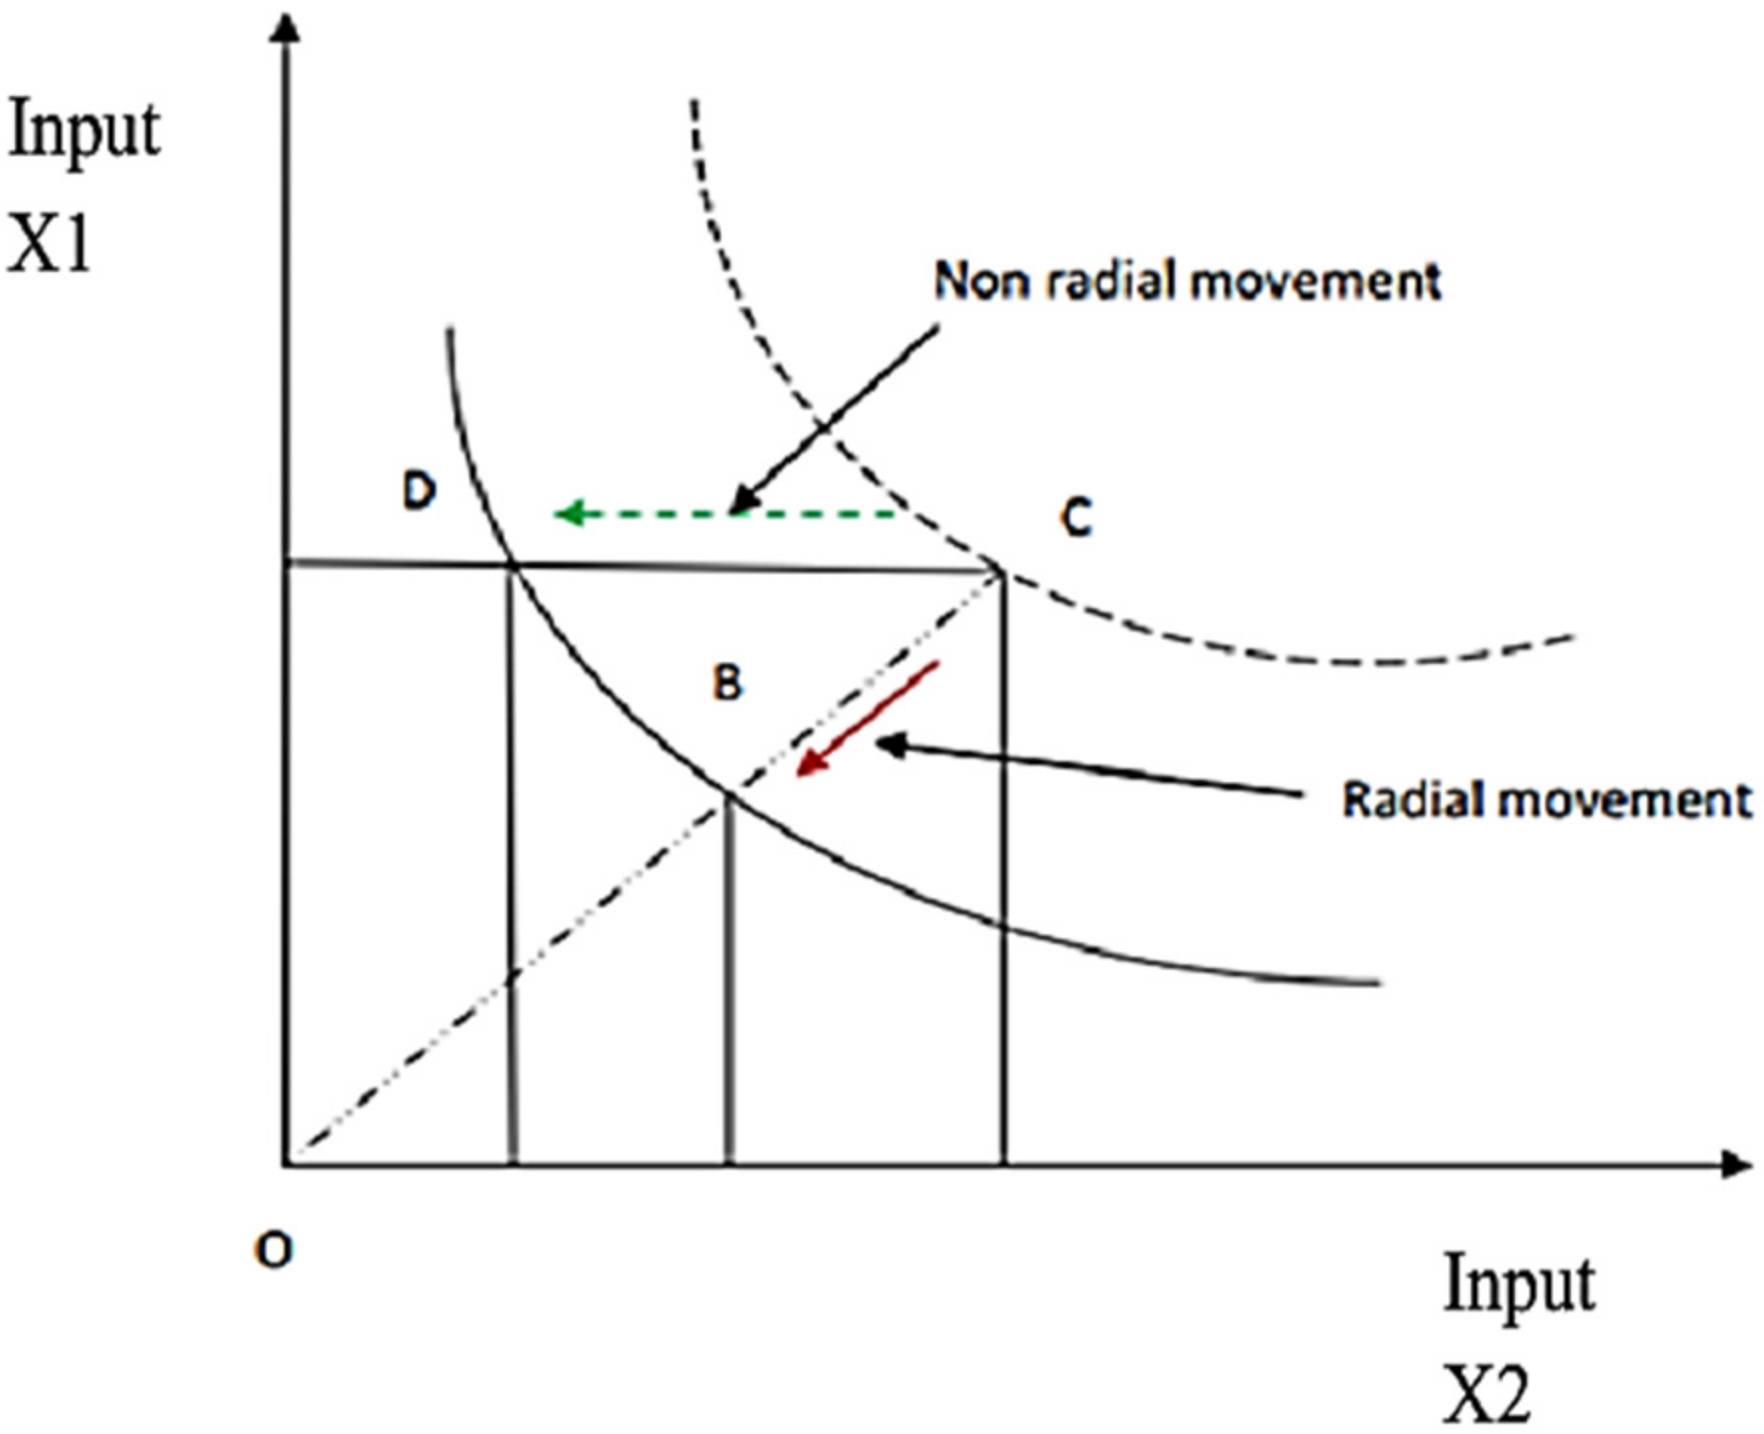
2.3.2. DEA Approach of IWUE

The IWUE is defined as the ratio of effective water use to the water applied to the crop [16,42]. The standard radial is not appropriate for measuring the individual efficiency of inputs used, as it measures the equal contribution of each input to productive efficiency [43]. It can be calculated via the sub-vector technical method for each individual input. Individual efficiency is a non-radial notion of input efficiency measurement that allows for a differential reduction of the inputs applied. A non-radial contraction of the sub-vector input only, holding all other inputs and outputs constant [44,45,46,47], is demonstrated in Figure 1.
Mathematically, the input-oriented model for estimating IWUE can be written as shown in Equation (5) [45,48,49], using the notion of the proposed sub-vector efficiency. The technical sub-vector efficiency for variable input k irrigation water is calculated for each firm’s i by solving the following linear programming problem:
θ t = min θ , λ θ
Subject to:
j = 1 n λ j y m , j y m , i j = 1 n λ j x k t , j x k t , i j = 1 n λ j x t , j θ t x t , i j = 1 n λ j = 1 λ j 0
where θt is the input sub-vector technical efficiency score for input t for each DMU. The measure θt represents the maximum reduction of variable input t holding outputs and all remaining inputs (n-t) constant. The θt can have a value between 0 and 1, where a value of 1 indicates that the observation is a high performer on the production frontier and has no reduction potential on irrigation water. Any value of θ smaller than 1, however, indicates water use inefficiency, i.e., that excessive irrigation water is being used. On the other hand, λj is a vector of n elements, representing the influence of each DMU in determining the efficiency of the DMU; xt is the sub-vector of the inputs contracted for the production of outputs; xk−t is the vector of all other inputs. The term j = 1 n λ j y m , j is the weighted sum of outputs of all DMUs, which must be superior or equal to the output of DMUi (xt,i, yt,i).
Microsoft Excel was used to perform the DEA analysis. The outputs of the DEA linear programming problem in the models (4 and 5) were technical efficiencies and IWUEs.

2.3.3. Regression Models

The Cobb–Douglas production function and Tobit regression model were used. The Cobb–Douglas production function determines the irrigation water use variable and other input production variables that influence coffee productivity or coffee output. The Cobb–Douglas production function explains various types of production activity [50]. One advantage of the Cobb–Douglas production function is that the regression coefficients immediately give the elasticity of production, independent of measurement units for the respective inputs.
The Cobb–Douglas function is expressed as follows:
ln Y i = β 0 + j = 1 4 β i j ln X i j + ε
where Y is the productivity of Robusta coffee that is measured in units of kilograms per hectare; Xij is the four independent variables, namely, the quantity of irrigation water use, labor, farm size, and working capital. The quantity of irrigation water use was calculated using hydraulic formulas. The farm size and labor were measured in units of hectares and working days, respectively. Working capital was calculated from the expenditures in Vietnamese currency (VND 1000); β0 is the regression constant; β1 to β4 are the regression coefficients for independent variables; ε is the error term.
In the second step, the Tobit model with a dependent variable of IWUE was applied to determine factors that have an effect on the irrigation water use efficiency of coffee farmers. This study adopted a two-stage DEA analysis, wherein IWUE is estimated by DEA in the first stage [51].
The Tobit model supposes that there is a latent unobservable variable IWUE. This variable depends linearly on Xik via a parameter vector (β). The observable variable IWUE is defined as being equal to the latent variable whenever the latent variable is above zero [52]. The following Tobit model can be considered:
I W U E = k K β k X i k ± u k ; I W U E = I W U E i f 0 < I W U E < 1 0 i f I W U E 0 1 i f I W U E 1
where IWUE is a dependent variable and Xik are the input explanatory variables.
A review of the literature shows that decreasing IWUE corresponding to the age of trees [53,54,55,56,57,58] and distance from the source of irrigated water to farm has an effect on the IWUE, since the lengthy distance could lead to the high cost of irrigation, water conflict and need for many man-days. Therefore, farmers will try to pump water as much as possible for each time of pumping [59,60], while ownership of the irrigation system could reduce conflict and provide incentives for water saving as resources become scarcer [61,62,63,64]. Previous studies also concluded that contact with agricultural extension services and access to credits were necessary approaches for improving WUE. In fact, farmers could seek advice from the extension agents on efficient water use, while credit access could release farmers from financial constraints in buying necessary inputs [54,65]. Education level and farmer’s irrigation experience affect literacy and technical skills as well as the rate of adoption of technology; therefore, the low level of education could limit the capacity to absorb risks and increase the reluctance to invest in production resources [66,67,68,69,70].
The expected relationship between dependent variables (irrigation water use efficiency) and these independent variables is shown in Table 2.

3. Results

3.1. Characteristics of Coffee Farmers

The average land area of Kinh and indigenous coffee farmers in the selected sites is 2.3 ha per household. Of the 194 respondents interviewed, 139 are of Kinh origin and the rest are indigenous to the area. Most of the Kinh people migrated from other provinces, even from the northern part of Vietnam, following the government’s migration policy in the 1970s and 1980s [71].
A comparison of the socioeconomic characteristics of the Kinh and indigenous farmers in the studied sites shows that most Kinh farmers are better educated with secondary education, compared to indigenous farmers who only have elementary education (Table 3). The indigenous farmers have larger coffee farmlands and are more experienced in coffee cultivation than Kinh farmers. There was not much difference, however, in farm size and experience in coffee production between the two groups. The amount of irrigation water used by indigenous farmers (4766.8 m3) was higher than that used by Kinh farmers (4719.6 m3), though there was no significant difference between the two groups. The working capital variable includes the cost of hired labor for land preparation, weeding, transplanting, harvesting, and the application of fertilizers and pesticides. There was a significant difference in working capital between Kinh and indigenous groups. The reason is that the Kinh farmers hired more labor than the indigenous farmers. They also used more fertilizers (NPK) than indigenous farmers. However, the productivity of the Robusta coffee farms of indigenous farmers and those of Kinh farmers were not significantly different.

3.2. The Response of Robusta Coffee Productivity to the Level of Irrigation Water Used

The Cobb–Douglas coffee production function was used to analyze the influence of the explanatory variables (namely, farm size measured in hectares, the quantity of irrigation water use measured in m3, family labor measured in man-days, and working capital measured in VND). These explanatory variables were selected based on previous studies [31,50] and the estimated pairwise correlation coefficients (r > 0.6). Other factors such as fertilizers and pesticides were excluded because of the low value of their pairwise correlation coefficients and the presence of many outliers. In addition, the variables were tested for multicollinearity and heteroscedasticity problems in the empirical model. The Park test was used to determine heteroscedasticity issues. The results indicated that homoscedastic errors were not rejected in all cases, indicating no serious heteroscedasticity issues.
The OLS regression results indicated that the four independent variables (quantity of irrigation water use, family labor, farm size, and working capital) were statistically significant and had a positive influence on the level of Robusta coffee output. The adjusted R-square value was 78.8%. This means that 78.8% of the change in the Robusta coffee output was explained by the changes in the quantity of irrigation water, labor, capital, and farm size (Table 4).
The study’s findings show that a 1% increase in irrigation water results in a 0.163% increase in coffee output [72,73]. Similarly, an equivalent increase in capital, labor, and farm size increased coffee output by 0.072%, 0.175%, and 0.536%, respectively. This means that coffee output is most responsive to the size of the farm and least responsive to the amount of capital. The low output response to water and capital might suggest that water use in the study area was below productive potential.
The sum of all production elasticities of inputs (regression coefficients) in the Cobb–Douglas production model is 0.946. An elasticity of less than one indicates decreasing return to scale, which is a less-than-proportionate increase in the output of coffee, given a certain level of input. This suggests that investments in new technologies would be a better alternative for increasing productivity, rather than increasing the amount of inputs applied.
Based on the results of the OLS econometric model, it could not be determined whether resources were being efficiently utilized or not. The results only reveal the functional relationship between the factors of production and output, with the assumption that all respondent farms were fully efficient [39], which is not true in all cases. It is therefore necessary to complement this analysis with a technical efficiency analysis. Likewise, given the insufficient amount of water that could be provided for coffee production in the Lam Dong province and its effect on coffee productivity, as shown by the regression analysis in this section, it is also necessary to use DEA to analyze irrigation water use efficiency. The next section presents results for irrigation water use efficiency.

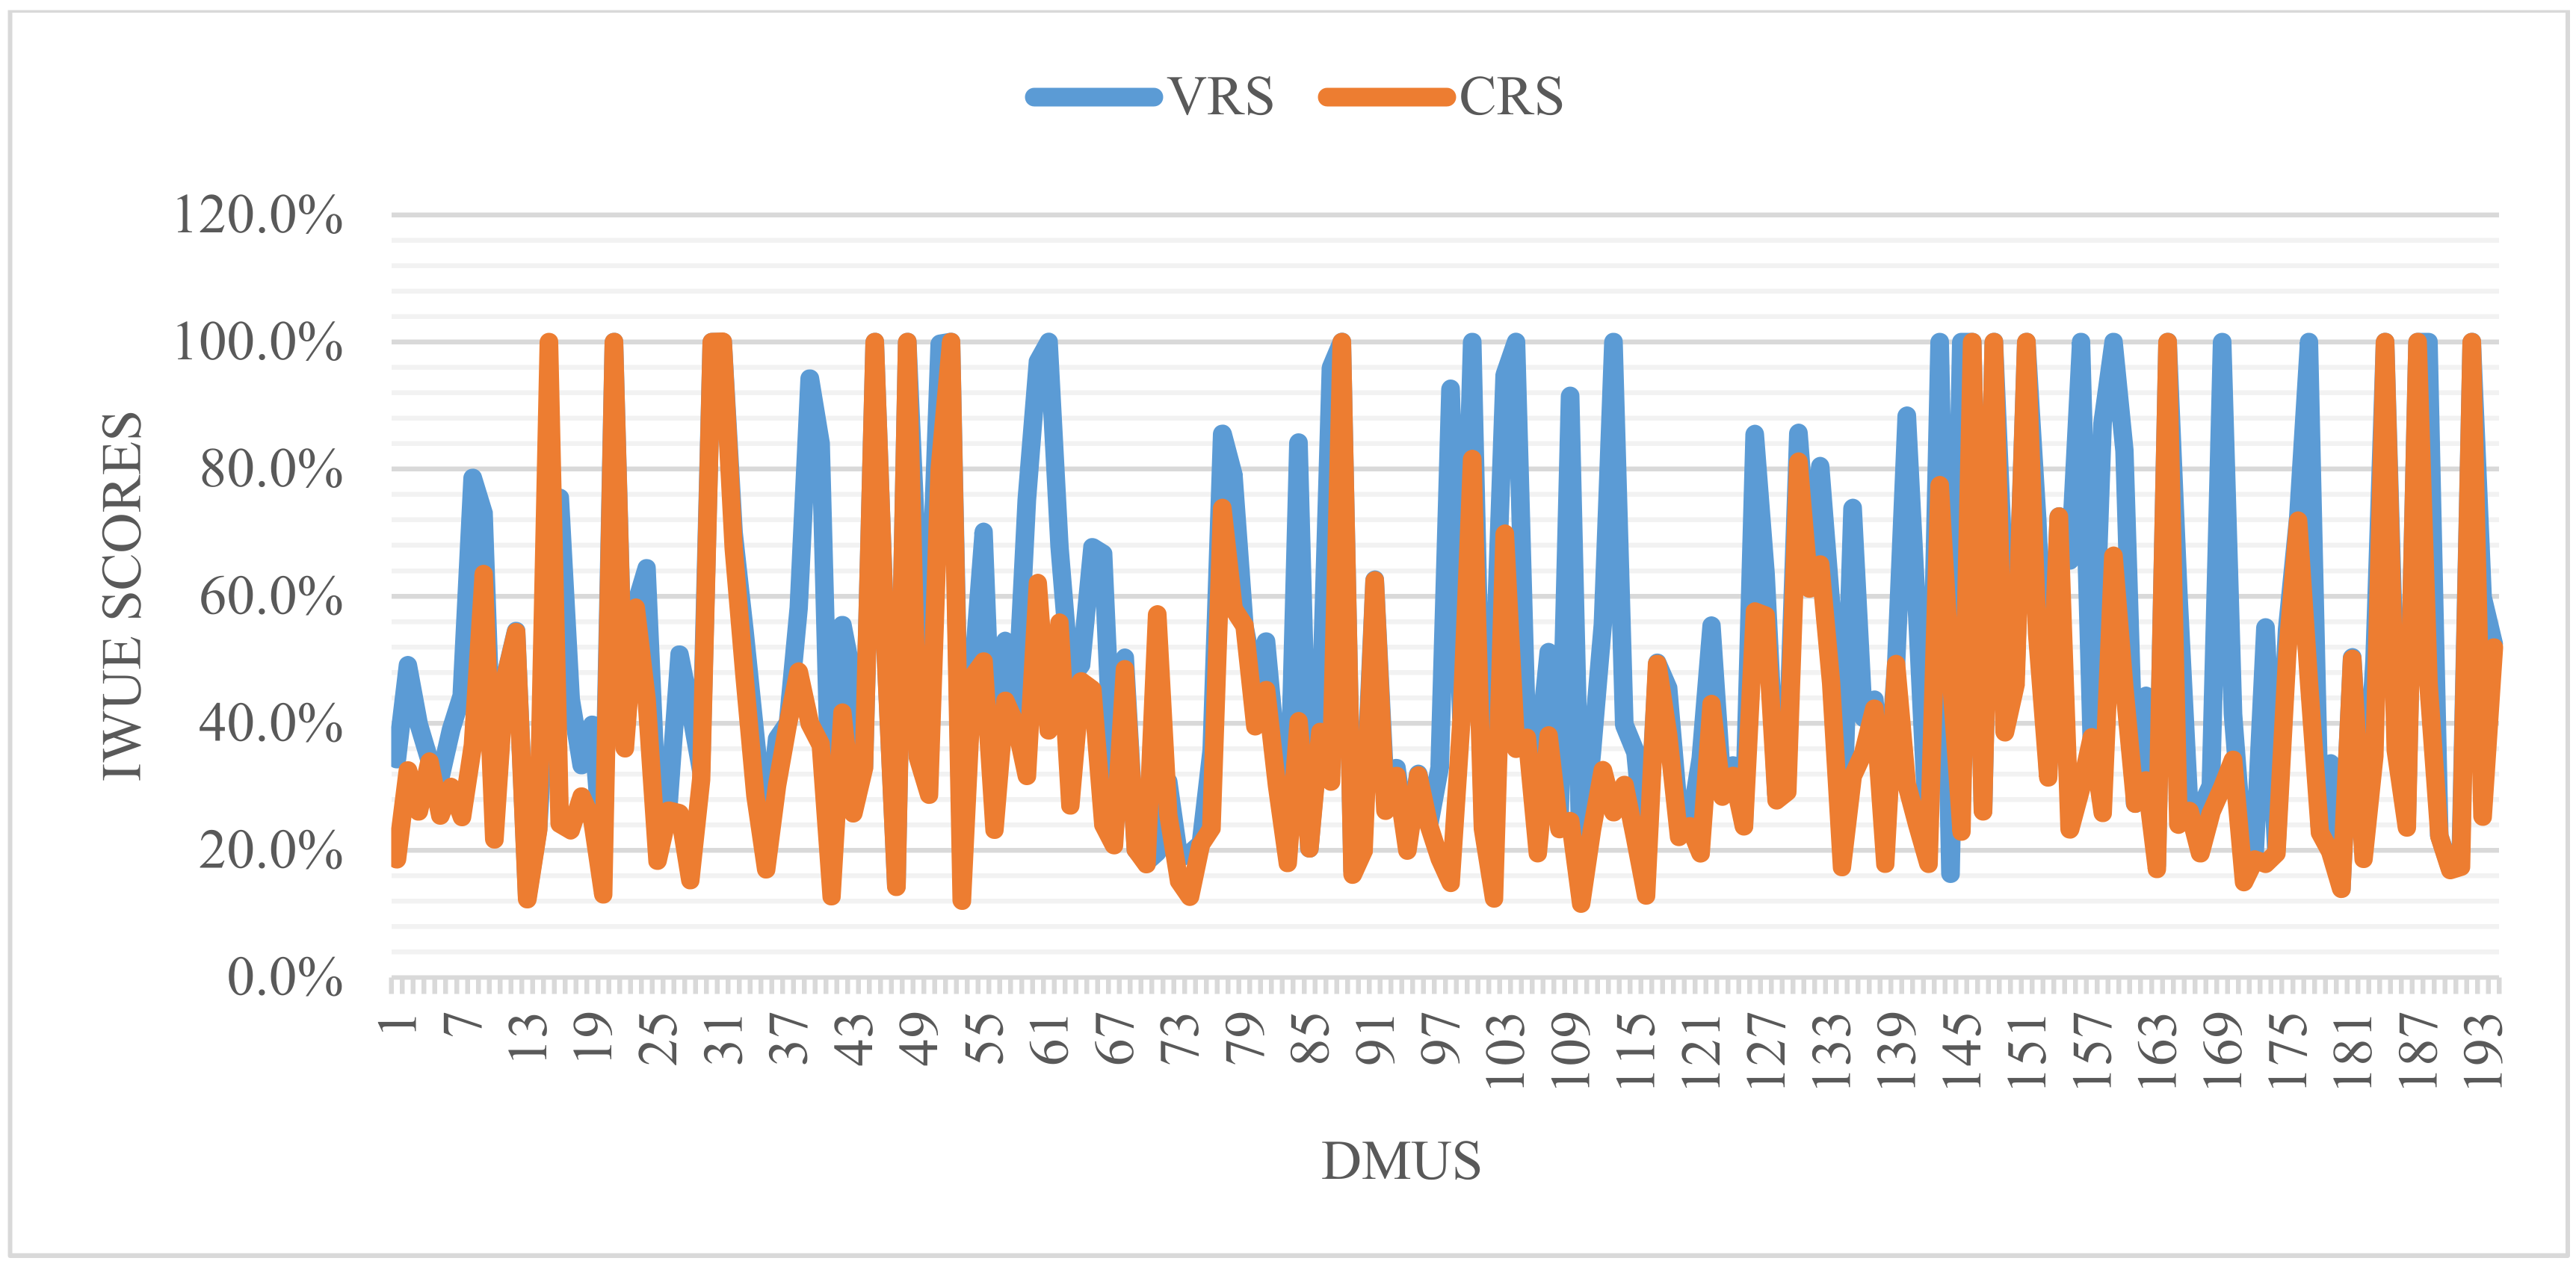
3.3. The DEA Results-TE and IWUE Scores

For the purpose of estimating TE and IWUE scores, an output (quantity of coffee in tons) and four inputs (quantity of irrigation water use in m3, farm size in ha, labor in man-days, and working capital in VND) were used. Summary statistics of these variables are provided in Table 3.
The overall TE and IWUE scores, given CRS and VRS in the sample and the two groups of Kinh and indigenous farmers, are summarized in Table 4 and Table 5, respectively. The TE scores for all coffee farmer respondents ranged from 30% to 100% with an average of 72% for the VRS DEA model, while for the CRS DEA model, the TE scores ranged from 21% to 100% with an average of 66%. These results revealed that inputs for coffee production were not being efficiently utilized. The current level of coffee output could still be attained even if the number of inputs used was reduced by 28% and 34% based on the VRS and CRS, respectively. The difference between the VRS and CRS measurements indicates the level of inefficiency of coffee farmers in their operations. The scale efficiency of 0.92 indicates that, by operating at an optimal scale, the number of inputs used of Robusta coffee farms in the study area could be reduced by as much as 8%.
Table 5 also provides a comparison of TE between Kinh and indigenous farmer groups. The results show that indigenous farmers produce more efficiently than Kinh farmers, under both VRS and CRS in the DEA model (81% vs. 76% in VRS, and 75% vs. 67% in CRS). These results seem somewhat surprising given that Kinh farmers are more educated, better trained, and have better access to market information than indigenous farmers. These results, however, are consistent with the findings of [30] on the efficiency of coffee farming in Vietnam’s Central Highlands. The reason is that farmers of Kinh origin, most of whom migrated from northern Vietnam in the 1980s, have less experience in coffee cultivation (18.9 vs. 20.7 years), smaller farm sizes (2.2 vs. 2.3 ha), and fewer family laborers (66 vs. 78 man-days/ha) than indigenous farmers. Note that family labor is expected to be more efficient than hired labor due to the moral hazard problem.
Table 6 also shows that the average IWUE scores for the DEA frontiers for all respondents are much lower than TE scores at 52% for VRS and 39% for CRS. The results also show that the variability for the estimated IWUE given the VRS assumption, at 13% to 100%, is less than that under the CRS assumption, at 12% to 100%. These results imply that the level of productivity of Robusta coffee could still be maintained even if the amount of irrigation water used is reduced by 48% and 61% under VRS and CRS, respectively, ceteris paribus. The results also show that, under VRS, the score for irrigation water use efficiency (IWUE) of 108 coffee farms is below 50%, between 50% and 80% for 45 farms, while just 41 farms score over 80%. These results indicate that the majority of farms could achieve significant savings in water use if their irrigation systems were improved. Table 5 also shows differences in IWUE scores between the Kinh and indigenous farmer groups. Similar to the results for TE, the average IWUE scores show that the indigenous farmer group produces more efficiently than the Kinh group, under both the VRS and CRS DEA models (69% vs. 54% under VRS, and 52% vs. 40% under CRS, respectively).
The scale efficiency equal to 0.75 suggests that the amount of water used for the Robusta coffee farms in the Lam Dong province could be reduced by as much as 25% if utilized optimally. The estimated scale efficiency for Kinh and indigenous farmer groups were 0.74 and 0.75, respectively. This means that by operating at optimal scale, input use could be reduced by as much as 26% and 25% for the Kinh and indigenous farmer groups, respectively. In other words, farmers in both groups could be advised to increase their scale of operation to an optimal level. The efficiency levels for the two groups differ under the VRS assumption. The results show that about 11% of the Kinh group and 25% of the indigenous farmer group were on the frontier (100% efficiency) (Figure 2).
In sum, the DEA results for TE and IWUE scores indicate that for many Robusta coffee farmers in the Lam Dong province, the key inputs, especially irrigation water, could be reduced without affecting the levels of production.

3.4. Tobit Model Results

The Tobit model was used to identify the main factors affecting IWUE. The model was estimated using Stata software (version 14.0) to determine the maximum likelihood estimates of seven parameters, namely: the age of coffee trees, distance from the source of water, ownership of irrigation system, farmers’ education levels, farmers’ irrigation experience, extension contact, and access to credit. The IWUE scores of decision-making units (DMUs) assuming a VRS were used because they were deemed more suitable as an efficiency measure. The results of the Tobit model estimation are shown in Table 7.
Six out of seven explanatory variables were found to be significant determinants of IWUE. These variables included the distance from water source to farm (DIS), farmers’ experience in coffee cultivation (EXP), contact to extension services (EXT), and access to credit (CRE), which were statistically significant at the 5% level. Ownership of irrigated water source (OWN), and farmers’ education levels (EDU) were statistically significant at the 1% level. The age of coffee plants (AGE) was not significant. The marginal effects of the explanatory variables on IWUE showed that contact with extension services and credit access had the greatest influence on IWUE, with 0.123% and 0.122% in IWUE for 1 unit of extension contact or credit access, respectively. This indicates that an increase in contact with extension services or access to credit would encourage or enhance the capacity of farmers to apply additional inputs at the proper time.

4. Discussion

The availability of water for irrigation is highly dependent on the amount of available water [59]. It is necessary, therefore, to use irrigation water more efficiently, since most of the Robusta coffee farms in Lam Dong use an overflow method of irrigation for their coffee plants. According to [74], the productivity of coffee is very sensitive to the availability of sufficient amounts of water, especially during the fruiting period when seeds are produced. A period of water stress therefore seems to be mandatory for normal flower bud development. The period from January to April is very critical in the production cycle of coffee [1] when water should be available for the crop to ensure a good yield [75]. This direct relationship between irrigation water supply and productivity of Robusta coffee has been observed in the Lam Dong province. This finding is consistent with [5], which also found that the high productivity of coffee in Vietnam cannot be sustained without a sufficient supply of irrigation water. These findings show that in the Lam Dong province, the productivity of most coffee farms has not reached full potential despite the availability of capital. This can be attributed to the lack of water from poor water management, especially during the period of flower bud growth, as well as the non-application of proper cultural practices. The group discussions with coffee farmers also revealed that 95% of coffee respondents used the overflow irrigation water method for their coffee plants. These results suggest that farmers should be informed and encouraged to follow irrigation and input application schedules.
Sustainable farming is more cost-effective and profitable than conventional farming, despite the insignificant difference in production efficiency [76]. The fact that coffee farmers in Lam Dong are small-scale and that the indigenous farmer groups used water more efficiently than Kinh farmers (who have better access to school, education level, and credits) is consistent with discussions of [30]. This shows that experience in coffee production and knowledge play a crucial role in coffee production. A combination of indigenous technical knowledge, good irrigation water management, and the replacement of unproductive coffee varieties with better-yielding varieties would enhance the sustainable development of Vietnam’s coffee industry.
The results of the regression analysis using DEA show that the mean technical efficiency of irrigation water use was 72% for the VRS DEA model and 66% for the CRS DEA model (Table 3) and that, with the current level of available resources and technology, coffee production can potentially increase by 28% and 34%, respectively. The average irrigation water use efficiencies (IWUE) were 52% for VRS and 39% for CRS, implying that the amount of irrigation water used may be reduced by 48% and 61% under VRS and CRS, respectively, without reducing coffee productivity.
Information on the different factors affecting IWUE would be useful in determining the appropriate interventions that can be used to improve the water irrigation systems of farmers. Factors such as distance from water source to farm, farmers’ experience, contact to extension services, access to credit, and farmers’ education level have significant effects on IWUE. Improving the level of education and farming knowledge as well as accessibility to credit and extension services could all positively affect the efficiency of irrigation water use for more sustainable coffee farming. These results are consistent with the findings of [77,78].

5. Conclusions

Given a one-year cross-sectional data, the study was able to determine the technical efficiency (TE) but not the change in IWUE over time. Such an understanding is important in improving the allocation and technical efficiency of coffee farmers that is fundamental to increasing farm-level total factor productivity, improving returns to coffee farmers, and stabilizing the region’s underlying agroecology. Analysis of the factors affecting the technical efficiency of coffee farmers shows that irrigation water has a very significant effect on coffee productivity. However, in the case of coffee farmers studies in Lam Dong province, the findings show that they are very inefficient in utilizing irrigation water since it is possible for them to reduce the amount of irrigation water used by 25% without reducing the productivity of Robusta coffee. The results also show that indigenous Robusta coffee farmers are more efficient in using irrigation water than Kinh farmers. Increasing farmers’ educational levels, providing them with regular contact with extension personnel, and regular training would provide farmers with sufficient information on the efficient utilization of irrigation water resources. Similarly, access to credit would enhance farmers’ capacity to access and apply farm inputs. Distance from or access to a water source is also an important factor affecting IWUE. Farmers who are near or have access to water resources have higher IWUE scores. Although farmers in the Lam Dong province felt the need to install water wells to meet their irrigation water requirements, they were constrained by the high investment costs. This means that financial and technical support from the government will be critical in improving IWUE.
The possible technical and institutional interventions to address the issues faced by farmers and improve their IWUE include: (1) intensifying the provision of extension services, i.e., training on good agriculture practice (GAP) such as the judicious application of production inputs, pruning and irrigation techniques, water and soil management, fertilizer and pesticide usage, etc.; (2) promoting better collaboration among stakeholders (institutions, governmental extension departments, and farmer associations) to implement coffee farming experiments and best management practices; (3) increasing access to credit, with favorable interest rates for coffee farmers, which may help farmers overcome financial constraints, resulting in an increase in TE and IWUE; (4) encouraging farmers to apply water-saving irrigation technologies (sprinklers and drip irrigation) and farming practices through application tools (cellphones, computers, and internet).

Author Contributions

Conceptualization, T.D.N. and D.N.L.T.; data curation, D.N.L.T.; formal analysis, T.D.N. and D.N.L.T.; methodology, T.D.N. and D.N.L.T.; supervision, R.F.R.J.; validation, T.D.N., T.T.P. and T.A.N.; visualization, T.D.N., T.T.P. and R.F.R.J.; writing—original draft, T.D.N. and D.N.L.T.; writing—review and editing, T.D.N., T.T.P., R.F.R.J. and T.A.N. All authors have read and agreed to the published version of the manuscript.

Funding

This research received no external funding.

Institutional Review Board Statement

Not applicable.

Informed Consent Statement

Not applicable.

Data Availability Statement

Not applicable.

Acknowledgments

This study is a part of the work conducted by the Center for International Forestry Organization Research (CIFOR) and the Norwegian Agency for Development Cooperation (NORAD).

Conflicts of Interest

The authors declare no conflict of interest.

References

  1. Amarasinghe, U.A.; Hoanh, C.; D’haeze, D.; Hung, T. Toward sustainable coffee production in Vietnam: More coffee with less water. Agric Syst. 2015, 136, 96–105. [Google Scholar] [CrossRef]
  2. Kotecha, S.; Hieu, S.P.; Kuit, M.; Von Enden, J.; Swinkels, R.; Vietnamese Coffee Competitiveness and Policy Options to Improve it. Conference Proceedings. 2002. Available online: http://ipsard.gov.vn/news/mispa/Nhom%20ca%20phe/Hop,%20Hoi%20thao/Hoi%20thao%20kha%20nang%20canh%20tranh%20cafe%20VN/Policy_brief__ver09__Hieu.pdf (accessed on 21 January 2017).
  3. World Bank (WB). The Socialist Republic of Vietnam. Coffee Sector Report. 2004. 29358-VN. Available online: https://openknowledge.worldbank.org/handle/10986/14405 (accessed on 22 August 2019).
  4. Marsch, A. Diversification by Smallholder Farmers: Vietnam Robusta Coffee; FAO: Rome, Italy, 2007. [Google Scholar]
  5. Haggar, J.; Schepp, K. Coffee and Climate Change Impacts and Options for Adaption in Brazil, Guatemala, Tanzania and Vietnam. NRI Working Paper Series. 2012. Climate Change, Agriculture and Natural Resources No. 4. Natural Resources Institute. Available online: https://www.nri.org/publications/working-paper-series/4-coffee-and-climate-change/file (accessed on 24 July 2019).
  6. Giungato, P.; Nardone, E.; Notarnicola, L. Environmental and socio-economic effects of intensive agriculture. Vietnam Case 2008, 47, 135–151. [Google Scholar]
  7. Dewbre, J. Improving Resource Allocation and Incomes in Vietnamese Agriculture. A Case Study of Farming in the Dong Nai River Basin; IFPRI Discussion Paper 00984; IFPRI: Washington, DC, USA, 2010; p. 28. [Google Scholar]
  8. D’haeze, D.; Deckers, J.; Raes, D.; Phong, T.; Loi, H. Environmental and socio-economic impacts of institutional reforms on the agricultural sector of Vietnam: Land suitability assessment for Robusta coffee in the Dak Gan region. Agric. Ecosyst. Environ. 2005, 105, 59–76. [Google Scholar] [CrossRef]
  9. Ahmad, A. An Institutional Analysis of Changes in Land Use Pattern and Water Scarcity in Dak Lak Province, Vietnam; Copenhagen, Denmark; NIAS Press: 2001. Available online: http://dlc.dlib.indiana.edu/dlc/bitstream/handle/10535/7903/ahmadviet.pdf?sequence=1 (accessed on 25 July 2019).
  10. Technoserve. Vietnam: A Business Case for Sustainable Coffee Production. 2013. Available online: www.sustainablecoffeeprogram.com/site/getfile.php?id=211 (accessed on 24 July 2019).
  11. Ministry of Natural Resource and Environment of Vietnam (MONRE). Climate Change, Sea Level Rise Scenarios for Vietnam; Vietnam Publishing House of Natural Resources, Environment and Cartography: Hanoi, Vietnam, 2016.
  12. Nguyen, H.A.; Bokelmann, W.; Ngo, T.T.; Do, T.N.; Nguyen, V.M. Smallholders’ preferences for different contract farming models: Empirical evidence from sustainable certified coffee production in Vietnam. Sustainability 2019, 11, 3799. [Google Scholar]
  13. Luong, Q.V.; Tauer, L.W. A real options analysis of coffee planting in Vietnam. Agric. Econ. 2006, 35, 49–57. [Google Scholar] [CrossRef] [Green Version]
  14. Long, T.K.; Gerardo, H.; Jake, B. Vietnam-Netherlands Partnership Water for Food & Ecosystems; Ministry of Agriculture and Rural Development (MARD): Hanoi, Vietnam, 2009.
  15. Jolk, C.; Greassidis, S.; Jaschinski, S.; Stolpe, H.; Zindler, B. Planning and decision support tools for the Integrated Water Resources Management in Vietnam. Water 2010, 2, 711–725. [Google Scholar] [CrossRef] [Green Version]
  16. Omezzine, A.; Zaibet, L. Management of modern irrigation systems in Oman: Allocative vs irrigation efficiency. Agric. Water Manag. 1998, 37, 99–107. [Google Scholar] [CrossRef]
  17. Qureshi, M.E.; Grafton, R.Q.; Kirby, M.; Hanjra, M.A. Understanding irrigation water use efficiency at different scales for better policy reform: A case study of the Murray–Darling Basin, Australia. Water Policy 2011, 13, 1–17. [Google Scholar] [CrossRef]
  18. Azad, M.; Ancev, T.; Hernández-Sancho, F. Efficient water use for sustainable irrigation industry. Water Resour. Manag. 2015, 29, 1683–1696. [Google Scholar] [CrossRef]
  19. Israelsen, O.W. Irrigation Principles and Practices, 1st ed.; John Wiley & Sons: New York, NY, USA, 1932; p. 422. [Google Scholar]
  20. El-Wahed, M.H.A.; Ali, E.A. Effect of irrigation systems, amounts of irrigation water and mulching on corn yield, water use efficiency and net profit. Agric. Water Manag. 2013, 120, 64–71. [Google Scholar] [CrossRef]
  21. Wang, H.; Zhang, L.; Dawes, W.R.; Liu, C. Improving water use efficiency of irrigated crops in the north China plain–measurements and modelling. Agric. Water Manag. 2001, 48, 151–167. [Google Scholar] [CrossRef]
  22. Burt, C.M.; Styles, W.S. Drip and Micro Irrigation for Trees, Vines, and Row Crops, with Special Sections on Buried Drip; Irrigation Training and Research Center: San Luis Obispo, CA, USA, 1994; p. 261. [Google Scholar]
  23. Menga, F.Y.; Fanb, L.W.; Zhoua, P.; Zhoua, D.Q. Measuring environmental performance in China’s industrial sectors with non-radial DEA. Math. Comput. Model. 2012, 58, 1047–1056. [Google Scholar] [CrossRef]
  24. Sueyoshi, T.; Goto, M. Returns to scale and damages to scale on U.S. fossil fuel power plants: Radial and non-radial approaches for DEA environmental assessment. Energy Econ. 2012, 34, 2240–2259. [Google Scholar] [CrossRef]
  25. Chiu, Y.; Huang, C.; Ting, C. A non-radial measure of different systems for Taiwanese tourist hotel’s efficiency assessment. CEJOR 2012, 20, 45–63. [Google Scholar] [CrossRef]
  26. Hernández-Sancho, F.; Molinos-Senante, M.; Sala-Garrido, R. Energy efficiency in Spanish wastewater treatment plants: A non-radial DEA approach. Sci. Total Environ. 2011, 409, 2693–2699. [Google Scholar] [CrossRef]
  27. Zhou, P.; Poh, K.L.; Ang, B.W. A non-radial DEA approach to measuring environmental performance. Eur. J. Oper. Res. 2007, 178, 1–9. [Google Scholar] [CrossRef]
  28. Yang, C.; Lu, W.M. Performance benchmarking for Taiwan’s international tourist hotels. INFOR 2006, 44, 229–245. [Google Scholar] [CrossRef]
  29. Sun, S.; Lu, W.M. Evaluating the performance of the Taiwanese hotel industry using a weight slacks-based measure. Asia Pac. J. 2005, 22, 487–512. [Google Scholar] [CrossRef]
  30. Tran, N.A. Measuring the Efficiency of Coffee Producers in Vietnam: Do Outliers Matter? Master’s Thesis, Purdue University, West Lafayette, IN, USA, 2007. [Google Scholar]
  31. Atici, K.; Podinovski, V.A. Review of Data Envelopment Analysis Studies in Agriculture. Ph.D. Thesis, Warwick Business School, University of Warwick, Coventry, UK, 2014. [Google Scholar]
  32. Cheesman, J.; Son, T.V.H.; Bennett, J. Valuing Irrigation Water for Coffee Production in Dak Lak, Vietnam: A Marginal Productivity Analysis; Research Report, No. 6; Australian Centre for International Agricultural Research (ACIAR): Bruce, Australia, 2007. [Google Scholar]
  33. Department of Agriculture and Rural Development of Lam Dong (DARD). Available online: http://www.lamdong.gov.vn/vi-VN/Home/Pages/Default.aspx (accessed on 21 December 2017).
  34. General Statistics Office (GSO) of Vietnam. Area, Population and Population Density in 2013 by Province. Available online: http://www.gso.gov.vn/default_en.aspx?tabid=467&idmid=3&ItemID=15751 (accessed on 17 January 2015).
  35. Japan International Cooperation Agency (JICA). Data Collection Survey on Water Resources Management in Central Highlands; Final Report; Nippon Koei Co. Ltd.: Tokyo, Japan, 2018. [Google Scholar]
  36. Farrell, M. The measurement of Productive Efficiency. J. R Stat. Soc. 1957, 120, 253–290. [Google Scholar] [CrossRef]
  37. Cochran, W.G. Sampling Technique, 2nd ed.; John Wiley and Sons Inc.: New York, NY, USA, 1963; p. 413. [Google Scholar]
  38. Aigner, D.J.; Ameiya, T.; Poirier, P.J. On the estimation of production frontiers: Maximum likelihood estimation of the parameters of a discontinuous density function. Int. Econ. Rev. 1976, XVII, 377–396. [Google Scholar] [CrossRef]
  39. Coelli, T. A Guild to DEAP, Version 2.1: A Data Envelopment Analysis Computer Program; Centre for Efficiency and Productivity Analysis: Armidale, Australia, 1988; Volume 96, pp. 1–49. [Google Scholar]
  40. Wu, Y. The productive efficiency of Chinese iron and steel industry. Resour. Policy 1996, 21, 215–222. [Google Scholar] [CrossRef]
  41. Charnes, A.; Cooper, W.; Rhodes, E. Measuring the efficiency of Decision-Making Units. Eur. J. Oper. Res. 1978, 2, 429–444. [Google Scholar] [CrossRef]
  42. McGockin, J.T.; Gollehon, N.; Ghosh, S.C. Water conservation in irrigated agriculture: A stochastic production frontier model. Water Resour. Res. 1992, 28, 305–312. [Google Scholar] [CrossRef]
  43. Reinhard, S.; Lovell, C.A.K.; Thijssen, G. Econometric estimation of technical and environmental efficiency: An application to Dutch dairy farms. Am. J. Agric. Econ. 1999, 81, 44–60. [Google Scholar] [CrossRef]
  44. Ball, V.E.; Lovell, C.A.K.; Nehring, R.F.; Somwaru, A. Incorporating undesirable outputs into models of production: An application to US agriculture. Cah. D’economique Et Sociol. Rural. 1994, 31, 59–73. [Google Scholar]
  45. Färe, R.; Grosskopf, S.; Lovell, C.A.K. Production Frontiers; Cambridge University Press: Cambridge, UK, 1994. [Google Scholar]
  46. Reinhard, S.; Lovell, C.A.K.; Thijssen, G.J. Environmental efficiency with multiple environmentally detrimental variables; estimated with SFA and DEA. Eur. J. Oper. Res. 2000, 121, 287–303. [Google Scholar] [CrossRef]
  47. Lansink, O.A.; Pietola, K.; Bäckman, S. Efficiency and productivity of conventional and organic farms in Finland 1994–1997. Eur. Rev. Agric. Econ. 2002, 29, 51–65. [Google Scholar] [CrossRef]
  48. Lilienfeld, A.; Asmild, M. Estimation of excess water use in irrigated agriculture: A data envelopment analysis approach. Agric. Water Manag. 2007, 94, 73–82. [Google Scholar] [CrossRef]
  49. Frija, A.; Chebi, L.A.; Speelman, S.; Buysse, J.; Van Huylenbroeck, G. Water use and technical efficiencies in horticultural greenhouses in Tunisia. Agric. Water Manag. 2009, 96, 1509–1516. (In English) [Google Scholar] [CrossRef]
  50. Hassani, A. Applications of Cobb-Douglas Production Function in Construction Time-Cost Analysis. Construction Systems. Master’s Thesis, University of Nebraska–Lincoln, Lincoln, NE, USA, 2012; p. 13. [Google Scholar]
  51. Simar, L.; Wilson, P.W. Two-stage DEA: Caveat emptor. J. Product. Anal. 2011, 36, 205–218. [Google Scholar] [CrossRef]
  52. Chebil, A.; Frija, A.; Belhassen, A. Irrigation water use efficiency in collective irrigated schemes of Tunisia: Determinants and potential irrigation cost reduction. Greek Assoc. Agric. Econ. Agric. Econ. Rev. 2012, 13, 1–10. [Google Scholar]
  53. Song, L.; Zhu, J.; Yan, Q.; Li, M.; Yu, G. Comparison of intrinsic water use efficiency between different aged Pinus sylvestris var. mongolica wide windbreaks in semiarid sandy land of northern China. Agroforest Syst. 2015, 89, 477–489. [Google Scholar] [CrossRef]
  54. Brienen, R.J.W.; Gloor, E.; Clerici, S.; Newton, R.; Arppe, L.; Boom, A.; Bottrell, S.; Callaghan, M.; Heaton, T.; Helama, S.; et al. Tree height strongly affects estimates of water-use efficiency responses to climate and CO2 using isotopes. Nat. Commun. 2017. [Google Scholar] [CrossRef] [Green Version]
  55. McDowell, N.G.; Bond, B.J.; Dickman, L.T.; Ryan, M.G.; Whitehead, D. Relationships between tree height and carbon isotope discrimination. Tree Physiol. 2011, 4, 255–286. [Google Scholar]
  56. Tanaka-Oda, A.; Kenzo, T.; Koretsune, S.; Sasaki, H.; Fukud, K. Ontogenetic changes in water-use efficiency (d13C) and leaf traits differ among tree species growing in a semiarid region of the Loess Plateau, China. Ecol. Manag. 2010, 259, 953–957. [Google Scholar] [CrossRef]
  57. Salmon, Y.; Barnard, R.L.; Buchmann, N. Ontogeny and leaf gas exchange mediate the carbon isotopic signature of herbaceous plants. Plant Cell Environ. 2011, 34, 465–479. [Google Scholar] [CrossRef]
  58. Terwilliger, V.J. Influence of phenotypic plasticity in photosynthetic functions on the spatial distributions of tropical trees. Phys. Geogr. 2003, 24, 433–446. [Google Scholar] [CrossRef]
  59. Bobojonov, I.; Berg, E.; Franz-Vasdeki, J.; Martius, C.; Lamers, J.P.A. Income and irrigation water use efficiency under climate change: An application of spatial stochastic crop and water allocation model to Western Uzbekistan. Clim. Risk Manag. 2016, 13, 19–30. [Google Scholar] [CrossRef] [Green Version]
  60. Kang’au, S.N.; Home, P.G.; Gathenya, J.M. Farm water use efficiency assessment for smallholder pumped irrigation systems in the arid and semi-arid areas of Kenya. Agric. Eng. Int. Cigr. J. 2011, 13. [Google Scholar]
  61. Meinzen-Dick, R.S.; Pradhan, R. Legal pluralism and dynamic property rights. In CAPRi Working Paper No. 22; International Food Policy Research Institute (IFPRI): Washington DC, USA, 2002. [Google Scholar]
  62. Meinzen-Dick, R. Property rights and sustainable irrigation: A developing country perspective. Agric. Water Manag. 2014, 145, 23–31. [Google Scholar] [CrossRef]
  63. Cele, L.; Wale, E. The role of land- and water-use rights in smallholders’ productive use of irrigation water in KwaZulu-Natal, South Africa. Afr. J. Agric. Resour. Econ. 2018, 13, 345–356. [Google Scholar]
  64. Veldwisch, G.J.; Beekman, W.; Bolding, A. Smallholder irrigators, water rights and investments in agriculture: Three cases from rural Mozambique. Water Altern. 2013, 6, 125–141. [Google Scholar]
  65. Mogogana, B.P.; Olorunfemi, O.D.; Oladele, O.I. Knowledge and adoption of water use efficiency techniques among women: Evidence from South Africa. J. Agric. Environ. Int. Dev. 2018, 112, 271–295. [Google Scholar]
  66. Wang, X. Irrigation Water Use Efficiency of Farmers and Its Determinants: Evidence from a Survey in Northwestern China. Agric. Sci. China 2010, 9, 1326–1337. [Google Scholar] [CrossRef]
  67. Qu, W.; Tan, Y.; Li, Z.; Aarnoudse, E.; Tu, Q. Agricultural Water Use Efficiency—A Case Study of Inland-River Basins in Northwest China. Sustainability 2020, 12, 10192. [Google Scholar] [CrossRef]
  68. Morote, Á.-F.; Hernández, M.; Olcina, J.; Rico, A.-M. Water Consumption and Management in Schools in the City of Alicante (Southern Spain) (2000–2017): Free Water Helps Promote Saving Water? Water 2020, 12, 1052. [Google Scholar] [CrossRef] [Green Version]
  69. Grafton, R.Q.; Kompas, T.; To, H.; Ward, M. Residential water consumption: A cross country analysis. Research report No.23. Environ. Econ. Res. Hub 2009. [Google Scholar] [CrossRef]
  70. Shan, Y.; Yang, L.; Perren, K.; Zhang, Y. Household Water Consumption: Insight from a Survey in Greece and Poland. Procedia Eng. 2015, 119, 1409. [Google Scholar] [CrossRef] [Green Version]
  71. McElwee, P. Forests are Gold: Trees, People, and Environmental Rule in Vietnam; University of Washington Press: Seattle, WA, USA; London, UK, 2016; p. 293. [Google Scholar]
  72. Shammout, M.W.; Qtaishat, T.; Rawabdeh, H.; Shatanawi, M. Improving water use efficiency under deficit irrigation in the Jordan Valley. Sustainability 2018, 10, 4317. [Google Scholar] [CrossRef] [Green Version]
  73. Tesfaye, S.G.; Mohd, R.I.; Kausar, H.; Marziah, M.; Ramlan, M.F. Plant water relations, crop yield and quality in coffee (Coffea arabica L.) as influenced by partial root zone drying and deficit irrigation. AJCS 2013, 7, 1361–1368. [Google Scholar]
  74. Mike, K.V.C. The water relations and irrigation requirements of coffee. Expl Agric. 2001, 37, 1–36. [Google Scholar]
  75. Naidu, R. Coffee Guide; Codeword Process and Printers: Mangalore, Karnataka, India, 2000. [Google Scholar]
  76. Nguyen, H.A.; Bokelmann, W.; Thi Nga, D.; Van Minh, N. Toward sustainability or efficiency: The case of smallholder coffee farmers in Vietnam. Economies 2019, 7, 66. [Google Scholar]
  77. Nguyen, H.A.; Bokelmann, W. Determinants of smallholders’ market preferences: The case of sustainable certified coffee farmers in Vietnam. Sustainability 2019, 11, 2897. [Google Scholar]
  78. Ngango, J.; Kim, S.G. Assessment of Technical Efficiency and its potential determinants among small-scale coffee farmers in Rwanda. Agriculture 2019, 9, 161. [Google Scholar] [CrossRef] [Green Version]
Figure 1. Input-oriented water use efficiency. Source: adapted from [47].
Sustainability 13 06603 g001
Figure 2. IWUE under VRS and CRS.
Sustainability 13 06603 g002
Table 1. List of abbreviations.
AbbreviationDefinitions
TETechnical Efficiency
DEAData Envelopment Analysis
IWUEIrrigation Water Use Efficiency
SFAStochastic Frontier Analysis
DMUsDecision-Making Units
CRSConstant Returns to Scale
VRSVariable Returns to Scale
Table 2. Definition and expected sign of independent variables used in the Tobit model.
Variable NameExplanation Expected Sign
AGEAge of trees (years)Negative
DISDistance from the source of irrigated water to farm (m)Negative
OWNOwnership of irrigation systemPositive
EDUEducation level (dummy variable)Positive
EXPFarmer’s irrigation experience (years)Positive
EXTExtension contact (dummy variable)Positive
CREAccess to credit (dummy variable)Positive
Table 3. Summary of statistics of Robusta coffee farmers in Lam Dong province, Vietnam, 2017.
VariablesKinh GroupIndigenous GroupAll
MeanS.DMeanS.DMeanS.D
Age of household head (years)44.0 *11.042.0 *12.044.012.0
Education level3.0 *0.72.0 *0.82.60.8
Household size (people)5.0 *1.46.0 *2.25.01.7
Experience (years)18.96.120.76.919.46.4
Farm size (hectares)2.21.32.31.32.31.3
Irrigation water use (m3)4719.63321.24766.83167.74733.03270.3
Family labor (man-days/ha)664378606949
Working capital (1000 VND/ha)55,353.7 *40,801.246,465.2 *30,007.252,833.738,140.1
Coffee productivity (Kg)5864.43487.65051.12857.35633.83334.2
Note: * indicates difference between means of two groups is statistically significant at a 95% confidence level in paired Student’s t-test; S.D: Standard Deviation.
Table 4. OLS regression results for coffee production function, Lam Dong province, Vietnam, 2017.
Independent VariableCoefficientStd. Errt-Valuep-Value
Log constant4.581 *0.6906.630.059
Log working capital0.072 **0.0381.900.005
Log labor0.175 **0.0622.840.001
Log irrigation water use0.163 **0.0473.500.000
Log farm size0.536 **0.0638.560.000
R-square0.792
Adjusted R-square0.788
F (4, 189)180.24
Prob > F0.0000
Root MSE0.2928
Note: ** and * are significant at 1% and 10% probability level, respectively. NS is not significant at 10% probability level.
Table 5. Frequency distribution of technical efficiency of Robusta coffee production by groups in Lam Dong, Vietnam, 2017.
Efficiency
(%)
TE
VRSCRS
Kinh GroupIndigenous GroupAllKinh GroupIndigenous GroupAll
Summary Statistics
Mean0.760.810.720.670.750.66
Minimum0.310.300.240.210.290.21
Maximum 1.001.001.001.001.001.00
Std. Dev. 0.180.190.190.180.190.18
Efficiency Interval
10023 (17)17 (31)21 (11)9 (6)9 (16)16 (8)
90–10014 (10)9 (16)24 (12)9 (6)6 (11.5)10 (5)
80–9027 (19)4 (7)24 (12)15 (11)11 (20)17 (9)
70–8016 (12)8 (15)31 (16)20 (14)6 (11.5)31 (15)
60–7028 (20)9 (16)32 (16)34 (25)9 (16)40 (21)
50–6023 (16)6 (11)44 (23)35 (25)9 (16)48 (25)
40–504 (3)1 (2)11 (6)11 (8)4 (7)21 (11)
30–404 (3)0 (0)6 (3)6 (4)0 (0)8 (4)
<300 (0)1 (2)1 (1)1 (1)1 (2)3 (2)
Total139 (100)55 (100)194 (100)139 (100)55 (100)194 (100)
Note: Figures in parentheses are the percentage of column totals.
Table 6. Frequency distribution of irrigated water use efficiency in Lam Dong province, Vietnam, 2017.
Efficiency
(%)
IWUE
VRSCRS
Kinh GroupIndigenous GroupAllKinh GroupIndigenous GroupAll
Summary Statistics
Mean0.540.690.520.400.520.39
Minimum0.140.110.130.100.100.12
Maximum 1.001.001.001.001.001.00
Std. Dev. 0.290.300.280.240.270.24
Efficiency Interval
10015 (11)14 (25)17 (9)5 (4)6 (11)9 (5)
90–10014 (10)7 (13)15 (8)7 (5)3 (5)6 (3)
80–908 (6)5 (9)9 (5)1 (0)0 (0)2 (1)
70–803 (2)1 (2)11 (6)4 (3)3 (5)5 (3)
60–708 (6)4 (7)10 (5)6 (4)8 (15)8 (4)
50–6018 (13)6 (11)24 (12)10 (7)6 (11)13 (7)
40–5014 (11)4 (7)24 (12)16 (12)7 (13)24 (12)
30–4021 (15)9 (16) 32 (16)28 (20)8 (15)37 (19)
<3038 (27)5 (9)52 (27)62 (45)14 (25)90 (46)
Total139 (100)55 (100)194 (100)139 (100)55 (100)194 (100)
Note: Figures in parentheses are the percentage of column totals.
Table 7. Results of Tobit model of factors affecting IWUE in Robusta coffee production in Lam Dong province, 2017.
VariablesCoefficientStd. Devt-Valuep-Value
Intercept−0.155 NS0.116−1.340.183
Age of coffee plant (AGE)0.002 NS0.280.850.395
Distance to water source (DIS)−0.00009 *0.00003−2.560.011
Ownership of irrigation system (OWN)0.060 **0.0193.110.002
Education level (EDU)0.066 **0.0252.660.008
Experience (EXP)0.007 *0.0032.310.022
Extension contact (EXT)0.123 *0.0432.890.004
Access to credit (CRE)0.122 *0.0412.940.004
Number of observations 194
LR chi2 (7) 59.38
Prob > chi2 0.0000
Pseudo R2 0.3912
Note: ** and * refer to significance at 1% and 5% level, respectively. NS is non-significant.
Publisher’s Note: MDPI stays neutral with regard to jurisdictional claims in published maps and institutional affiliations.

