1. Introduction
In the wake of the COVID-19 crisis, many thousands of hours of learning have been lost, with employers reporting an average of 17% of their apprentices having off-site learning suspended, including no access to online learning during April 2020, while many more were furloughed or made redundant [
1]. This could have knock-on effects in the UK workforce for years to come and is of particular concern in the field of offshore wind energy. A recent report by the Global Wind Energy Council predicts a workforce of over 77,000 will be required globally just to install the planned capacity of wind turbines between 2020 and 2024 and expresses concerns that a suitably qualified workforce may become the bottleneck for future installation targets [
2]. Delaying the training and qualification of new apprentices and students could seriously impact this goal, so it is important for the industry to come up with novel ways of delivering course content to make the training process more resilient to disruption going forwards. Many of the more academic educational environments have been able to deploy teaching using video-conferencing software, pre-recorded content and online quizzes with some level of success. However, in recent years, a trend towards project-based and active learning has seen success in engineering education [
3], but this has been significantly hampered by lockdowns and stay-at-home orders in place across much of the world. Internet-based learning and development already exist in a variety of forms—e.g., MOOCs (massive open online courses), TORQUEs (tiny, open-with-restrictions courses focused on quality and effectiveness) and Moodle courses at Zurich University [
4]. However, these have tended to be constructed more with academic and lecture-based education in mind.
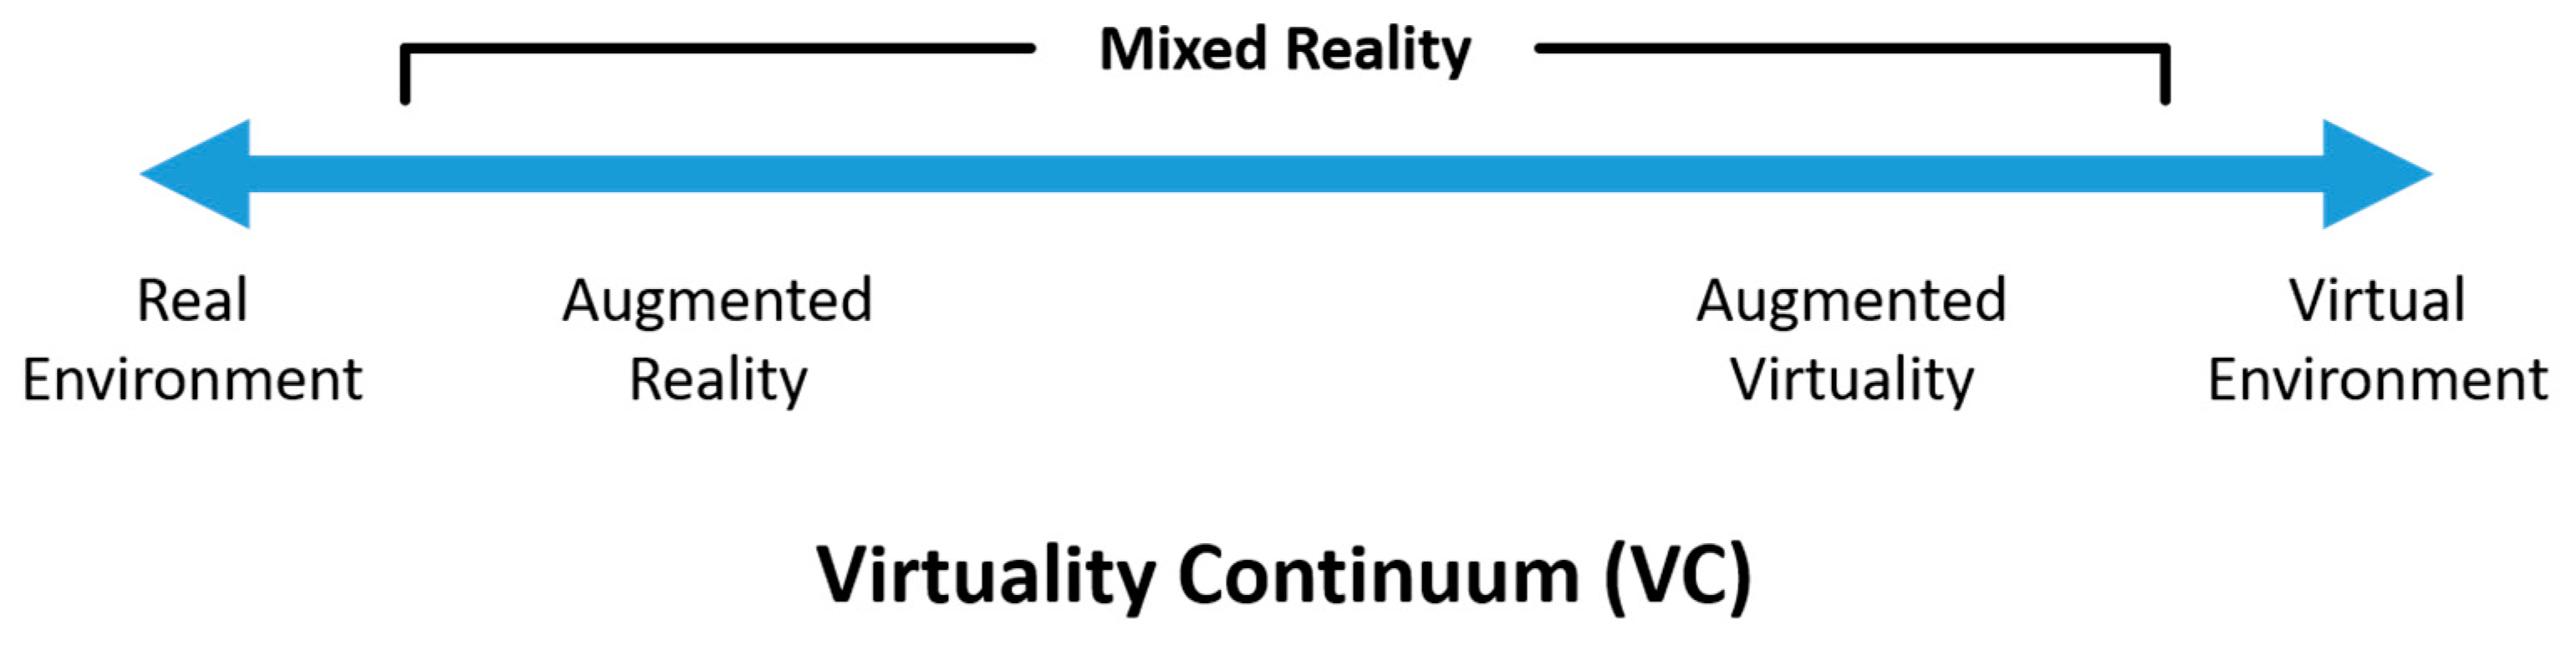
Mixed reality (MR) technology, on the other hand, could provide a more interactive learning experience, using immersive visualizations for a more realistic replication of vocational learning. The term “mixed reality” can be used to describe any display technology that falls between the two extremes of the continuum shown in
Figure 1.
Unlike pure virtual reality (VR), which tends to require expensive custom-built kits, MR is very accessible to the remote learner, requiring as a minimum a smartphone or tablet and an internet connection. MR also has an advantage over VR in that it allows a view of the real world, which reduces the health and safety implications of virtual content that may occlude hazards in the users’ environment. This is why MR is the focus of this study. Egger and Masood carried out a systematic review which found that current AR solutions are ready for deployment in some areas, while others still require more technological development before being ready for wide scale development [
6]. Masood and Egger also found that the most significant advantage of IAR is effective access to information [
7]. In 2019, they revealed that 70% of the pilot projects surveyed started in the previous three years (since 2016), suggesting that this area of research is still in its infancy. Hannola et al. proposed four methods by which digital learning technology can improve production processes—knowledge discovery through self-learning workplaces, digitally augmented knowledge transfer, knowledge acquisition through mobile learning and worker-centric knowledge sharing [
8].
Virtual learning techniques may never be able to fully replace in-person experiences, but they have the potential to reduce the number of hours required to physically access assets, which is a critical factor in enabling social distancing protocols. Reducing contact hours also has benefits for the post-COVID world, enabling more distance learning to take place. This is desirable for several reasons, such as reducing the impact of time-constrained equipment access—for example, in the offshore wind industry, it may be advantageous to have learners begin to familiarize themselves with some of the mechanical maintenance tasks, such as use of manual tightening and measuring tools, throughout their training period. However, physical access to a wind turbine is not allowed until the learner has completed a Working at Heights certification [
9]. Given the predicted skills shortage mentioned earlier, anything that can reduce bottlenecks in the training process would be beneficial. Therefore, a digital at-home training app would allow users to start practicing at an earlier stage of their studies and keep up the practice as needed to build confidence and competence at the task. This is supported by Marienko et al. [
10], who suggest that one of the main benefits of AR and VR learning over traditional methods is the ability to personalize learning experiences to individuals and improve the efficiency and effectiveness of their learning. In particular, they recommend the use of AR and VR to replicate future work environments, which leads to improved productivity in the workplace when compared to traditional classroom-only teaching.
Further, it allows users to practice tasks as frequently as they like and at a time that suits them, which may open up more opportunities for those studying part-time alongside a job, or managing additional unpaid responsibilities that preclude them from learning in the standard 9am–5pm pattern. Additionally, this blend of the real and virtual world in learning can align with the concept of flipped learning—a learner-centred approach to education with a flexible approach to accommodating learning where most content is accessed outside of formal learning spaces, leaving “classroom time” open for more discussions and active learning activities [
11]. Studies suggest this style of pedagogy can engage a wider range of learning styles, as well as having a positive effect on motivation [
12] and performance, especially in project-based learning [
13]. This paves the way for a more diverse workforce. Add to this the existing engineering skills gap in the UK—McKinsey estimate that around 94% of today’s UK workers across all sectors will lack the skills to perform well at their current job by 2030 [
14]—and it is clear that the UK can ill afford to fall behind in training and upskilling the next generation.
By using AR rather than video, learners can experience a more realistic scenario using 3D content and more immersive practices. While, as noted, it may never replace in-person or on-site training completely, it has potential to supplement existing online learning techniques and compensate for a loss of access to required facilities by simulating the work environment. This is particularly true if Gorecky et al.’s prediction for the future of manufacturing comes true, in which virtual training is delivered to the shop floor via mobile devices linked to a semantic knowledge platform and accessed via the Web [
15]. While just a vision at present, this shows how MR and Industry 4.0 technologies are increasingly becoming part of the workplace. A case study from BMW shows that this prediction may not be far off, as the authors showcased an example where head-worn AR was used to train associates on the assembly line [
16]. As well as saving on the cost of hiring trainers, they also claimed that trainees benefitted from the flexibility to learn at their own pace, though no numerical data were provided to support this suggestion.
Prior research in the field of AR education also supports the concept of MR as a training tool, as a meta-analysis of 87 research articles describing AR applications in education and learning across all subjects resulted in a moderate positive influence on learning (mean effect size of 0.56) [
17]. In the Philippines, portable AR guidance for vocational and technical training was trialled in K-12 education (5–17 year olds) [
18]. Implemented via a head-worn AR display with a wristband for gesture control of the AR content, the app delivered training in four stages—Demonstration, Simulation, Application and Evaluation. Real-time video assistance with a remote expert was also available in the case of any issues. The researchers reported it positively; however, no data were presented to support its success and it should be noted that head-worn display technology remains costly and may not be accessible to the majority of school pupils. Chang et al. found that Taiwanese schools have used AR to great effect in the form of an interactive mobile app about plant growth compared to a digital video conveying the same knowledge [
19]. Though both learning techniques resulted in a good level of effectiveness immediately after learning, the AR condition was more effective in a delayed-test questionnaire, suggesting AR helps learning retention.
In higher education settings, AR has been used to teach mechatronics students the basic principles of handling milling and lathe machines [
20]. The app used marker-based AR delivered via smart and touchpad control. A mixture of 3D models, videos and annotated instructions were used. Participants answered 10 questions for system acceptance and performance to judge the success of the system; however, the researchers did not directly measure performance in terms of, for example, speed or accuracy. Similarly, Bloxham et al. found that AR is particularly useful for vocational degree courses (in this case, wearable crib sheets for automotive technology), where it can provide virtual access to practical content and learning that may otherwise be limited if only the physical world is used [
21]. A study at the National University for Distance Learning in Spain compared AR mobile apps with a video for learning about occupational health and safety [
22]. Students in the AR condition were more likely to review the content again at home and scored significantly higher than those who had access to the video content. Students reported the AR as being more interesting, easier to access and use and more enjoyable to use to share learning with fellow students (an example of contextual learning). This suggests that MR tools can indeed enhance the practical aspects of a vocational education and may be used alongside physical practice to achieve learning objectives. Pan et al. used mobile AR to superimpose 3D models and sectional views to aid manufacturing design students. They reported a perceived improvement in learning efficiency, while noting that an AR solution such as this also reduces teaching workload [
23]. Santos et al. carried out a comprehensive meta-analysis of 87 research articles describing AR applications used in education and learning across all subjects [
17]. AR interventions appeared to have a moderate positive influence on learning (mean effect size of 0.56). However, this is not as clear-cut as it first may seem. The measures of learning are not consistent across studies and therefore the authors made recommendations on how data should be collected, including:
The learning effect should always be measured by comparison of an experimental group to a control group;
Extraneous variables must be carefully controlled;
Both mean and standard deviation should always be reported to allow comparison of the relative effect sizes of different interventions.
From these studies, it is clear that MR technologies have the capacity to supplement traditional education by simulating practical tasks and environments. However, there is a lack of robust data to support the idea that MR learning experiences are effective in achieving the desired learning outcomes. Given that access to physical assets is so limited in the post-COVID era, using MR as a more immersive alternative to standard video-conferencing technologies could be very valuable to trainees and educators alike. However, given that learners may be accessing the content from their own homes, and on their own devices, it is important to keep technical requirements to a minimum to allow a broader range of users to access it. In this study, we examined the use of a low-cost, asynchronous remote learning system that uses AR to guide trainee electrical engineers to diagnose faults in a three-phase power supply.
2. Materials and Methods
According to Egger and Masood, the most dominant device types in previous AR research were head-mounted displays, followed by hand-held displays (e.g., mobile phones, tablets, etc.) [
6]. This study proposed MR as a way to prevent loss of learning for students and home learners; therefore, the accessibility and low cost of the system were priorities. Figures show that 88% of the UK population owned a smartphone in 2019 [
24], rising to 93% and 94%, respectively, in the 18–24 and 25–34 age groups. Therefore, an MR instructional application was designed using web-based technologies and lightweight visual tracking algorithms (as opposed to robust but computationally expensive techniques, such as SLAM [
25]), so that it could be accessed even on a budget smartphone, so long as users had access to a camera and reasonably modern Web browser. By utilizing mobile-based AR, set-up costs are minimal, as smartphones are almost ubiquitous and not prohibitively expensive for training institutions to supply if necessary. This was used alongside paper print-outs, which could be provided as part of a textbook experience or as a standalone download.
The experiment was advertised across media platforms and amongst existing contacts to recruit participants. After filling out a short sign-up sheet and background questionnaire, the 19 volunteers were split into two groups: those with backgrounds in electrical engineering (eight “expert” users) and those without (11 “non-expert” users). A summary of participants’ backgrounds and demographic data can be found in
Table 1.
All participants were shown a short video to guide them through the operation of the application and were provided with a written explanation of how the app worked via email. Both groups of participants were to follow the instructions in their respective apps to diagnose four different faults in the system.
Performance measures for the study were chosen to capture the differences of MR technologies, but care was also taken to ensure results could be compared against other studies of a similar nature. According to Egger and Masood, the most common measures in the industrial MR studies reviewed were time (39.5%), error rate (30.2%) and NASA-TLX (17.4%) [
6]. User acceptance was not the main success factor but still a big challenge [
26], so freeform feedback was also considered important to capture the views of the users. The key performance measures considered were thus the time to complete each diagnosis, how accurate users were in correctly diagnosing faults and how many observations they required to make each diagnosis, which were all measured via timestamps recorded through app use. After the end of the task, users were asked to answer a short survey to provide qualitative feedback and record the cognitive effort required based on the NASA-TLX scale, a measure of the mental, physical and temporal demand involved with tasks. Performance was then compared between the “experts” and AR-guided “non-experts” to gauge if the app was effective in teaching users how to take measurements and diagnose faults in three-phase power supplies.
Three-phase power supplies are very common across a variety of industries, including offshore wind. Three-phase AC (alternating current) efficiently transmits high-voltage power from generation sites (such as a wind turbine) and distributes it over long distances across a network. Therefore, examining and diagnosing potential faults in a three-phase power supply is a common task across many industries. As relatively complex systems, there are opportunities for a number of different errors to occur, which must be identified precisely in order to repair the system. This is why this task was selected as a proof of concept for this technology.
Marker-based AR was used as a quick, robust method of locating and projecting AR content, and the hardware device chosen was the users’ own mobile phones so that the study could be carried out remotely, as per COVID-19 regulations. The MR app was accessed via a webpage, which used the device’s camera to provide a live stream of the real world.
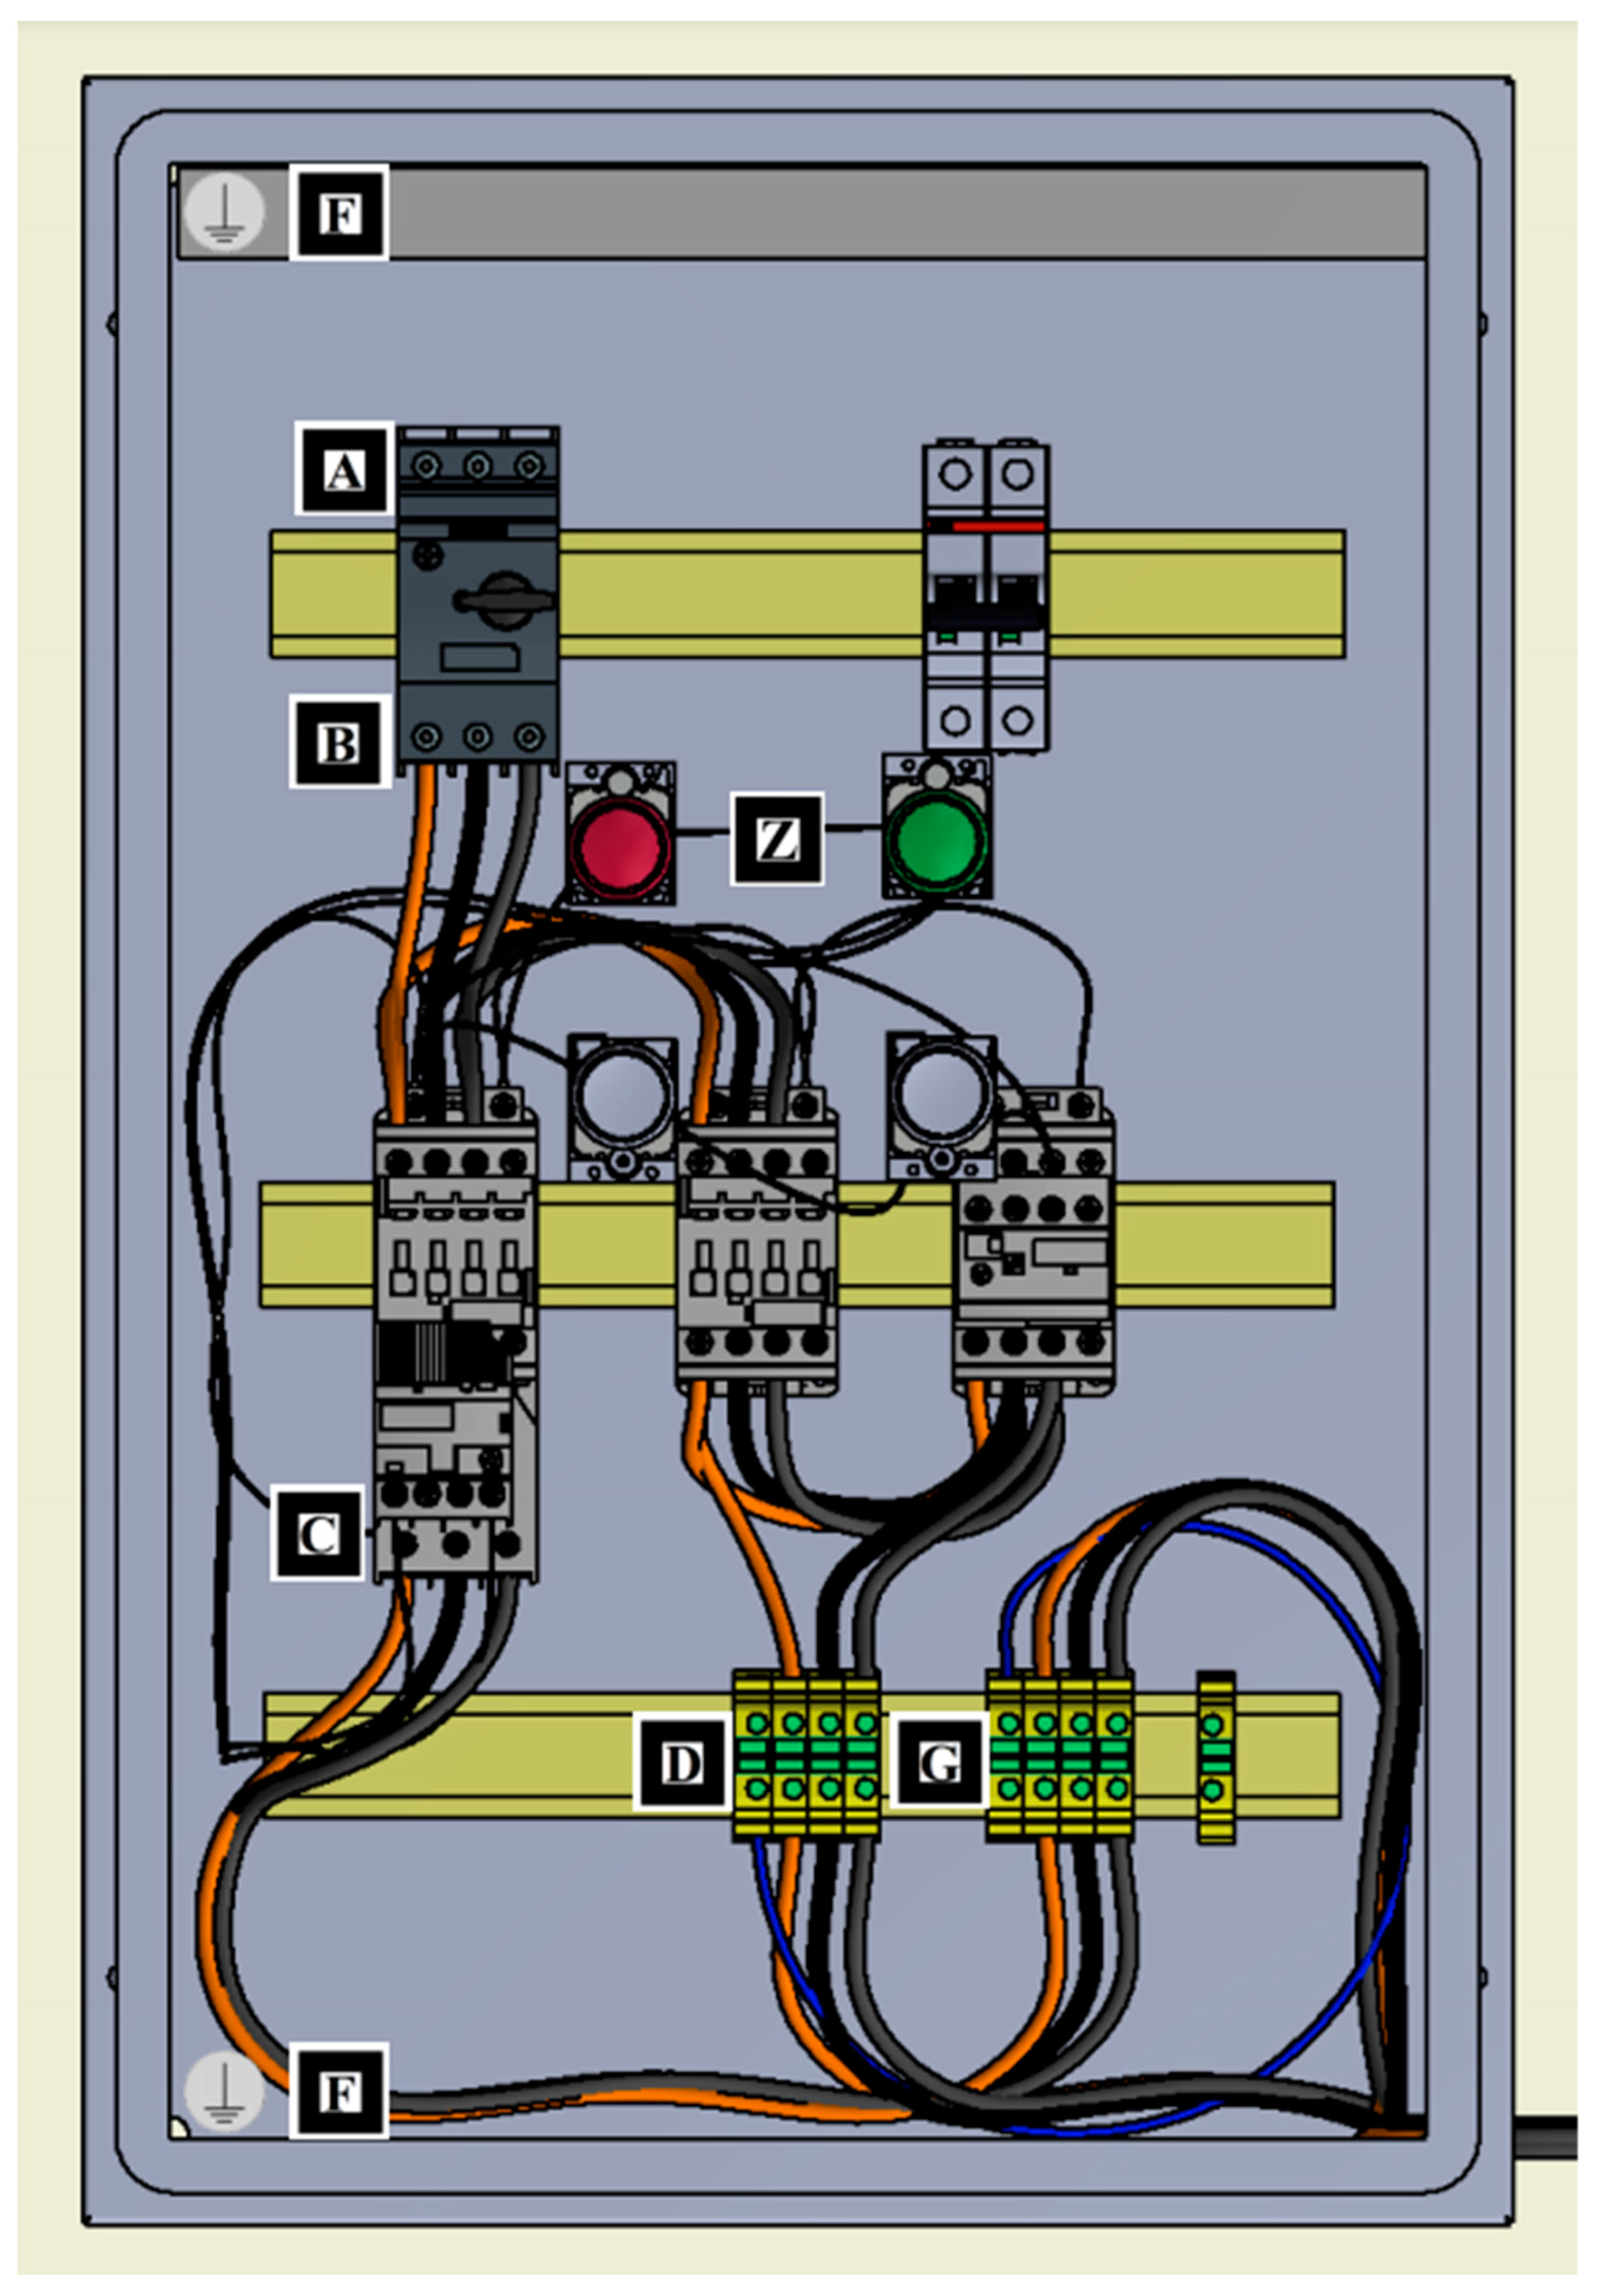
Figure 2 shows the physical print-out provided to participants. One marker was placed next to each key point on the diagram, and participants used their mobile phones to scan the markers, triggering digital content to appear on their screens as an overlay to the real world. The user would see a video stream of the real world, overlaid with digital points highlighting where a voltage may be taken. They could then enter ‘Take voltage mode’ to use a simulated multimeter to take a reading by selecting the desired points to place the probes. Once a voltage measurement was taken, users would be directed to a screen showing an image of a digital multimeter and the readings from the two measured points.
Section 2.1 and
Section 2.2 show more detailed descriptions of the app’s functionality, along with screenshots of the app.
2.1. “Non-Expert” Version
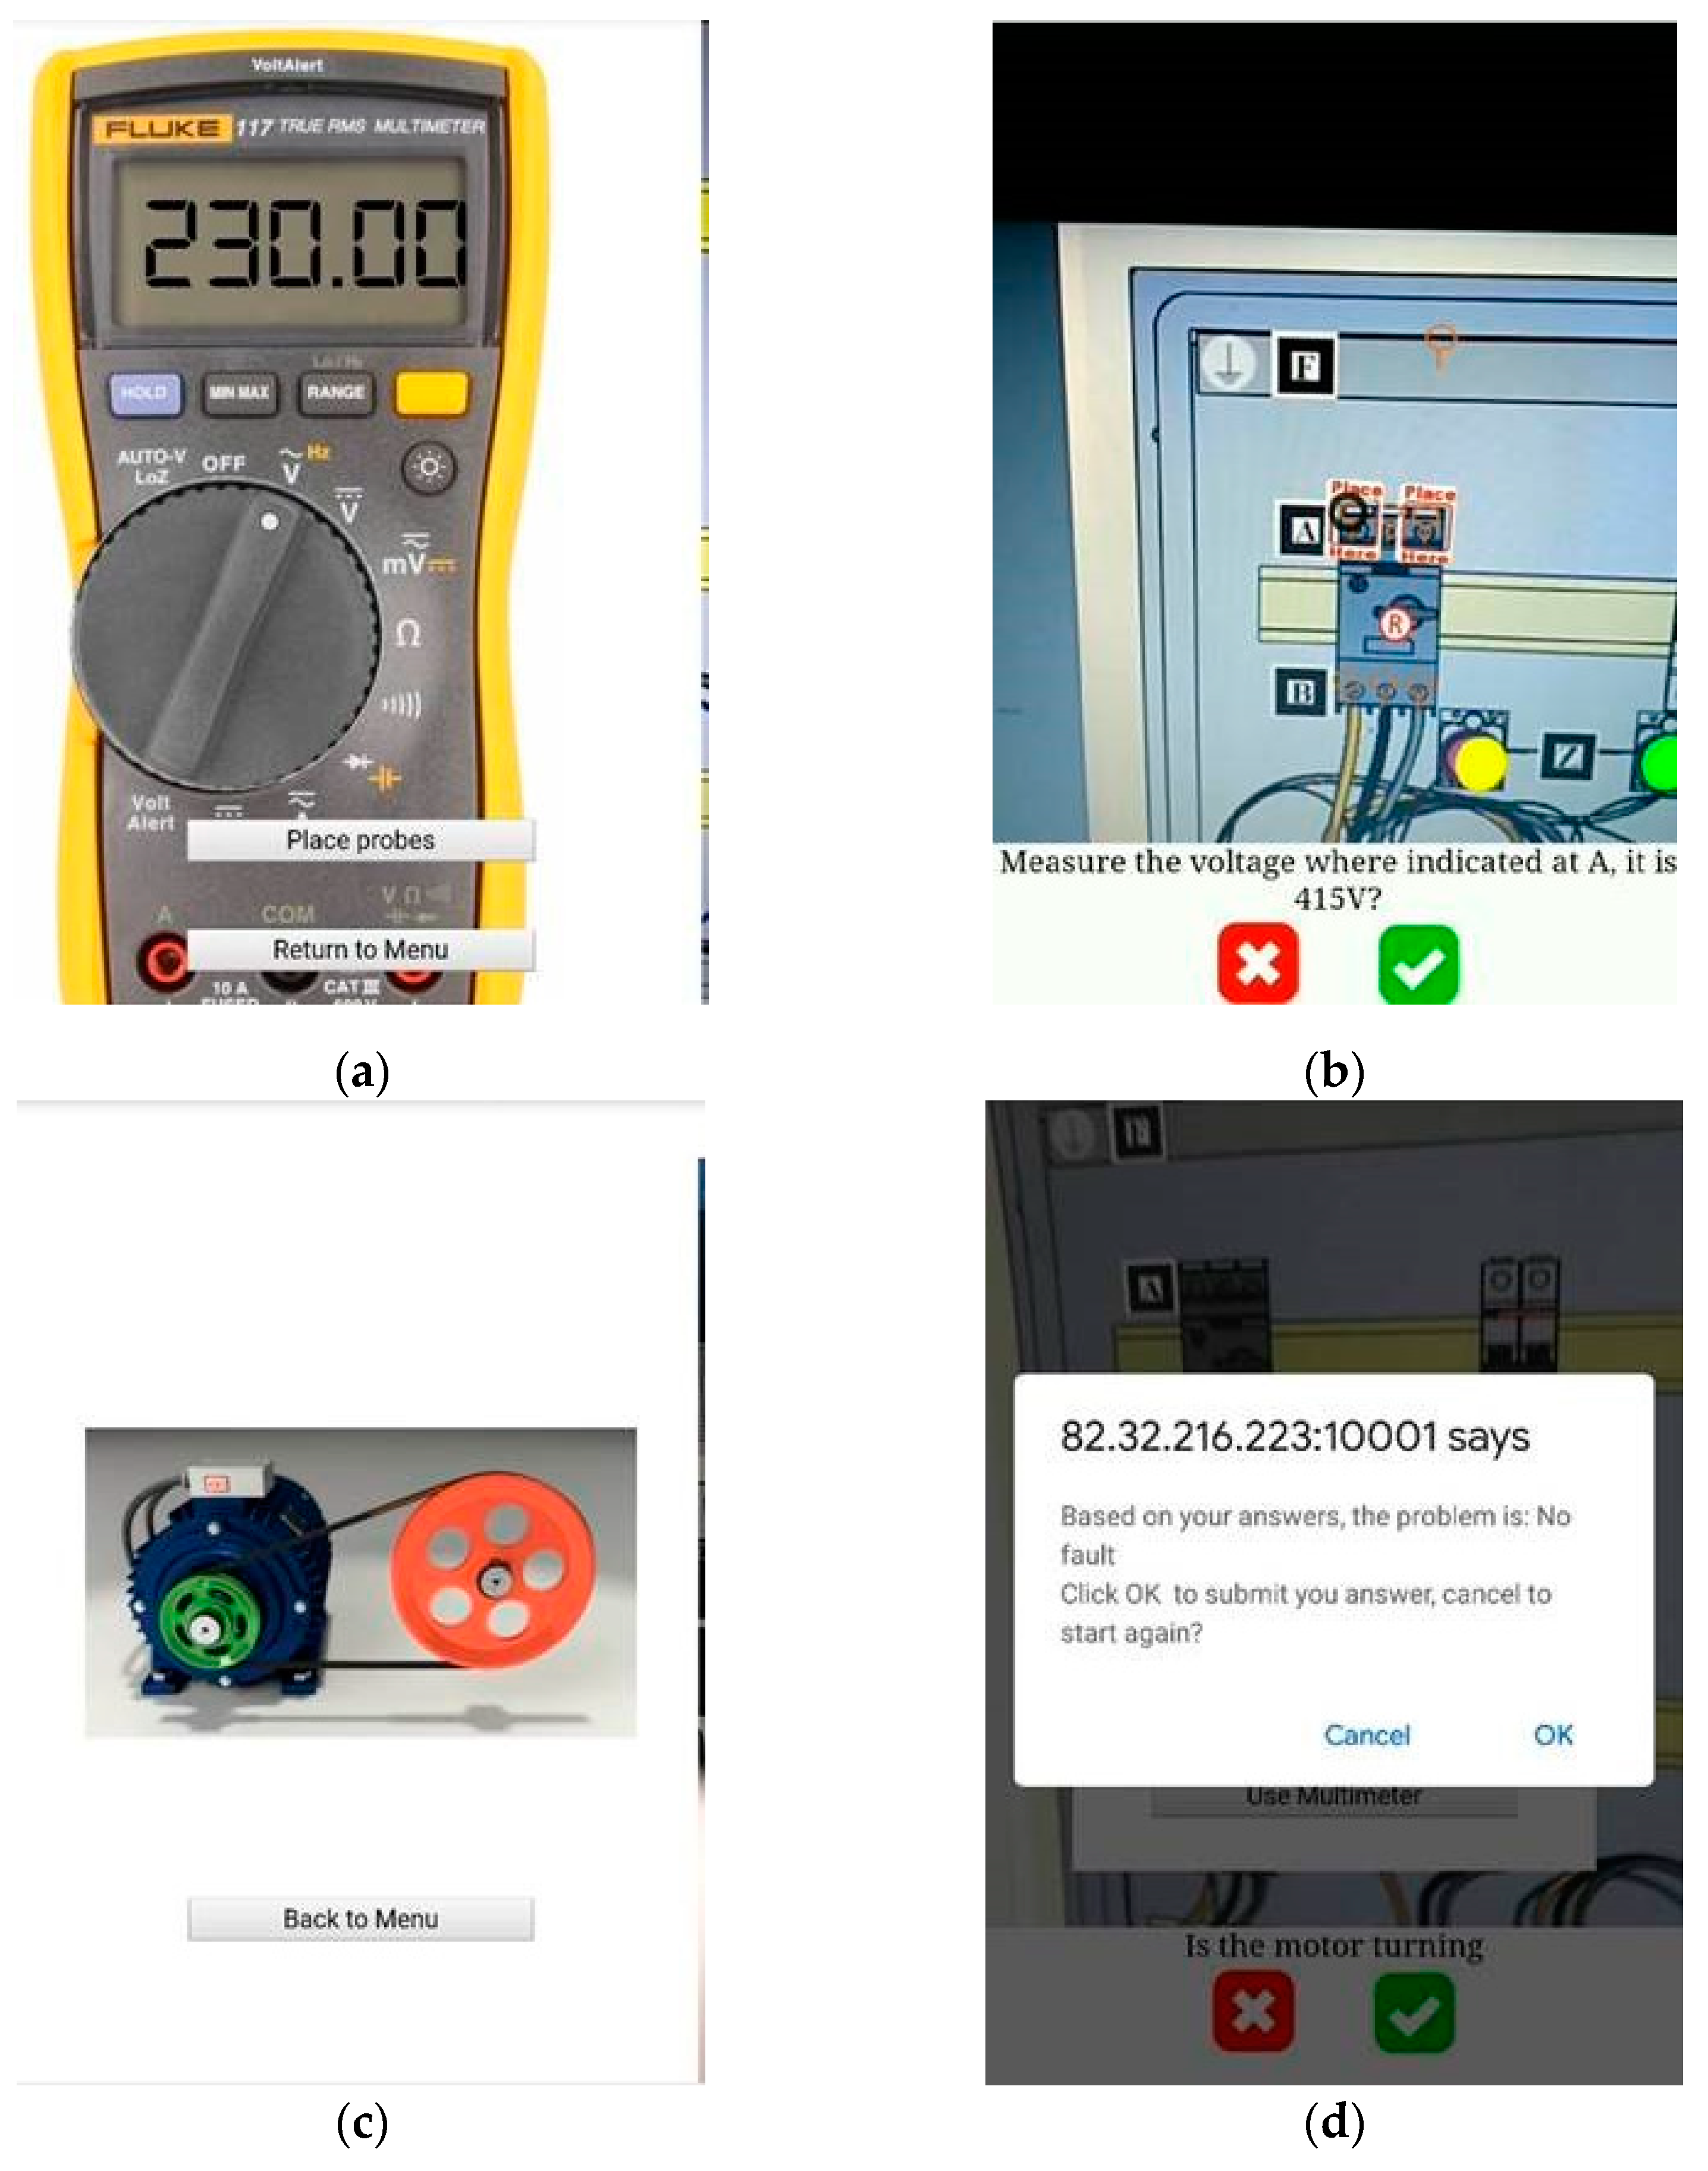
For “non-expert” users, AR content was used to direct the user to exactly where to take readings (
Figure 3a,b). In some cases, it was also possible for users to make observations rather than measurements, such as observing whether the motor was running (
Figure 3c). After each measurement or observation, the user was asked whether it met particular criteria (
Figure 3b) and, based on those answers, the app made suggestions as to what the fault was likely to be (
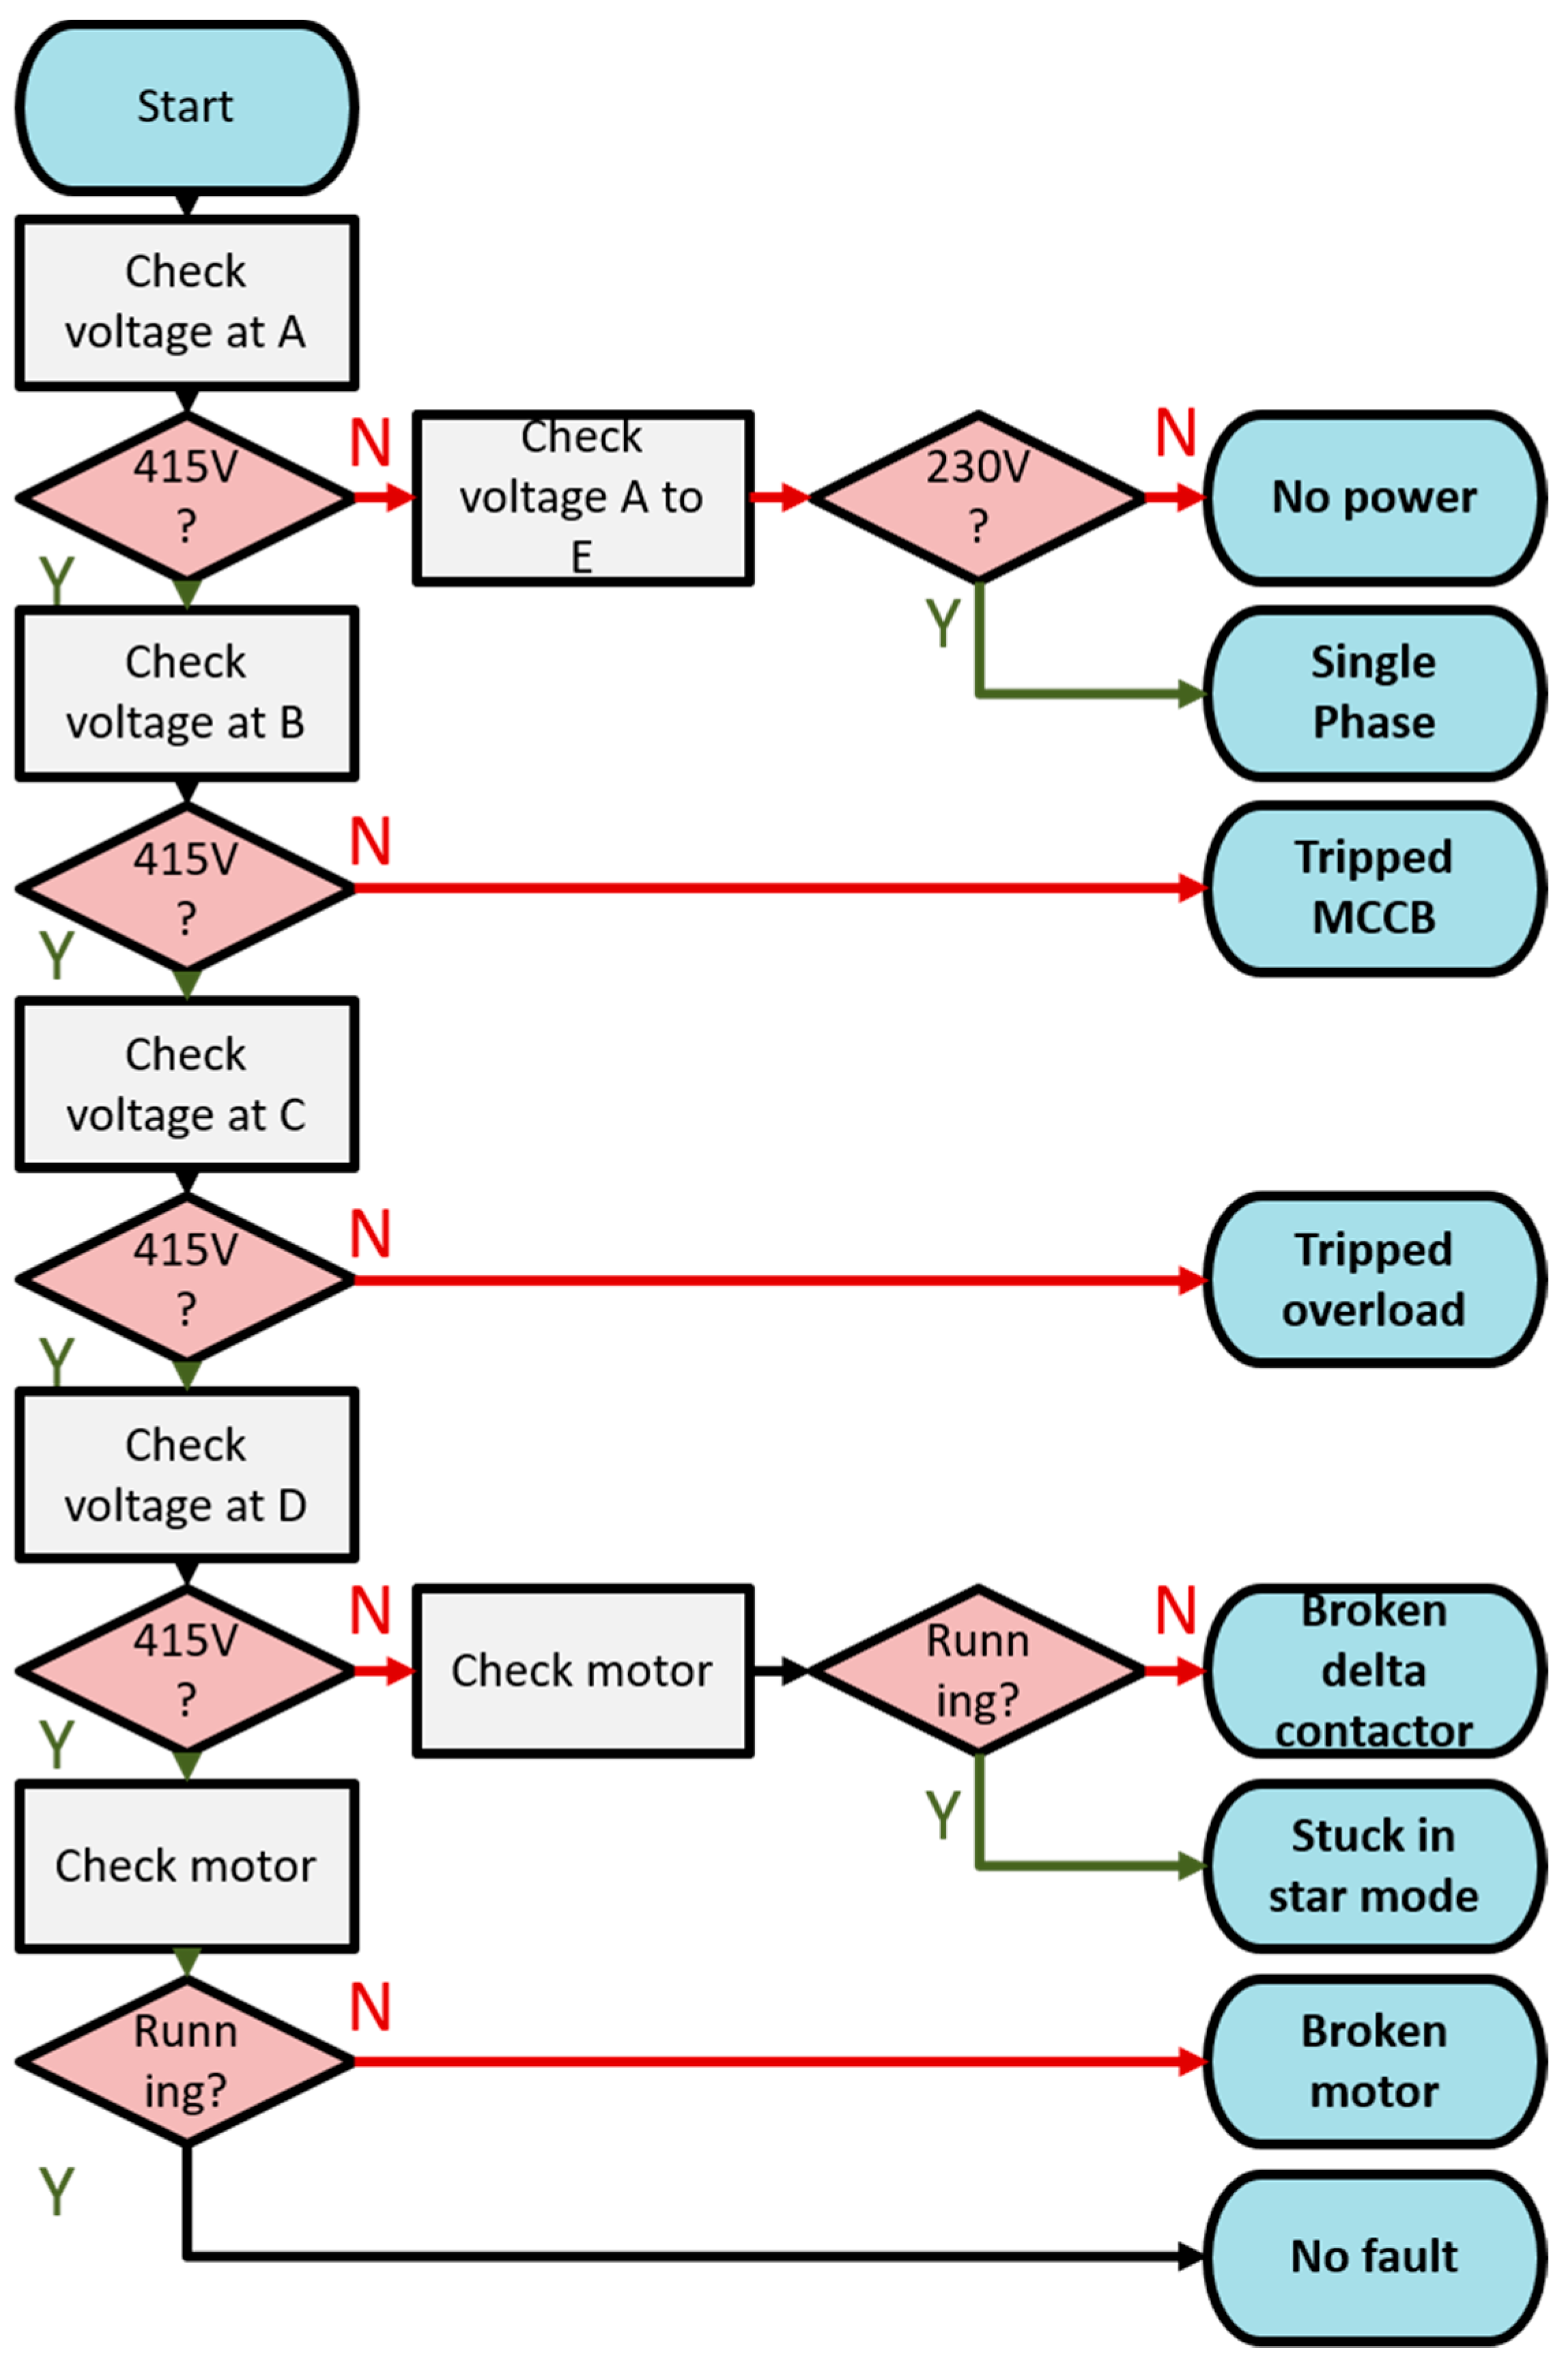
Figure 3d). The decision tree underlying this process is shown in
Figure 4. After receiving a suggestion, users could either submit, if they agreed with it, or, if they thought they had made an error in taking observations, they could restart the process.
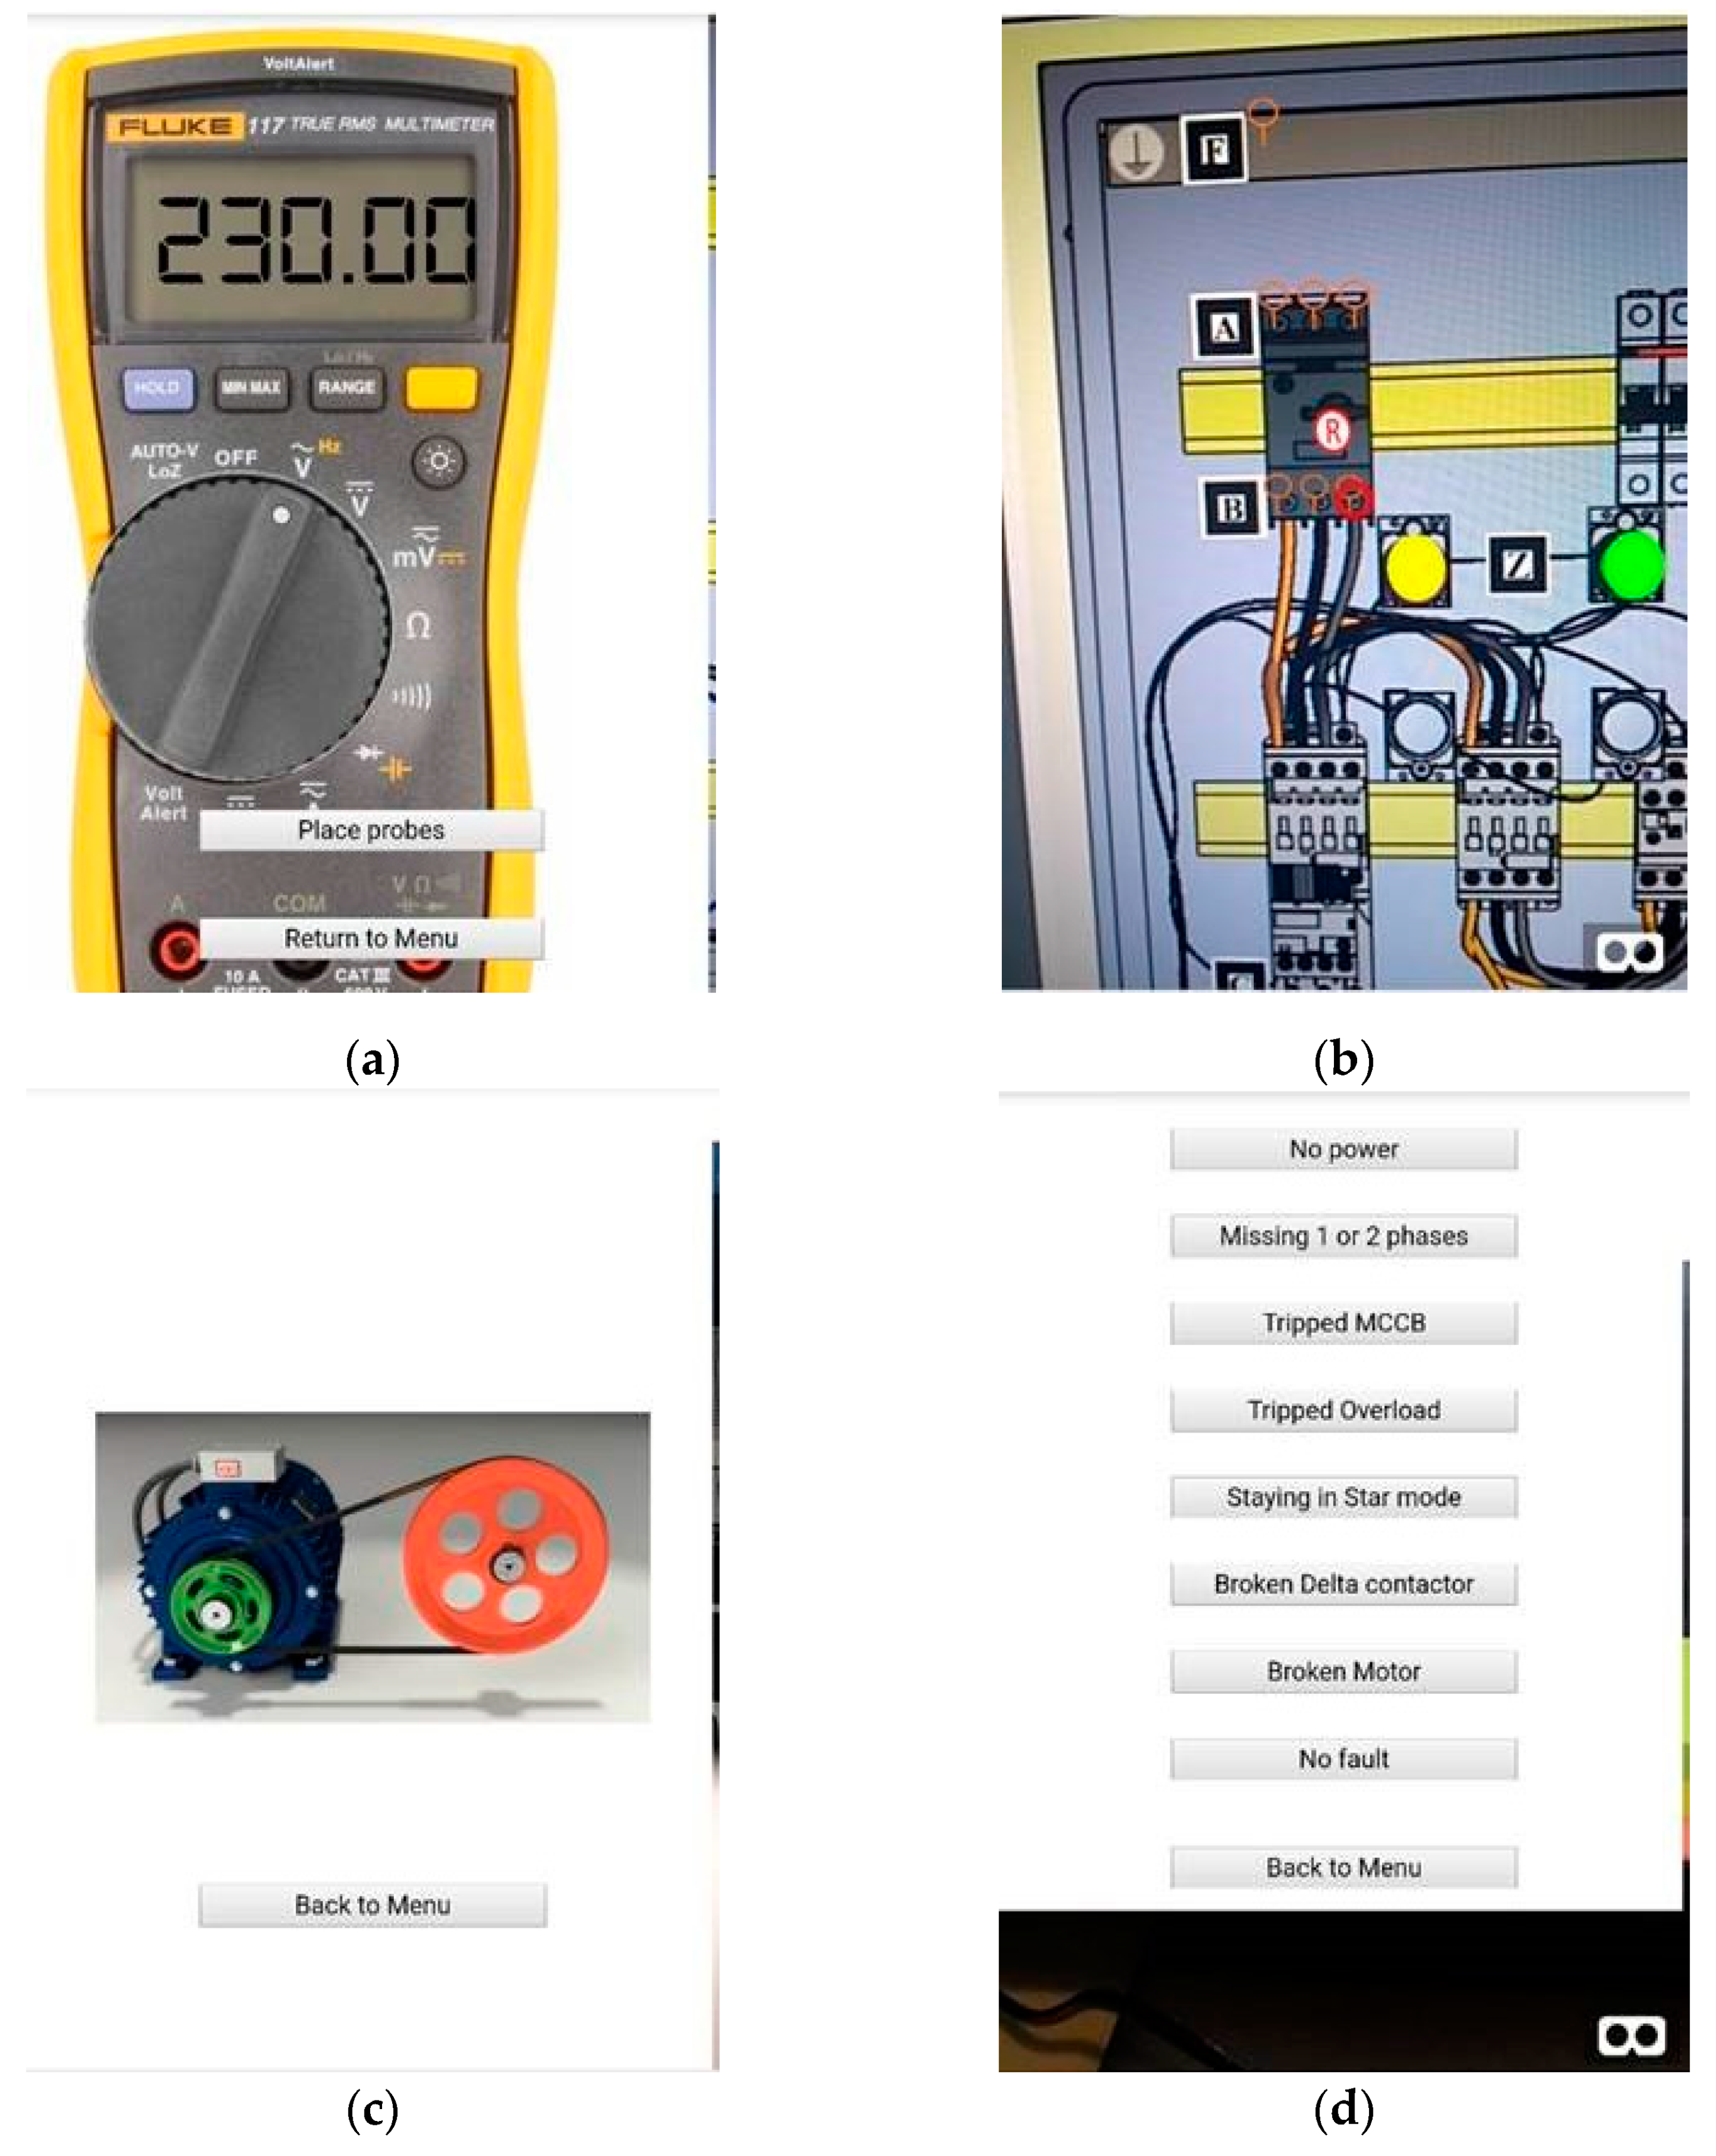
2.2. “Expert” Version
The “expert” user group consisted of those who self-identified as having a background in electrical engineering. In their version of the app, there was no additional guidance on how many measurements there were or where to take them. Instead, users were free to place the virtual multimeter probes and take measurements as desired (
Figure 5a–c).
Once they had gathered as many observations as they wished, they could submit a diagnosis from a list of eight possible answers, as shown in
Figure 5d.
3. Results
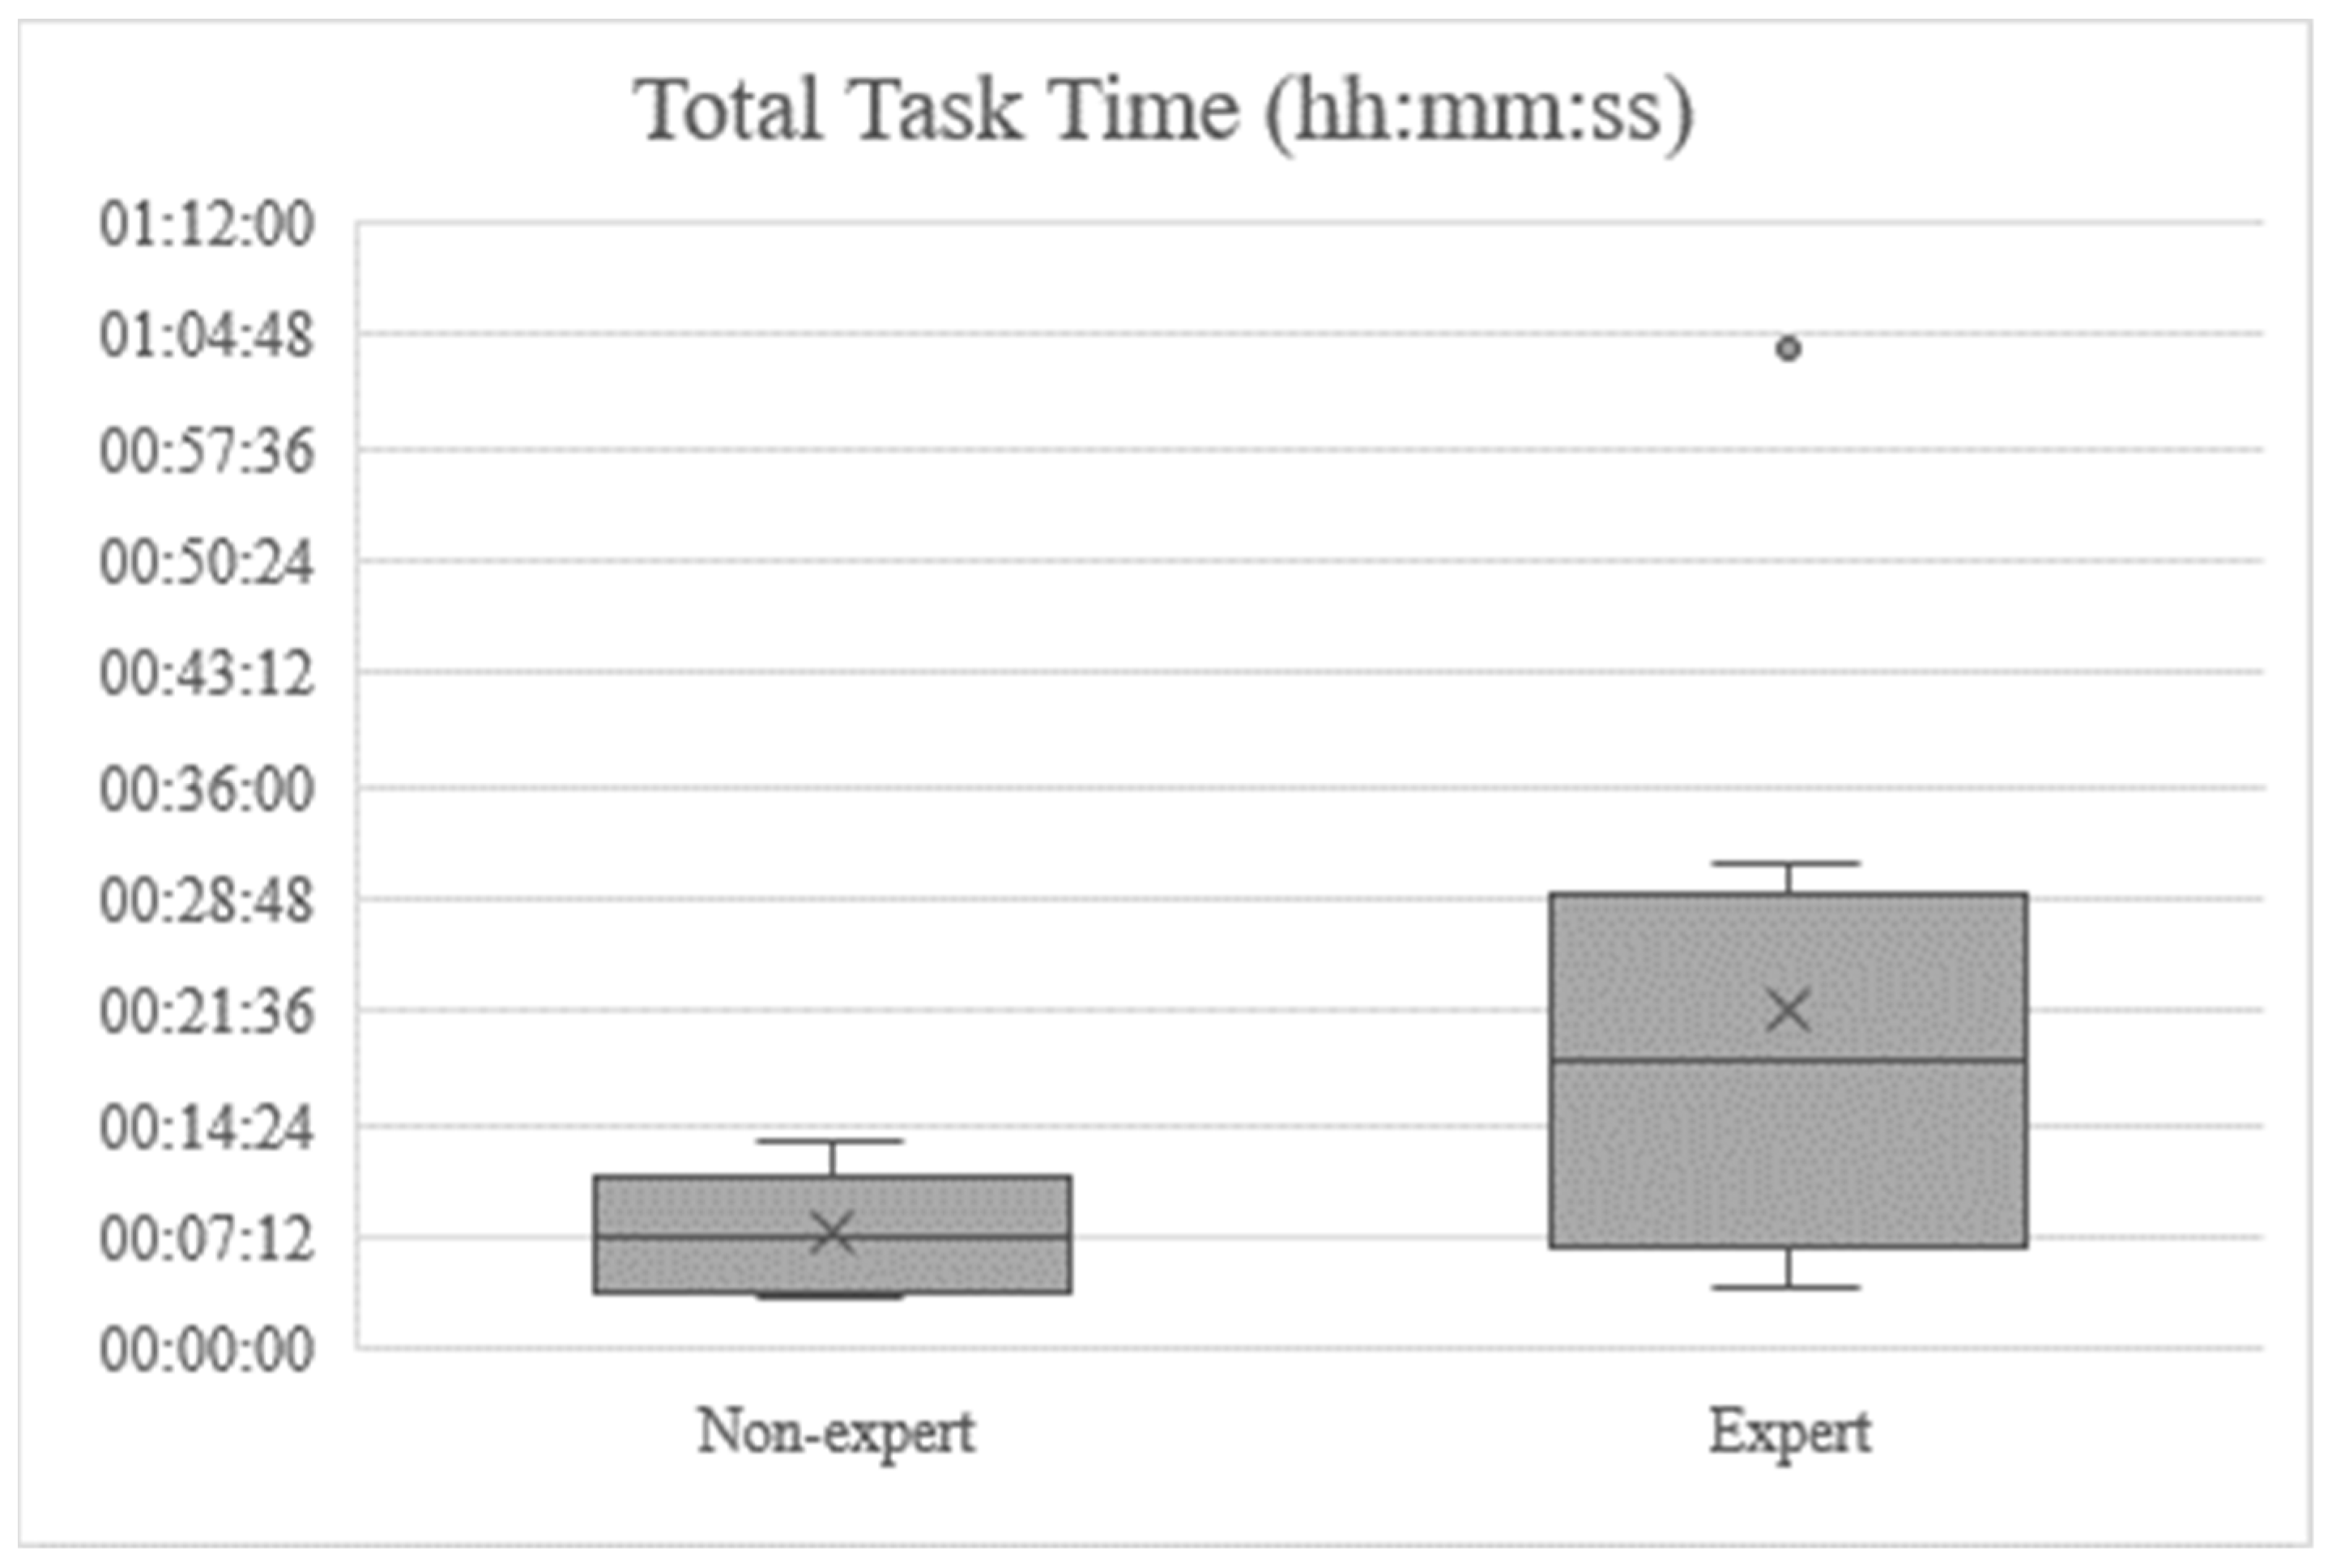
On initial inspection of the mean scores, those in the guided “non-expert” condition outperformed those in the “expert” category across all metrics. On average, they were 65% faster in making diagnoses, 79% more likely to get them right and took 29% fewer observations before making a diagnosis (
Table 2).
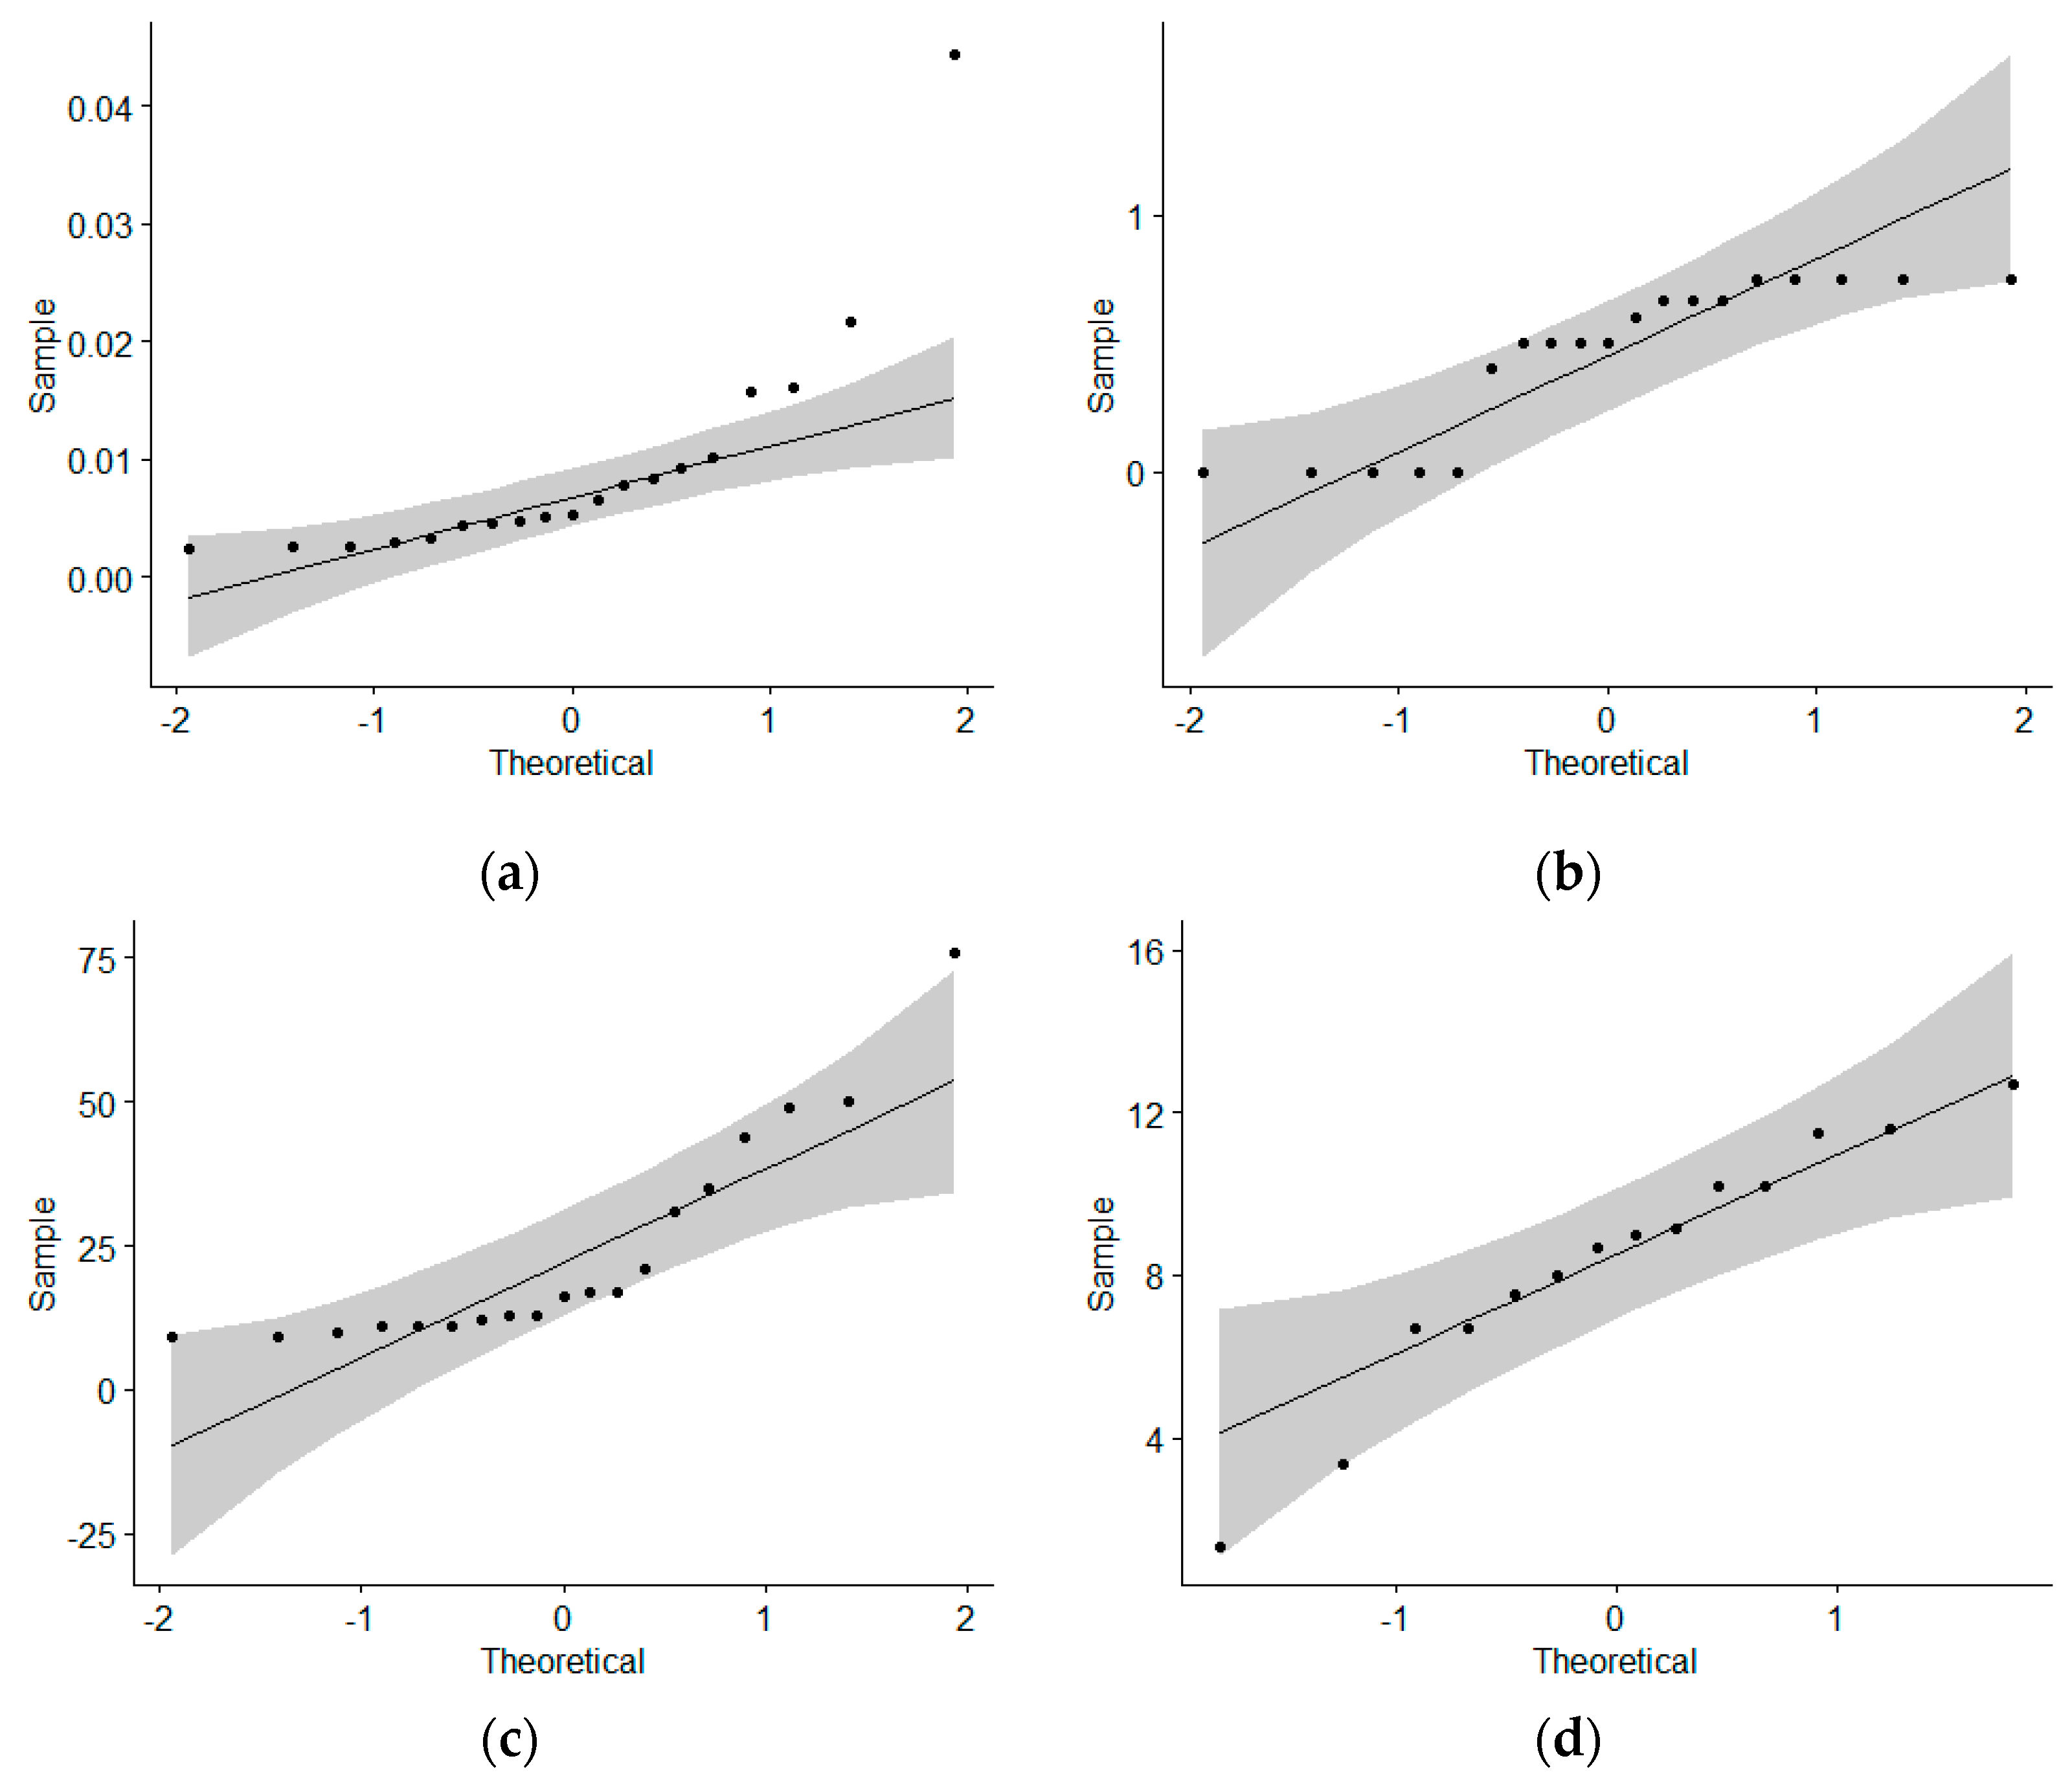
A two-sample t-test was carried out on the timing data to infer whether the differences between the two groups could be considered statistically significant. A t-test requires the dependent variables to be approximately normally distributed in order to be valid, so Q–Q plots of task time, percentage of faults diagnosed correctly, total number of observations and raw TLX score were plotted to check for this assumption (
Figure 7).
The grey shaded area in
Figure 7 represents a 95% confidence interval. As most of the points lie within this region, and the t-test is relatively robust with regard to violations of the assumption of normality, analysis proceeded as planned. However, it is worth noting that distribution of task time data deviated somewhat from the normal distribution at the extremes of the distribution.
A p-value of 0.08296 was found, meaning that the result fell outside of the 95% confidence interval, but within the 90% interval. This implied that there was a less than 10% chance that the difference between the two conditions was due to random variation rather than a true difference in the population data.
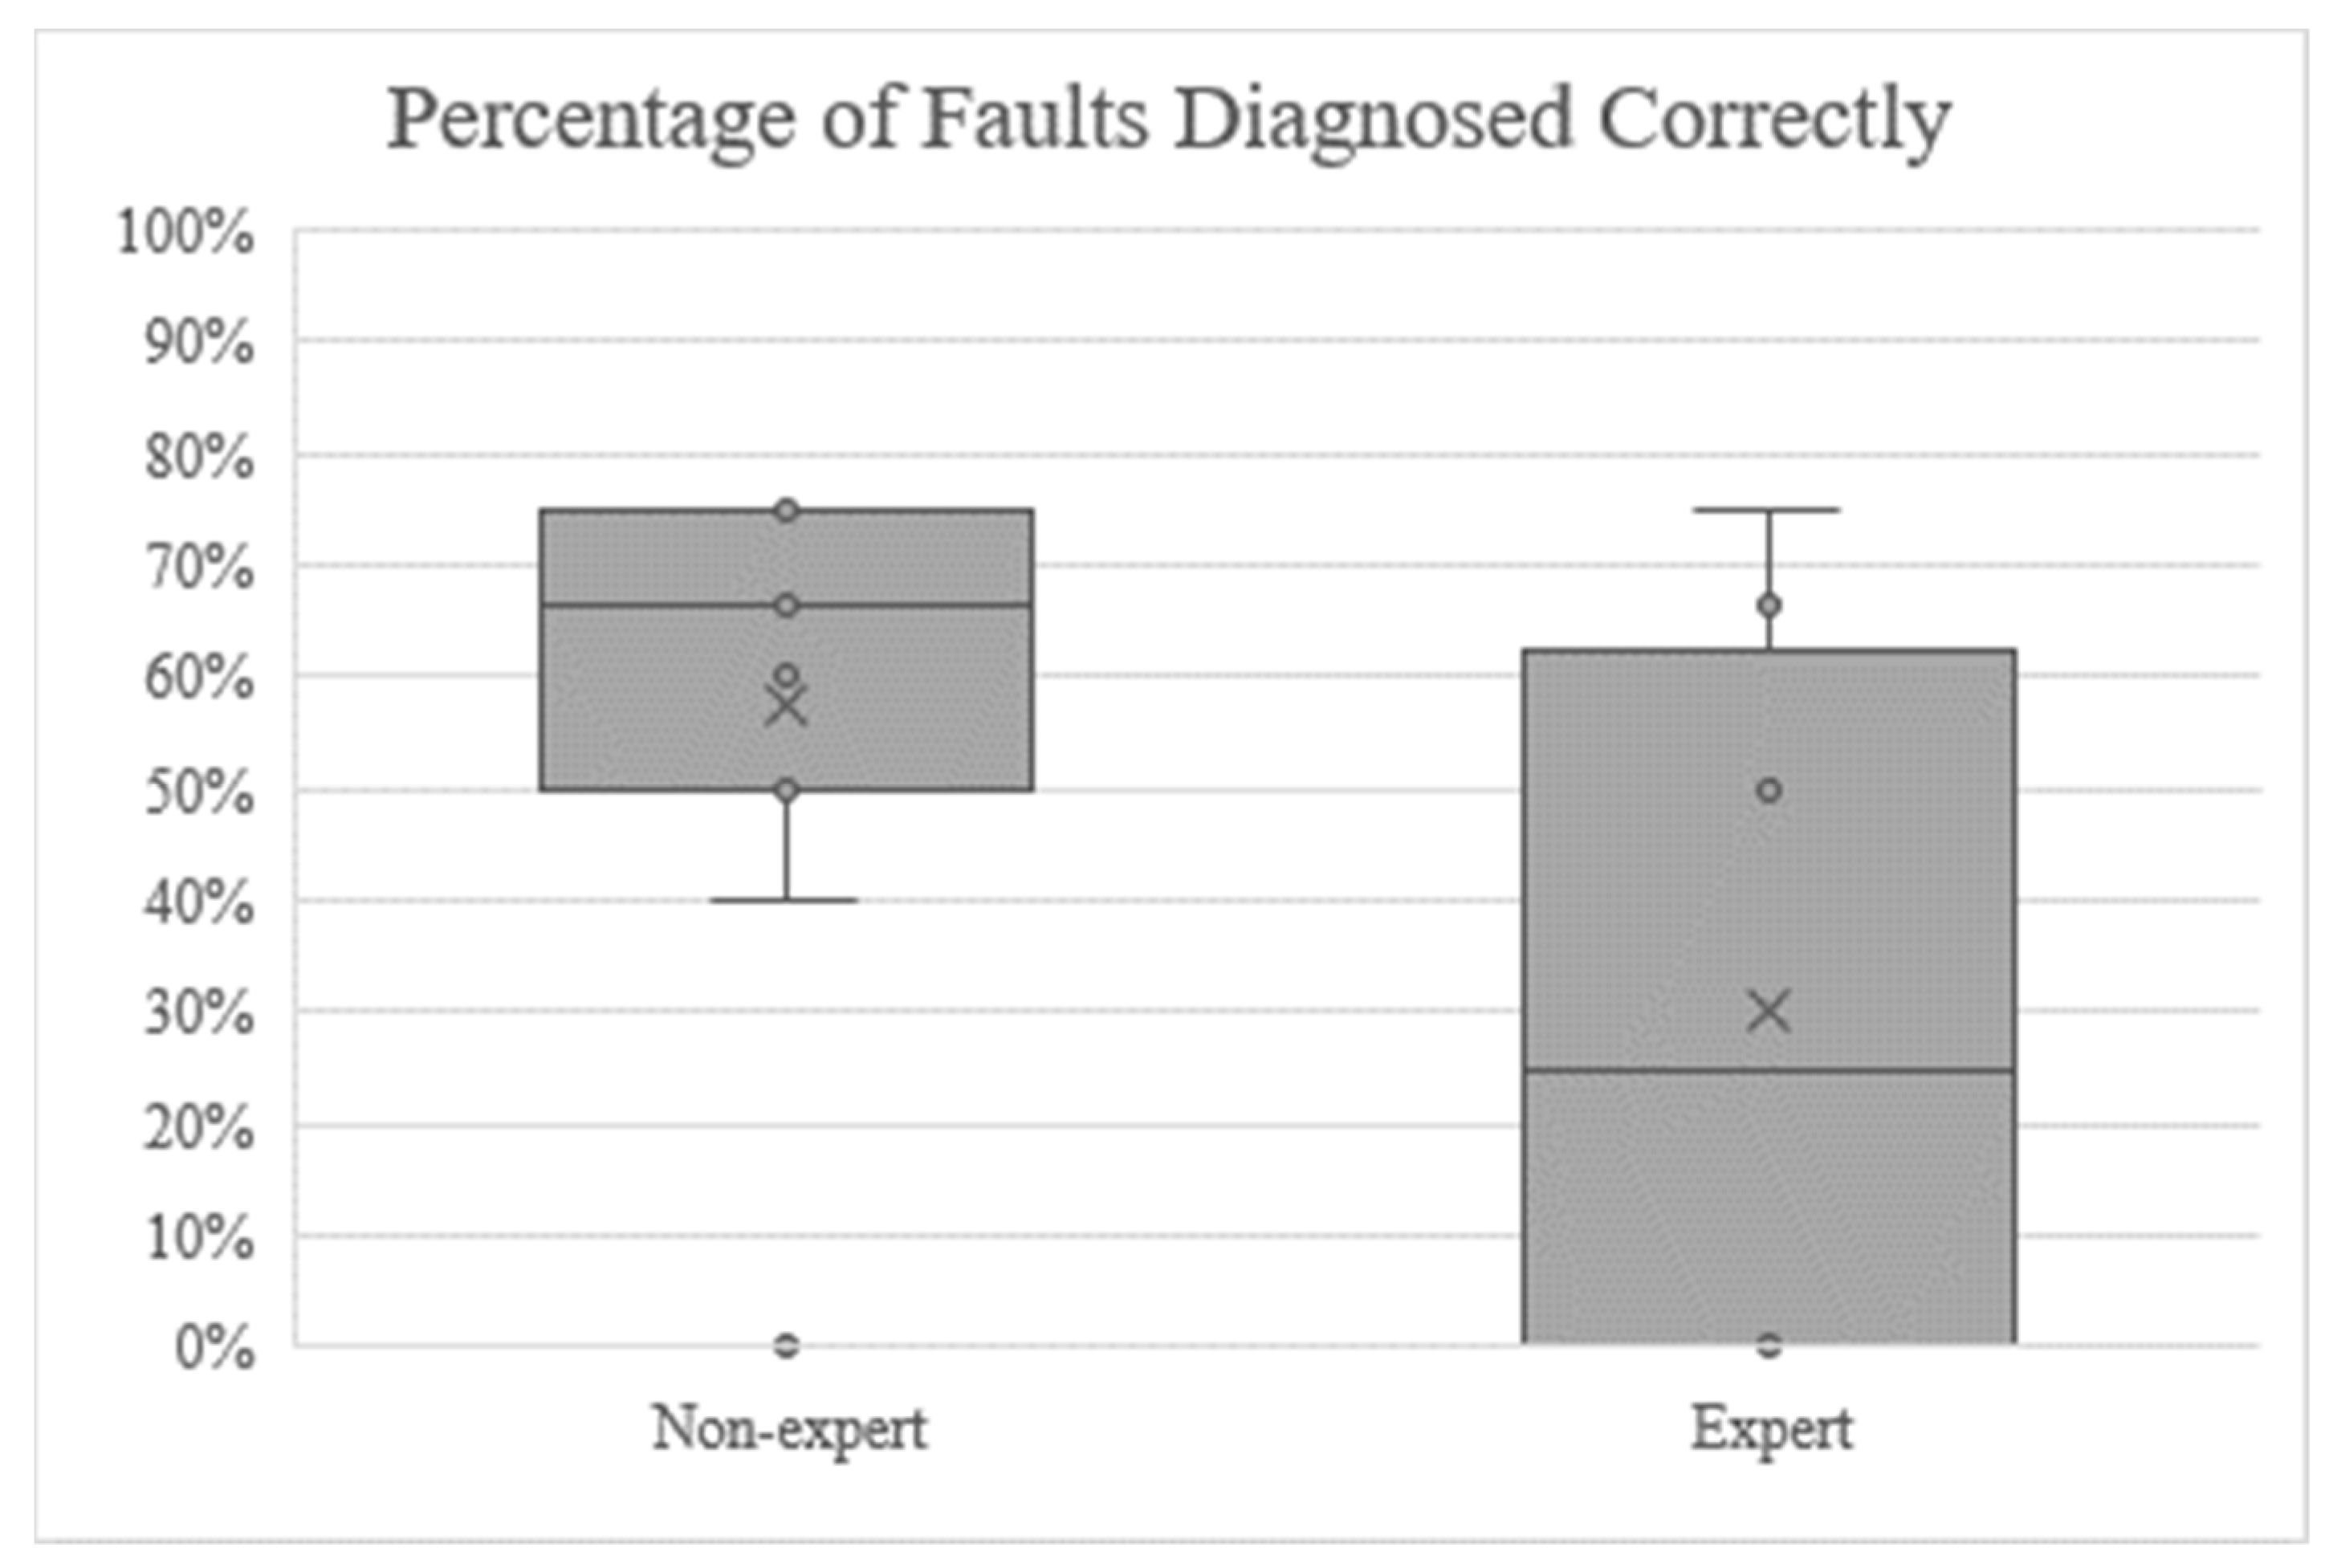
A similar investigation in the case of the percentage of faults correctly diagnosed found the difference between the two conditions to be below the standard threshold for significance of 95% (p = 0.1104).
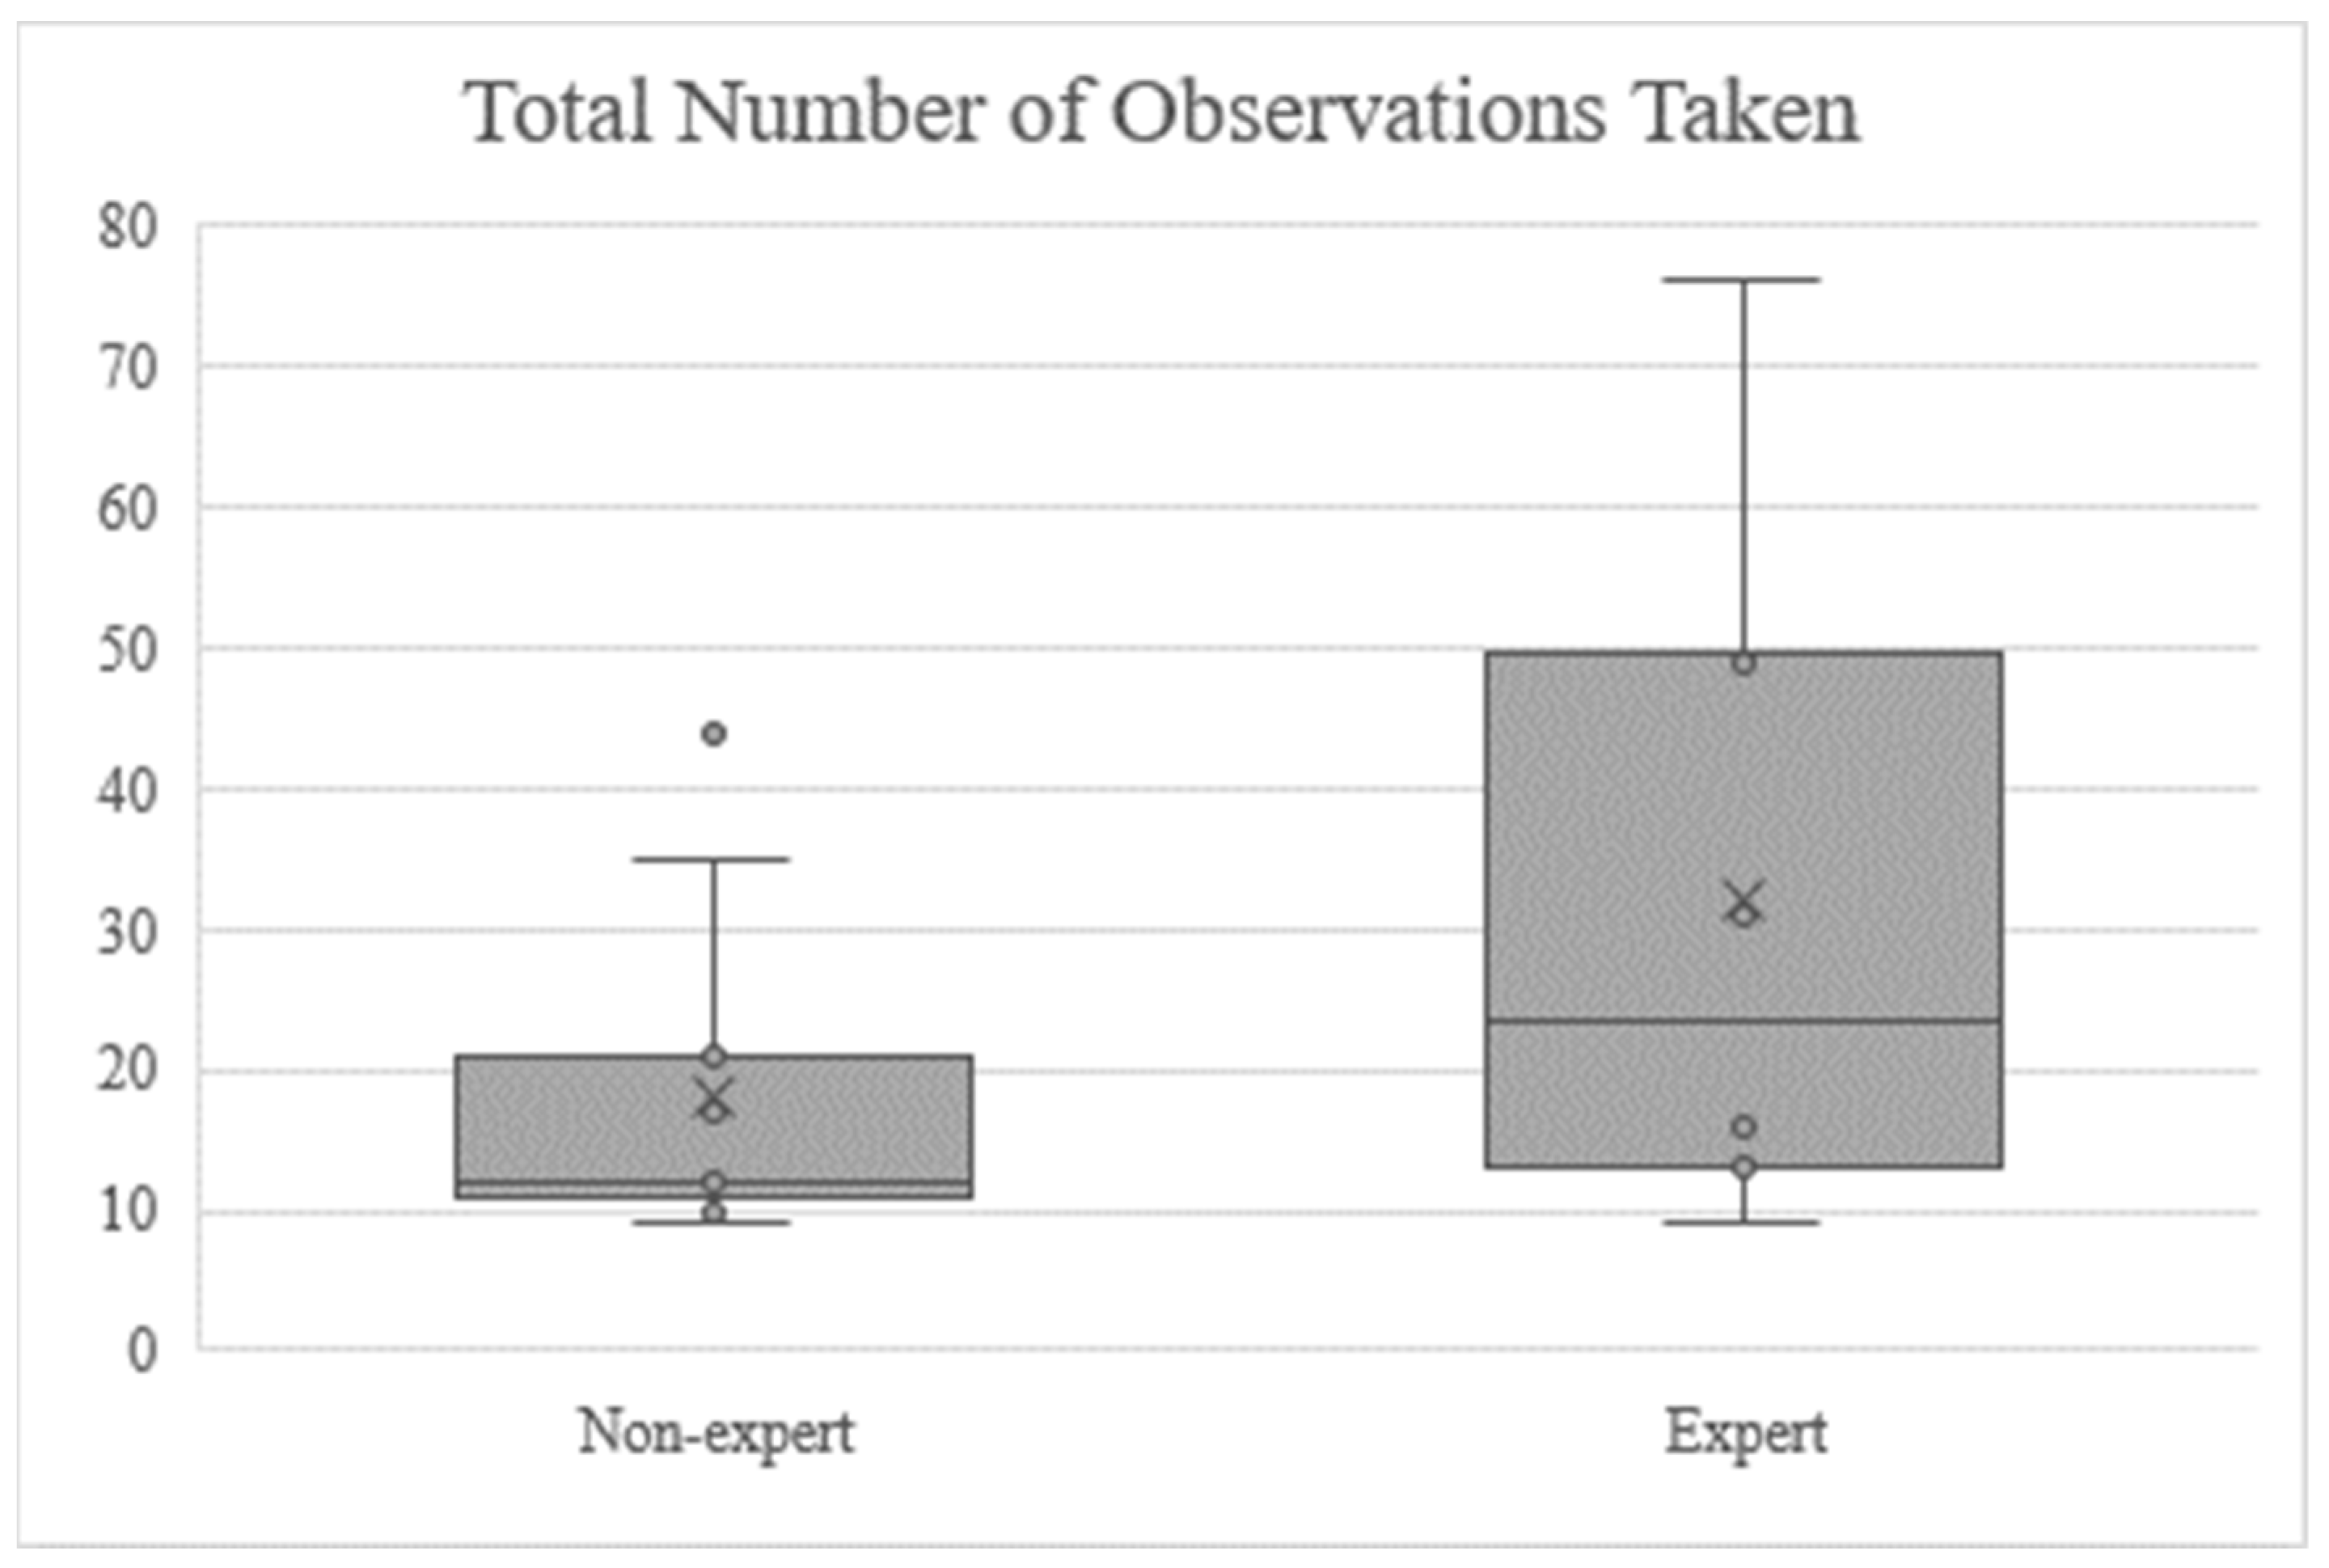
For the final metric measured during the experiment, a t-test investigated the differences between expert and non-expert performance in terms of the number of observations taken. A
p-value of 0.1572 was found, so while the plots in
Figure 8 appear to show a large difference between the two groups, statistical analysis suggests that the difference should not be considered statistically significant.
Table 3 shows a comparison between the first and final diagnoses in the non-expert user group to see if performance was improved across any of the metrics measured.
Overall, users were on average 34% faster by the fourth sub-task compared to the first, but with a noticeable drop in accuracy, from 61% to just 47% of diagnoses being made correctly. This drop in accuracy was particularly acute in the expert user group. Non-expert users meanwhile experienced a relatively smaller drop from 73% accuracy to 60%.
Finally, optional qualitative feedback was collected from all users via a short online survey linked at the end of the four tasks. Just 17 of the participants responded to this section of the task. All respondents were asked questions aligned to the NASA-TLX scale and the results were processed to create a raw TLX score, rather than a weighted one, as 20 years of research has shown that weighting does not significantly affect outcome [
27].
Table 4 shows the results of this—the “non-expert” users scored lower, suggesting that following the guided diagnostic process was generally less taxing than the experts using prior knowledge to complete the task.
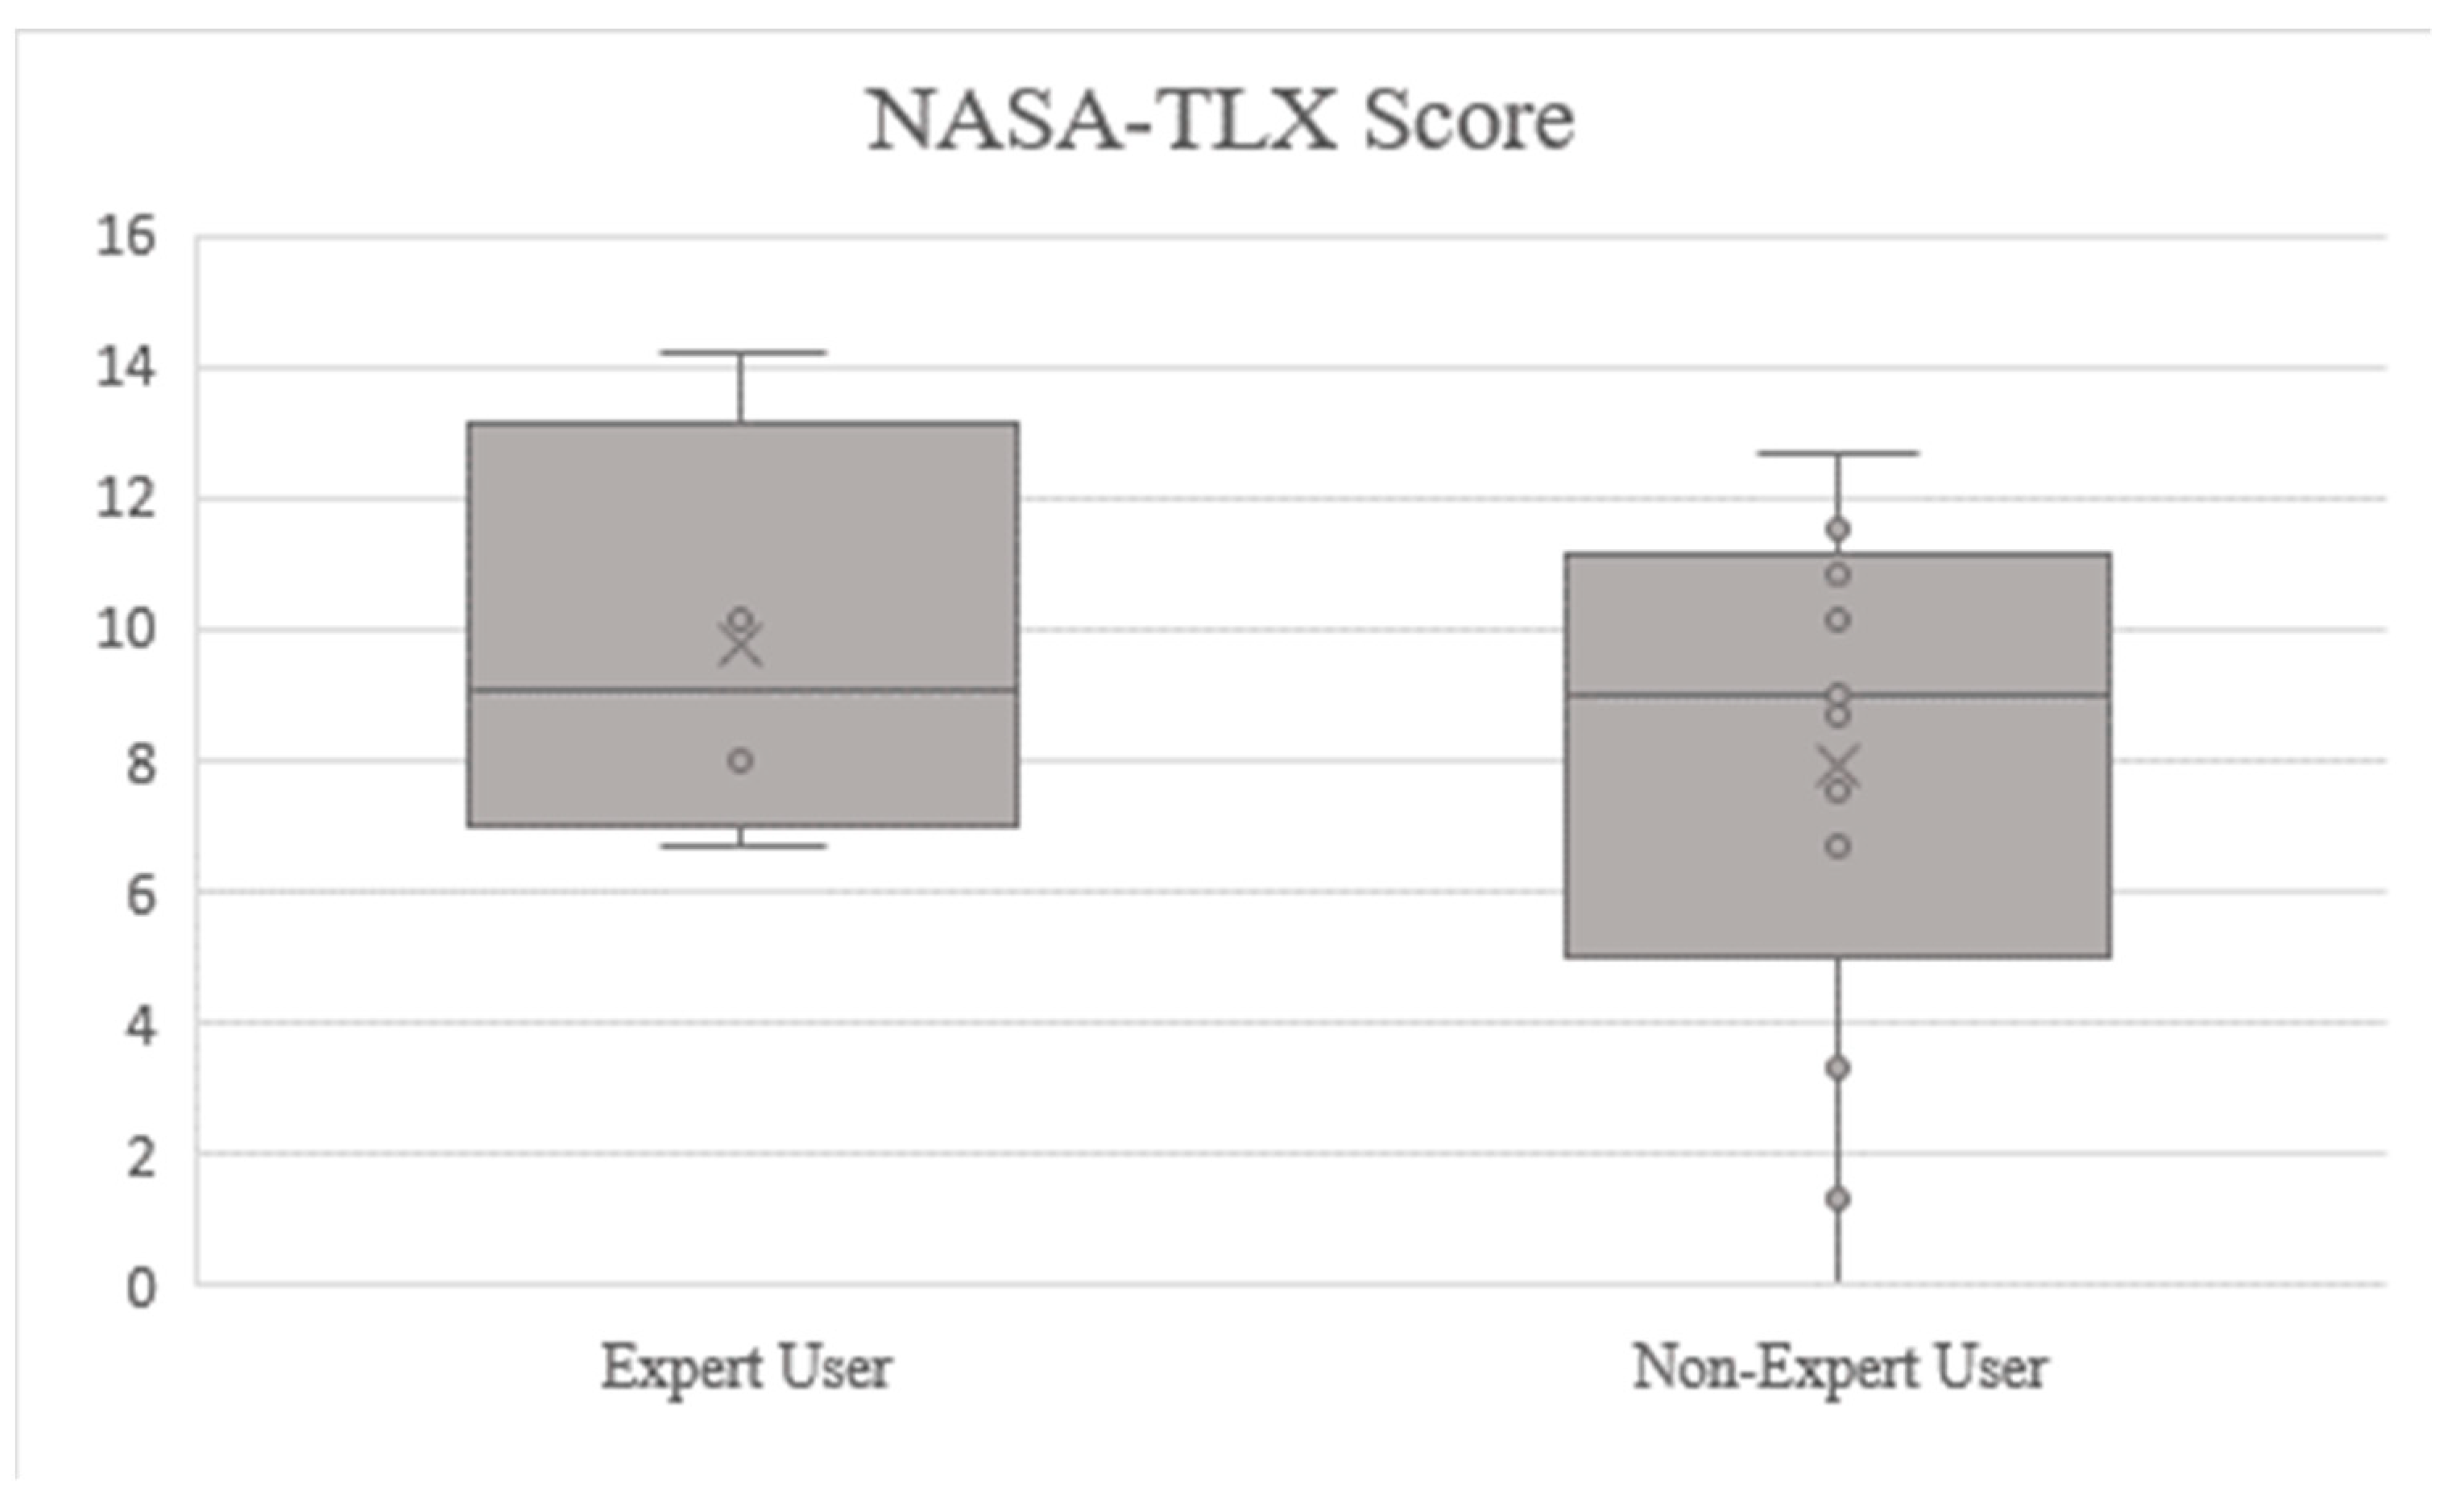
Figure 10 shows the unweighted (or “raw”) TLX scores of participants resulting from the post-task questionnaire as a box and whisker plot in order to better show the spread of data. The non-expert user group had a slightly lower mean score; however, a two-sample
t-test revealed a
p-value of 0.381, suggesting the difference was not significant.
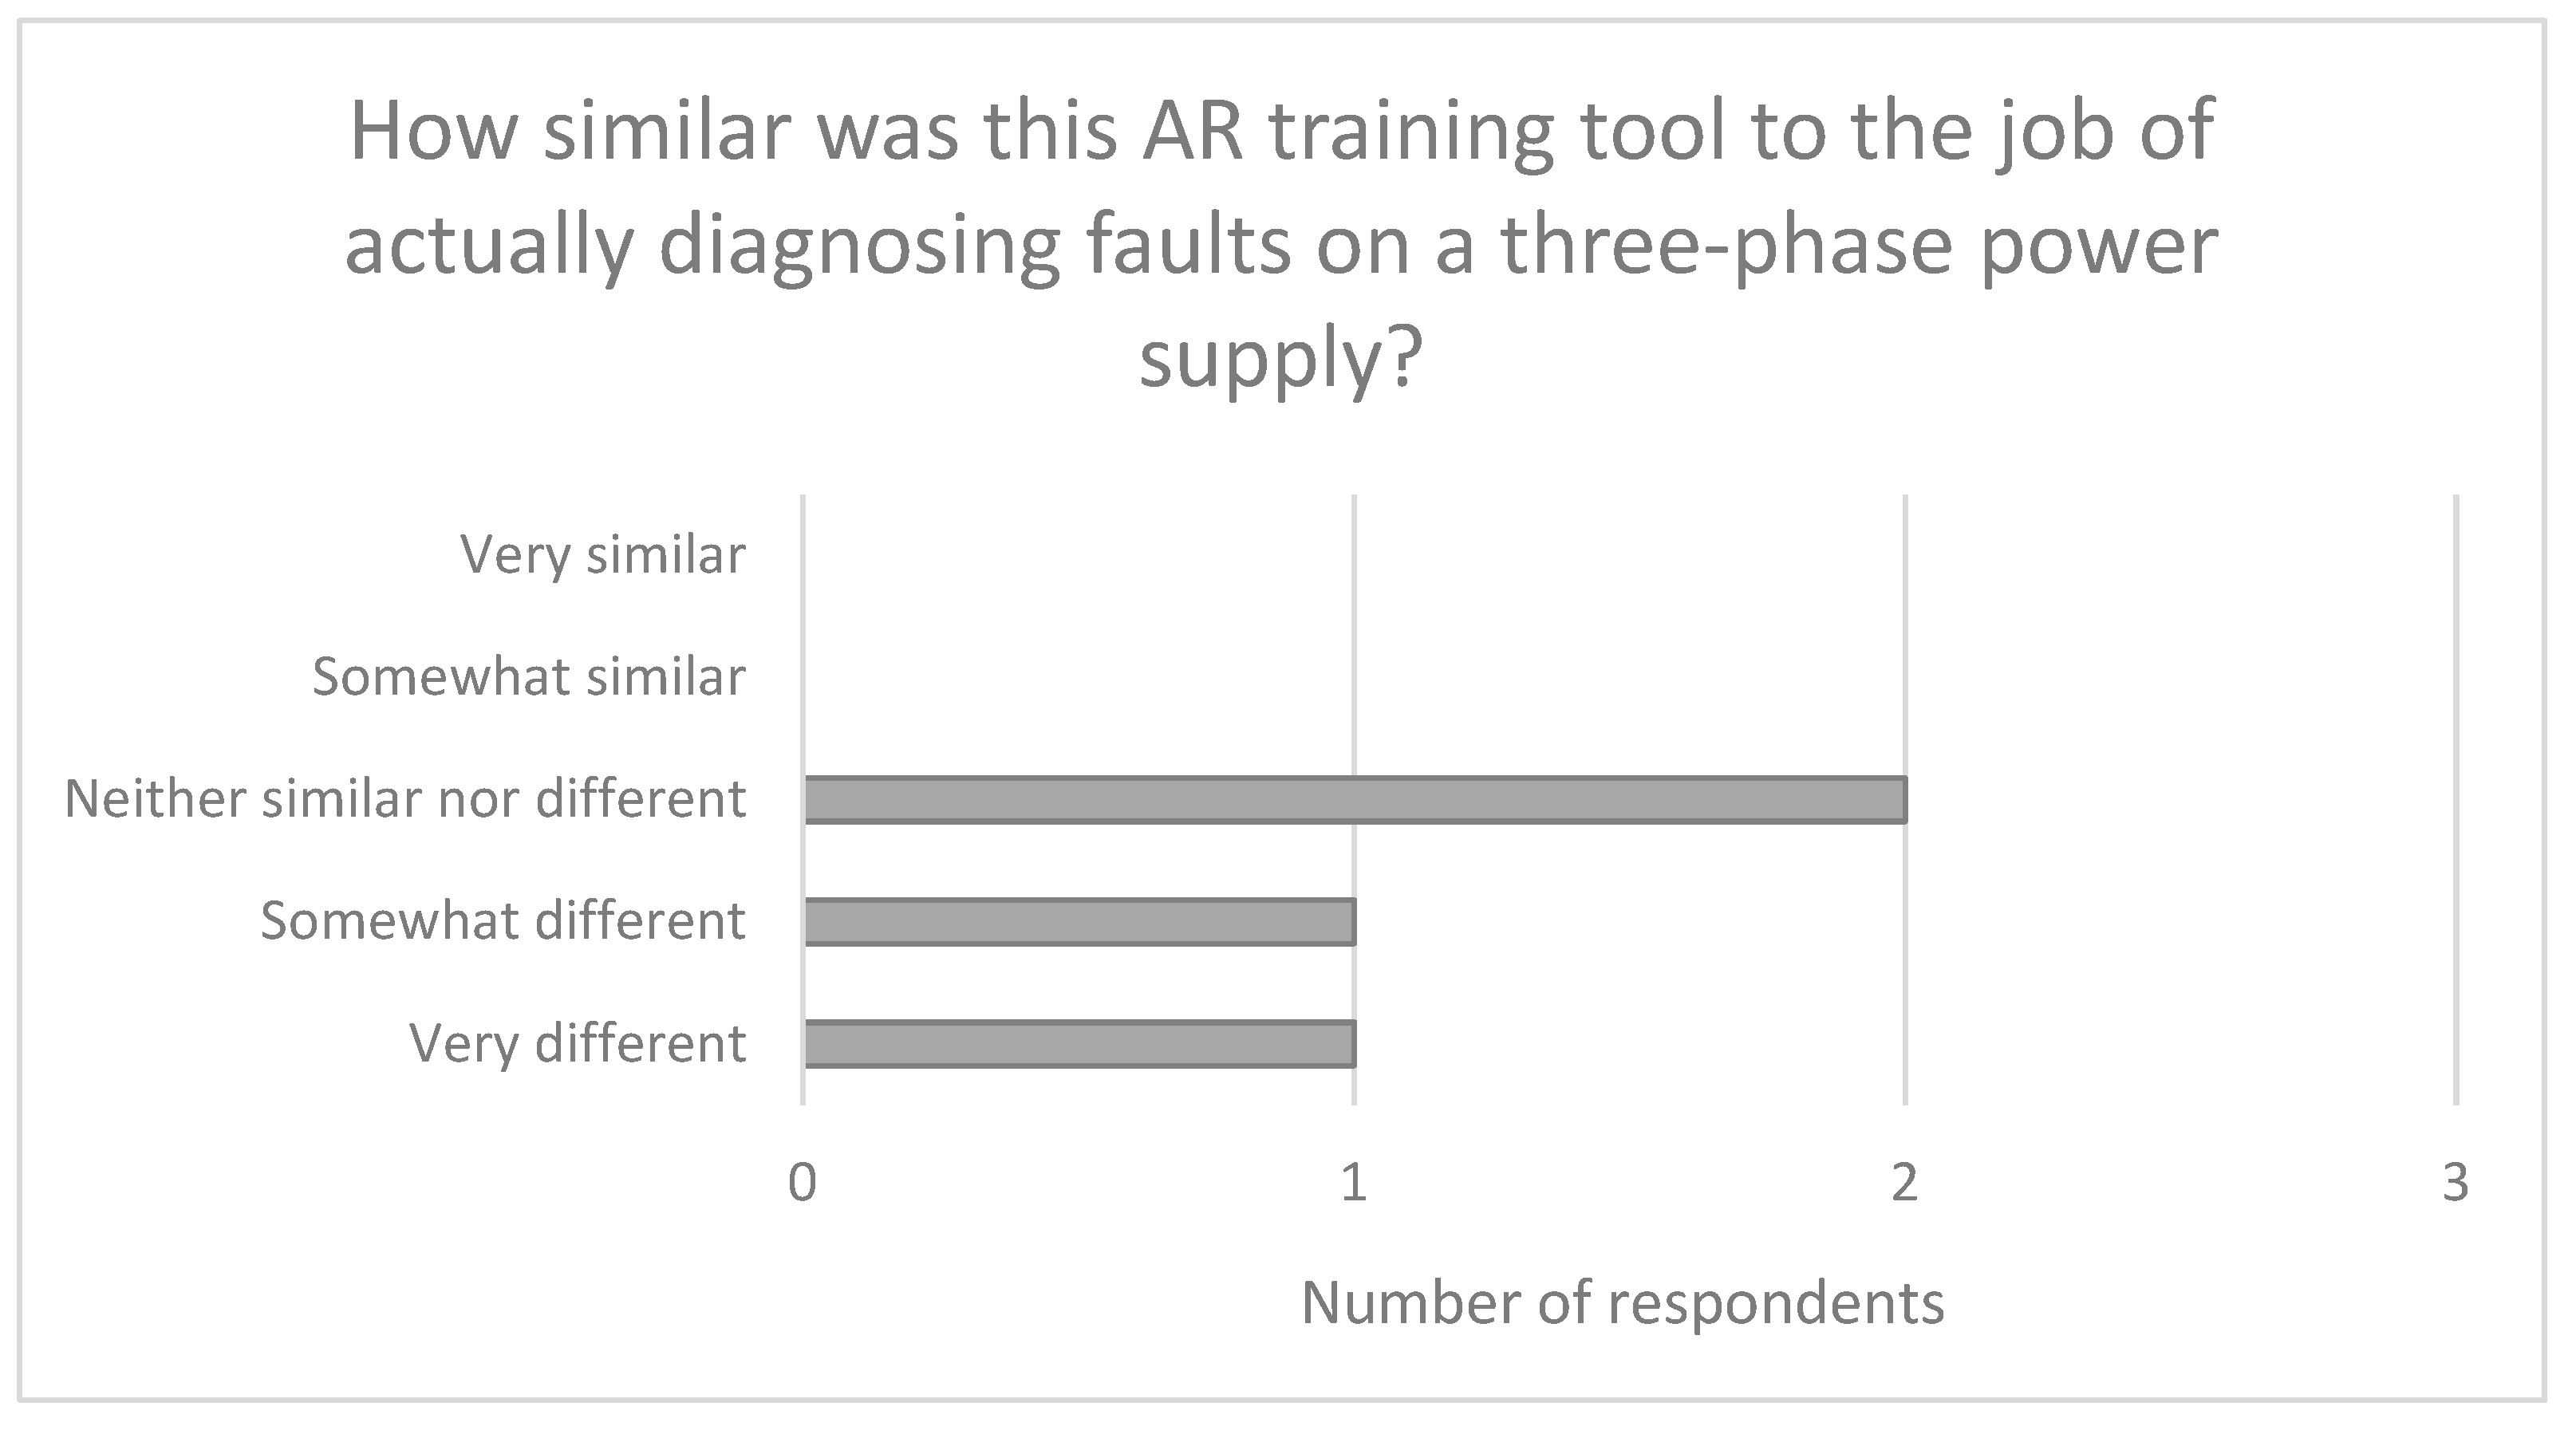
“Expert” participants were also asked to rate the similarity of this simulated task to the real version. The results shown in
Figure 11 suggest that it was a somewhat different experience.
Finally, all respondents were given the opportunity to give freeform comments on how they found the task and any suggestions for the future. From the “expert” user group only one comment was left (
Table 5).
From the non-expert group, several comments were left, which can be summarised in three broad categories (
Table 6):
User interface difficulties (2)—e.g., pointer, options to go back a step;
Instructions/tutorial could be improved (3)—confirmation of input, tutorial to practice;
Device specific issues (4)—flickering screen, display errors, phone obstructs view.
4. Discussion
This study presented a mixed reality training tool, with the aim of using digital methods to supplement traditional teaching of vocational education. The motivation for this was to fill the chronic skills gap present in the UK engineering industry, in particular in the offshore wind sector. As a proof of concept, a common task in offshore wind maintenance using a three-phase power supply was selected as an example, and an MR web application and printed diagram of the equipment were used to simulate the process of fault diagnosis. The tool was tested by comparing user performance, measured via four different metrics, amongst those who were experienced at the diagnostic task and those who had no background in electrical engineering at all and were guided by additional MR content. By comparing performance between these two groups, we were able to draw conclusions about whether or not MR guidance can be used to upskill novice workers at tasks critical to the offshore wind industry.
While the results presented in
Section 3 certainly suggest that mixed reality training of this kind could be a beneficial tool, caution must be applied when interpreting these results. Due to COVID-19 restrictions during the research period, no direct comparison could be made to an actual physical version of the task; therefore, questions could be raised as to whether either of the virtual scenarios was truly representative of the industrial environment.
The mean task time was 65% faster for guided non-experts, but only at a confidence level of 90% as opposed to the more desirable standard of a 95% confidence level. As these experiments took place independently in the participants’ homes, without supervision by the researcher, certain anomalies were present in the data. For example, participant ID 467 was disregarded from the analysis due to having exceptionally long gaps (over 1 h, when most took less than 15 min to complete the entire task) between steps. Without having observed the experiment, it is impossible to say whether this was an issue with the application, a home internet failure or any number of other distractions in the user’s personal life. In this case, the time gaps were so extraordinarily long that it seems safe to assume that some external issue came into play. However, in other responses recorded, shorter time gaps (2–3 min) occurred, and it is difficult to say if participants were genuinely taking so long to complete the step or if some other factor had come into play. This is a known issue and one of the main drawbacks of carrying out remote virtual research [
28]. In the analysis, these gaps were treated as pertinent to the research. However, this cannot be known for sure, so when restrictions on in-person studies are more lenient, it may be beneficial to repeat this study under observation of the researcher. Given the uncertainty in measurement of the results, discussed below, this is not ideal but indicates potential and makes the case for further investigation when in-person studies are permitted and reliability of the measured variables can be improved.
The percentage of faults correctly diagnosed saw similar results, with a 79% improvement in accuracy seen in guided non-expert users, but only an 85% significance level. Again, this is much less than the preferred value of 95%, so it should not be considered significant based on the results of this study but may warrant further investigation with a larger sample size. Additionally, though guided non-experts performed better, neither group scored perfectly, with 58% accuracy in the non-expert group and just 30% in the expert group.
The NASA-TLX score was also calculated using survey results. Comparison of means suggested that the non-expert users found the task less taxing overall than the expert users. This is in agreement with Masood and Egger’s study [
26], which found a decrease in NASA-TLX scores when using wearable AR to assemble a gearbox, and confirms that the AR task guidance has potential to be a valuable tool in training and familiarising new users with electrical systems. However, a two-sample t-test revealed that the differences found between expert and non-expert groups had limited statistical significance for the number of observations taken and for the NASA-TLX scores. This may be representative of a lack of effectiveness of the application, but it may also be the result of a limited sample size, making it difficult to robustly detect smaller differences in the data. Therefore, we would strongly recommend that future investigations into this technology aim to recruit a larger sample size than the 19 participants considered in this study.
A learning effect of sorts can be noted, as users appeared to make diagnoses faster during their fourth sub-task than in their first. This was especially true in the “non-expert” user group. However, accuracy decreased in the latter attempt, suggesting a fundamental lack of understanding of how the application worked, particularly in the case of the “expert” users using the app without additional guidance. This cannot be known for certain, as the study was carried out remotely in the users’ homes, so no visual observations could be made—another limitation of the remote experimental approach. This sense of confusion over how to operate the app was confirmed by the qualitative feedback, where one-third of the feedback remarked upon the instructions/tutorial given at the start of the study. Other key difficulties highlighted included some small inconsistencies in how the app was presented across different devices and some suggestions for how user interaction could be improved—no comments suggested the underlying idea or functioning of the app were problematic however.
To enable the application of these new technologies in learning environments, digital competence of teachers is a key success factor. After all, students cannot benefit from new technologies if teachers do not have the skills to support digital resources and experiences. Following a study of more than 750 teachers in Spain, Pozo-Sánchez et al. [
29] concluded that, while most teachers had adequate levels of information literacy, communication and collaboration, one of the areas in which they lacked skills was creation of digital content. However, digital literacy does appear to improve at later educational stages [
30], so it is likely that many educators working at an apprenticeship level may have better digital skills than their primary school counterparts. Nevertheless, to fully exploit the benefits which MR blended learning can offer, it is imperative that either a wide-reaching program to upskill educators with more digital skills is implemented or, more feasibly, that simple content authoring tools are developed to allow content creation with minimal coding experience.
One final limitation of the work presented here is that it does not measure long-term learning effects, only short-term ability to follow instructions. Therefore, we would recommend a similar experiment with added repetition, with and without AR instructions, to explore if MR tools achieve this result via true learning or simply by delivering more information to the user in the virtual instructions.
In conclusion, the results of this study initially seem promising, with improved average values across all metrics measured in the MR-guided, non-expert user group, as opposed to unguided expert users. However, deeper investigation suggests these results do not meet the standard threshold of 95% significance. Due to the methodological limitations, resulting largely from the remote nature of COVID-era research, we believe that these results warrant further investigation to determine if MR can indeed be a valuable alternative to in-person learning for trainees in the field of offshore wind. In addition, whilst we believe this technology has much value to add in the vocational learning space, we recommend that future studies should make comparisons to the users carrying out the task on real equipment to check the level of realism in the replication. We would also recommend using a larger sample size, such that smaller differences between groups can be reliably detected if they exist. Future studies should also include a focus on the long-term learning effect to see if MR users can put their learning into practice by repeating the task without guidance after a period of delay between learning and testing.
If these initial results hold true when deployed on a larger scale, however, MR remote training could be an excellent way to reduce pressure on scarce resources, such as training facilities and educators’ time. It would allow vocational learners to rehearse practical tasks in advance of accessing these resources and gain confidence and make the most of their in-person contact time. Of course, this is of particular relevance during the COVID-19 crisis, when the resulting restrictions mean access to these facilities is even more limited than usual. However, even beyond this, there is significant value in these technologies, as they can increase the amount of time users can spend rehearsing and perfecting practical tasks or potentially reduce the amount of contact time required with low-availability training facilities. This in turn has potential to mitigate the impacts of the pandemic or possible future disruptions to the learning process on the significant skills gap facing the offshore wind industry. Another possible extension of the concept presented here could be to link the simulated task to a recorded data stream from a turbine’s digital twin and thus enable project-based learning using real asset data. This would further enhance the trainees’ experience by allowing them to demonstrate their skills with a real industrial problem in a convenient and low-risk environment.


 ,
, 


