Article

Digitalisation for Water Sustainability: Barriers to Implementing Circular Economy in Smart Water Management

1
College of Engineering, Mathematics and Physical Sciences, University of Exeter, Exeter EX4 4QF, UK
2
Ecological Environment Promotion Centre, Ecology and Environment Bureau, Wenzhou 325000, China
3
Group of Sustainability, School of Management, Cranfield University, Cranfield MK43 0AL, UK
*
Authors to whom correspondence should be addressed.
Sustainability 2021, 13(21), 11868; https://doi.org/10.3390/su132111868
Submission received: 1 September 2021 / Revised: 7 October 2021 / Accepted: 20 October 2021 / Published: 27 October 2021
(This article belongs to the Special Issue Industry 4.0 Technologies for Global Challenges)

Abstract

:
“Clean water and sanitation” is listed as one of the 17 United Nations’ Sustainable Development Goals and implementing circular economy principles in the water sector has been widely regarded as an important approach in achieving this goal. In the era of Industry 4.0, research and practice in the digitalisation of the water sector to create a smart water system have attracted increasing attention. Despite the growing interest, limited research has been devoted to how digital technologies might enhance circularity. In practice, smart water systems often fail to promote circularity in such aspects as water reuse and resources recovery. This paper aims to identify the main barriers to implementing circularity in the smart water management system in Zhejiang, China. The research adopts a mixed research method that includes a literature review to identify the potential barriers from the existing studies, a case study to determine the most critical barriers in practice, and a fuzzy Delphi method to reach a consensus on the crucial barriers. The research identified 22 main barriers to implementing circular economy in smart water management. The barriers are divided into three categories: infrastructure and economic, technology, and institution and governance. The results show that the barriers related to recycling technologies, digital technology know-how, and the lack of CE awareness raise the most concern. Our findings also indicate that experts are interested in the decentralized wastewater treatment system. This research provides significant insights that practitioners, researchers, and policymakers can use in developing and implementing digital-based CE strategies to reduce water scarcity and pollution.

1. Introduction

Human-based activities have disrupted the natural hydrological cycle of water circulation over recent centuries. Increases in population, agriculture activities and urbanization have intensified the threat of global water scarcity [1]. The process has been particularly marked over the past few decades. The global population facing the threat of water scarcity has grown from 14% in the 1900s to 58% in the 2000s, while more than 2 billion people live under excess water stress [2,3]. Since water is vital for the survival of humans, animals, and plants, and is a vital substance for social and economic activity, the lack of freshwater will not only hinder urbanization but can result in a humanitarian crisis in the long run [4,5]. Goal 6 of the United Nations’ (UN) 17 Sustainable Development Goals (SDG) calls for ensuring sustainable water supplies are universally available. The UN regards this as water accessibility, integrated management of water resources, pollution control, resource efficiency and natural resource restoration [3].
The water development report from the United Nations Educational Scientific Cultural Organization [6] suggests that safe water reuse, or reclaimed water, is a reliable unconventional water resource in the face of water scarcity and climate change. Additionally, reusing wastewater and its constituents can reduce greenhouse gas emissions.
This emphasis has encouraged the discussion about the potential of adopting the emerging CE concept to achieve the economic and environmental goals in SDG 6, through reusing water and recovering nutrients and energy from the sludge [1,7]. As proven in other industries, CE practices often support SDG enhancing waste recycling, reducing waste generation, and encouraging material circulation [8].
The CE concept involves building a regenerative system that minimizes resource consumption, waste generation, emissions, and energy leakage by keeping products and materials in a closed ‘take-make-use’ loop. Scrapped products are used to generate new materials at the ‘end-of-life’ [9,10]. It has become a prominent focus for both European and Chinese policymakers to improve resource efficiency. China’s CE policies generally aim to tackle environmental challenges and pollution, while European regulations focus on reducing waste and enhancing resources [11].
Inspired by the digital transformation in the manufacturing industry, also known as Industry 4.0, attention has recently turned towards using digital technologies (DT) in the water and wastewater sector. The focus is to build a sustainable smart water management system that helps to reduce leakage, ensure water quality and optimize operation, among other aspects [12]. Real-time river water quality, in-pipe water quality, hydrometeorological and flood data, and water demand data in commercial buildings can all be monitored using Internet of Things (IoT) technologies [13,14,15,16]. A number of countries around the world have invested heavily in developing digitalized water management systems. Wuxi, Shenzhen and Shanghai in China, for example, have updated their water management system and built an information technology infrastructure to manage water [17].
Previous research shows that using DT has the potential to promote CE and improve sustainable performances. For example, the Ellen MacArthur Foundation [18] discussed the potential of using information and communication technologies to achieve circularity in the production process. Dantas, et al. [19] showed that the CE-Industry 4.0 nexus is directly beneficial for SDG 7-affordable and clean energy, SDG 11-sustainable cities and communities, SDG 12-responsible consumption and production, and SDG 13-climate action. As for the water sector, Mbavarira and Grimm [1] argue that building a smart water management system can be a starting point for CE practices such as reducing resource consumption.
The practical achievement in using DT to improve water reuse and recycling is still not common. As an example of what happens in practice, we can take the case of Zhejiang, a province located in the south-eastern area of China. As an early adopter of DT for urban water management in the country, the city succeeded in using it to greatly improve the efficiency of water pollution inspection and prevention. However, water reuse and recycling are neglected during the system implementation. There are many barriers to increasing circularity in this field, which are not well understood.
Researchers have studied the barriers to implementing CE practices in the water sector. Mbavarira and Grimm [1] identified the most noticeable barrier in the EU was the lack of financial resources and legislation support. Kakwani and Kalbar [20] discussed the challenges in India and proposed 19 main challenges in the technological, economic, institutional and governance, and social aspects.
There are also a few studies that discussed the barriers to utilizing DT in urban water management. Eggimann, et al. [21] suggested three specific challenges in the water sector. They are data access and ownership, changing current practices, and the difficulty of assessing the cost and benefits. Adedeji, et al. [22] presented an IoT application for monitoring water quality and leakage, then listed eight barriers hindering it, for example, power usage and technology coverage.
However, the research about the barriers to using DT to support CE implementation in the water sector is still limited. Furthermore, the barriers to DT in urban water management has not been identified through quantified studies. Moreover, each region has its own economic, environmental and social characteristics, so the identified barriers in other regions may not be applicable to Zhejiang.
This study, therefore, aims to identify the main barriers to implementing CE in smart water management, using Zhejiang’s experience as a use case, and adopting the fuzzy Delphi method (FDM) to fill in the gaps in a systematic manner. We conducted a case study to collect comprehensive information of the investigated context for identifying barriers. Then, we used FDM to collect and analyze experts’ views to identify the most critical barriers and eliminate the avoidable barriers. This method can effectively identify the most critical, de-biased barriers without past data, by generating a consensus within a group of experts from various backgrounds [23,24,25].
The remainder of the manuscript contains five parts: Section 2 describes the conceptual background and proposes a list of barriers based on literature review; Section 3 explains the research methodology employed in the research; Section 4 presents the survey and data analysis results of the FDM; Section 5 discusses the implications which follow from the data; Section 6 is the conclusion.

2. Conceptual Background

This section reviews the implementation of DT (e.g., IoT, big data) and CE in the water and wastewater sector and proposes the barriers identified in the literature that leads to poor performance of CE implementation in smart water management.

2.1. Sustainable Urban Water Management

An urban water system involves the fields of water supply, urban drainage, and wastewater system [26]. The urban wastewater system includes the sewer system, wastewater treatment plant, as well as the water body, such as a river, that receives the discharge from sewer and treats water [27]. Urban wastewater is a mixture of water and substances generated by household, industrial activities, and rainwater outflow. Apart from water reuse, the substances also have various possibilities to be reused. For example, recovered ammonium can produce fertilizer and processed sludge can generate energy [28,29].
The increasing global changes, such as rapid population growth and climate change, are raising the need to change the unsustainable factors in conventional urban water management. According to the United Nations, the global population will need three times of the earth’s resources by 2050. Meanwhile, water pollutions are faster than nature recycle can purify [30]. Additionally, water reclamation technologies are advanced enough to produce water of various qualities for non-potable and potable use [31]. Therefore, the United Nations has specified 17 sustainable development goals to achieve by 2030. Urban water management is strongly linked to the SDG 6 “clean water and sanitation for all”.
The sustainable urban water management concept has a longer history. It has been discussed and developed since the 1980s, in reflection to the growing concerns over healthy co-evaluation between society, environment, and economy. It considers the whole urban water cycle to develop an efficient, flexible, and stable urban water system. Vairavamoorthy, et al. [5] suggested that it should cover water supply, water usage and reuse, sanitation, and storm water management. Marlow, et al. [32] reviewed this paradigm and defined it as an integrated approach to water supply, sewerage, and stormwater management that delivers appropriate water usage for sustainability improvement. The frequently discussed benefits of sustainable urban water management are threefold: (1) it mitigates flood risk while supporting healthy ecosystems; (2) it improves water security with alternative water sources, such as rainwater harvesting, water recycling and sewer mining and (3) it promotes resource efficiency and resource recovery.
The shift towards sustainable solutions in urban water management is interdisciplinary. Research, policy, and practices have been exploring solutions, for example, water reuse, source separation, multiple-time water usage, and decentralized wastewater treatment infrastructure [5,33]. This includes both technical and social innovations. New technologies for wastewater recycling, stormwater collection technologies can expand the choices. Policy on water pricing, quality can reinforce the usage. People as water users in the domestic setting, industry, and agriculture are also important factors in the urban water system [34].

2.2. The Relationship between Circular Economy and Sustainability in the Water and Waste Water Sector

This subset relationship between CE and sustainable development can be found in literature across multiple industries. The CE research addresses some aspects of economic and environmental issues, often through enhancing waste recycling, reducing waste generation, and encouraging material circulation. However, the CE concept puts the social aspect of sustainability in a minor position [8]. It can be seen as a tool to achieve some SDGs. It means that SDGs establish goals to solve non-sustainable problems, whereas CE addresses some causes of these problems [35]. Municipal management is a fundamental player in the CE transformation in reducing waste and pollution by putting waste back to the production process [36]. Because of the emphasis on resource restoration and regeneration, CE can directly support the achievement of certain SDGs, such as sustainable consumption patterns, energy, climate change [30]. The SDG 6 “clean water and sanitation for all” can also receive direct and indirect support from CE [30,35].
This subset relationship can be found in the water and wastewater sector as well. Although sustainable urban water management involves a wide range of research fields, resource efficiency and resource reuse remain important topics in the discussion. Research suggested that water, energy, and nutrients should be recovered from wastewater, as an addition to balancing services and resource efficiency [30]. This is also recognized as “closing the loop” in literature [5,33], representing a key concept of the CE paradigm.
In other words, the CE paradigm can improve a specific aspect of sustainable urban water management, i.e., the resource restoration and regeneration aspect. It emphasizes wastewater and sludges, requiring management and technical transformation at the end-of-life stage of water usage. Apart from research, decision-makers are also found shifting from sustainable urban water management towards incorporating it with the evolving CE paradigm in the 21st century [30]. This trend could be driven by the increasing interest in CE, after China and the EU have introduced CE policies in 2002 and 2015 [8].

2.3. Circular Economy in the Water and Wastewater Sector

The reuse and recycling of wastewater and sludge lie at the center of CE transformation to improve the water supply [37]. In order to highlight the importance of water reuse and raw material recovery in the water and wastewater sector, Smol, et al. [38] proposed a new CE framework for this sector to clarify the actions needed to be taken in technological, organizational, and societal aspects. Their framework includes the following six actions:
  • Reduction—reducing water usage, wastewater generation and pollution.
  • Reclamation (removal)—removing pollutants from water and wastewater with effective technologies.
  • Reuse—reusing wastewater for non-potable usage.
  • Recycle—recycling water and recovering it for potable usage from wastewater.
  • Recovery—recovering resources, such as extracting nutrients and generating energy from sludge.
  • Rethink—rethinking how to use resources sustainability without producing waste and emissions.
This regenerative mindset leads to various research, including decentralized wastewater management, wastewater reuse applications, and tertiary treatment technologies [39,40]. To date, centralized water reuse is more common than decentralized reuse in urban areas, where reclaimed water from a centralized wastewater treatment plant can be used for non-potable purposes such as irrigation [41]. In a centralized system, wastewater from the city is collected through the sewer system, often mixed with municipal wastewater, rainwater, and industrial wastewater with high concentrations of contaminants [42]. In comparison, a decentralized sanitation system is mainly used in peri-urban development clusters, as it is much smaller and less expensive to treat and recycle water at or near the sources, which is suitable as a local solution for water sustainability [43].
Apart from reusing the wastewater, researchers and practitioners have been exploring new ways to regenerate resources and energy from the wastewater sludge. Turning sewage sludge into raw material can ease the stress of sludge treatment and disposal. The benefit of circular sludge management is win-win, as it replaces the non-renewable resources with recovered resources for material and energy generation and reduces sludge disposal and landfilling. Recently, Gherghel, et al. [44] summarized the technologies used to recover resources and energy from sludge in a review on wastewater sludge with regards to the CE. This review points out the potentials and available processes to retrieve valuable resources, including nutrients (e.g., phosphorus, proteins), heavy metals, sewage sludge-based adsorbents, construction materials, bioplastics, and enzymes. In addition to resource recovery, wastewater treatment plants can also recover energy from sludge by generating biogas, biofuels, bio-oils, and microbial fuel cells, which can be used for electricity production [45].

2.4. Digital Technologies Implementation in the Water and Wastewater Sector

In the era of Industry 4.0, the disruptive DT are greatly influencing the industrial activities, including the water and wastewater sector. Smart water management, also known as the smart water system or smart water network, incorporates IoT, big data, and other technologies into urban water management. It applies sensor monitoring, real-time data transmitting, real-time remote controlling, and machine learning-based processes to reduce water consumption, detect leakage, assure water quality, along with other functions that lead to sustainable and self-sufficient water exploitation [12,46,47]. The smart monitoring system of water quality is an important part of smart water management. It can support functions like real-time water condition monitoring, quick-change identification, early warning of hazards, and system security improvement [48]. Other functions like automation and control can also support different approaches to providing efficient, stable, and environment-friendly water services [33].
IoT and big data have been regarded as one of the promising tools to improve environmental sustainability and promote CE [49,50]. IoT has been applied for environmental monitoring in farming, domestic waste treatment, air quality, and urban CO2 [51]. Kong, et al. [52] have reviewed the major applications of big data in urban sustainability and identified that this technology is mainly applied in resource and environment-related areas, such as urban land use and planning, resources and energy utilization, and environmental sustainability. Mendoza-Cano, et al. [15] proposed an IoT-based wireless sensor network to collect real-time data for flood monitoring. Smart water management is expected to solve sustainability challenges such as water overuse, flood and drought, and pollution [17].
A number of countries around the world have invested heavily in developing digitalized water management systems. Wuxi, Shenzhen and Shanghai in China, for example, have updated their water management system and built an information technology infrastructure to manage water. IBM has built a real-time sensing and online monitoring system for the Hudson River in the U.S. [17]. Researchers and practitioners have, for this purpose, been exploring cost-effective solutions which employ digitalization in the water and wastewater sector. The sludge wastewater treatment process, for example, can be monitored by digital image processing [53]. IoT monitoring can be applied in various scenarios, including real-time river water quality, in-pipe water quality, hydrometeorological and flood data, and water demand data in commercial buildings [13,14,15,16].

2.5. Digital Technologies for Circular Economy in Water Sector

Similarly, smart water management also has the potential for supporting CE practices in the water sector. Qu Wang, et al. [45] proposed a new concept of the wastewater treatment plant that recovers water, energy, and fertilizer to solve water shortage and sludge pollution challenges. Abdul-Hamid, et al. [54] discussed several IoT technologies and systems for controlling water pollution. Eggimann, et al. [21] reviewed novel approaches to improve network efficiency, some of which are aligned with the CE paradigm. For example, monitoring pipe conditions can automatically detect leakage, hence reducing water loss. Another example is the real time and detailed monitoring and controlling of reclaimed water quality. This assessment is vital for managing the risk of water reuse to human and environmental health.
Despite the growing amount of literature on topics on smart water management, relatively limited research has been devoted to how to exploit DT to enhance wastewater and sludge circularity in the water sector. In practice, smart water systems often fail to support the circularity aspects in urban water management. Our study attempts to address this gap and focuses on studying the main barriers to implementing circularity in the smart water management system.

2.6. Identified Barriers in Literature

Since there is little research on implementing CE in the smart water management system, we reviewed the literature on barriers from the following aspects: the CE uptake in the water sector, the smart water or urban management implementation, and CE implementation through DT in other sectors. We then identified 58 barriers in the literature (see Appendix A).
Researchers have discussed the barriers to CE implementation in the waster sector. Mbavarira and Grimm [1] carried out expert interviews and case studies on the CE in the EU, and suggested that digitalization, water reuse, and resource recovery can reinforce circularity in water. They identified barriers that slow down the water reuse and nutrient recovery in the EU. The most significant one is the lack of financial resources and legislation to support implementing CE in the water sector. It was followed by the limited awareness of the benefits, public perception, health concerns, and marketability. Kakwani and Kalbar [20] investigated the situation in India and proposed 19 barriers in the technological, economic, institutional and governance, and social aspects. They include the lack of technology readiness, high technology and energy costs for the wastewater treatment, lack of experienced manpower, lack of promoting or supporting policies, lack of awareness about the water scarcity and the CE, and low public acceptance of water reuse.
There are also a few studies on the barriers to using DT for smart water management or general city management. Rana, et al. [55], for example, employed the fuzzy analytic hierarchy process technique and identified 31 barriers to developing smart cities in India. They identified that the most significant category was the government, followed by economic, technology, social, environmental, and lastly, the legal and ethical category. Addae, et al. [56] used a two-step fuzzy DEMATEL approach to analyze the smart energy city adoption barriers in Accra. In their results, the barriers related to market, technology, and policy were identified as the fundamental barriers which cause other barriers. They also suggested some barriers that require more attention in Accra: limited access to capital, high cost of technology, high-interest rate and unstable currency, inadequate infrastructure requiring huge investments, insufficient legal and regulatory framework, high cost of technology, and the lack of information about cost and benefits of renewable energy technology.
The barriers to implementing CE through DT have been explored in several industries, but not much in the water sector. Demestichas and Daskalakis [57] conducted an extensive literature review on the solution ICT system that supports the transition towards CE. As a part of the study, they listed the most prominent challenges in the literature of adopting these solutions for the CE: consumer and business attitude, economic costs, potential environmental impact, lack of CE education, and lack of familiarization with technologies. Abdul-Hamid, et al. [54] identified 18 essential challenges in using Industry 4.0 technologies for CE in the Malaysia palm oil industry by applying FDM. The most important ones were the lack of automation system virtualization, the unclear economic benefit of digital investment, lack of process design, unstable connectivity among firms, and employment disruptions. As for the implementation of Industry 4.0 and CE in the agriculture supply chain in India, Kumar, et al. [58] determined 11 barriers through an integrated interpretive structural modelling-analytic network process approach, among which the lack of government support and encouragements, the lack of policies and protocols, and the lack of awareness were the most significant ones.

3. Method

In order to investigate the main barriers to implementing CE in the smart water management system, we carried out three research methods across three phases, as shown in Figure 1. In the first phase, we reviewed the existing literature of related studies. We identified eleven key papers from over 200 papers discussing barriers to CE or DT implementation. Then we identified 58 initial barriers from these papers, as described in Section 2.6. However, some of these barriers in literature are not closely related to the water sector or are not applicable in practice.
We validated these initial barriers through case study in the second phase, as explained in Section 3.1. The purpose is to verify the identified barriers in literature and understand them in practice. During the case study, we conducted a semi-structured interview with the municipal official in the Municipal Ecology and Environment Department in Wenzhou city, Zhejiang province. We also collected secondary data about the smart water management system and CE implementation situation in practices. To do so, we analyzed government and industrial reports, regional regulations and policies on water and wastewater management in Zhejiang, and local water sector database. These materials were provided by the local government (about 300 pages). Additional information was collected from online databases, such as websites, news, and reports. Based on the case study, we identified 40 barriers that are relevant to implementing CE in the smart water management system. The selected barriers were clearly defined and explained with examples to better understand the survey participants. We consulted the interviewed expert again to validate the chosen barriers and their descriptions. Based on the feedback, we added two more barriers to the list. At the end of the case study phase, we identified 42 barriers. We also defined all of them based on the CE framework in the water sector and the smart water management status in Wenzhou.
In the third phase, we adopted the FDM to finalize and rank the essential barriers to implementing CE in smart water management in the context of Zhejiang. We used the 42 identified barriers to design a survey, asking experts’ evaluation on the importance of each barrier (details see Section 3.2). We received 21 survey responses from water scientists, government officials, technicians, and managers in the water sector in Zhejiang. Then, we computed the linguistic evaluation into quantitative scores, computed the algorithm, and extracted a ranking of barrier importance. The computation results of FDM are discussed in Section 4.

3.1. Case Study

The continuous growth in population, economy, and urbanization in China has increased the water demand. It exaggerates water shortage and generates a larger amount of wastewater and sludge [45]. Therefore, in the past decades, China has been fighting against water pollution by imposing strict restrictions on wastewater generation, discharge, and treatment [59]. By the end of 2018, over 5000 municipal wastewater treatment plants were built in China, providing a total capacity to treat over 90% of the wastewater. Meanwhile, only a limited amount of water was recycled and reused as low-quality landscape water. Additionally, the wastewater management practices in China overlooked the importance of resource recovery from the sludge, discarding it without removing the pollutant within [45].
Another development focus in China is the digital transformation. In our case, the city Wenzhou in Zhejiang province, as shown in Figure 2, has developed a smart water management system because the government is promoting digital transformation in urban management. This smart water management incorporates IoT and big data technology for pollution monitoring, historical data analysis, and government database integration. It supports government function by improving the efficiency of water pollution inspection and prevention, which has improved the wastewater discharge and water pollution problem in Wenzhou.
Compared to the advanced technology transformation progress, the CE concept is still at an early stage in Zhejiang but has become increasingly important. This province’s water environment improvement strategy mainly focuses on reducing pollution, improving wastewater discharge and collection networks, and upgrading the wastewater treatment plant. This leads to an unsatisfying water reclamation rate. For example, Wenzhou government aims to reach an 18% water reuse rate by 2022, from 15% in 2019. Existing practices are limited, which are mostly dependent on companies recycling industrial water. Reclaiming water for agriculture and domestic use is rare in this region due to the ample supply of natural water resources. In fact, landfilling, incineration, and land application or direct dumping was still the dominant way of sludge disposal in Zhejiang. Only a small amount of sludge was reused for building materials [60]. Reclaimed water was mainly used as landscape water, while nutrients or energy recovery was rarely implemented in Chinese wastewater treatment plants [45]. The local government and practitioners have been exploring the implementation of CE principles in their smart water management system in order to improve the circularity of water in the city. This study helps practitioners identify and analyze the main barriers of this implementation to help improve the water and resource reuse rate.

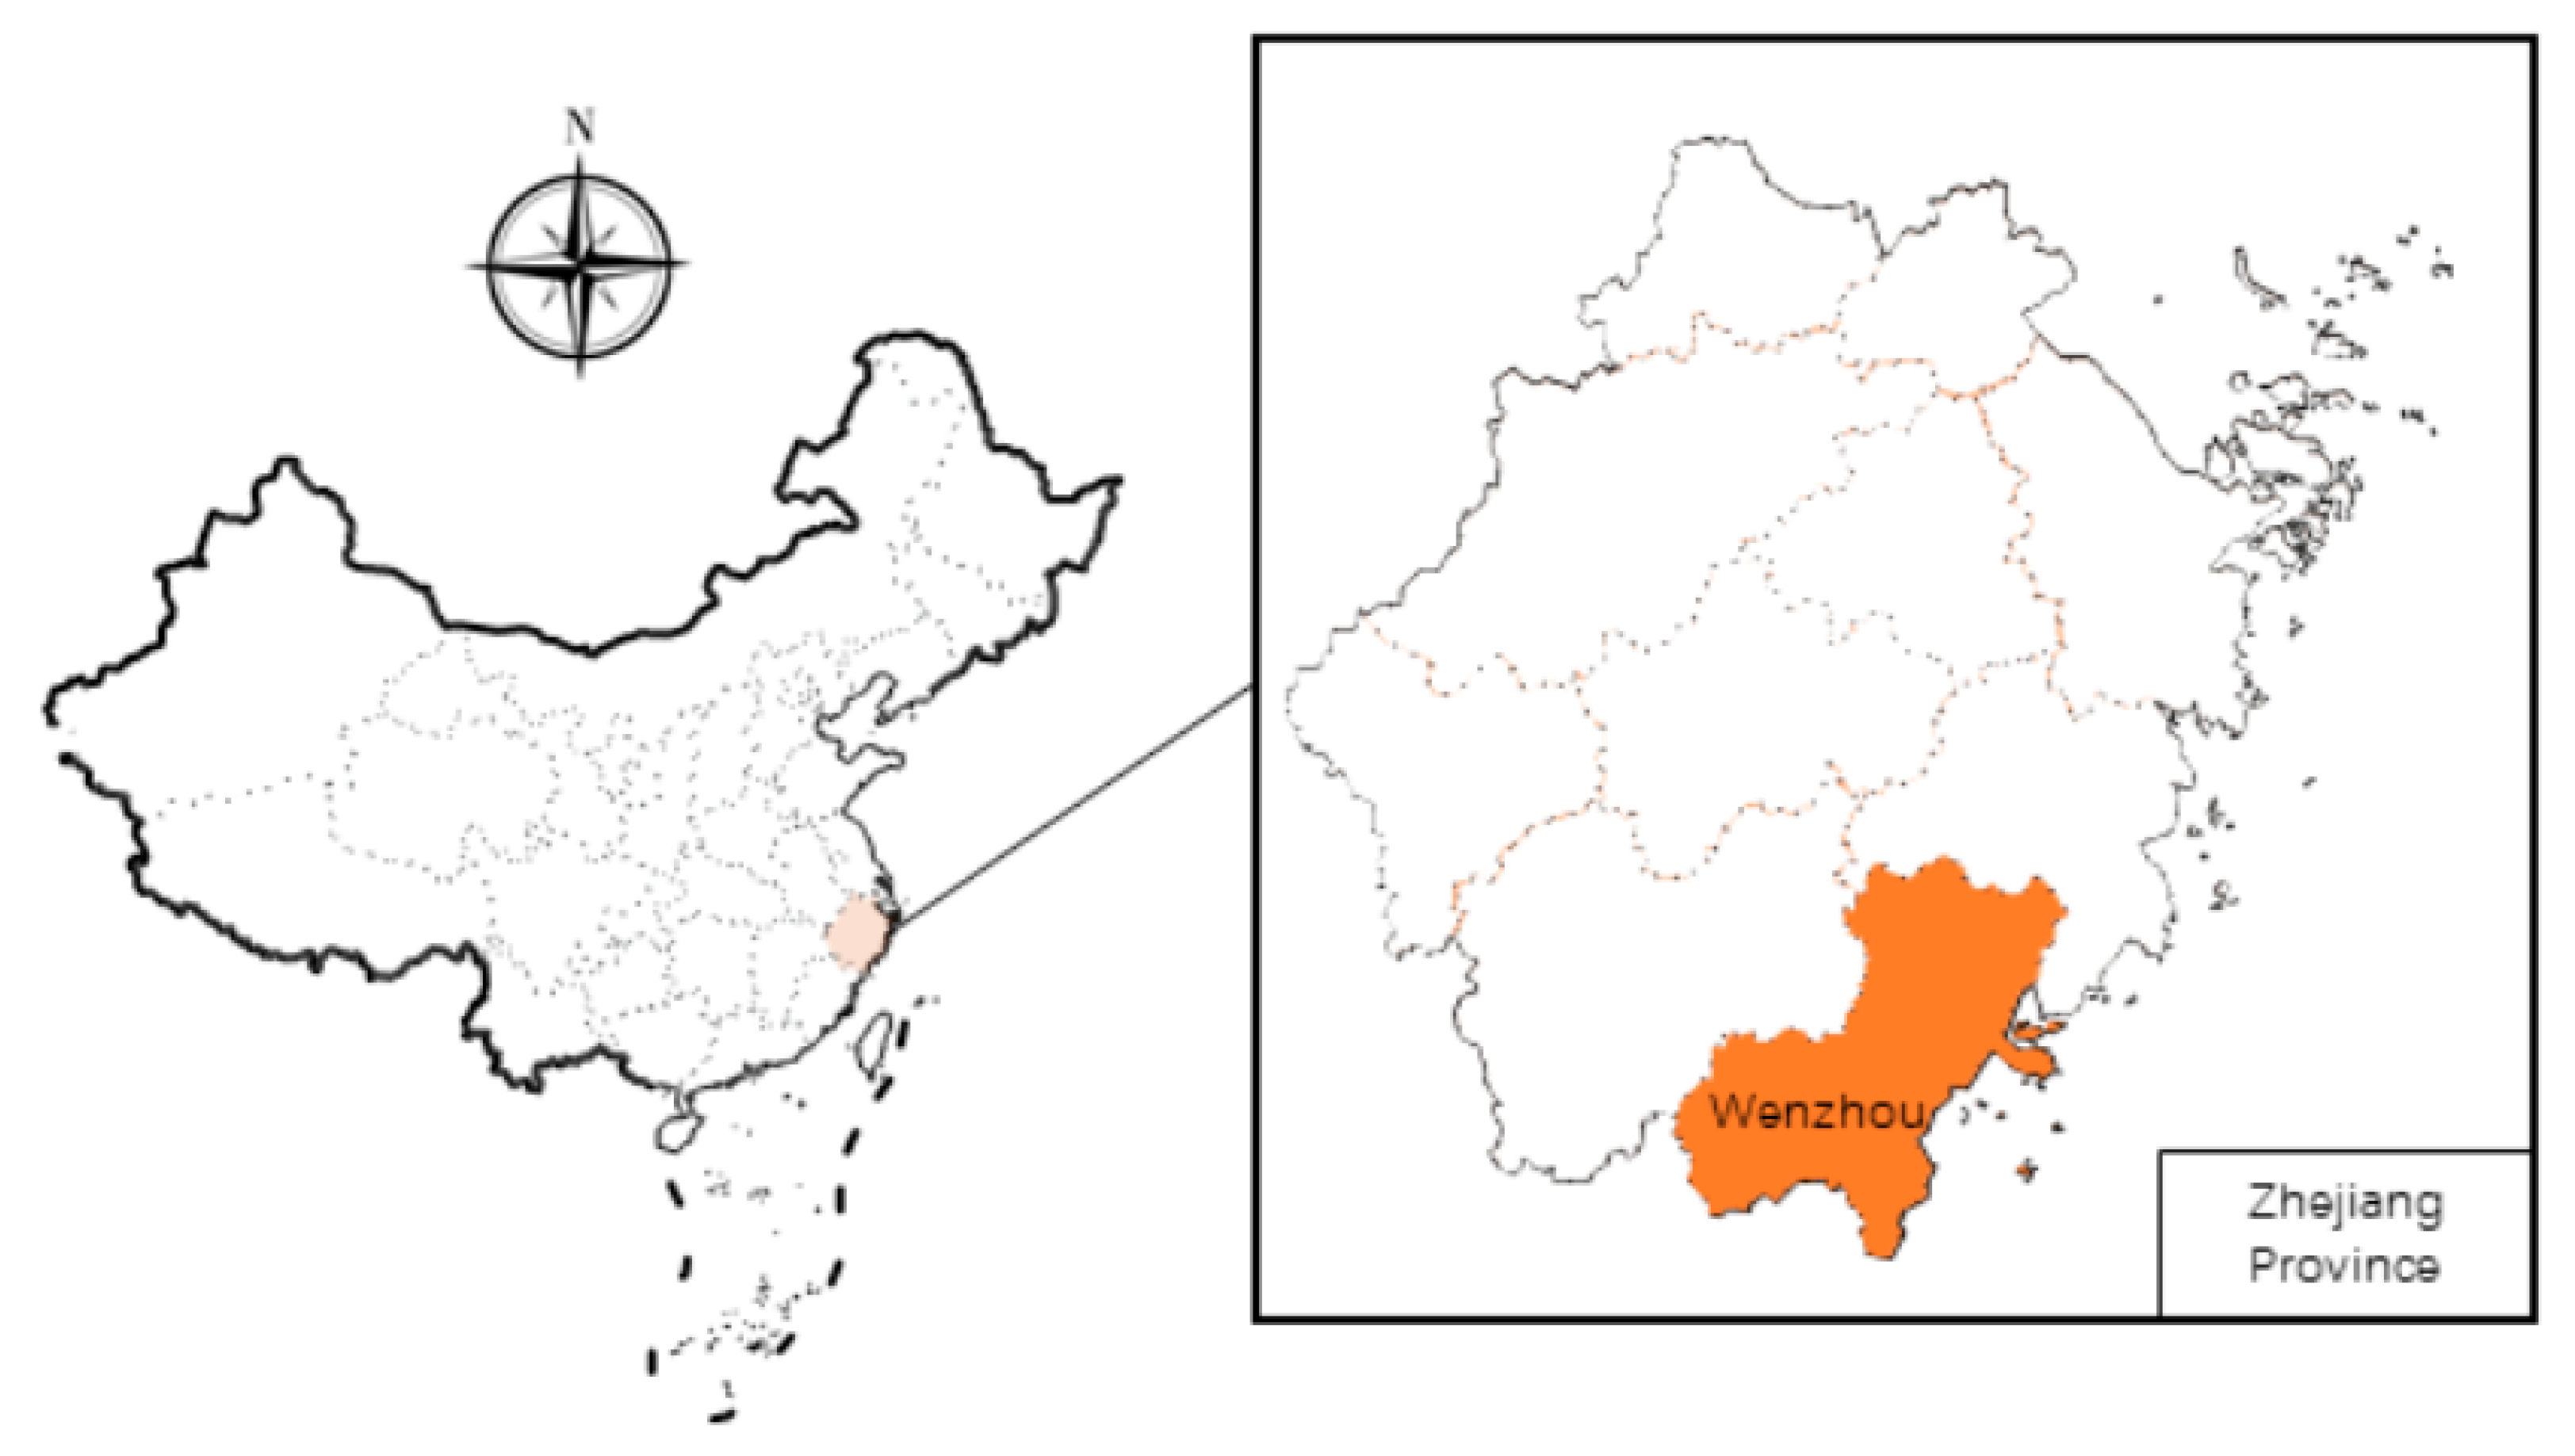
3.1.1. Case Description: Smart Water Management System in Wenzhou, Zhejiang Province

The water management system in Chinese government has two parallel structures. The Water Resources Department leads the resources management, while the Ecology and Environment Department is responsible for water environment management, such as water pollution prevention and control [61]. In our case, the latter is in charge of the implementation project of the smart water system. Therefore, this system was mainly applied in water environment control, such as water pollution control and wastewater treatment.
The Wenzhou government developed this smart water management platform in 2019 under the digitalization transformation campaign from the Zhejiang provincial government. It is designed as a part of the digital ecology and environment protection platform with a specific focus on water environment management. The system provides functions including automated data collection, data management, data analysis, decision-making support, and information sharing among different government departments and organizations. These functions support eight types of environmental protection services, such as mobile law enforcement, online monitoring, and administrative approval.
Smart water management provides a platform for the global integration of water-related data. The system integrated water-related data from six departments, including the municipal water control office, the ecology and environment department, the water resources department, and the planning department. It also included water resources databases, company registration databases, and meteorological data.
IoT, sensors, cloud computing, and GPS technologies support the data collection and exchange functions. Data is collected from 374 surface-water-environment monitoring stations, 273 online-monitored pollution sources, pinpointing 3610 key polluting enterprises, around 170,000 small companies with serious water pollution, and over 5000 key administrative approval projects. Additionally, the system integrates more than 70,000 mobile law enforcement records, about 20,000 pieces of enterprises involved administrative penalty cases, and 180,000 water-related petitions and complaints. As for data, this system could provide online data update as fast as every 15 min. The cross-departmental data is also updated regularly from once an hour to once a day.
This system’s “Cloud Manager” platform provides a clear visualization of the current status, historical data, and real-time updates of water in the city. For example, the river platform visualizes the overall status of 4484 rivers in the city, the pollutant composition in rivers, and a map of the urban pipeline network. Additionally, the law enforcement records and monitoring data about heavy pollution companies are automatically identified and displayed on this platform. The data analysis results are also visualized, such as pinpoint information, data charts, historical trends, and multiple-dimension data comparison.
The data analysis function is based on cloud computing and big data analysis technologies. For example, the traceability analysis reflects the river improvement by listing the pollution sources, public opinion, and analyzing monitoring data. The impact analysis function can demonstrate the impact of various factors on a specific location. Another analysis, the pin-point analysis, can identify the suspected key pollution sources in a selected contaminated location within a chosen radius. This has significantly reduced manual, on-site pollution investigation efforts. In terms of regional analysis, the platform can identify key areas that are under pollution complaints in the city. The system also includes other functions like pollution sources analysis, water quality monitoring analysis, and water environment analysis.
The platform has made sufficient improvement in local water quality management. The platform was implemented by the end of 2019. We collected data from January 2020 to September 2020 in comparison to the past data. With the help of this system, the water quality reached the best situation in the past years since the monitoring station establishment.
Specifically speaking, this system provided three major benefits for local water quality management: (1) from the decision-making aspect, the platform provided intellectual support on macro and micro levels. It provided information for preventive control in key areas, hence reducing the environmental complaints by 14% compared to last year. (2) from the law enforcement aspect, this platform can help an inexperienced staff locate key pollution suspects within minutes, which greatly reduces the on-site investigation need. As a result, the officers have investigated and fined more companies with 21% lower inspection frequency; (3) from the supervision aspect, the platform can generate supervision reports within half a day. This is 80% faster than without the platform. It has doubled the number of supervised problems each month. Moreover, historical problems are all saved in the system for continuous improvement.

3.1.2. Semi-Structured Interview

In this case study, we carried out an in-depth semi-structured interview and several rounds of verifications with an experienced municipal official in the Ecology and Environment Department in Wenzhou, Zhejiang province. The interview was conducted online. The purpose was to understand the status of smart water management and CE implementation in Zhejiang, as well as verify the barriers identified from the literature. It allowed us to compare the practice with the literature review results.
We followed the methodology suggested by Harrell and Bradley [62] to minimize the bias in the interview. We have developed a protocol and followed it strictly. During the interview, we used neutral language in questions and remained neutral manner. We did not give our own opinions to the expert and did not assume answers ahead of time. Additionally, another source of data was collected to verify the findings from the interview.
We collected about 300 pages of secondary data from various sources, such as websites, government, and industrial reports. The information collected from the case study was used as a reference to refine the list of barriers concluded from the literature. We also defined the barriers with case-relevant examples so the survey participants could have a better understanding of them. Details of this process and further barrier identification measures are described in Section 3.2. The interview and case study results are the selected lists of barriers. This list was sent back to the interviewee for revision so that the interviewer’s bias could be minimized.
The semi-structured interview brought up three barriers in two aspects: financial investment and DT application. In the financial aspect, the interviewee suggested that small companies were reluctant to pay for implementing water regeneration systems in their facilities. As for the DT application, the interviewee explained two barriers related to using the smart water management system at work. Firstly, each department only used limited functions of the system that was directly related to their work. For example, the pollution inspection team mainly used two functions: recording the on-site inspection data such as location, photographs, and the problems; supporting the pollution inspection through area filtering and surrounding analysis. Hence, the interviewee suggested that even though the platform integrated full access to a wide range of data, officials in the related department did not have the skill to make full use of these data. Secondly, he pointed out that there were no proper training activities to support the management system users. The users were expected to independently discover innovative ways to exploit the data and the system.

3.2. Fuzzy Delphi Method

The Delphi method, originally developed in the 1950s, uses a survey conducted in two or more rounds to reach the consensus of opinions within a group of experts. It is one stream of the multi-criteria decision-making method, which is widely used to identify issues such as barriers or indicators [23,24]. According to Chang, et al. [63], experts’ opinions are collected through an anonymous questionnaire survey without in-person meetings or discussions. After each round, the facilitator shares the results of the previous round with the participants before they amend or maintain their judgment in the next round of the survey. This method allows the participants to be anonymous and to change their opinions based on other perspectives’ feedback while enabling quantitative analysis of their response [64]. Additionally, it does not require past data. Hence, the Delphi method can effectively help to identify the most critical, de-biased barriers based on a panel of experts.
However, the traditional Delphi method has some drawbacks. It has low convergence in results since experts can repeatedly change their evaluation. The survey process is time-consuming because experts must take part in multiple rounds of surveys to reach a group consensus. Moreover, there is a loss of information from experts’ opinions as experts give quantitative evaluation instead of linguistic descriptions [63].
Researchers, therefore, attempted to incorporation the fuzzy logic theory with the Delphi method to overcome these setbacks. For example, Ishikawa, et al. [65] proposed to integrate the fuzzy set theory by implementing the max-min and FDM to predict an attainable period, which can reduce the number of surveys and clarify the semantic structure of the prediction. Manakandan, et al. [66] demonstrated a fuzzy Delphi algorithm to obtain experts’ consensus on the validation of pesticide applicators using a concept of triangular fuzzy numbers and defuzzification process. Padilla-Rivera, et al. [25] proposed a different algorithm for calculating the fuzzy numbers and determining selection criteria to identify the social CE indicators. Bui, et al. [67] adopted the fuzzy set theory to convert experts’ linguistic evaluation into quantitative values, in order to give high tolerance to the linguistic evaluation’s uncertainty and vagueness. It can also reduce the bias and discrepancy of experts’ opinions and capture the semantic nature of the researched items [63].
In our study, we adopted the FDM proposed by Ishikawa, et al. [65]. This method has been employed in various research fields. Bouzon, et al. [68], for instance, used it to identify the essential Industry 4.0 and CE implementation barriers in the agriculture supply chain. It is also used to identify sustainable ecotourism indicators for planning and managing the sustainability performance in Philippine tourism sites [69]. Ismail, et al. [70] identified the required aspects of parental involvement in school, home and communication between home and school in the effort to inspire preschool children.
In conclusion, the FDM can mitigate the shortcomings of the traditional Delphi method. It can effectively generate a consensus within a group of experts from various backgrounds with a simplified procedure and reduced investigation time [25]. Therefore, this method was chosen in our research to reach expert consensus for barrier identification.
Our research applied the FDM in the following procedures:
  • Identify barriers through the literature review and delete duplicates. Combine items that have similar concepts. Collect data about the context in Zhejiang through the case study, and then remove the barriers that cannot be applied in this district. The barriers were examined by experts again for clarity and validity before the final questionnaire design.
  • Collect survey data from participants in the water, information technology, and construction sector, delete the invalid samples based on qualification standards. The assessment of each barrier was estimated based on the fuzzy Linguistic scale (Table 1).
  • Apply FDM to analyze experts’ responses. Calculate the triangular fuzzy numbers to evaluate the barriers using the geometrical mean model, then apply the simple canter of gravity method to “de-fuzzify” the fuzzy values into a crisp value for better comparison. Lastly, determine a threshold value to identify the important barriers.
The following sub-sections describe the detail of each step.

3.2.1. Step 1: Questionnaire Design

The barriers used in the survey were identified through three phases. The first phase was the literature review described in Section 2.4, through which we identified 58 initial barriers related to CE implementation and smart water management adoption (see Appendix A). In the second phase, we conducted a case study to understand the practice, based on which we excluded 18 barriers that are not applicable. After that, the remaining 40 barriers were used in a preliminary survey with the interviewed expert, who had identified unclear items and suggested adjustments. We used the feedback to edit, delete, or modify ambiguous questions, and added two more barriers to the list.
In the end, we identified 42 barriers divided into three dimensions for the questionnaire survey. We consulted the expert again to validate the clarity of the description of each survey question. For example, we defined the barrier of “the lack of support from public funds” as:
  • Financial support for wastewater and sewage sludge recycling is insufficient at all levels. Therefore, related work cannot be smoothly promoted, and enterprises are unwilling to transform and upgrade.
The survey has two sections. Section one was designed to collect personal information: fields, occupation, years of experience, and knowledge about relevant topics. In the second section, we developed 42 questions based on the barriers. Experts were asked to evaluate the importance of each barrier within the context of Zhejiang, by choosing the extent of their agreement on each barrier question.
We used a seven-point Likert scale, because a higher scale can provide more accurate and precise data [70]. Then we used triangular fuzzy number to produce the fuzzy scale. Triangular fuzzy number is written as ( a ,   b ,   c ) . The a value is the minimum value; The value b is the reasonable value; And c is the maximum value. It translates the linguistic Likert scale into fuzzy numbers. The fuzzy scale numbers use odd numbers. The linguistic parameters are translated into a fuzzy scale based on triangular fuzzy number, as shown in Table 1.

3.2.2. Step 2: Expert Selection and Data Collection

Literature suggests that the participants must cover different backgrounds and have knowledge about the researched issue to provide a result with higher accuracy [64]. Therefore, we defined the qualification of experts as follows: (1) practical experience in water management or digital technology; (2) at least five years of professional experience in the water or information technology sector; and (3) facilitated or joined projects or activities related to smart water management or sustainability. We used an online survey platform called Wenjuanxing to design the questionnaire and collect responses. The survey questionnaire was conducted in Chinese. It was sent to experts online in May 2021 and stayed active until June.
As for the mandatory number of experts, there is no strong relationship between the number and the result’s quality, which indicates that a large number of experts’ participation does not necessarily result in high-quality results. In fact, the number was not suggested to be too high [71]. Olawumi and Chan [72] had a panel of 14 experts from the academic and industrial experienced workers. Ismail, et al. [70] conducted their survey with 11 panel members from four different areas. Padilla-Rivera, et al. [25] used 45 experts to analyze the social CE indicators. Dawood, et al. [73] suggested the number of experts should be between 10 and 50. In our study, we selected 21 qualified experts from different fields and professionals to participate in our survey.
All participants completed the survey online. Table 2 shows the frequency of 21 participants’ fields, occupation, and their years of experience in the related area. On average, the participants spent 17 min on the online survey. The valid response rate was 87.5%, as we eliminated three participants who had less than five years of working experience, from a total of 24 entries. Among the 21 valid surveys, many of the experts work in the water conservancy, environment and public facilities management areas. 13 out of 21 are managers of agencies and institutions, such as government officials. Two senior technicians and associate professionals in civil engineering and construction contributed their insights to the survey. They both had worked for water system related constructions for over 15 years. To ensure collecting opinions from diverse backgrounds, we also invited a senior manager who had over 15 years of experience in the information transmission, software, and information technology services field, to participate in the survey.

3.2.3. Step 3: Fuzzy Delphi Method

  • Calculate the fuzzy number
Assume the value of the agreement level of barrier j assessed by expert i to be w i j = ( a i j ,   b i j ,   c i j )   f o r   i = 1 ,   2 ,   3 ,   ,   n ;   j = 1 ,   2 ,   3 ,   ,   m . Where ( a i j ,   b i j ,   c i j ) is converted from the linguistic evaluation according to the scale given in Table 1. Then the triangular fuzzy number W j that aggregate evaluation of barrier j from all the experts is as follows:
W j = ( a j ,   b j ,   c j   ) = ( min ( a i j ) ,   ( i = 1 n b i j ) 1 n , max ( c i j ) )
where a j is the minimum of experts’ evaluation value a i j ; b j is the geometric mean of b j ; and c j is the maximum value of c i j . The minimum and maximum values are used as terminal points of triangular fuzzy numbers. The geometric mean represents the membership degree to generate statistically unbiased effect [25].
2.
Defuzzification
The set of fuzzy number is then de-fuzzified to generate a crisp value W ˜ j as the final weight of each barrier j . The centre of gravity method used by Bouzon, et al. [68] is applied in this study to calculate W ˜ j . This method is a common method for defuzzification as follows [25]:
W ˜ j = a j + b j + c j 3
3.
Determine the threshold value
The threshold value α is generated to identify the important barriers. It is calculated by the average of all barriers’ crisp value weights W ˜ j as follows:
α = j = 1 m W ˜ j m
4.
Identify the important barriers
Finally, the important barriers can be identified based on the threshold value using the following screening principle:
  • If W ˜ j α then barrier j is accepted.
  • If W ˜ j < α then barrier j is rejected.

4. Results

4.1. Results of Fuzzy Delphi Method

This study used FDM to integrate experts’ opinions for generating a final list of barriers that represented the situation in Zhejiang province. In the end, we identified 22 main barriers through the literature review, case study, and a Fuzzy Delphi survey from 21 experts. The computation of the results shows that the threshold value was α = 0.6052 . The calculation process is shown in Table 3.
The maximum fuzzy number c j was 1.0 for all items. It shows that all items were ranked as “mostly agree that it is a barrier in this district” or “strongly agree that it is a barrier in this district” by at least one expert. The minimum fuzzy number a j varied from 0 to 0.3, which means negative or undecided assessments were also given in all the items. The highest score of geometric mean b j was the 0.82115 of C01, which also had the highest defuzzied crisp value W ˜ j of 0.70705.

4.2. Sensitivity Analysis and Rejected Barriers

Since the threshold value α = 0.6052 is crucial to the selection of barriers, a sensitivity analysis was conducted to examine how many barriers could be affected by a change in the threshold value. A difference of 0.05 was proposed to test the differences in the final results based on a similar process of Padilla-Rivera, et al. [25].
As shown in the last two columns in Table 3, for a lower threshold value α 1 = α 0.05 = 0.5552 , same barriers were selected. The significant difference appeared with a higher selection standard α 2 = α + 0.05 = 0.6552 . Only two barriers in category A were accepted with this standard, eliminating four other infrastructural and economic barriers. Institutional and governance barriers were also reduced from eight to five. However, all the accepted technological barriers (category B) were maintained with this higher threshold value.
The rejected barriers are listed in Table 4. 48% of the barriers were rejected. They included half of the infrastructural and economic barriers, about 42% of the technological ones, and half of institutional and governance barriers. The sensitive test results show that the barrier selection was not significantly sensitive to the change of threshold value. In other words, the selection of barriers is robust.
The rejection represents the situation in Zhejiang. For example, Zhejiang province is one of the well-developed areas in China. Wastewater treatment plants and information technology infrastructures are well developed. The local government have a long-term investment plan to improve urban water management performances as well as implement DT in it. Because local government is leading the smart water management system development, they have access to required data.
However, due to the design of FDM, results may differ if the participants come from other backgrounds. In our study, over 60% of the participants are governmental organization managers, whereas 10% are company managers. This could be the result of local government’s leading role in the smart water management implementation.

4.3. Selected Barriers

Based on the threshold value α = 0.6052 , 22 out of 42 barriers were accepted, including six infrastructural and economic (27.3%), eight technological (36.4%), and eight institutional and governance barriers (36.4%). As shown in Table 5, the selected barriers show that there is no distinctive priority for a specific barrier category. The average score of each category was 0.64 for category A, 0.68 for category B, and 0.66 for category C.
The highest score was 0.707, 0.011 higher than the second one. However, the score from the second to the tenth had relatively close scores, with only 0.009 differences between the second and the tenth barrier. The most significant drop in scores was between the fifteenth and the sixteenth item, with a difference of 0.037. Four infrastructural and economic barriers were scored less than 6.2, while all technological barriers had a score over 6.5. The managerial and technological barriers (B and C), taking the first four places in the ranking and relatively higher scores, seemed to be slightly more important than the infrastructural and economic ones (A).

5. Discussion and Contribution

5.1. Theoretical Implications

This study identified the main barriers to implementing CE in smart water management in the Zhejiang context. The results provide valuable knowledge on what factors need to be considered using DT to improve CE performance in the water sector, especially for areas has a similar situation in Zhejiang. Such context can be characterized by low CE performances, high internet penetration rate, sufficient natural water resources, and smart water management that is already in use or planned to be implemented. Additionally, wastewater treatment plants are capable of reclaimed water for reuse.
The identified barriers reveal water sector-specific problems, and reflect the common challenges in other industries that attempt to use DT to support their CE practices. For example, the identified barriers of high-costs and low benefit, inaccurate data analysis, data security concerns, and lack of environmental and sustainability awareness are the shared barriers that hinder the CE transformation in the smart city, smart manufacturing, and smart agriculture.
Similarities and differences are identified by comparing our results with other studies in the literature. Our findings agree with the study of Kumar, et al. [58], in that raising awareness among stakeholders is important, and that cooperation should be encouraged. However, in contrast to their suggestion about raising the awareness of technology implementation in the Indian agriculture supply chain, our finding shows that in a well-digitalized water management system, raising the awareness of environmental issues and CE concepts is more important than technology. This resonates with the finding of Demestichas and Daskalakis [57], which suggests that the high level of environmental awareness and familiarity with CE technologies can make the CE implementation in policy and business less complicated.
As for the differences, our study shows that successful CE implementation requires more viable options of utilizing recovered resources, especially when the public has no prejudice against recycled materials. The experts ranked the lack of viable utilization options for recovered water and resources (B09) as the second most important barrier, but they rejected the barrier of low social acceptance of reclaimed water and resources (C13). This finding is different from the result of Mesa-Pérez and Berbel [74]. Gherghel, Teodosiu and De Gisi [44], which suggested the low acceptance of reclaimed water and sludge could interrupt CE implementation.
This study also proposed a mixed approach to identifying barriers involving three phases: literature review, case study, and FDM. The literature review results in a preliminary list of items, such as barriers, as a starting point. The case study can provide detailed information for choosing items and defining and explaining them in the given context so that the survey participants can understand. It integrates experienced practitioners’ knowledge to complete the barrier list by adding, removing, and modifying barriers. Additionally, the case study can help researchers have a clear understanding of each barrier in practice to better define each survey question based on practices. This helps survey participants’ understanding and evaluation. Hence the combination of the methods could improve the validity of the survey results. The final phase, the FDM, takes the ambiguity of linguistic assessment into consideration and provides an efficient way to collect experts’ opinions and record the process.

5.2. Practical Implications

This study reveals the main barriers to CE implementation in smart water management. The findings can help the government, practitioners, and stakeholders to move the water sector towards a sustainable urban water system. Such systems use DT to support CE practices. Specifically, it can reduce, reclaim, reuse, recycle the water resource, recover energy and nutrients from sludge, and rethink the process to relieve water scarcity.
Our study shows that implementing CE requires combined efforts from organizations and individuals in three major sectors: infrastructural and constructional sectors, technological sectors, and key stakeholders in the water and wastewater management sector.

5.2.1. Infrastructural and Economic Implication

Our study shows that the infrastructure should be improved for CE implementation. To begin with, the pipelines and sewage networks are fundamental elements for saving and recycling water. Our results suggest that new wastewater collection (A08) and reclaimed water distribution networks (A11) need to be built so that companies and the public can use the regenerated water. The leakage in the old water distribution and wastewater collection networks (A07) is another problem that should be addressed. Both kinds of leakage contribute to water loss, while the latter further causes contamination due to the pollutant matter in wastewater. This finding is in line with Qu, et al. [45], who suggested that the municipal wastewater collection was insufficient. Companies and governments should also aim to provide the infrastructure for distributing the reclaimed water and the supply chain for recovered materials (A11).
Secondly, DT infrastructure also requires further development to expand the internet coverage (A10). The ICT facilities require a further establishment to support the reliable wireless data collection and data transmission, data storage and processing among monitoring points, management systems, and operators’ personal devices.
In the economic aspects, our results show that the high investment cost and low short-term profits of CE implementation are driving stakeholders away (A05). Additionally, unbalanced economic level in the different district makes it difficult to implement CE and smart water management in the whole country (A01). The government is suggested to play an important role in increasing the economic benefits of CE by funding CE implementation projects, raising natural resource prices and waste disposal tax, and reducing wastewater processing costs [74,75].
In addition, the rejected barriers indicate that the district is ready to implement CE in smart water management. The wastewater treatment technology and water quality monitoring system in the district are already available to support water reclamation (A12, A09). The public is capable of taking part in the implementation (A02). Financial departments are providing public funds to support the transformation (A03).

5.2.2. Technological Implication

The first part of technological barriers come from resource reutilization. The results show that experts had concerns about the limited choices for utilizing recovered water, material, and energies (B09). This barrier raises demands on improving the resource recovery techniques, innovating reutilization purposes, developing supportive regulation, and increasing public acceptance.
Reutilization technologies need reliable implementation solutions, as existing technologies are already capable of processing wastewater and sludge for various reuse purposes [76,77]. One direction for technology innovation is reliable and cost-friendly solution development. Another direction is scale implementation and performance evaluation. DT such as AI, simulation, and big data can support these innovations.
A comprehensive regulatory framework should be established to ensure the recycled resources are safe for reutilization [78]. This can ease the concern on harmful residuals left in the reused materials. It can also encourage businesses to adopt new technologies for CE practices. Governments and companies can use the smart water management system to promote, monitor, and control CE practices.
The second part of technology barriers comes from DT implementation. It is raising concerns about data privacy and data security (B04), data uncertainty, and unreliable analysis results (B05). Information technology experts should provide safer, cheaper, and more reliable solutions, such as blockchain, deep learning, and artificially intelligence. Governments and companies should design policies and protocols to protect data privacy, encourage knowledge sharing between organizations, and innovate the management system towards data sharing. An efficient knowledge management system that can share, transmit and discover new information (B06) is also expecting further development. Government and leading companies should provide infrastructures, policies, and best practices to encourage data sharing. Formal dig data standards should be developed. Easy conversion between different standards and systems that support different types of data is also suggested [79]. Big data, AI, deep learning, and blockchain have the potentials to address this problem.
Lastly, knowing how to use technologies is vital for exploiting the value of data. In our case, both workforce and project leaders require more knowledge of CE and digitalization (B11, B13). Workforces need specific training for resource recovery processes and for using advanced DT [58]. Leaders not only need to learn about the technologies, but also require successful experience in order to design and manage the implementation program (B12). Leaders can better envision a sustainable and digitalized future if they learn more about successful cases (B07). The education system and companies should cooperate in training high-skilled workers to fulfil the tasks both in CE and digitalization practices [57]. Organizations with successful implementation experiences should be encouraged to share their knowledge to support other projects that lack experienced leaders [58]. For these purposes, big data, IoT, VR/AR can assist information exchange and training in the virtual space.

5.2.3. Implication for Government and Key Stakeholder Companies in the Water and Wastewater Sector

Our finding shows that the importance of decentralized treatment (C01) has not been fully recognized. The decentralized treatment system is a cost-effective and long-term supplement to the current centralized model, especially in less densely populated areas [39]. Compared to the centralized system, this solution has the potential to recycle wastewater on-site as an unconventional water resource for agriculture, industry, domestic, and drinking water. It is important to solve the challenges from the continuously changing quality and quantity of urban wastewater and from the emerging contaminants within the wastewater [20]. A sustainable urban water system should combine elements of both the centralized and decentralized water management systems, in order to build up a resilient system against water shortages, floods and other extreme events [80].
As for the social aspect, the lack of water scarcity in the region (C06) could ease the pressure on water reuse, leading to the district’s missing CE and water conservation mindset. This could cause governments to choose other solutions, rather than CE strategies, or prioritise other more urgent issues (C07, C08). Barrier C14 indicates that neither the public nor the government had enough awareness of the importance of CE implementation in the water sector. This result is related to the finding of Qu, et al. [45], which suggested that the Chinese government did not emphasize water reuse, but on reducing the release of pollutants into the receiving water body.
However, the lack of water scarcity should not deprive the importance of CE implementation. In the Chinese manufacturing industry, regulatory measures have primarily driven the recycling efforts [81]. Water and sludge reuse deserve more attention from the government.
The Government should promote CE and put forward regulations on resource reuse [82]. Government and practitioners should raise CE awareness and generate cultural and organizational transformation towards sustainable water usage [83]. The government should not only make clearer policies to put forward the CE strategies, but also design regulations to ensure safety reuse for public health. It is also important to consider the unbalanced development level in different districts. Mesa-Pérez and Berbel [74] pointed out that authorities should consider the differences between districts and develop district-specific CE implementation strategies.
Our results put another emphasis on efficient governance and coordination. Government, policymakers and practitioners should promote relevant services and coordination in their decision-making [55]. They need efficient management protocols within the organization and among various departments (C05). The coordination and communications between stakeholders, such as water companies, governments, consumers, even the information technology providers, are also important for an effective implementation process (C09).

5.3. Implications for other Region

The CE implementation in the water sector has several common issues around the world. To begin with, it is agreed that local government and regional policy are vital to successful CE implementation. For example, in our case, the local government still focuses on solving the output problem, such as pollution and wastewater treatment. The same problems are found in some areas in other countries, such as Indian, Belgian, and Dutch [1,58]. Another global topic is the decentralized system implementation for sustainable development, such as cases in India, Indonesia, and Finland [84,85,86].
Comparing the differences between our results with studies in other districts provide further enlightenment. Our study shows that implementing the smart water management system is easier in districts with better information technology infrastructure. On the one hand, it can lower the investment cost for building infrastructure because the smart water system can use existing ones. On the other hand, people are more likely to accept the new system because they are used to similar technologies. This is based on the differences between our findings in Zhejiang and those from Kumar, et al. [58] in India. For example, “lack of government support and incentives” and “lack of acceptance for the Industry 4.0” are identified as barriers in the Indian agricultural supply chain. In contrast, similar barriers (C03, C15) were rejected by the experts in the water sector in Zhejiang province. Zhejiang has a well-developed information technology infrastructure with an internet penetration rate of 82.4%, while 99.7% of the internet users were using mobile devices by the end of 2020 [87].
Although sufficient freshwater in Zhejiang has lowered the priority of local water reuse, we argue that resource scarcity should not be the only reason for successful water reuse and other CE implementations. Zhejiang, and other districts that are not facing resource scarcity can promote CE from other aspects. Some successful water reuse cases in the US are initiated by rigorous and costly wastewater treatment requirements [37]. Three cities in China have better overall CE performances than Zhejiang, thanks to new development concepts, advanced resource reutilization technologies, reasonable industrial structure, and complete infrastructure [88].

6. Conclusions

As the water scarcity situation is worsened by population growth and ever-expanding urbanization, one of the 17 UN’s SDGs, the Goal 6 clean water and sanitation, calls for sustainable solutions for water scarcity and pollution. Therefore, the CE mindset is attracting discussions in the water and wastewater sector because it encourages water reuse and resource recovery from wastewater and sewage sludge. Meanwhile, DT such as IoT and big data are adding a smart layer to water management that can improve water usage efficiency and reduce pollution. Previous research suggested that using DT to support CE practices can accelerate sustainable development, for example, in energy supply, city management, and the manufacturing industry [19]. However, the CE concept is still underdeveloped in the water sector, while smart water management system is implemented in many countries, such as China and the U.S.
This study attempted to identify the barriers to CE implementation in smart water management in practice. We studied the case that is highly digitalized but with poor CE performance. We finally identified 22 barriers through a hybrid process, including a literature review, case study, and the FDM. The identified barriers were divided into infrastructural and economic, technical, and institutional and governance barriers.
The finding also suggests that barriers related to technologies raised the most concern. Not only do the recovered resources need more utilization technologies, but the workforce and managers need better knowledge of these recycling technologies and the DT. Our study also suggests that the lack of public awareness of CE benefits and water scarcity can be a significant drawback. Another interesting finding is that the experts showed high interest in the decentralized wastewater treatment system, as the lack of acknowledgement of the decentralized system’s importance had the highest score of importance in the result. These findings provide valuable insights for practitioners, researchers, and policymakers seeking to implement CE strategies into smart cities, smart building, and smart manufacturing.
The current limits of this study are data issues. Firstly, the finding of this research can only be generalized to places and factories with well-developed DT infrastructure. We recommend further studies to apply the same research under other circumstances. Secondly, the results could be partially biased because over 80% of the survey participants came from the water and environment conservatory sector. The assessment may vary based on participants’ personal experiences and knowledge. This study can be repeated in similar situations to remove prejudices and biases. Future studies can also explore viable solutions for the identified barriers and quantitatively evaluate the impact of DT implementation.

Author Contributions

Conceptualization, Q.L. and M.Y.; methodology, Q.L., L.Y. and M.Y.; validation, Q.L., L.Y. and M.Y.; formal analysis, Q.L. and M.Y.; investigation, Q.L. and L.Y.; resources, L.Y.; writing—original draft preparation, Q.L.; writing—review and editing, Q.L. and M.Y.; supervision, M.Y.; project administration, M.Y. All authors have read and agreed to the published version of the manuscript.

Funding

This work was supported by the UKRI EPSRC Internet of Food Things Network Plus (EP/R045127/1) and the Royal Society Newton Mobility Grant (Ref: NMG\R1\191115).

Institutional Review Board Statement

The study was conducted according to the University of Exeter Research Ethics Framework, and approved by the CEMPS Ethics Committee of COLLEGE OF ENGINEERING, MATHEMATICS AND PHYSICAL SCIENCES, UNIVERSITY OF EXETER (protocol code: eEMPS000423 and date of approval: 7 June 2021).

Informed Consent Statement

Informed consent was obtained from all subjects involved in the study.

Data Availability Statement

The data presented in this study are available on request from the corresponding author. The data are not publicly available due to confidentiality agreement with industrial partners.

Acknowledgments

We would like to thank Tim Niblock for his help with the proofreading of this article.

Conflicts of Interest

The authors declare no conflict of interest.

Appendix A

Table A1. Initial list of barriers from literature review.
NrChallenge/BarrierReferences
Economic challenges
1Lack of economically feasible processes[20,44]
2high investment costs in CE integration to a specific plant[44]
3High energy cost of the wastewater treatment[60]
4High IT training, skills development, operational and maintenance cost[55]
5High cost of transporting, implementing, distributing, and storing reclaimed water/nutrients[20,56]
6Lack of support from public funds[57]
7Major upfront investment costs by implementing CE[89]
8Unclear economic benefit of digital and CE investments[54,89]
9High short-term costs and low short-term economic benefits[89]
10Higher price of recycled materials and reclaimed water than the virgin in the market[44,74,89]
Institutional/Governance challenges
11Lack of assessment of the system from reliability (e.g., doesn’t pose any health hazard or consistent performance for a given condition), robustness (e.g., can manage multiple parameters removal/recovery), resilience (e.g., can manage variation in influent load), and redundancy (e.g., backup services) perspectives[55]
12Lack of acknowledgement of the importance of decentralized treatment[20,55]
13Significant leakages in water distribution networks[20]
14Lack of policies supporting the recycling and reclamation of wastewater, promoting the use of recovered resources[20]
15Lack of political will, commitment, and management support to CE from the higher authorities[20,45,54,56,57,74]
16Unclear vision in CE, IT management and digital operations[54,55]
17Lack of coordination/communication between operational networks, with the consumers, and with the government department[20,55,74,89]
18Lack of regulations, standard and quality indicators for the CE and the reclaimed water & sludge[20,55,57,74]
19Lack of openness and accessibility of data[55,89]
20Lack of transparency and liability of the government[55,74]
21Difficulty in making the right decision to implement CE in the most efficient way[89]
22Lack of experience leader and successful reference projects, poor leadership, and management towards CE[54,74,89]
23Higher priority of other issues or requirements[89]
24Other solutions might be more favourable than implementing CE[89]
25Limited availability of recovered water/nutrients/energy[89]
26Lack of access to technology to the majority of citizens and institutions[20,56]
27Lack of expertise, knowledge and skilled manpower in IT and CE[20,54,74,89]
28Lack of technological knowledge, design, and operation experience among the planners for CE[44,74]
Social and cultural challenges
29Lack of awareness among the citizens about the environmental issues and the benefit of CE[20,56,74]
30Low social acceptance, poor public perception, and motivation to using recovered water/material[20,44,45,56,89]
31Low community awareness of digitalized water management[54,55,57,74]
32Lack of involvement of citizens and stakeholder cooperation[55,57,74]
33Unbalanced geographical development[55]
34High degree of inequality in citizens’ education, income, skills etc.[55]
35No existence of water scarcity in the region[57,74]
36Employment disruptions[54]
37Not attractive for industry[44]
Technological challenges
38Lack of wastewater collection systems and infrastructure[55,60]
39Lack of infrastructure to distribute reclaimed water and underdeveloped supply chain of recovered materials[44,54,56,74]
40Lack of organizational and process design and changes for CE[44,54,89]
41Lack of a standard system for measuring CE[89]
42Low technology readiness level of proper treatment for water reuse, low maturity of material/energy recovery method[20,44,45,56,57,74]
43Lack of substantial research and knowledge base[44]
44Lack of viable options for recovered water/nutrients/energy utilization[44]
45Lack of information or the ambiguities regarding what information is required by who[57]
46Data privacy and data security issues[55,57]
47Lack of internet coverage and IT facilities, reliable IoT and BDA infrastructure and intelligence[54,55,89]
48Poor data availability and scalability regarding CE in the water sector[55,89]
49Continuously changing quantity and quality of wastewater contaminants and unfavourable sludge properties[20,60]
50Lack of proper treatment equipment in WWTP[45,54]
51potential negative environmental impacts from CE technologies[57]
52Lack of energy recovery practice in WWTP[20]
53Lack of common information system models and data sharing protocols[54,55]
54Data uncertainty and the lack of accuracy and reliability of data analysis[57]
55Lack of automation system virtualization[54]
56Lack of closed-loop control[54]
57Lack of knowledge management systems[54]
58Difficulty in maintaining the quality of products made with recovered water and materials[89]

References

  1. Mbavarira, T.; Grimm, C. A Systemic View on Circular Economy in the Water Industry: Learnings from a Belgian and Dutch Case. Sustainability 2021, 13, 3313. [Google Scholar] [CrossRef]
  2. Kummu, M.; Guillaume, J.H.A.; de Moel, H.; Eisner, S.; Flörke, M.; Porkka, M.; Siebert, S.; Veldkamp, T.I.E.; Ward, P.J. The world’s road to water scarcity: Shortage and stress in the 20th century and pathways towards sustainability. Sci. Rep. 2016, 6, 38495. [Google Scholar] [CrossRef] [PubMed] [Green Version]
  3. United Nations. The Sustainable Development Goals Report 2017; United Nations Publications: New York, NY, USA, 2017. [Google Scholar]
  4. Capodaglio, A.G.; Ghilardi, P.; Boguniewicz-Zablocka, J. New paradigms in urban water management for conservation and sustainability. Water Pract. Technol. 2016, 11, 176–186. [Google Scholar] [CrossRef] [Green Version]
  5. Vairavamoorthy, K.; Eckart, J.; Tsegaye, S.; Ghebremichael, K.; Khatri, K. A Paradigm Shift in Urban Water Management: An Imperative to Achieve Sustainability; Springer International Publishing: New York, NY, USA, 2015; pp. 51–64. [Google Scholar]
  6. Smakhtin, V.; Perera, D.; Qadir, M.; Aureli, A.; Carvalho-Resende, T.; Dhot, N.; Findikakis, A.; Villholth, K.G.; Gurdak, J.J.; Zandaryaa, S.; et al. Water availability, infrastructure and ecosystems. In The United Nations World Water Development Report 2020: Water and Climate Change; UNESCO World Water Assessment Programme (WWAP); UN-Water UNESCO: Paris, France, 2020; pp. 46–57. [Google Scholar]
  7. Abu-Ghunmi, D.; Kayal, B.; Bino, A. Circular economy and the opportunity cost of not ‘closing the loop’ of water industry: The case of Jordan. J. Clean. Prod. 2016, 131, 228–236. [Google Scholar] [CrossRef]
  8. Schöggl, J.-P.; Stumpf, L.; Baumgartner, R.J. The narrative of sustainability and circular economy—A longitudinal review of two decades of research. Resour. Conserv. Recycl. 2020, 163, 105073. [Google Scholar] [CrossRef]
  9. Geissdoerfer, M.; Savaget, P.; Bocken, N.M.; Hultink, E.J. The Circular Economy—A New Sustainability Paradigm? J. Clean. Prod. 2017, 143, 757–768. [Google Scholar] [CrossRef] [Green Version]
  10. Ellen MacArthur Foundation. Towards the Circular Economy. J. Ind. Ecol. 2013, 2, 23–44. [Google Scholar]
  11. McDowall, W.; Geng, Y.-J.; Huang, B.; Barteková, E.; Bleischwitz, R.; Türkeli, S.; Kemp, R.; Doménech, T. Circular Economy Policies in China and Europe. J. Ind. Ecol. 2017, 21, 651–661. [Google Scholar] [CrossRef] [Green Version]
  12. Ramos, H.M.; McNabola, A.; López-Jiménez, P.A.; Pérez-Sánchez, M. Smart Water Management towards Future Water Sustainable Networks. Water 2019, 12, 58. [Google Scholar] [CrossRef] [Green Version]
  13. Chowdury, M.S.U.; Bin Emran, T.; Ghosh, S.; Pathak, A.; Alam, M.M.; Absar, N.; Andersson, K.; Hossain, M.S. IoT Based Real-time River Water Quality Monitoring System. Procedia Comput. Sci. 2019, 155, 161–168. [Google Scholar] [CrossRef]
  14. Geetha, S.; Gouthami, S. Internet of things enabled real time water quality monitoring system. Smart Water 2016, 2, 1. [Google Scholar] [CrossRef]
  15. Mendoza-Cano, O.; Aquino-Santos, R.; López-De La Cruz, J.; Edwards, R.M.; Khouakhi, A.; Pattison, I.; Rangel-Licea, V.; Castellanos-Berjan, E.; Martinez-Preciado, M.A.; Rincón-Avalos, P.; et al. Experiments of an Iot-Based Wireless Sensor Network for Flood Monitoring in Colima, Mexico. J. Hydroinform. 2021, 23, 385–401. [Google Scholar] [CrossRef]
  16. Melville-Shreeve, P.; Cotterill, S.; Butler, D. Capturing high-resolution water demand data in commercial buildings. J. Hydroinform. 2021, 23, 402–416. [Google Scholar] [CrossRef]
  17. Yuanyuan, W.; Ping, L.; Wenze, S.; Xinchun, Y. A New Framework on Regional Smart Water. Procedia Comput. Sci. 2017, 107, 122–128. [Google Scholar] [CrossRef]
  18. World Economic Forum, Ellen MacArthur Foundation. Intelligent Assets: Unlocking the Circular Economy Potential; Ellen MacArthur Foundation: Geneva, Switzerland, 2016; pp. 1–39. [Google Scholar]
  19. Dantas, T.; De-Souza, E.; Destro, I.; Hammes, G.; Rodriguez, C.; Soares, S. How the combination of Circular Economy and Industry 4.0 can contribute towards achieving the Sustainable Development Goals. Sustain. Prod. Consum. 2020, 26, 213–227. [Google Scholar] [CrossRef]
  20. Kakwani, N.S.; Kalbar, P.P. Review of Circular Economy in urban water sector: Challenges and opportunities in India. J. Environ. Manag. 2020, 271, 111010. [Google Scholar] [CrossRef]
  21. Eggimann, S.; Mutzner, L.; Wani, O.; Schneider, M.Y.; Spuhler, D.; De Vitry, M.M.; Beutler, P.; Maurer, M. The Potential of Knowing More: A Review of Data-Driven Urban Water Management. Environ. Sci. Technol. 2017, 51, 2538–2553. [Google Scholar] [CrossRef] [Green Version]
  22. Adedeji, K.B.; Nwulu, N.I.; Clinton, A. Iot-Based Smart Water Network Management: Challenges and Future Trend. In Proceedings of the IEEE AFRICON, Accra, Ghana, 25–27 September 2019. [Google Scholar]
  23. Okoli, C.; Pawlowski, S.D. The Delphi Method as a Research Tool: An Example, Design Considerations and Applications. Inf. Manag. 2004, 42, 15–29. [Google Scholar] [CrossRef] [Green Version]
  24. Mahdiyar, A.; Mohandes, S.R.; Durdyev, S.; Tabatabaee, S.; Ismail, S. Barriers to green roof installation: An integrated fuzzy-based MCDM approach. J. Clean. Prod. 2020, 269, 122365. [Google Scholar] [CrossRef]
  25. Padilla-Rivera, A.; Carmo, B.B.T.D.; Arcese, G.; Merveille, N. Social circular economy indicators: Selection through fuzzy delphi method. Sustain. Prod. Consum. 2020, 26, 101–110. [Google Scholar] [CrossRef]
  26. Larsen, T.; Gujer, W. The Concept of Sustainable Urban Water Management. Water Sci. Technol. 1997, 35, 3–10. [Google Scholar] [CrossRef]
  27. Schütze, M.; Butler, D.; Beck, B.M. Modelling, Simulation and Control of Urban Wastewater Systems; Springer Science & Business Media: London, UK, 2011. [Google Scholar]
  28. Ye, Y.; Ngo, H.H.; Guo, W.; Liu, Y.; Chang, S.W.; Nguyen, D.D.; Liang, H.; Wang, J. A critical review on ammonium recovery from wastewater for sustainable wastewater management. Bioresour. Technol. 2018, 268, 749–758. [Google Scholar] [CrossRef] [PubMed]
  29. Carneiro, M.; Bilotta, P.; Malucelli, L.C.; Och, S.H.; Filho, M.A.D.S.C. Sludge and scum blends from water and sewage treatment plants for energy recovering toward a circular economy perspective. Int. J. Environ. Sci. Technol. 2020, 17, 3847–3856. [Google Scholar] [CrossRef]
  30. Rodriguez-Anton, J.M.; Rubio-Andrada, L.; Celemín-Pedroche, M.S.; Alonso-Almeida, M.D.M. Analysis of the relations between circular economy and sustainable development goals. Int. J. Sustain. Dev. World Ecol. 2019, 26, 708–720. [Google Scholar] [CrossRef]
  31. Angelakis, A.N.; Asano, T.; Bahri, A.; Jimenez, B.E.; Tchobanoglous, G. Water Reuse: From Ancient to Modern Times and the Future. Front. Environ. Sci. 2018, 6. [Google Scholar] [CrossRef] [Green Version]
  32. Marlow, D.R.; Moglia, M.; Cook, S.; Beale, D. Towards sustainable urban water management: A critical reassessment. Water Res. 2013, 47, 7150–7161. [Google Scholar] [CrossRef] [PubMed]
  33. Hoffmann, S.; Feldmann, U.; Bach, P.M.; Binz, C.; Farrelly, M.; Frantzeskaki, N.; Hiessl, H.; Inauen, J.; Larsen, T.A.; Lienert, J.; et al. A Research Agenda for the Future of Urban Water Management: Exploring the Potential of Nongrid, Small-Grid, and Hybrid Solutions. Environ. Sci. Technol. 2020, 54, 5312–5322. [Google Scholar] [CrossRef] [PubMed]
  34. Yang, W.; Hyndman, D.W.; Winkler, J.A.; Viña, A.; Deines, J.M.; Lupi, F.; Luo, L.; Li, Y.; Basso, B.; Zheng, C.; et al. Urban water sustainability: Framework and application. Ecol. Soc. 2016, 21, 4. [Google Scholar] [CrossRef] [Green Version]
  35. Schroeder, P.; Anggraeni, K.; Weber, U. The Relevance of Circular Economy Practices to the Sustainable Development Goals. J. Ind. Ecol. 2018, 23, 77–95. [Google Scholar] [CrossRef] [Green Version]
  36. Rodriguez-Martin, A.; Palomo-Zurdo, R.J.; Gonzalez-Sanchez, F. Transparency and Circular Economy: Analysis and Assesment of Municipal Management Solid Waste. Ciriec—Esp. Rev. Econ. Publica Soc. Coop. 2020, 99, 233–272. [Google Scholar]
  37. Voulvoulis, N. Water reuse from a circular economy perspective and potential risks from an unregulated approach. Curr. Opin. Environ. Sci. Health 2018, 2, 32–45. [Google Scholar] [CrossRef]
  38. Smol, M.; Adam, C.; Preisner, M. Circular economy model framework in the European water and wastewater sector. J. Mater. Cycles Waste Manag. 2020, 22, 682–697. [Google Scholar] [CrossRef] [Green Version]
  39. Capodaglio, A.G. Integrated, Decentralized Wastewater Management for Resource Recovery in Rural and Peri-Urban Areas. Resources 2017, 6, 22. [Google Scholar] [CrossRef] [Green Version]
  40. Akhoundi, A.; Nazif, S. Sustainability assessment of wastewater reuse alternatives using the evidential reasoning approach. J. Clean. Prod. 2018, 195, 1350–1376. [Google Scholar] [CrossRef]
  41. Landa-Cansigno, O.; Behzadian, K.; Davila-Cano, D.I.; Campos, L.C. Performance Assessment of Water Reuse Strategies Using Integrated Framework of Urban Water Metabolism and Water-Energy-Pollution Nexus. Environ. Sci. Pollut. Res. 2020, 27, 4582–4597. [Google Scholar] [CrossRef] [PubMed] [Green Version]
  42. Konig, M.; Jacob, J.; Kaddoura, T.; Farid, A.M. The role of resource efficient decentralized wastewater treatment in smart cities. In Proceedings of the IEEE First International Smart Cities Conference (ISC2), Guadalajara, Mexico, 25–28 October 2015. [Google Scholar]
  43. Capodaglio, A.G.; Callegari, A.; Cecconet, D.; Molognoni, D. Sustainability of decentralized wastewater treatment technologies. Water Pract. Technol. 2017, 12, 463–477. [Google Scholar] [CrossRef]
  44. Gherghel, A.; Teodosiu, C.; De Gisi, S. A review on wastewater sludge valorisation and its challenges in the context of circular economy. J. Clean. Prod. 2019, 228, 244–263. [Google Scholar] [CrossRef]
  45. Qu, J.; Wang, H.; Wang, K.; Yu, G.; Ke, B.; Yu, H.-Q.; Ren, H.; Zheng, X.; Li, J.; Li, W.-W.; et al. Municipal wastewater treatment in China: Development history and future perspectives. Front. Environ. Sci. Eng. 2019, 13, 88. [Google Scholar] [CrossRef]
  46. Antzoulatos, G.; Mourtzios, C.; Stournara, P.; Kouloglou, I.-O.; Papadimitriou, N.; Spyrou, D.; Mentes, A.; Nikolaidis, E.; Karakostas, A.; Kourtesis, D.; et al. Making urban water smart: The SMART-WATER solution. Water Sci. Technol. 2020, 82, 2691–2710. [Google Scholar] [CrossRef]
  47. Li, J.; Yang, X.; Sitzenfrei, R. Rethinking the Framework of Smart Water System: A Review. Water 2020, 12, 412. [Google Scholar] [CrossRef] [Green Version]
  48. Dong, J.; Wang, G.; Yan, H.; Xu, J.; Zhang, X. A survey of smart water quality monitoring system. Environ. Sci. Pollut. Res. 2015, 22, 4893–4906. [Google Scholar] [CrossRef] [PubMed]
  49. Trevisan, A.H.; Zacharias, I.S.; Liu, Q.; Yang, M.; Mascarenhas, J. Circular Economy and Digital Technologies: A Review of The Current Research Streams. Proc. Des. Soc. 2021, 1, 621–630. [Google Scholar] [CrossRef]
  50. Liu, Y.; Zhang, Y.; Ren, S.; Yang, M.; Wang, Y.; Huisingh, D. How Can Smart Technologies Contribute to Sustainable Product Lifecycle Management? J. Clean. Prod. 2020, 249, 119423. [Google Scholar] [CrossRef]
  51. Asghari, P.; Rahmani, A.M.; Javadi, H.H.S. Internet of Things applications: A systematic review. Comput. Netw. 2018, 148, 241–261. [Google Scholar] [CrossRef]
  52. Kong, L.; Liu, Z.; Wu, J. A systematic review of big data-based urban sustainability research: State-of-the-science and future directions. J. Clean. Prod. 2020, 273, 123142. [Google Scholar] [CrossRef]
  53. Khan, M.B.; Lee, X.Y.; Nisar, H.; Ng, C.A.; Yeap, K.H.; Malik, A.S. Digital Image Processing and Analysis for Activated Sludge Wastewater Treatment. In Signal and Image Analysis for Biomedical and Life Sciences; Sun, C., Bednarz, T., Pham, T.D., Vallotton, P., Wang, D., Eds.; Springer: Berlin/Heidelberg, Germany, 2015; pp. 227–248. [Google Scholar]
  54. Abdul-Hamid, A.-Q.; Ali, M.H.; Tseng, M.-L.; Lan, S.; Kumar, M. Impeding challenges on industry 4.0 in circular economy: Palm oil industry in Malaysia. Comput. Oper. Res. 2020, 123, 105052. [Google Scholar] [CrossRef]
  55. Rana, N.P.; Luthra, S.; Mangla, S.K.; Islam, R.; Roderick, S.; Dwivedi, Y.K. Barriers to the Development of Smart Cities in Indian Context. Inf. Syst. Front. 2018, 21, 503–525. [Google Scholar] [CrossRef] [Green Version]
  56. Addae, B.A.; Zhang, L.; Zhou, P.; Wang, F. Analyzing barriers of Smart Energy City in Accra with two-step fuzzy DEMATEL. Cities 2019, 89, 218–227. [Google Scholar] [CrossRef]
  57. Demestichas, K.; Daskalakis, E. Information and Communication Technology Solutions for the Circular Economy. Sustainability 2020, 12, 7272. [Google Scholar] [CrossRef]
  58. Kumar, S.; Raut, R.D.; Nayal, K.; Kraus, S.; Yadav, V.S.; Narkhede, B.E. To identify industry 4.0 and circular economy adoption barriers in the agriculture supply chain by using ISM-ANP. J. Clean. Prod. 2021, 293, 126023. [Google Scholar] [CrossRef]
  59. Wang, C.; Chu, Z.; Gu, W. Assessing the Role of Public Attention in China’s Wastewater Treatment: A Spatial Perspective. Technol. Forecast. Soc. Chang. 2021, 171, 120984. [Google Scholar] [CrossRef]
  60. Lu, J.-Y.; Wang, X.-M.; Liu, H.-Q.; Yu, H.-Q.; Li, W.-W. Optimizing operation of municipal wastewater treatment plants in China: The remaining barriers and future implications. Environ. Int. 2019, 129, 273–278. [Google Scholar] [CrossRef] [PubMed]
  61. Wang, Y.; Chen, X. River chief system as a collaborative water governance approach in China. Int. J. Water Resour. Dev. 2019, 36, 610–630. [Google Scholar] [CrossRef]
  62. Harrell, M.C.; Bradley, M.A. Data Collection Methods. Semi-Structured Interviews and Focus Groups; RAND National Defense Research Institute: Santa Monica, CA, USA, 2009. [Google Scholar]
  63. Chang, P.-L.; Hsu, C.-W.; Chang, P.-C. Fuzzy Delphi method for evaluating hydrogen production technologies. Int. J. Hydrog. Energy 2011, 36, 14172–14179. [Google Scholar] [CrossRef]
  64. Barzekar, G.; Aziz, A.; Mariapan, M.; Ismail, M.H. Delphi Technique for Generating Criteria and Indicators in Monitoring Ecotourism Sustainability in Northern Forests of Iran: Case Study on Dohezar and Sehezar Watersheds. Folia For. Pol. Ser. A 2011, 53, 130–141. [Google Scholar]
  65. Ishikawa, A.; Amagasa, M.; Shiga, T.; Tomizawa, G.; Tatsuta, R.; Mieno, H. The max-min Delphi method and fuzzy Delphi method via fuzzy integration. Fuzzy Sets Syst. 1993, 55, 241–253. [Google Scholar] [CrossRef]
  66. Manakandan, S.K.; Rosnah, I.; Mohd, R.J.; Priya, R. Pesticide Applicators Questionnaire Content Validation: A Fuzzy Delphi Method. Med. J. Malays. 2017, 72, 228–235. [Google Scholar]
  67. Bui, T.D.; Tsai, F.M.; Tseng, M.-L.; Ali, M.H. Identifying sustainable solid waste management barriers in practice using the fuzzy Delphi method. Resour. Conserv. Recycl. 2019, 154, 104625. [Google Scholar] [CrossRef]
  68. Bouzon, M.; Govindan, K.; Rodriguez, C.M.; Campos, L.M.S. Identification and analysis of reverse logistics barriers using fuzzy Delphi method and AHP. Resour. Conserv. Recycl. 2016, 108, 182–197. [Google Scholar] [CrossRef]
  69. Ocampo, L.; Ebisa, J.A.; Ombe, J.; Escoto, M.G. Sustainable ecotourism indicators with fuzzy Delphi method—A Philippine perspective. Ecol. Indic. 2018, 93, 874–888. [Google Scholar] [CrossRef]
  70. Ismail, N.K.; Mohamed, S.; Hamzah, M.I. The Application of the Fuzzy Delphi Technique to the Required Aspect of Parental Involvement in the Effort to Inculcate Positive Attitude among Preschool Children. Creat. Educ. 2019, 10, 2907–2921. [Google Scholar] [CrossRef] [Green Version]
  71. Mohamad, S.N.A.; Embi, M.A.; Nordin, N. Determining e-Portfolio Elements in Learning Process Using Fuzzy Delphi Analysis. Int. Educ. Stud. 2015, 8, 171–176. [Google Scholar] [CrossRef]
  72. Olawumi, T.O.; Chan, D.W. Critical success factors for implementing building information modeling and sustainability practices in construction projects: A Delphi survey. Sustain. Dev. 2019, 27, 587–602. [Google Scholar] [CrossRef]
  73. Dawood, K.A.; Sharif, K.Y.; Ghani, A.A.; Zulzalil, H.; Zaidan, A.; Zaidan, B. Towards a unified criteria model for usability evaluation in the context of open source software based on a fuzzy Delphi method. Inf. Softw. Technol. 2020, 130, 106453. [Google Scholar] [CrossRef]
  74. Mesa-Pérez, E.; Berbel, J. Analysis of Barriers and Opportunities for Reclaimed Wastewater Use for Agriculture in Europe. Water 2020, 12, 2308. [Google Scholar] [CrossRef]
  75. Shen, K.-W.; Li, L.; Wang, J.-Q. Circular Economy Model for Recycling Waste Resources Under Government Participation: A Case Study in Industrial Waste Water Circulation in China. Technol. Econ. Dev. Econ. 2019, 26, 21–47. [Google Scholar] [CrossRef]
  76. Mukherjee, M.; Jensen, O. Making Water Reuse Safe: A Comparative Analysis of the Development of Regulation and Technology Uptake in the Us and Australia. Saf. Sci. 2020, 121, 5–14. [Google Scholar] [CrossRef]
  77. Outwater, A.B. Reuse of Sludge and Minor Wastewater Residuals; CRC Press: Boca Raton, FL, USA, 2020. [Google Scholar]
  78. Navarro, T. Water reuse and desalination in Spain—Challenges and opportunities. J. Water Reuse Desalination 2018, 8, 153–168. [Google Scholar] [CrossRef] [Green Version]
  79. Tenopir, C.; Allard, S.; Douglass, K.; Aydinoglu, A.U.; Wu, L.; Read, E.; Manoff, M.; Frame, M. Data Sharing by Scientists: Practices and Perceptions. PLoS ONE 2011, 6, e21101. [Google Scholar] [CrossRef] [Green Version]
  80. Bell, S.J. Frameworks for urban water sustainability. Wiley Interdiscip. Rev. Water 2020, 7, e1411. [Google Scholar] [CrossRef]
  81. Ranta, V.; Aarikka-Stenroos, L.; Mäkinen, S.J. Creating value in the circular economy: A structured multiple-case analysis of business models. J. Clean. Prod. 2018, 201, 988–1000. [Google Scholar] [CrossRef]
  82. Sgroi, M.; Vagliasindi, F.G.; Roccaro, P. Feasibility, Sustainability and Circular Economy Concepts in Water Reuse. Curr. Opin. Environ. Sci. Health 2018, 2, 20–25. [Google Scholar] [CrossRef]
  83. Gude, V.G. Desalination and water reuse to address global water scarcity. Rev. Environ. Sci. Bio/Technol. 2017, 16, 591–609. [Google Scholar] [CrossRef]
  84. Singh, A.; Sawant, M.; Kamble, S.J.; Herlekar, M.; Starkl, M.; Aymerich, E.; Kazmi, A. Performance evaluation of a decentralized wastewater treatment system in India. Environ. Sci. Pollut. Res. 2019, 26, 21172–21188. [Google Scholar] [CrossRef]
  85. Yulistyorini, A.; Camargo-Valero, M.A.; Sukarni, S.; Suryoputro, N.; Mujiyono, M.; Santoso, H.; Rahayu, E.T. Performance of Anaerobic Baffled Reactor for Decentralized Wastewater Treatment in Urban Malang, Indonesia. Processes 2019, 7, 184. [Google Scholar] [CrossRef] [Green Version]
  86. Murashko, K.; Nikku, M.; Sermyagina, E.; Vauterin, J.J.; Hyppänen, T.; Vakkilainen, E.; Pyrhönen, J. Techno-Economic Analysis of a Decentralized Wastewater Treatment Plant Operating in Closed-Loop. A Finnish Case Study. J. Water Process. Eng. 2018, 25, 278–294. [Google Scholar] [CrossRef]
  87. Zhejiang Provincial Government. Press Conference of Zhejiang Provincial People’s Government Portal “Zhejiang Internet Development Report 2020”. Available online: http://www.zj.gov.cn/col/col1229536499/index.html (accessed on 9 August 2021).
  88. Fan, Y.; Fang, C. Circular Economy Development in China-Current Situation, Evaluation and Policy Implications. Environ. Impact Assess. Rev. 2020, 84, 106441. [Google Scholar] [CrossRef]
  89. Govindan, K.; Hasanagic, M. A systematic review on drivers, barriers, and practices towards circular economy: A supply chain perspective. Int. J. Prod. Res. 2017, 56, 278–311. [Google Scholar] [CrossRef]
Figure 1. Research process.
Sustainability 13 11868 g001
Figure 2. The location of the case study area.
Sustainability 13 11868 g002
Table 1. Triangular fuzzy linguistic Likert scale.
Linguistic ParameterDescriptionFuzzy Scale
Strongly disagreeI strongly disagree that this item is a barrier to implementing CE in the smart water management in this district.(0, 0, 0.1)
Mostly DisagreeI mostly disagree that this item is a barrier to implementing CE in the smart water management in this district.(0, 0.1, 0.3)
Slightly disagreeI slightly disagree that this item is a barrier to implementing CE in the smart water management in this district.(0.1, 0.3, 0.5)
UndecidedI am undecided whether this item is a barrier to implementing CE in the smart water management in this district.(0.3, 0.5, 0.7)
Slightly agreeI slightly agree that this item is a barrier to implementing CE in the smart water management in this district.(0.5, 0.7, 0.9)
Mostly AgreeI mostly agree that this item is a barrier to implementing CE in the smart water management in this district.(0.7, 0.9, 1.0)
Strongly agreeI strongly agree that this item is a barrier to implementing CE in the smart water management in this district.(0.9, 1.0, 1.0)
Source: adapted from Ismail, et al. [70], p. 2910.
Table 2. Frequency of participant’s background and experience.
VariablesFrequencyPercentage
FieldCivil engineering and construction210%
Information transmission, software, and information technology services15%
Water conservancy, environment, and public facilities management1886%
OccupationScientists210%
Managers of agencies and institutions1362%
Senior and mid-level managers of large and medium-sized enterprises210%
Technicians and associate professionals419%
Years of experience5 to 10 years1048%
10 to 15 years524%
More than 15 years629%
Table 3. Aggregate fuzzy judgment.
BarrierTriangular Fuzzy NumberDefuzzificationSelection
Result
Sensitive Analysis Result
a j b j c j W ˜ j α = 0.6052 α 1 = 0.5552 α 2 = 0.6552
A—Infrastructural and economic barriers
A010.30.779601.00.69320AcceptedAcceptedAccepted
A020.00.601901.00.53397
A030.00.702551.00.56752
A040.00.626441.00.54215
A050.10.733451.00.61115AcceptedAccepted
A060.00.651601.00.55053
A070.10.739711.00.61324AcceptedAccepted
A080.30.777191.00.69240AcceptedAcceptedAccepted
A090.00.761561.00.58719
A100.10.757781.00.61926AcceptedAccepted
A110.10.716941.00.60565AcceptedAccepted
A120.00.523791.00.50793
B—Technological barriers
B010.00.585521.00.52851
B020.00.540131.00.51338
B030.00.580451.00.52682
B040.30.735591.00.67853AcceptedAcceptedAccepted
B050.30.760281.00.68676AcceptedAcceptedAccepted
B060.30.731201.00.67707AcceptedAcceptedAccepted
B070.30.766461.00.68882AcceptedAcceptedAccepted
B080.00.658151.00.55272
B090.30.788981.00.69633AcceptedAcceptedAccepted
B100.00.403321.00.46777
B110.30.781861.00.69395AcceptedAcceptedAccepted
B120.30.668941.00.65631AcceptedAcceptedAccepted
B130.30.699041.00.66635AcceptedAcceptedAccepted
B140.00.597281.00.53243
C—Institutional and governance barriers
C010.30.821151.00.70705AcceptedAcceptedAccepted
C020.00.660601.00.55353
C030.00.699711.00.56657
C040.00.684751.00.56158
C050.30.764101.00.68803AcceptedAcceptedAccepted
C060.30.729791.00.67660AcceptedAcceptedAccepted
C070.10.730211.00.61007AcceptedAccepted
C080.10.742011.00.61400AcceptedAccepted
C090.10.724461.00.60815AcceptedAccepted
C100.10.695811.00.59860
C110.00.405941.00.46865
C120.00.632161.00.54405
C130.00.689531.00.56318
C140.30.787311.00.69577AcceptedAcceptedAccepted
C150.00.616951.00.53898
C160.30.767211.00.68907AcceptedAcceptedAccepted
Threshold value 0.6052
Table 4. Rejected barriers.
BarriersResults
A02High degree of inequality in citizens’ education, income, skills etc.Rejected0.53397
A03Lack of support from public fundsRejected0.56752
A04Unclear economic benefit of digital and CE investmentsRejected0.54215
A06Higher price of recycled materials and reclaimed water than the virgin in the marketRejected0.55053
A09Lack of monitoring and alert system coverage or not a reliable systemRejected0.58719
A12Lack of proper treatment equipment in the wastewater treatment plantsRejected0.50793
B01Lack of openness of dataRejected0.52851
B02Lack of accessibility of dataRejected0.51338
B03Lack of information or the ambiguities regarding what information is required by who Rejected0.52682
B08Lack of access to technology to majority of citizens and institutionsRejected0.55272
B10potential negative environmental impacts from CE technologiesRejected0.46777
B14Poor data availability and scalability regarding CE in water sectorRejected0.53243
C02Lack of regulations, standard and quality indicators for the CE and the reclaimed water & sludgeRejected0.55353
C03Lack of political will, commitment, and management support to CE from the higher authoritiesRejected0.56657
C04Difficulty in making the right decision to implement CE in the most efficient wayRejected0.56158
C10Not attractive for industryRejected0.59860
C11Employment disruptionsRejected0.46865
C12Lack of transparency and liability of the government Rejected0.54405
C13Low social acceptance, poor public perception, and motivation to using recovered water/materialRejected0.56318
C15Low community awareness of digitalized water management Rejected0.53898
Table 5. Accepted barriers after FDM.
BarrierDescriptionsScoreRank
C01Lack of acknowledgement of the decentralized sanitation system importance Decentralized wastewater treatment technology can be used as a beneficial and necessary supplement to centralized sewage treatment technology. At present, the government and enterprises do not know enough about the importance of decentralized sewage treatment technology, resulting in the overall low level of sewage treatment and the recycling rate.0.7071
B09Lack of viable options for recovered water/nutrients/energy utilizationThe lack of viable reuse options of treated wastewater, nutrients, and energy sources recovered from wastewater and sludge make the CE concept less attractive to investors.0.6962
C14Lack of awareness among the citizens about the environmental issues and the benefit of CEThe public lacks background knowledge related to sewage treatment and the CE, cannot understand the problems involved in sewage treatment, does not understand the energy-saving, environmental protection, and health benefit that CE can provide, resulting in the public’s lack of enthusiasm to participate in CE adoption.0.6963
B11Lack of experience leader and successful reference projects, poor leadership, and management towards CELack of leaders with extensive relevant work experience and references to successful projects in the field of smart water treatment and wastewater recycling, leading to insufficient manager’s leadership and management of the project.0.6944
A01Unbalanced geographical developmentThe imbalance in geographical development has resulted in the conditional recycling and digital transformation of limited regions and makes the CE implementation throughout the country difficult.0.6935
A08Lack of wastewater collection systems and infrastructureSewage network coverage is incomplete, and the construction or reconstruction of the pipe networks is difficult, failing to collect wastewater.0.6926
B07Unclear vision in CE, IT management and digital operationsWithout a clear vision of smart water and the CE, the direction of development of the wastewater industry and digital transformation is blurred, resulting in a lack of direction and inaction.0.6898
C16Lack of involvement of citizens and stakeholder cooperationThe public participation in wastewater treatment in the region is not high, and the lack of coordination and cooperation among stakeholders (e.g., governments, institutions, public and groups, relevant enterprises, academics, etc.) hinders the process of resource recovery from wastewater and sewage sludge.0.6897
C05The lack of a smooth and efficient electronic water management system has led to multiple leaders among various departments and slow progress in work.The lack of a smooth and efficient digitalized water management system leads to the existence of long-headed leadership among departments and low efficiency.0.6889
B05Data uncertainty and the lack of accuracy and reliability of data analysisThe collected data are unreliable and lack authenticity, completeness, and validity. The data analysis results (such as alarm, result evaluation, cause analysis, future prediction, etc.) are not accurate or reliable, hindering the transformation and development of sewage treatment from traditional water management to smart water treatment.0.68710
B04Data privacy and data security issuesWith the widespread use of various government mobile applications, concerns about network security and data security become more evident. Many citizens’ awareness of data privacy security is waking up to a growing reluctance to sacrifice personal information for conveniency.0.67911
B06Lack of knowledge management systemsThere is no effective knowledge management system that can store information, sharing them, and discovery new knowledge. It results in the loss of collected information, and cannot promote the learning, sharing, training, reuse, and innovation of knowledge.0.67712
C06No existence of water scarcity in the regionThe water scarcity in this area is not serious, which leads to the lack of necessity and urgency in the promotion of water reuse and CE transformation.0.67713
B13Lack of expertise, knowledge and skilled manpower in IT and CE Lack of skilled workforces in resource recovery from wastewater and sludge or digital technology, that have a certain degree of professional knowledge to independently use tools and equipment. 0.66614
B12Lack of technological knowledge, design, and operation experience among the planners for CEManagers responsible for developing CE and smart water management plans do not understand relevant technologies, do not have relevant design and operational experience, resulting in unrealistic planning and inefficient guidance for the implementation.0.65615
A10Lack of internet coverage and IT facilities, reliable IoT and BDA infrastructure and intelligenceLack of internet coverage and inadequate infrastructure of big data or IoT is hindering the implementation.0.61916
C08Higher priority of other issues or requirementsCompared with the resource recovery from wastewater and sludge, other problems or challenges have a higher priority in the water sector, resulting in insufficient attention and support for the CE implementation.0.61417
A07Significant leakages in water distribution networksSignificant leakages from the drainage and wastewater collection networks have led to low wastewater collection rates.0.61318
A05High short-term costs and low short-term economic benefitsThe short-term investment in smart water management and the CE is very high. The short-term economic benefits are low, resulting in low motivation to invest in and develop related industries.0.61119
C07Other solutions might be more favourable than implementing CEOther solutions, such as post-treatment discharge, are more popular than implementing CE concepts, resulting in insufficient attention and support for the implementation.0.61020
C09Lack of coordination/communication between operational networks, with the consumers, and with the government departmentInadequate communication and collaboration between the participants in the water and wastewater sector, between government departments and with information technology service operators has resulted in restricted synergies to improve work and administrative efficiency.0.60821
A11Lack of infrastructure to distribute reclaimed water and underdeveloped supply chain of recovered materialsBuilding new reclaimed water distribution networks is expensive and difficult to implement, resulting in recycled water not being delivered to users.0.60622
Publisher’s Note: MDPI stays neutral with regard to jurisdictional claims in published maps and institutional affiliations.

