Article

Hydro-Economic Water Allocation Model for Water Supply Risk Analysis: A Case Study of Namhan River Basin, South Korea

Department of Civil Engineering, Kyung Hee University, 1732, Deogyeong-daero, Giheung-gu, Yongin-si, Gyeonggi-do 17104, Korea
*
Author to whom correspondence should be addressed.
Sustainability 2021, 13(11), 6005; https://doi.org/10.3390/su13116005
Submission received: 31 March 2021 / Revised: 18 May 2021 / Accepted: 23 May 2021 / Published: 26 May 2021

Abstract

:
Rational water resource management is used to ensure a stable supply of water by predicting the supply of and demand for future water resources. However, rational water allocation will become more difficult in the future owing to the effects of climate change, causing water shortages and disputes. In this study, an advanced hydro-economic water allocation and management model (WAMM) was introduced by improving the optimization scheme employed in conventional models and incorporating the economic value of water. By relying upon economic valuation, the WAMM can support water allocation efforts that focus not only on the stability but also on the economic benefits of water supply. The water supply risk was evaluated following the different objective functions and optimization methods provided by the WAMM using a case study of the Namhan River basin in South Korea under a climate change scenario over the next 30 years. The water shortages and associated economic damage were compared, and the superior ability of WAMM to mitigate future water shortages using economic valuation and full-step linear programming (FSLP) optimization was demonstrated. It is expected that the WAMM can be applied to help resolve water shortages and disputes among river basin units under severe drought conditions.

1. Introduction

Water resources are essential for human life and should be stably secured and rationally allocated. According to the World Bank [1], water resource management (WRM) refers to a series of processes, including planning, developing, and managing water resources, related to both water quantity and quality, and across all water uses by consumers. UNESCO [2] reported that global water consumption is expected to increase gradually because of population growth and lifestyle changes, while conflicts over water are expected to intensify owing to climate change (e.g., during times of frequent drought and limited water supply in some areas). According to Adetoro et al. [3], many studies have been conducted worldwide to mediate water disputes from social and engineering perspectives. Such studies include various types of water allocation models presented as a part of engineering solutions to these disputes. The primary objective of a water allocation model is to present the most efficient supply plan for limited water resources according to the priorities or water rights of various water demand sectors. These demand sectors account for municipal, agricultural, and industrial water usage. The allocation results may differ in terms of fairness, economic feasibility, or social importance. The utilization of water allocation models has evolved with their complexity, from early models allocating water resources based on quantitative efficiency to hydro-economic models seeking to maximize socio-economic benefits.
Major studies related to the development and utilization of water allocation models include the introduction of one of the earliest models, MITSIM (Massachusetts Institute of Technology River Basin Simulation Model), by Strzepek and Lenton [4]. Subsequently, Strzepek [5] improved the water allocation simulation function and used it to evaluate the stability of agricultural water supply in the Swedish South-Western Skane Basin. Shafer and Labadie [6] developed the MODSIM (Modified SIMYLD) model, another typical early water allocation model. Later, optimal water allocation models equipped with optimization modules based on linear programming or quadratic programming were developed to maximize water allocation efficiency. Such models include the AQUATOOL, developed by Andreu et al. [7], and the water evaluation and planning system (WEAP), initiated by Raskin et al. [8] and further developed by Yates et al. [9], to provide enhanced user-friendliness. In terms of quantitative water management, the AQUARIUS model developed by Diaz et al. [10] is considered a representative optimal water allocation model for the maximization of water supply reliability and minimization of water shortages. Notably, the WEAP model was incorporated into the Korea-water evaluation and planning system (K-WEAP) model to strengthen its applicability in Korea and has been utilized in various nationwide water management plans [11]. In addition, the Riverware model developed by Zagona et al. [12] further enhanced the optimal water allocation model using an optimization system based on a prioritized set of objectives implemented by linear pre-emptive goal programming. The California value integrated network (CALVIN) model developed by Howitt et al. [13] is a critically important, globally well-known, hydro-economically integrated model that considers not only the water requirements in its optimal solution but also the economic value of water resources based on data collected over 50 years in California, USA. The CALVIN water allocation model has been mainly used to inform water supply plans that minimize water supply costs and maximize the associated economic benefits. Newlin et al. [14] and Pulido-Velazquez et al. [15] presented various possibilities for utilizing the CALVIN model to establish state-wide water resources plans in southern California.
The environmental functions of water resources were divided into regulation, habitat, production, and information by Costanza et al. [16] and de Groot et al. [17]. As reported by UNSD (United Nations Statistics Division) [18], the economic valuation of water resource services is challenging; therefore, numerous researchers have attempted to define their economic value based on measurable variables such as changes in quantity (e.g., supply and regulation), quality (e.g., treatment and generation), ecological services (e.g., refugia and pollination), and cultural features (e.g., recreation). However, since the economic value of water resources mainly depends on national and regional policies and environments, their value may be quantified based on the conditions in the area of interest and period. For instance, many different water resource valuation studies have been conducted in South Korea. Hwang et al. [19] calculated the potential value of groundwater for drought preparation using the contingent valuation method (CVM). Park et al. [20] evaluated the economic value of rainfall in the spring season in terms of dam reservoir water resource utilization during droughts. Moreover, a study by K-water [21] employed various methods to quantitively evaluate the overall value of South Korea’s water resources. The K-water study calculated the municipal water supply benefit (based on the willingness to pay, and investigated using the CVM), the industrial water supply benefit (based on the value of the marginal product (VMP) and estimated using the production function of major industrial sectors), and the agricultural water supply benefit (based on a farm crop budget analysis). Lim and Lee [22] presented the agricultural water supply benefit based on the estimated VMP of rice crops in South Korea. Since 2011, the Korea Environment Institute (KEI) has organized, classified, and presented various valuation cases for water resources using the environmental valuation information system (EVIS) [23].
Climate change represents an environmental factor that has a direct impact on the security of water resources. Numerous climate change scenarios have been created globally using various general circulation models (GCMs) to predict rainfall, temperature, and humidity. Using data from these models, multiple studies have predicted the damage arising from potential water shortages due to climate change. Krol et al. [24] developed and applied a model to explain the relationship between climate change and water use, focusing on agriculture in northeast Brazil. Ray et al. [25] and Ashofteh et al. [26] analyzed the water supply risk by applying long-term climate change scenarios to water supply networks. Liu et al. [27] and Basupi and Kapelan [28] compared water shortages under different climate change conditions and suggested a plan for utilizing decision-making tools and a framework to establish an optimal water supply strategy.
Here, a new hydro-economic water allocation model was examined, the water allocation and management model (WAMM), developed by Jeong et al. [29]. Equipped with an advanced optimization module, the WAMM provides enhanced functionality compared with conventional models and incorporates the economic value of water to optimize water allocation. In this case study, the WAMM was applied to the Namhan River basin in South Korea for long-term (30-year) water allocation planning using a future climate change scenario; the water allocation results obtained according to various water supply objectives and optimization methods were compared.
The remainder of this paper is structured as follows. Section 2 introduces and provides details of the WAMM, including the improved optimization algorithm and calculation of the economic value of water resources. It also introduces the process used to establish the climate change scenarios. Section 3 introduces the case study river basin and summarizes the economic value of the water resources in the study area, as well as the relevant climate change scenarios. Section 4 quantitatively compares and analyzes the simulation results of the WAMM according to the type of optimization method and objective function applied. Finally, Section 5 presents the conclusions and plausible future studies.

2. Materials and Methods

A water allocation model is an engineering support tool that can facilitate the rational establishment of a water supply and demand plan within a given river basin. Figure 1 illustrates a simplified river basin in which municipal, industrial, agricultural water demands, and the maintenance flow rate are collected from the mainstream. The water flows in the river and the water storage in reservoirs are controlled by dams. The flow rate of the river and the water available in reservoirs can be estimated based on the water resources available within the relevant basin. Then, the actual available supply that can be supplied to demand sites is determined based on river maintenance flow and restricted water storage capacity in reservoirs. A water allocation plan becomes important when the available water supply does not meet the demand and needs to be determined by considering the importance, water rights, and economic feasibility of each demand site.
The WAMM was developed based on components and input data similar to those of the K-WEAP model that is currently utilized to generate water allocation plans in South Korea. It is equipped with a graphical user interface (GUI) for user convenience, and the water supply system components and input data are provided through a dedicated input module in the form of an Excel spreadsheet. Figure 2a shows the datasheet of the input module and user-interface screens in the WAMM. The WAMM manages water allocation simulations as an individual project that includes all the specifications of system components, operational information, and simulation results needed for establishing a water supply plan. Figure 2b illustrates the control panel for the water allocation strategies and results analysis screens. Notably, the WAMM also provides an advanced optimization module that enables users to select optimization methods and objective functions to apply. The structure of the improved linear programming-based optimization module contained within the WAMM, as well as the development of a water allocation strategy that considers both the reliability and economic benefits of the water supply are described in detail in the next section.

2.1. Full-Step Linear Programming (FSLP) in the WAMM

It was relatively simple to establish a water supply plan in the past. However, as the number and complexity of the factors that must be considered have increased, the importance of water allocation plans and the role of related models have gradually increased as well. As discussed in Section 1, the majority of conventional water allocation models rely on optimal water allocation based on linear programming (LP), such as the AQUATOOL [7] and WEAP [8] models, or quadratic programming (QP), such as the AQUARIUS [10] model. As a mathematical optimization method providing a global optimal solution, LP is still widely used, despite only being applicable to problems with objectives and constraints that can be formulated as linear functions.
In optimization problems such as water resource planning and allocation, the minimization of costs and maximization of benefits, or the maximization of target performance, are used as objective functions. In the previously described K-WEAP model, the maximization of water reliability (defined as the ratio of water supply to water demand) is used as an objective function. In the K-WEAP model and the WAMM, a function setting the water supply priority for each demand site is provided to reflect the importance of water use. This can be simply expressed as an objective function that maximizes the reliability of water supply based on a set of weighted values as follows:
M a x i m i z e :   R e l i a b i l i t y = i = 1 N d W i S i D i ,    subject   to :   S i D i
where Nd is the number of demand sites in the basin, Wi is the weight according to the priority of demand site i, Si is the water supplied to demand site i (m3), and Di is the water demand of demand site i (m3).
For the hydro-economic water allocation model, which allocates water by taking into account the economic value of supplied water, optimization to maximize benefits can be performed by setting the economic value as an objective function. In this study, the economic objective function can be formulated to maximize the benefits of the water supply by weighting the water resources in terms of the economic value of the unit water supply as follows:
M a x i m i z e :   B e n e f i t = i = 1 N d V i   S i ,    subject   to :   S i D i
where Vi is the economic benefit in Korean Won (KRW) of the supplied water to the demand site i (KRW/m3). Note that 1000 KRW can be approximated as 1 US dollar.
To establish a rational water supply plan, various socio-economic impacts must be considered using different types of objective functions. Here, two objective functions were constructed and implemented to facilitate optimal water allocation in the WAMM: (1) the reliability (stability) of the water supply (Equations (1)) and (2) the economic benefits of the water supply (Equation (2)).
Traditional water allocation models typically utilize single-step linear programming (SSLP) to optimize the water allocation for each simulation time step. As indicated in Figure 3a, a separate optimization is sequentially performed along the simulation time period, in which the allocation results (e.g., individual supply from source to demand and reservoir storage) of the previous time step are provided as initial values in the subsequent simulation time step. However, this sequential approach has a drawback as the decisions made in the earlier time step cannot be modified, resulting in a potential water shortage in subsequent time steps. Therefore, the WAMM uses full-step linear programming (FSLP) to optimize the entire simulation period at once, mitigating such limitations. As shown in Figure 3b, water allocations over the entire simulation periods were determined simultaneously through a single optimization run. This made it possible to allocate water such that the shortage occurring over the entire simulation period was minimized, realizing water allocations that actively and flexibly responded to changing environments.
For this flexible response, the reliability and benefits of the water supply were calculated for the entire simulation period and not the unit simulation period. Hence, the modified forms of the objective functions for FSLP are as follows:
M a x i m i z e :   R e l i a b i l i t y = t = 1 T i = 1 N d W i S i , t D i ,   t ,    subject   to :   S i , t D i ,   t
M a x i m i z e :   B e n e f i t = t = 1 T i = 1 N d V i   S i , t ,    subject   to :   S i , t D i ,   t
where T is the total number of simulation periods in which water is allocated, Si,t is the water supplied to demand site i at simulation time t (m3), and Di,t is the water demand of demand site i at simulation time t (m3).

2.2. Economic Valuation of Water Resources in the WAMM

The value of a resource can be defined as the monetary value of the benefit or loss arising from its presence or absence, or a change in its state. In particular, water resources have the characteristics of public goods and behave differently from goods in the general market economy, making it difficult to devise an effective valuation method. Accordingly, the WAMM employed the results of previous studies that evaluated and applied the economic value of water resources for economic analysis as follows.
To estimate the economic value of municipal water, K-water [21] calculates the benefit of municipal water supplied to the user by estimating the user’s willingness to pay (WTP) for unit demand. The WTP indicates how much value the consumer places on a particular product. In this study, the water supply benefit of municipal water was calculated using the measured WTP and the estimated demand function from the K-water study [21]. Here, the demand function defines the relationship between price and demand to represent the change in the quantity of a product the consumer intends to purchase according to the price of the product. In general, when other supply conditions are the same, the curve of the demand function gradually decreases with increasing price.
To estimate the economic value of municipal water in Korea, the reduction in water consumption corresponding to an increase in water price was first investigated based on the maximum WTP for municipal water demand using a consumer survey. Then, the final supply benefit function was derived by calculating the market demand function reflecting the individual responses in the form of the WTP. In this study, the dependent variable of the supply benefit function is the WTP for municipal water (i.e., the value of unit municipal water). The average monthly water demand per person, average monthly income per person, and the number of persons for each household were selected as explanatory variables. Hence, the linear municipal water supply benefit function can be expressed as
P M = α 0 + α 1 Q + α 2 I + α 3 F + ϵ
where PM is the value of unit municipal water per person, measured as the WTP (KRW/m3/person); Q is the average monthly demand for municipal water per person (m3/month/person); I is the average monthly income per person (KRW/month/person); F is the number of persons per household; α 0 ,   α 1 ,   α 2 , and α 3 are the coefficients of the regression equation; and ϵ is the error variable of the regression equation.
After excluding the income variable from Equation (5) through a t-test, K-water [21] derived the supply benefit function for municipal water by performing a regression analysis based on the historical data and yielded:
P M = 516.336 2.716 Q + 65.137 F
To estimate the economic value of industrial water in Korea, K-water [21] calculated the marginal product output according to the industrial water supply for a given production function. The production function is a mathematical representation of the relationship between input sources and output values of industrial products. K-water [21] expressed this function using the Cobb–Douglas production function estimation method with the production value as a dependent variable, while the input labor, manufacturing cost, amount of tangible fixed assets at year-end, and water supply were taken as explanatory variables, as follows:
ln P I = ln β 0 + β 1 ln L + β 2 ln W I + β 3 ln M I + β 4 ln K
where PI is the production value of industrial products (KRW); L is the number of workers (person); WI is the industrial water supply quantity (m3); MI is the unit manufacturing cost (KRW/unit product); K is the balance of tangible assets at the end of the year (KRW/year); and β 0 ,   β 1 ,   β 2 , and β 3 are the coefficients of the regression equation.
A regression analysis of the average technical statistics for all industrial sectors surveyed by the National Water Resources Plan 2011–2020 of South Korea [30] resulted in the following industrial water production function:
ln P I = 2.02 + 0.73 ln L + 0.05 ln W I + 0.27 ln M I + 0.05 ln K
Thus, the value of unit industrial water (KRW/m3) can be calculated by dividing the calculated production value of industrial products determined using Equation (8) with the quantity of industrial water supplied.
To estimate the economic value of agricultural water in Korea, Lim and Lee [22] calculated its economic benefits based on a production function correlating the agricultural water input with the annual rice production. This process was the same as that used to analyze the VMP of industrial water. Lim and Lee [22] expressed the economic value of agricultural water using the Cobb–Douglas production function estimation method based on the production value of rice as a dependent variable and the total agricultural water supply, agricultural management cost, irrigated farmland area, and drought year correction coefficient as explanatory variables as follows:
ln P A = ln γ 0 + γ 1 ln A + γ 2 ln W A + γ 3 ln M A + γ 4 D
where PA is the production value of rice (KRW); A is the area of irrigated farmland (1000 ha); WA is the agricultural water supply quantity (million m3); MA is the agricultural management cost (KRW); D is the drought year correction coefficient; and γ 0 ,   γ 1 ,   γ 2 , and γ 3 are the coefficients of the regression equation.
A regression analysis of the total amount of rice production and agricultural infrastructure status in South Korea over 35 years was then applied to obtain the agricultural water production function:
ln P A = 2.97 + 0.10 ln A + 0.28 ln W A + 0.36 ln M A + 0.18 D
Thus, the value of unit agricultural water (KRW/m3) can be calculated by dividing the calculated production value of rice determined using Equation (10) with the quantity of agricultural water supplied.
The economic value of various water uses, determined according to the methods described above, can be used to quantify the direct benefit generated from the water supply for each sector. Therefore, in the event of a water supply shortage, the potential economic damage in each demand sector can be calculated and water can be allocated accordingly to minimize overall economic loss (or to maximize overall economic benefit).

2.3. Climate Change Scenarios

2.3.1. Changes in Water Supply

Cho et al. [31] analyzed 52 GCMs (including the Representative Concentration Pathway (RCP) 4.5 and 8.5 scenarios) and evaluated their fitness for application in South Korea through the climate change adaptation for water resources (CCAW) research project of South Korea. Seventeen GCMs were evaluated as having better availability based on their standardized skill scores and were divided into wet, average, and dry scenarios. In the present research, the RCP 8.5 climate change scenario was selected. This scenario is generated from the Hadley Center Global Environment Model version 2 Atmosphere Ocean (HadGEM2-AO) [32] and is the most suitable scenario for representing typical climate change in the study area [31].
Meteorological information, such as daily precipitation and temperature for the next 30 years, were provided from the model, and the river basin flow was estimated using rainfall-runoff models, such as the Hydrological Simulation Program-FORTRAN (HSPF) [33], Soil and Water Assessment Tool (SWAT) [34], and Precipitation-Runoff Modeling System (PRMS) [35], based on meteorological information in South Korea [36]. Lee et al. [36] applied the three rainfall-runoff models to the four biggest river basins in South Korea and reported that the PRMS model is the most suitable for the Han River basin. Therefore, using the pentad (5-day) averaged flow rate resulting from the PRMS model, the river basin flow according to climate change in the case study basin was estimated and applied as input to the WAMM. Note that the river basin flow represents the available water resources in the study basin.

2.3.2. Changes in Water Demand

Agricultural demand, municipal/industrial (combined) demand, and river maintenance flow are considered water demand sectors in the WAMM. Based on the water demand in 2015, in this study, the changes in population and farmland over the next 30 years were applied, as suggested by the Korea Statistical Yearbook [37], as well as the population projections by province [38], to the water demand change scenario. Based on farmland area statistics in the study area in 2015–2020, farmland area was extrapolated from 2015 to 2045, with a gradual decrease of 15%. Conversely, according to national population projections by province [38], the population in the study area is expected to increase by 12.8% from 2015 to 2036, then decrease by 2.2% from 2036 to 2045. Furthermore, three long-term water demand projections (low demand, average demand, and high demand) were suggested by the National Water Resources Plan 2011–2020 of South Korea (MLTM, Ministry of Land, Transport and Maritime Affairs) [30] to account for the uncertainty of water supply conditions. According to the high demand projection [30], municipal, industrial, and agricultural water demands are expected to increase by 0.66%, 11.07%, and 4.85%, respectively. In the present study, among the three demand projections, the high demand condition was adopted with farmland area and population trends for the estimation of municipal, industrial, and agricultural water demands, for use as WAMM inputs.

3. Case Study

3.1. Application Area (Namhan River Basin, South Korea)

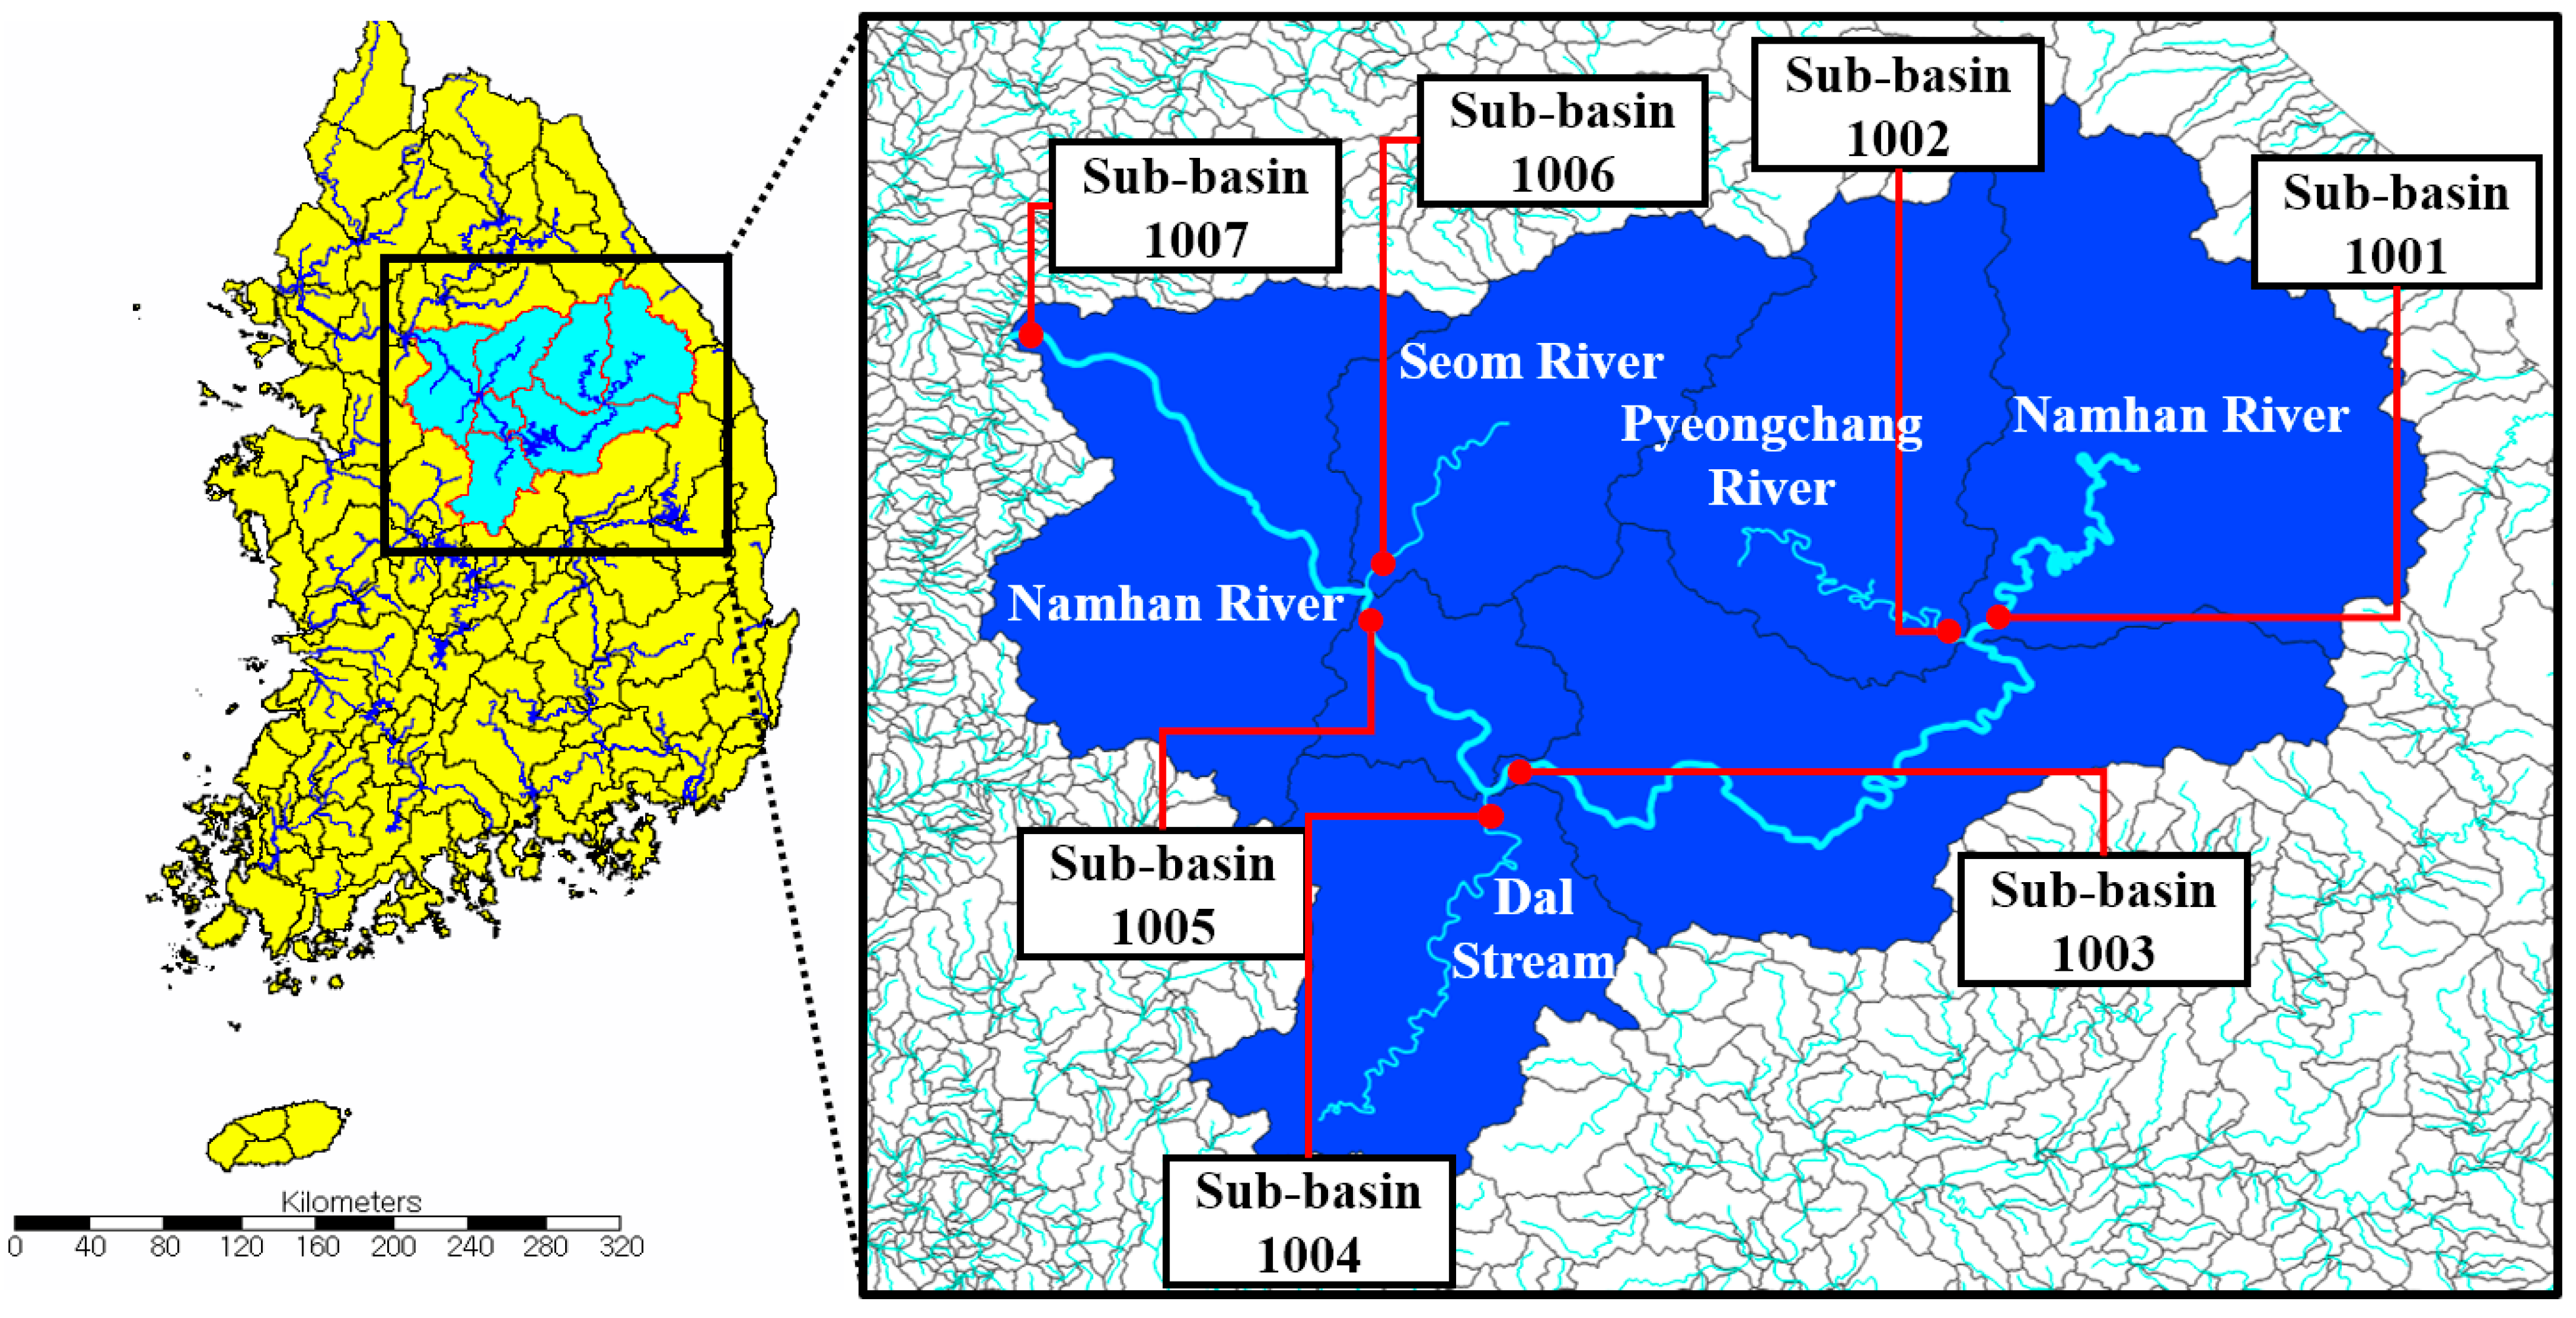
Figure 4 shows the case study area, the Namhan River basin in South Korea, in which approximately 1.5 million people live (investigated in the year 2018), including seven rural sub-basins, to which WAMM performance was applied and analyzed under the climate change scenarios. The total length and area of the river basin are 375 km and 12,407 km2 (2447, 1773, 2483, 1614, 524, 1491, and 2072 km2 for the 1001 to 1007 sub-basins). In this case study, water was allocated to meet the requirements in June when water shortage has been frequently observed in the study area. The water allocation period was limited to June (frequent drought month) and evaluated using a pentad (5-day) simulation time step over the next 30 years (with 2015 as the base year); that is, June was divided into six time intervals for every simulation year. Thus, each simulation was conducted independently for each year.
River flow, groundwater, and dam and agricultural reservoirs were considered water supply sources in the case study basin, while agricultural, municipal/industrial (combined), and river maintenance flow were considered demand sites. The amount of reclaimed water, an additional water supply source, was dynamically determined based on the allocated water at each of the municipal/industrial demand sites with specific reclamation rates. In South Korea, according to the MLTM [30], 65% of the demand supplied to municipal and industrial sites is generally discharged into the river downstream of the demand sites. In the case of agricultural demand, 35% of the demand contributes to water resources gradually; therefore, the net demand (i.e., 65% of the total demand) was applied as the actual agricultural demand without the water reclamation process.
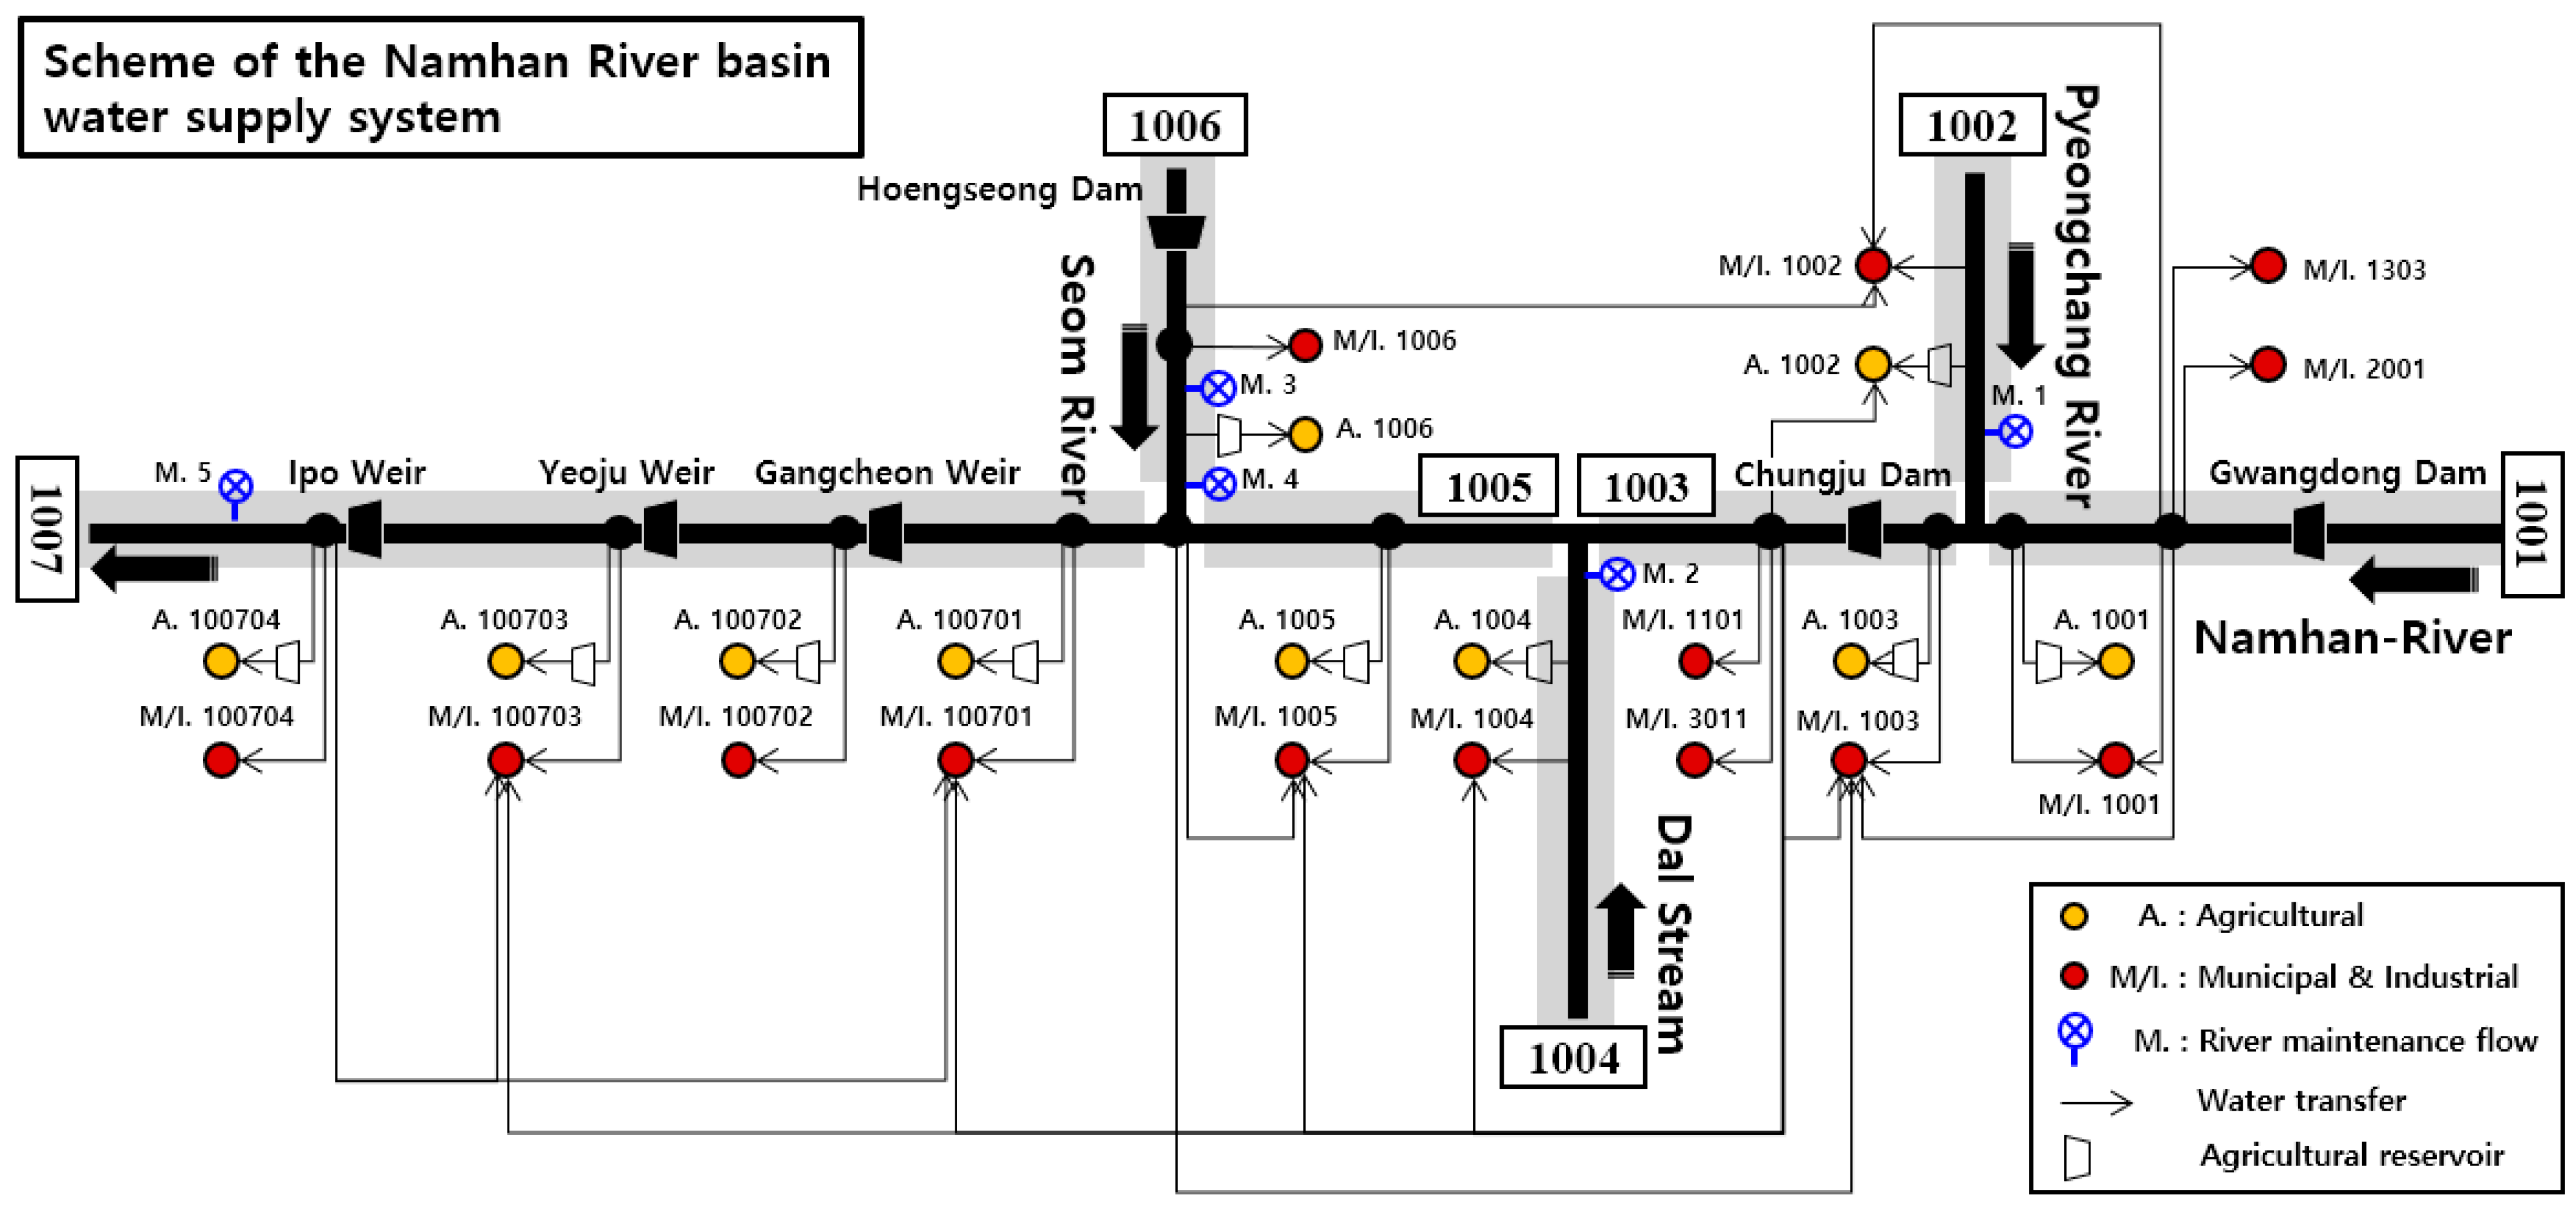
A schematic of the water supply system in the Namhan River basin is shown in Figure 5. The base demands of the municipal/industrial and agricultural demand sites in June 2015 are summarized in Table 1. In total, 29 demand sites, including 10 agricultural sites, 14 municipal/industrial sites, and 5 river maintenance flow gauges, with identical priorities for reliability-based water allocation, use water in the case study basin. The Namhan River is the main stream draining the basin and it has three branches: the Pyeongchang River, Dal Stream, and Seom River. The water flow is controlled by the Gwangdong Dam on the Pyeongchang River before it joins the Namhan River and then by the Chungju Dam on the Namhan River. Next, the Dal stream joins the Namhan River, followed by the Seom River. The Hoengseong Dam is located upstream on the Seom River and controls its flow. After the joining of the Seom River, three large weirs—the Gangcheon Weir, Yeoju Weir, and Ipo Weir—control the flow of the mainstream of the Namhan River downstream. In addition, agricultural water is supplied by several agricultural reservoirs distributed throughout the basin. Consequently, it is possible to store and supply water in the case study basin through a total of six main water storage facilities (i.e., three dam reservoirs and three weir pools) and 10 agricultural reservoirs in addition to the river flow.
Every municipal/industrial and agricultural demand site has access to separate groundwater sources nearby. In the WAMM, the recharge of groundwater is not simulated, but only initial groundwater storage is set and supplied to demand sites. However, in the target season (June), little groundwater use was recorded, and so the effect of groundwater supply was not specified in the present case study. Furthermore, Figure 5 shows five flow gauges (M.1 to M.5) for river maintenance flow over the entire river basin, which have flow requirements of 7.73, 5.03, 23.1, 7.57, and 32.5 m3/s, based on maintenance demand in MLTM [30]. The river maintenance flow requires the minimum flow rates for eco-environmental preservation and induces the discharge of reservoirs and release downstream without actual water consumption.

3.2. Economic Value of Water Resources in the Namhan River Basin

The economic values of municipal, industrial, and agricultural water supply in Namhan River basin were estimated and provided to the WAMM. The economic value of municipal water was estimated to be 1283 KRW/m3 by substituting the municipal water use status reported in the National Water Resources Plan 2011–2020 of South Korea (MLTM) [30] in the municipal water supply benefit function (Equation (6)). The economic values of industrial and agricultural water were estimated to be 5583 KRW/m3 and 384 KRW/m3, respectively, by applying the data used to derive the respective production functions in previous studies (Equations (8) and (10) suggested in [21,22]). Here, the economic value of river maintenance flow was not considered. As the WAMM considers the demand sites of both municipal and industrial water together, their economic value (Table 2) was applied by considering the proportions of municipal and industrial water use at each demand site.

3.3. Application of Climate Change Scenario in the Namhan River Basin

3.3.1. River Basin Flow Projection

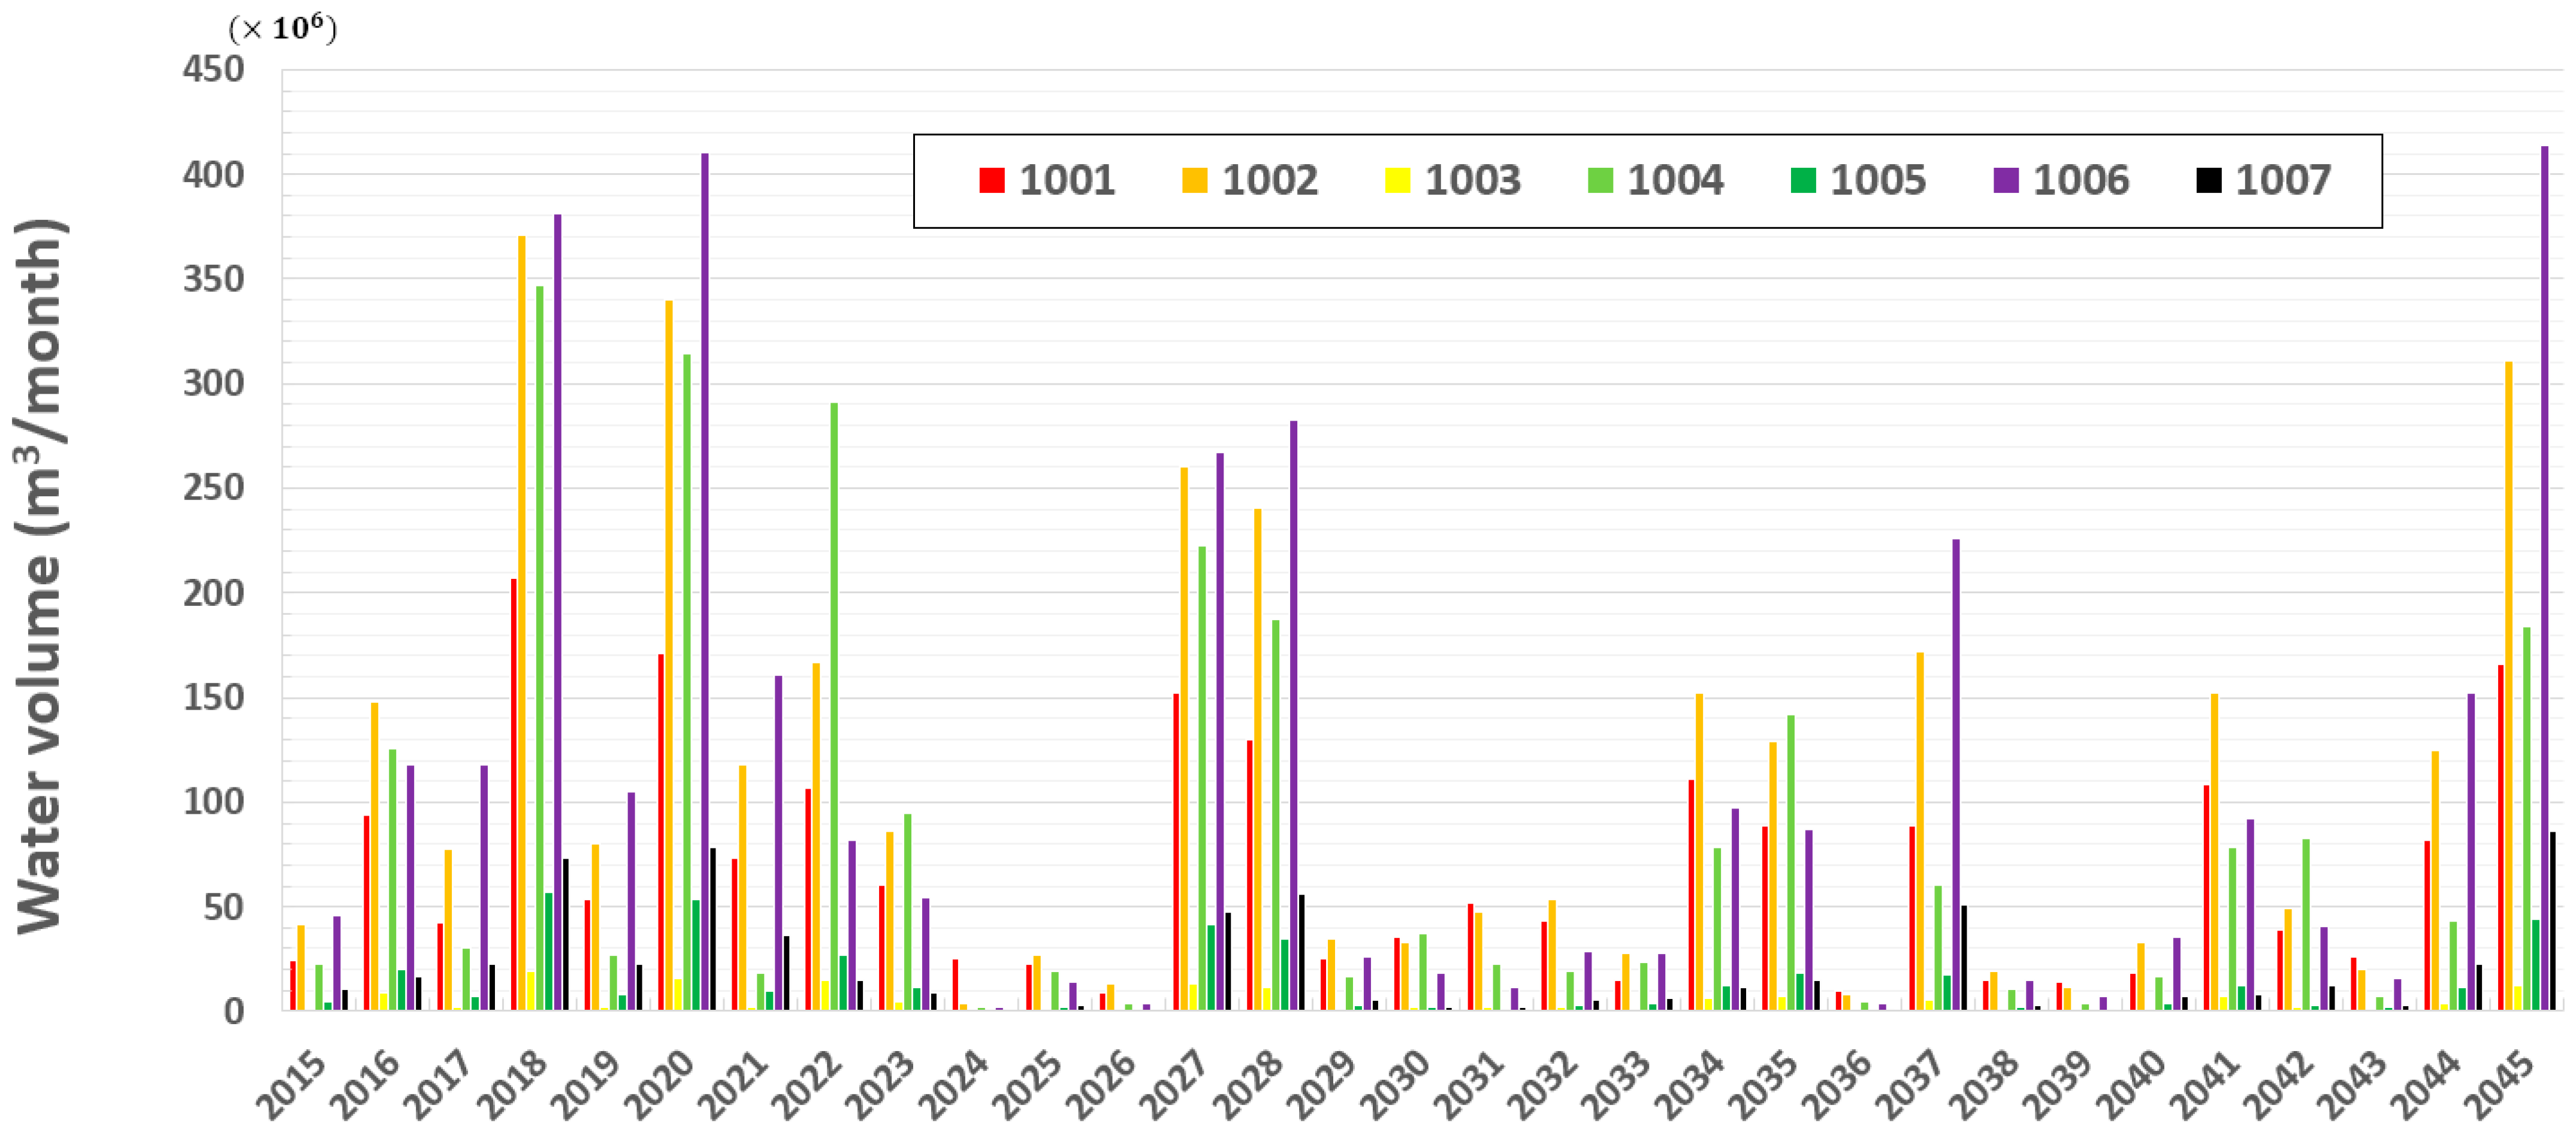
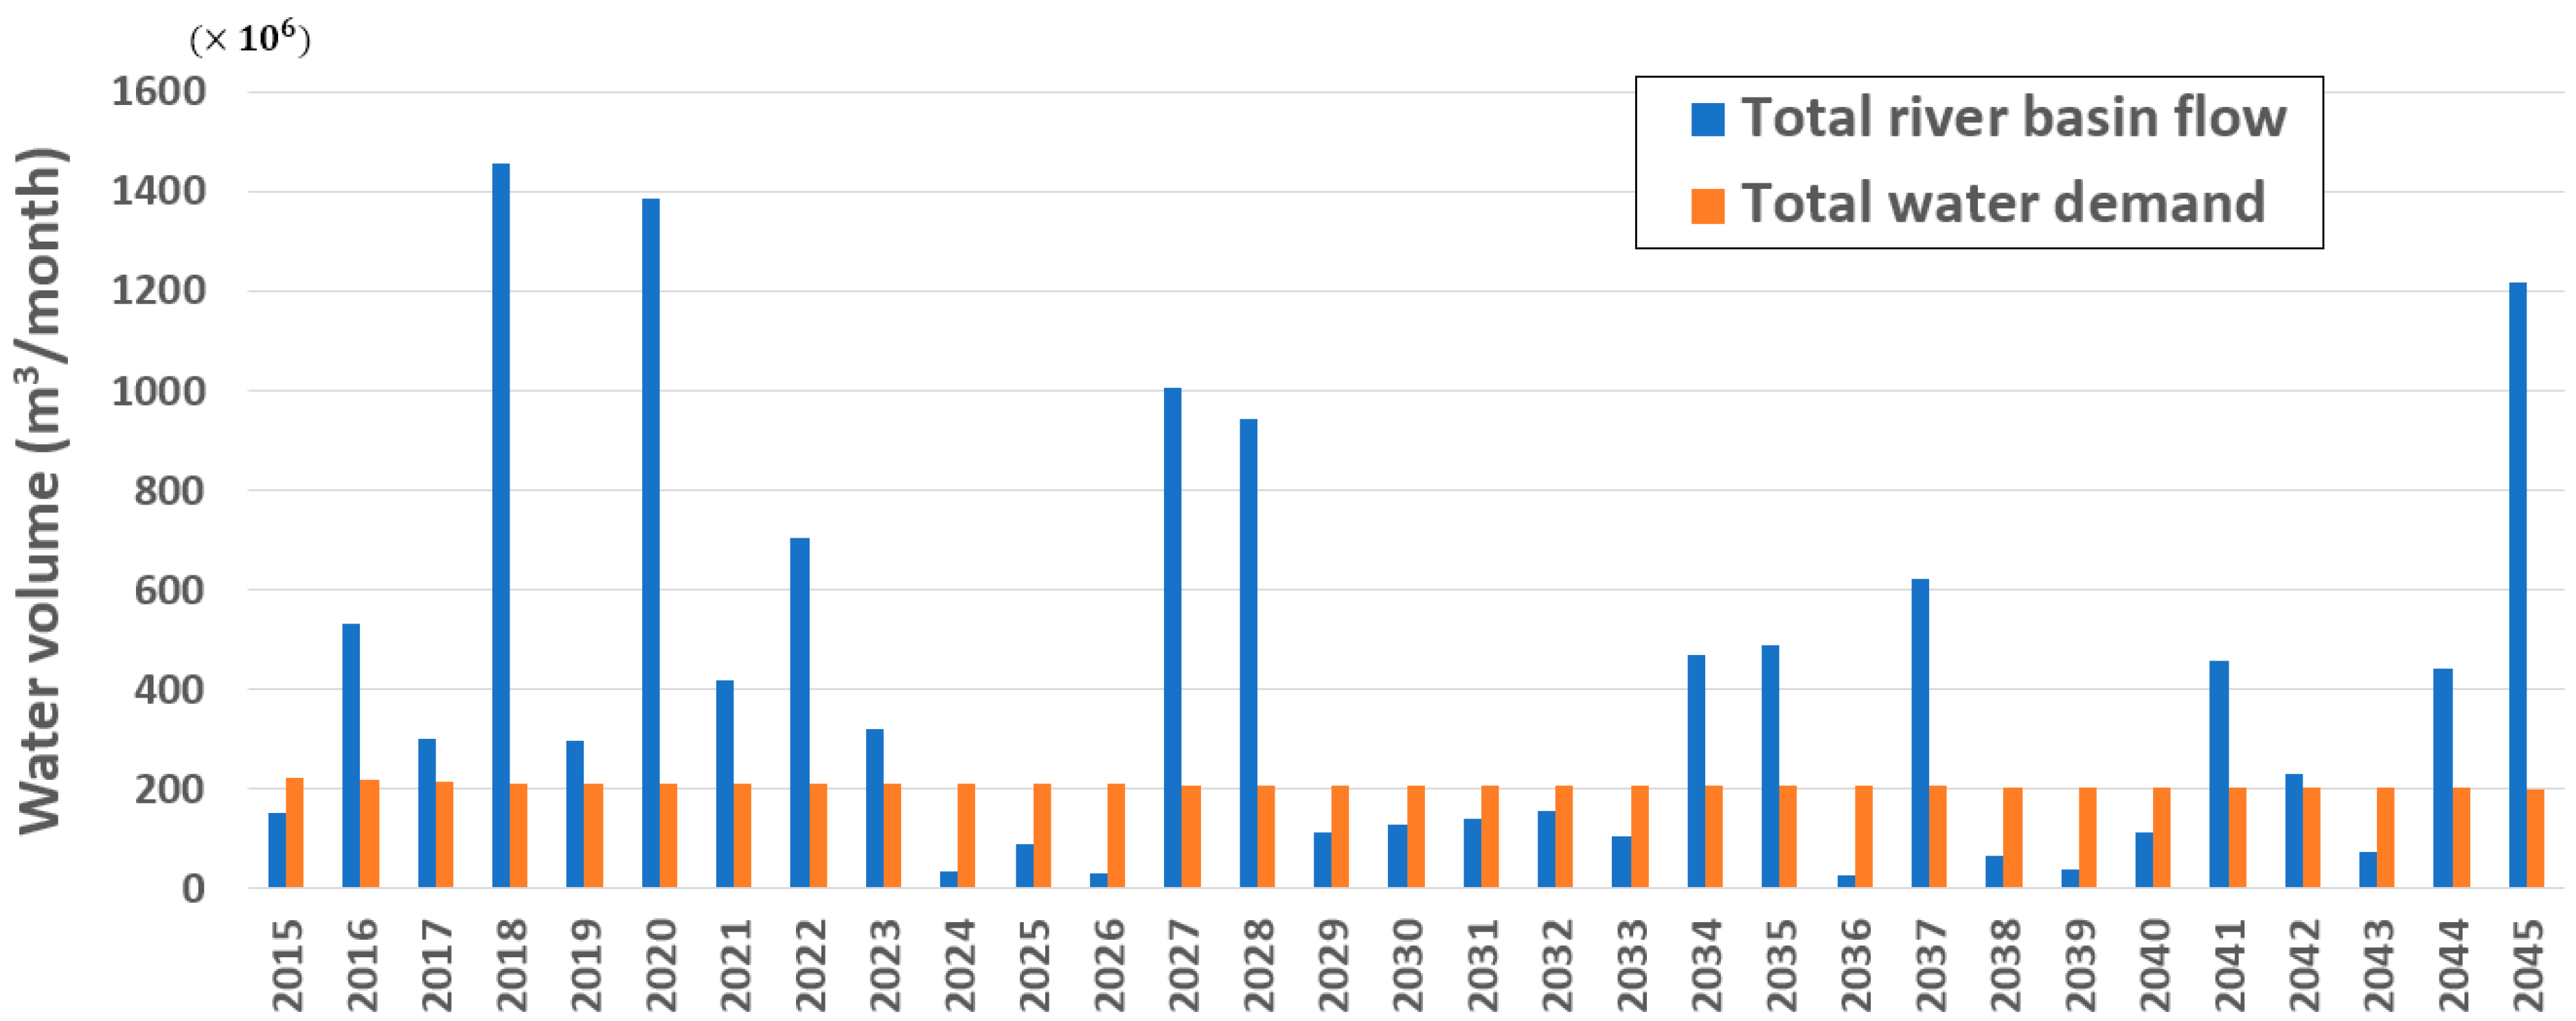
The predicted precipitation and maximum temperatures in the seven sub-basins in June for the next 30 years are illustrated in Figure 6. Using the PRMS rainfall-runoff simulation, the river basin flow in June for each sub-basin was estimated for the next 30 years (independent year-by-year simulation; Figure 7). It should be noted that the initial storage in the reservoirs at the beginning of June for the next 30 years is fixed as the base value of the standard year of 2015. Sub-basin flows generally change following consistent trends across the years but deviate considerably between wet and drought years. The total river basin flow of the entire Namhan River basin in June exhibits an average of 405 million m3/month, a maximum of 1455 million m3/month (2018), and a minimum of 29 million m3/month (2036) over the next 30 years. Based on comparisons of predicted and gauged rainfall in 2015–2018, the climate change scenarios represent relatively wet conditions in the 1001–1004 sub-basins, and dry conditions in the 1005–1007 sub-basins.

3.3.2. Water Demand Projection

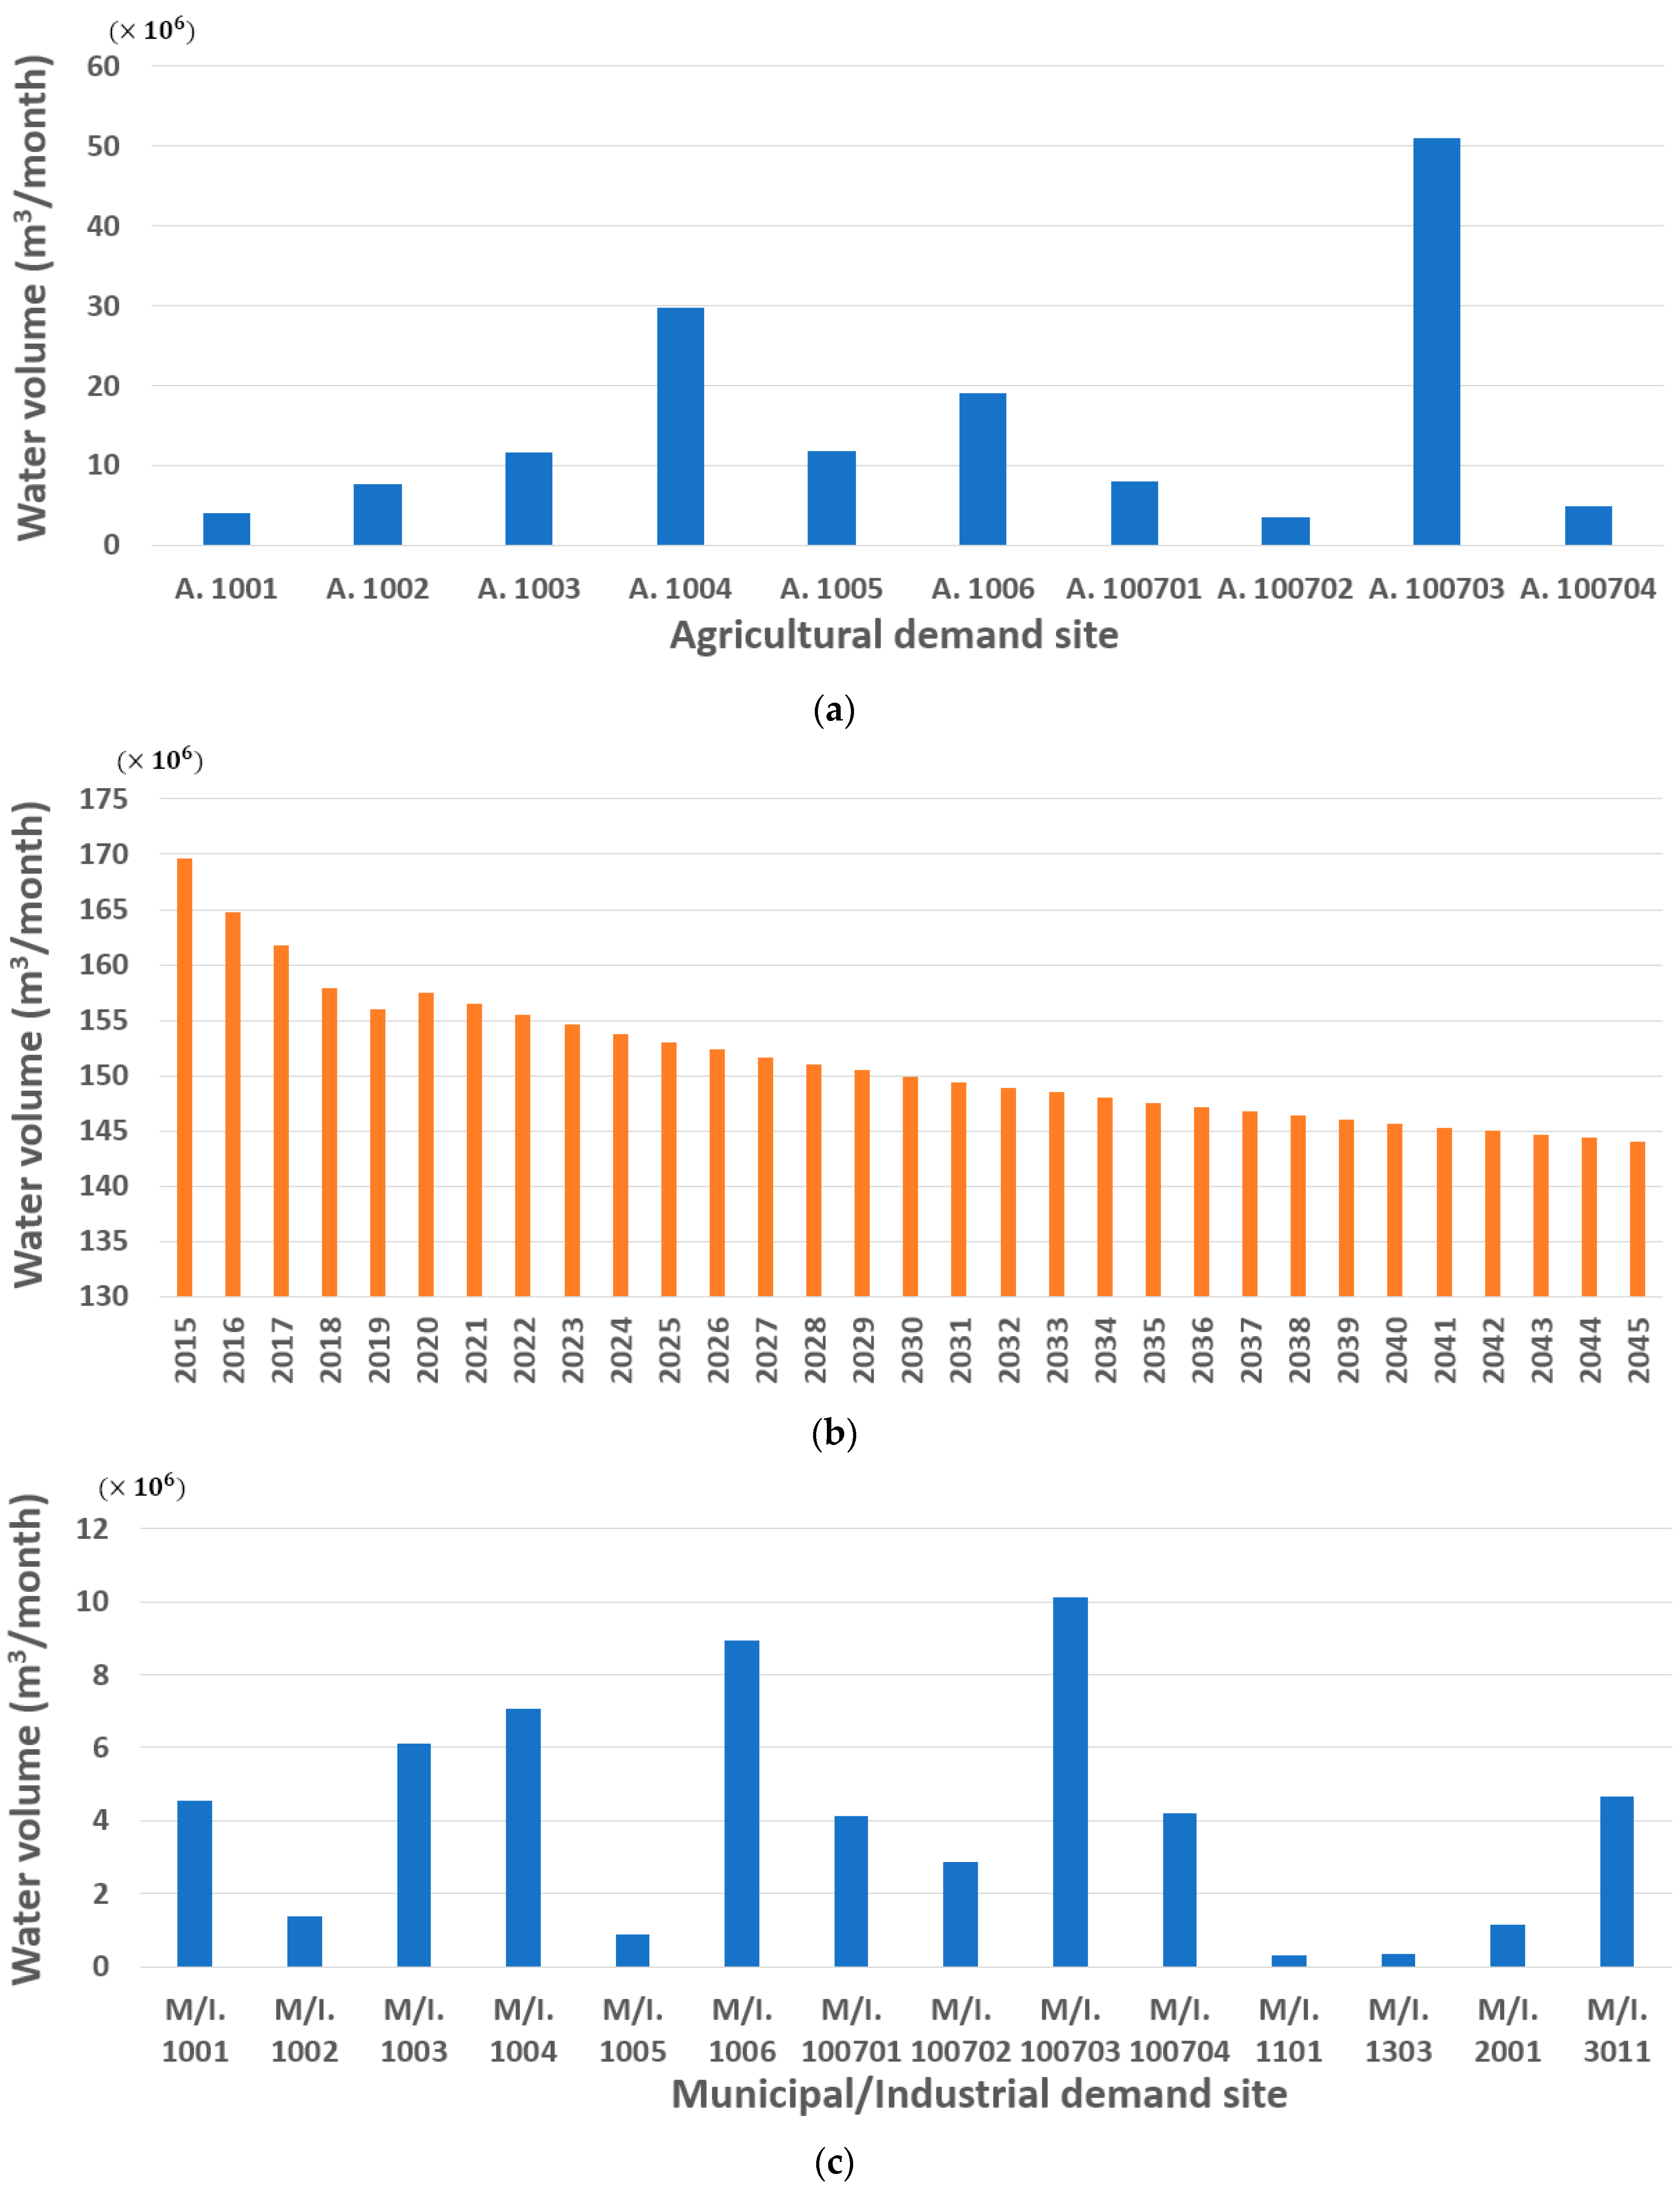
The water demand in June was predicted for each demand site over the next 30 years (Figure 8) based on the water demand change scenario of the Namhan River basin. The agricultural water demand in June was predicted to gradually decrease over the next 30 years from a maximum of 170 million m3/month in 2015 to a minimum of 144 million m3/month in 2045 owing to a decrease in the farmland area. On the other hand, the demand for municipal and industrial water in June was predicted to increase from a minimum of 52 million m3/month in 2015 to a maximum of 57 million m3/month in 2045, and the annual deviation was predicted to be relatively small.
The estimated river basin flow and water demand for the next 30 years were preliminarily compared for the entire Namhan River basin (Figure 9). The total river basin flow shows significant annual variation compared with the water demand. As the river basin flow in June was sometimes remarkably lower than the demand during the 30-year simulation period, the predictions show that water shortage events will occur throughout the basin. However, these results do not include water resources that can be utilized from reservoirs (e.g., dams, weirs, and agricultural reservoirs) in the basin. Thus, actual water shortages are likely to primarily occur in the most notable drought years, including 2024–2026, 2036, and 2038–2039, which are predicted to have insufficient river flow.

4. Application Results

Optimal water allocation under the applied climate change scenario was simulated using the WAMM for the Namhan River basin over the next 30 years. By applying two optimization methods (SSLP and FSLP) and two objective functions (supply reliability and economic benefit), the allocation results were compared to demonstrate the relative effectiveness of the allocation methods embedded in the WAMM.

4.1. Water Allocation Using SSLP

4.1.1. Reliability-Based Water Allocation Using SSLP

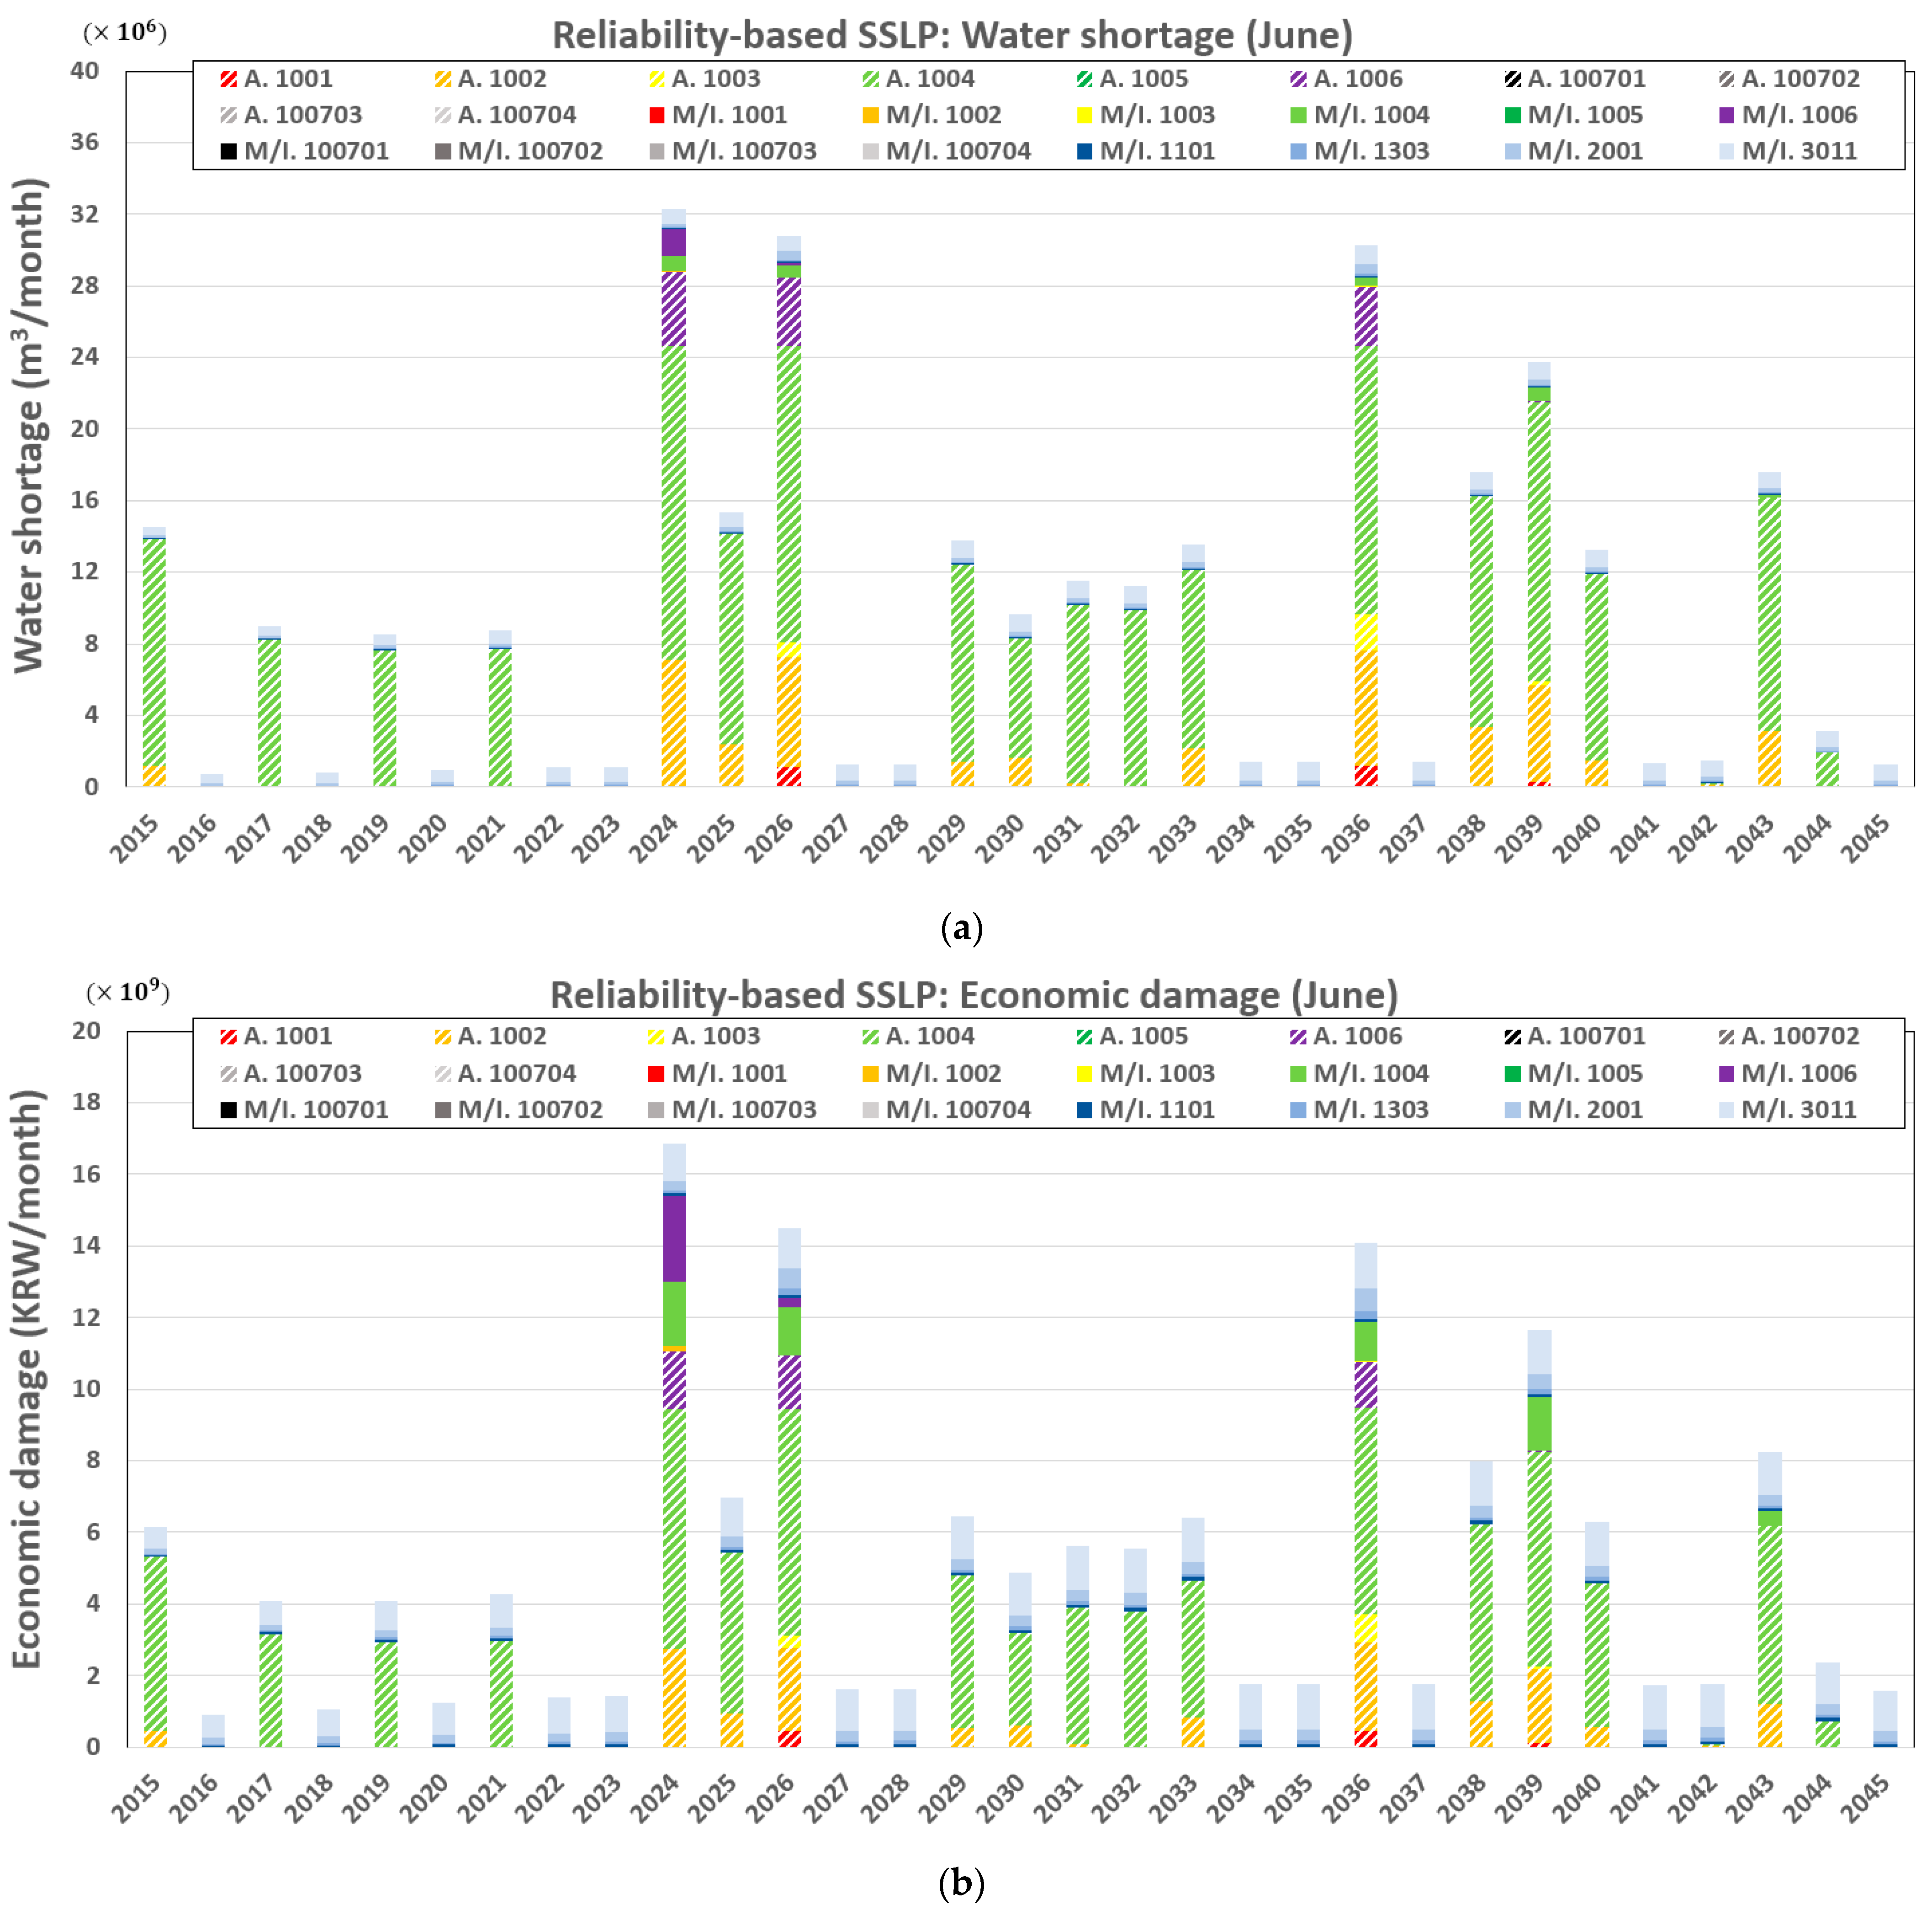
First, optimal water allocation was conducted to maximize the water supply reliability as the objective function using the SSLP method (Figure 10). According to the WAMM, water shortages with an average, maximum, and minimum values of 9.7 million m3/month, 32.3 million m3/month (2024), and 0.7 million m3/month (2016), respectively, will occur in the case study area in June over the next 30 years. These water shortages correspond to average, maximum, and minimum economic losses of 5.0 billion KRW/month, 16.9 billion KRW/month (2024), and 0.9 billion KRW/month (2016), respectively.
Within the simulation period (30 years), water shortages occur every year at demand site M/I. 3011, where the increasing demand cannot be met owing to the restriction of the transmission capacity. In addition, agricultural sites such as A. 1002, A. 1004, and A. 1006 also incur severe water shortages during drought years. These water shortages are particularly significant in 2024, 2026, and 2036 when the shortages exceed approximately 30 million m3/month. As shown in Figure 10, agricultural water shortages are dominant (accounting for approximately 86% of the shortages occurring in the basin over 30 years) compared with municipal and industrial water shortages (14%). However, this larger proportion of shortages account for only approximately 63% of the economic damage, while the economic damage in the municipal and industrial sectors is approximately 37%. This result is related to the different economic values of water according to its use.

4.1.2. Economy-Based Water Allocation Using SSLP

The results of the reliability-based water allocation analysis confirm that the trends of water shortage and economic loss in the basin do not necessarily match because the economic value of water is different according to its use. Here, the allocation of water to maximize economic benefit while using the SSLP method is considered.
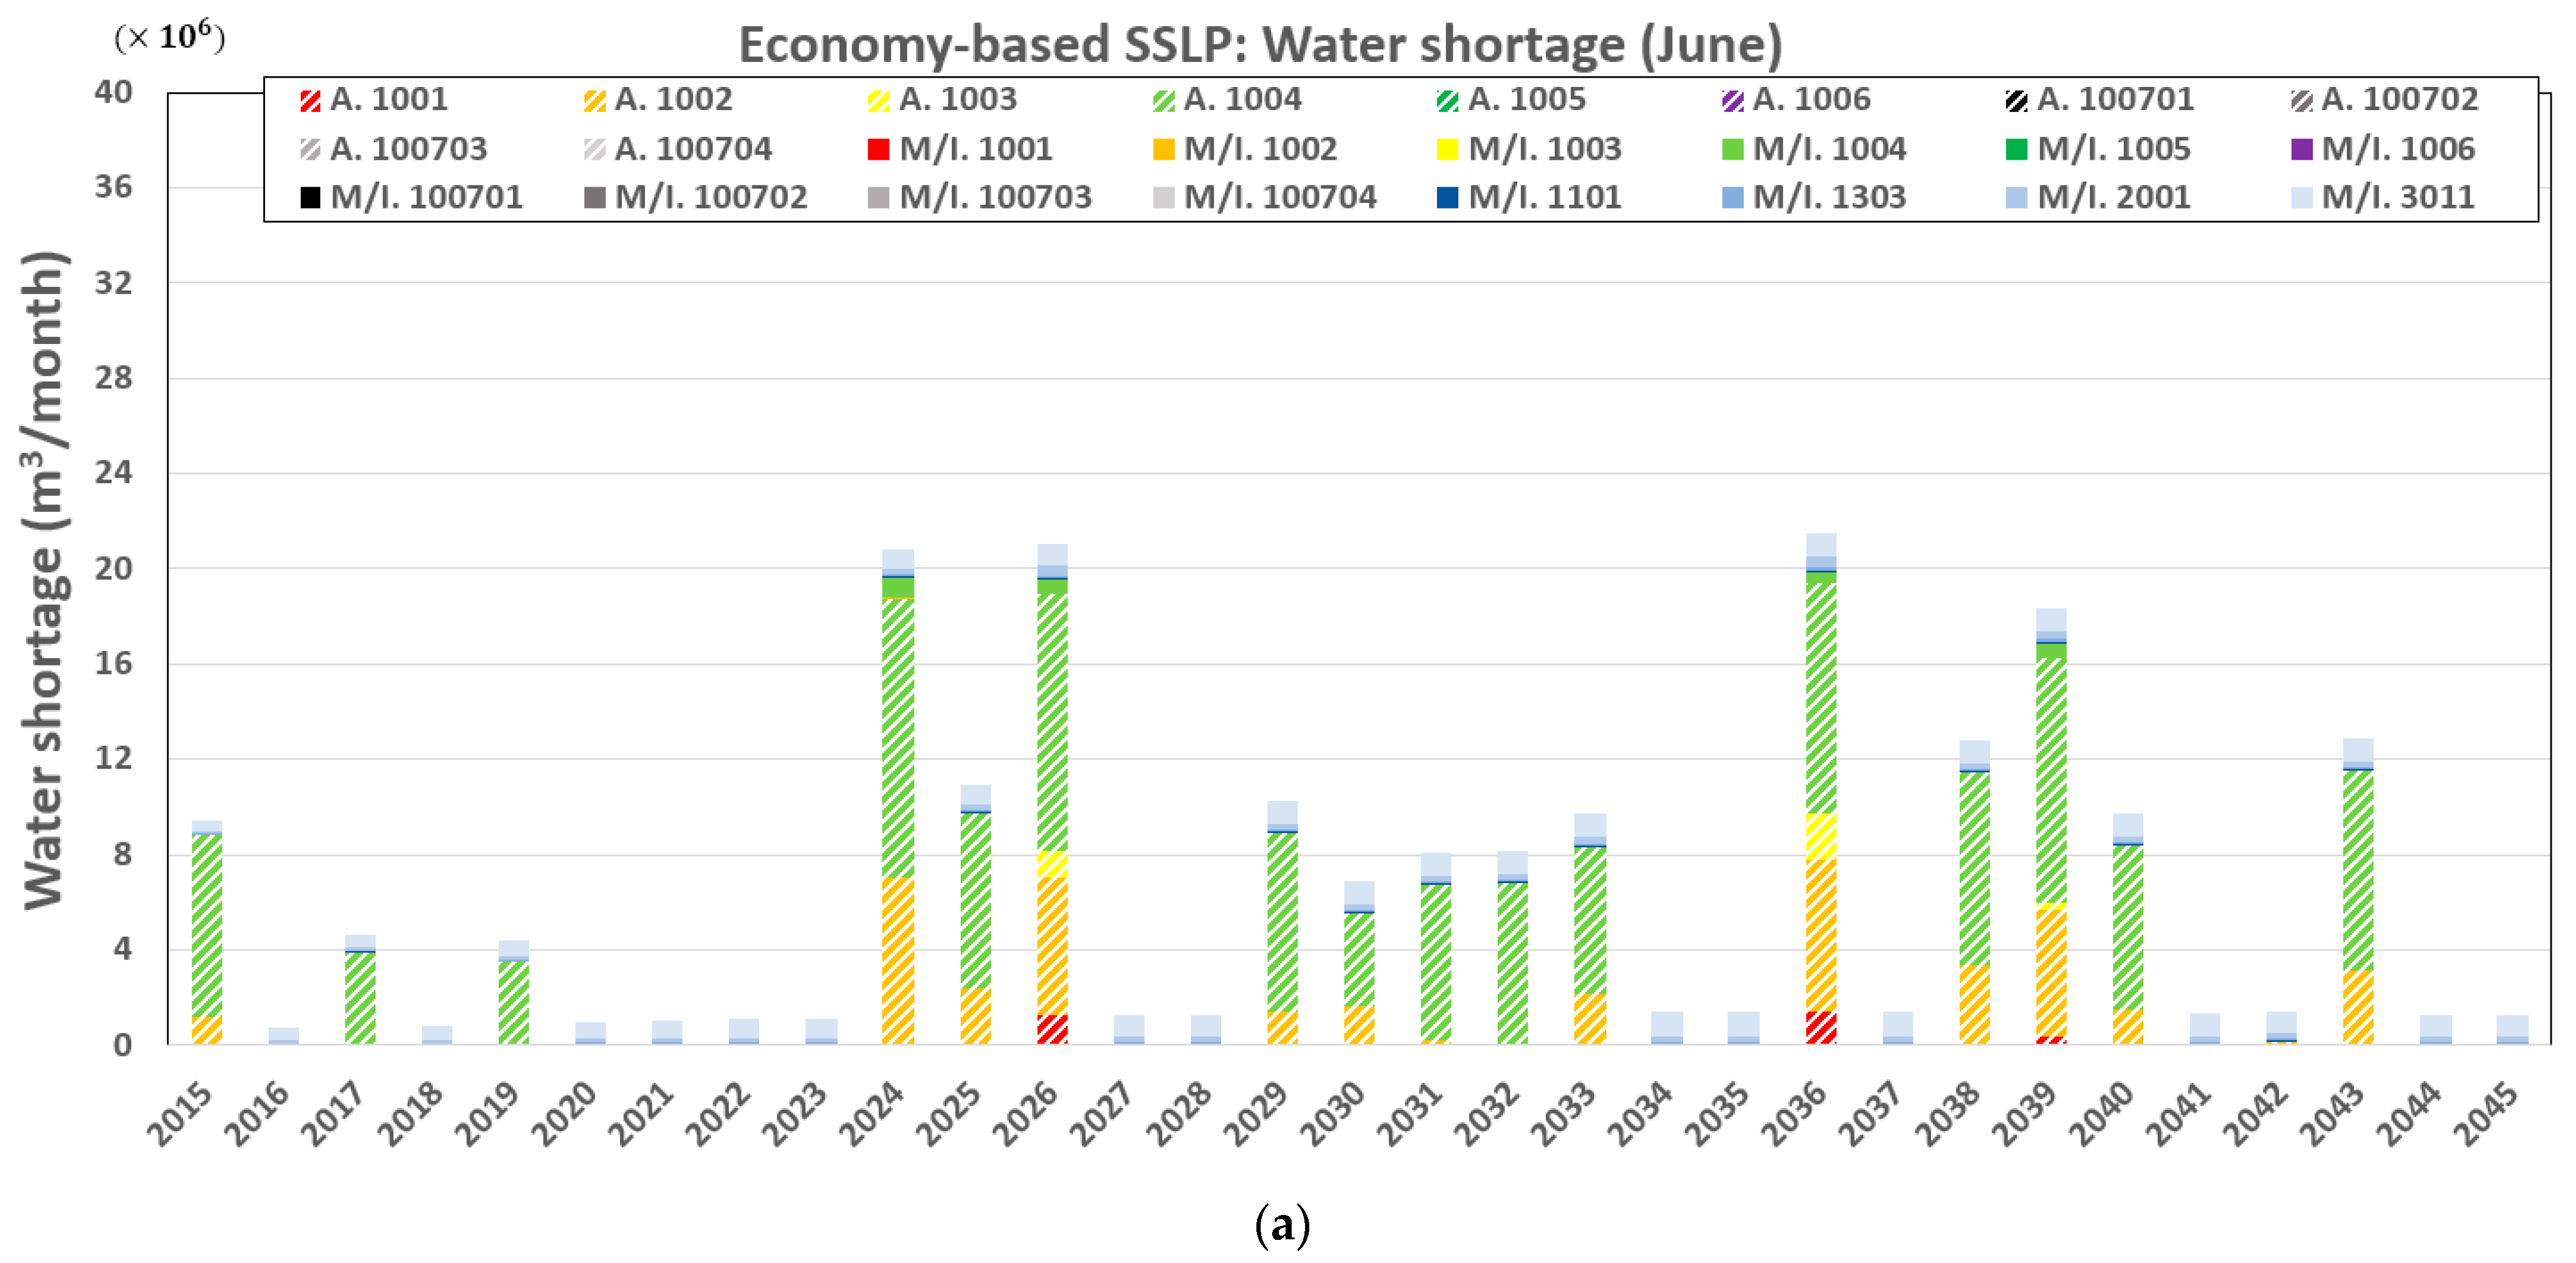
The results of the water allocation simulation yielded the distribution of water shortages and economic damages in June (Figure 11). The overall water shortage and economic damage are lower than those based on the reliability-based SSLP water allocation. There are two reasons for the lower water shortage. First, the increase in supply to the municipal and industrial water demand sites results in increased production and use of reclaimed water. Second, the river maintenance flow is utilized for supplying demand sectors because the economic value of the maintenance flow is not considered in the economy-based SSLP under drought conditions.
The water shortage pattern at site M/I. 3011 for the economy-based water allocation observed in Figure 11 is the same as that observed for the reliability-based water allocation in Figure 10. However, the municipal and industrial water shortages in 2024 and 2026 were resolved to a great extent by using the economy-based water allocation; that is, most of the municipal and industrial water shortage events were resolved, except for cases in which the capacity of the supply conduit pipe was limited. In summary, when using economy-based water allocation, the average, maximum, and minimum water shortages in June will be 6.7 million m3/month, 21.5 million m3/month (2036), and 0.7 million m3/month (2016), respectively, which is equivalent to average, maximum, and minimum economic damages of 3.8 billion KRW/month, 10.6 billion KRW/month (2024), and 0.9 billion KRW/month (2016), respectively. Compared with the reliability-based SSLP water allocation results (Section 4.1.1), the economy-based SSLP water allocation method reduces maximum the water shortage and economic damage by approximately 10.8 million m3/month and 6.2 billion KRW/month, respectively, and the average water shortage and economic damage over 30 years by 3.0 million m3/month and 1.2 billion KRW/month, respectively.
Notably, the severity of economic damage due to water shortage does not seem to be directly related to the severity of water shortages. The most severe water shortage will occur in 2036, but the most severe economic loss will occur in 2024. In other words, water shortage-induced damage and economic damage exhibit different patterns.

4.2. Water Allocation Using FSLP

4.2.1. Reliability-Based Water Allocation Using FSLP

Next, FSLP-based water allocation was performed (i.e., allocating water over the entire simulation period) and the results were compared with those of the conventional SSLP.
The reliability-based FSLP water allocation simulation provided water shortage and economic loss results for June (Figure 12). As expected, the results of the FSLP water allocation demonstrated a significant reduction in the overall water shortage compared to the results of the SSLP. This reduction is the effect of utilizing storage facilities when simultaneously considering the entire simulation period (all six time steps of June). In particular, in SSLP, regardless of the water shortage occurring in other time steps, the remaining water in the current time step is discharged as is or stored mainly in downstream storage facilities. In FSLP, when water shortage is expected in future time steps, the remaining water in the current time step is secured in an appropriate storage facility where possible, improving allocation results through more flexible preparation for expected water shortage events.
Analyses of the simulation results in Figure 12 reveals that, for reliability-based FSLP water allocation, the average, maximum, and minimum water shortage in June is 2.5 million m3/month, 8.3 million m3/month (2024), and 0.7 million m3/month (2016), respectively; the average, maximum, and minimum economic damage is 2.03 billion KRW/month, 4.38 billion KRW/month (2024), and 0.9 billion KRW/month (2016), respectively. Compared to the reliability-based SSLP water allocation (Section 4.1.1), the FSLP-based allocation considerably increases water allocation efficiency by reducing the maximum water shortage and economic damage by approximately 24.0 million m3/month and 12.5 billion KRW/month, respectively, and the average water shortage and economic damage over 30 years by 7.2 million m3/month and 3.0 billion KRW/month, respectively.

4.2.2. Economy-Based Water Allocation Using FSLP

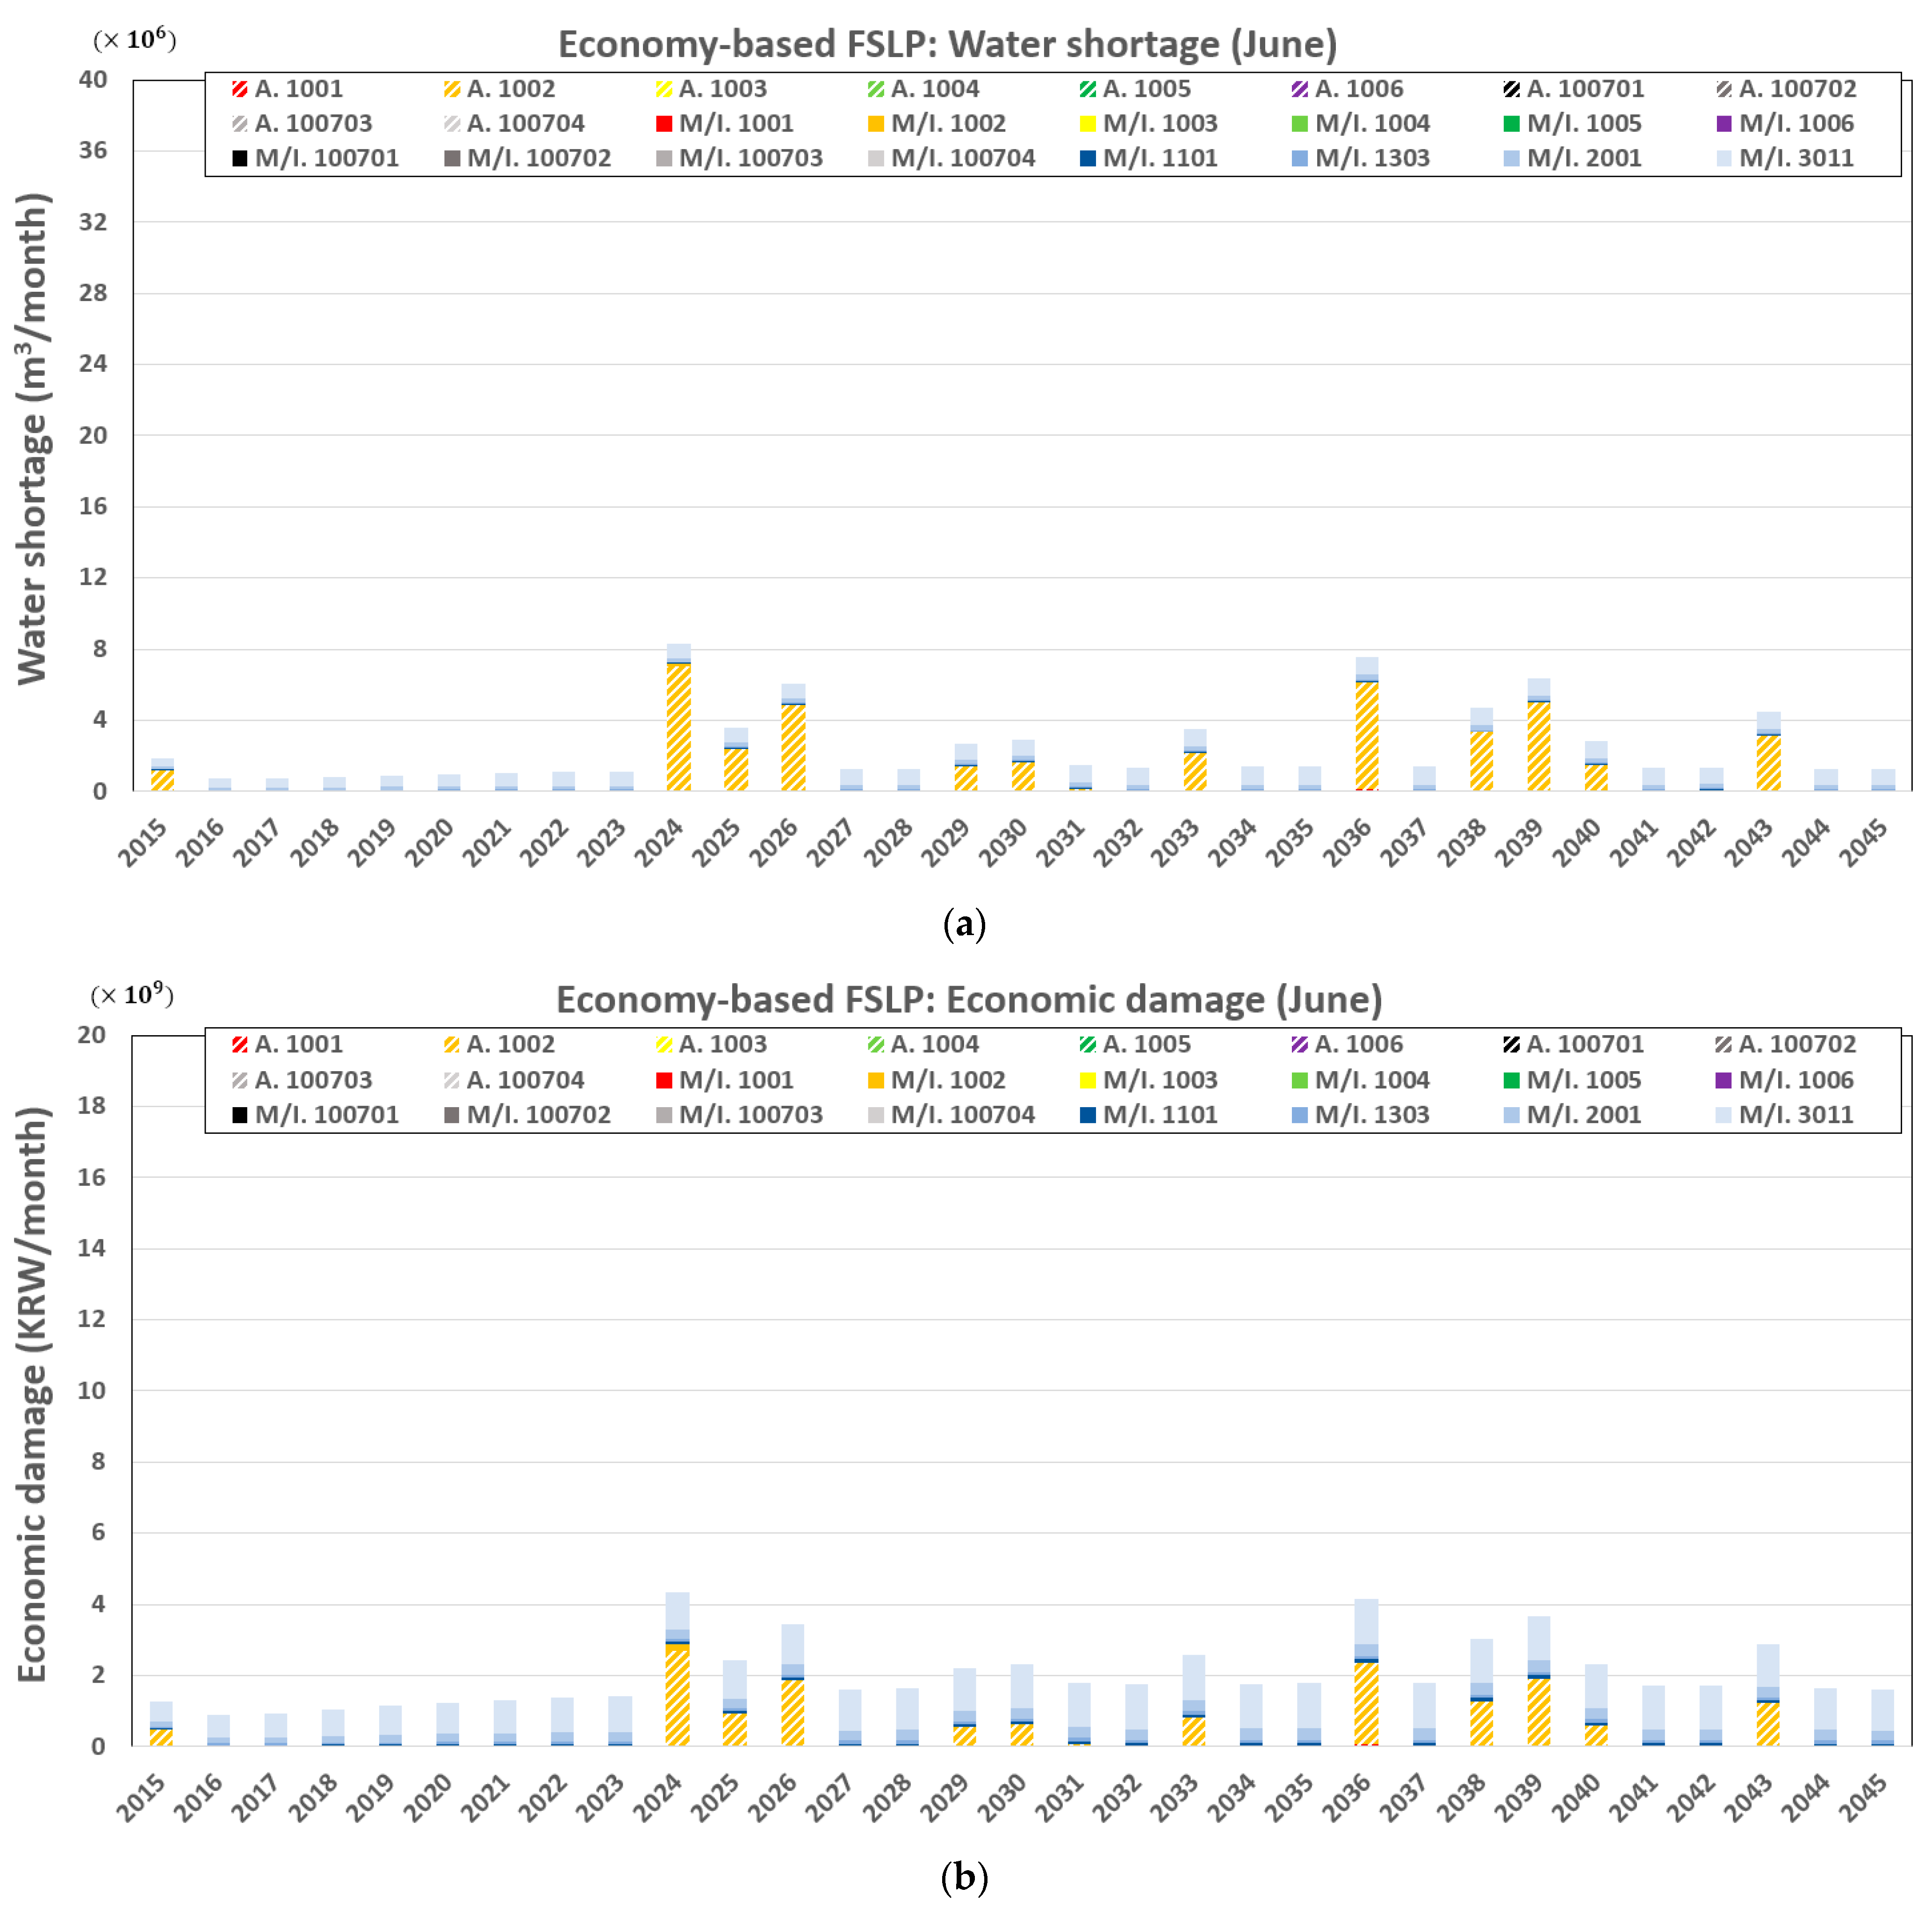
Lastly, economy-based FSLP water allocation was performed and the results of water shortage and economic damage are shown in Figure 13. Compared to the economy-based SSLP (Section 4.1.2), which maximizes economic benefits with the conventional SSLP method, the FSLP reduced the maximum water shortage and economic damage by approximately 13.2 million m3/month and 6.3 billion KRW/month, respectively, and the average water shortage and economic damage over 30 years by 4.2 million m3/month and 1.8 billion KRW/month, respectively.
The results of a comparison between the reliability-based FSLP (Section 4.2.1) and economy-based FSLP are as follows. As the reliability-based allocation already maximizes the quantitative efficiency of water supply, the total water shortage was the same throughout the simulation period for both approaches. However, using the economy-based FSLP, the economic damage was slightly reduced by supplying water preferentially to demand sites M/I. 1001 and M/I. 100701–M/I.100704, which have larger proportions of industrial, water rather than supplying demand sites M/I. 1002 and M/I. 1006, in which the proportion of municipal water is higher than industrial water. In summary, the water shortages resulting from the economy-based FSLP water allocation were the same as those resulting from the reliability-based FSLP, but with slightly lower average, maximum, and minimum economic damages of 2.02 billion KRW/month, 4.36 billion KRW/month (2024), and 0.9 billion KRW/month (2016), respectively.

5. Discussion

Conventional water allocation models such as MODSIM [6] and WEAP [8] were developed decades ago but many studies are still widely applying them to water resource management by combining them with optimization schemes and various objective functions. Chou et al. [39] conducted a representative case study in optimizing water resources operation by combining existing models and advanced optimization algorithms. In this study, water allocation results using the reliability-based SSLP of the WAMM represent the conventional approach of WEAP [8]; however, the results using FSLP or economy-based allocation offer an alternative decision for better water resources management. The results, which are based on assumptions such as climate change and water demand scenarios, reveal both water shortage risks and associated economic considerations. Moreover, water supply efficiency according to the objectives and optimization methods of water allocation can be comparatively analyzed.
Table 3 provides a comparative analysis of the four water allocation simulation results evaluated in this study. In terms of the objective function, the economy-based water allocation approach reduced both water shortage and economic damage compared with the reliability-based allocation approach. In terms of the optimization method, the FSLP significantly reduced water shortages compared with the SSLP. Therefore, a water allocation method that considers the economic value of water resources using an FSLP optimization method capable of simultaneously considering the entire simulation period is the most effective approach for the case study basin. Finally, the 30-year average water supply reliability of the reliability-based SSLP water allocation (i.e., the conventional method) was 95%, which improved to 97% when using the economy-based SSLP water allocation and to 99% when using FSLP water allocation.

6. Conclusions

In this study, a new hydro-economic water allocation and management model, WAMM, was tested by improving the optimization algorithm of conventional water allocation models and considering the economic value of water resources. The WAMM was applied for water allocation simulation considering the impact of climate change and water demand scenarios on the Namhan River basin in South Korea over the next 30 years. A climate change-influenced water supply scenario was constructed based on the precipitation and maximum temperature predictions of the RCP 8.5 climate change scenario derived from HadGEM2-AO GCM. Also, a demand scenario was built based on a demand forecast obtained according to the changes in population and farmland and accounted for the uncertainty of conditions. To evaluate the two objective functions (reliability and economic benefit) and the two optimization methods (SSLP and FSLP) within the WAMM, water supply from the basin over the next 30 years was allocated to four different cases and the allocation results were comparatively analyzed. The results can be summarized as follows.
  • The results of the reliability-based SSLP allocation show that, according to the considered climate change scenario, the water shortage in June over the next 30 years will be an average and maximum of 9.7 million m3/month and 32.3 million m3/month (2024), respectively, corresponding to average and maximum economic damages of 5.0 billion KRW/month and 16.9 billion KRW/month (2024), respectively.
  • The results of the economy-based SSLP allocation show a lower total water shortage because water allocation focused on municipal and industrial sectors and the use of reclaimed water increased; moreover, the priority of river maintenance flow demand was lowered. Over the next 30 years, average and maximum water shortages in June of 6.7 million m3/month and 21.5 million m3/month (2036), respectively, were obtained, corresponding to average and maximum economic damages of 3.8 billion KRW/month and 10.6 billion KRW/month (2024), respectively. Therefore, compared to the reliability-based SSLP method, in which the objective function of water allocation is simply based on the supply quantity, water allocation considering the economic value of the water reduces both the water shortage and economic loss to a certain degree.
  • The results of the reliability-based FSLP allocation confirm that the total water shortage was considerably reduced by flexibly utilizing storage facilities to respond to water shortages that are predicted to develop throughout the entire simulation period. The average and maximum water shortages in June were found to be 2.5 million m3/month and 8.3 million m3/month (2024), respectively, corresponding to average and maximum economic damages of 2.03 billion KRW/month and 4.38 billion KRW/month (2024), respectively.
  • Economy-based FSLP allocation indicates the same quantity of water shortage as the reliability-based FSLP allocation but preferentially supplies water to municipal/industrial demand sites that comprise a high proportion of industrial water demand. This difference resulted in average and maximum economic damages of 2.02 billion KRW/month and 4.36 billion KRW/month (2024), respectively, over the 30-year period, which are slightly less than the corresponding values obtained using the reliability-based FSLP.
The WAMM has a few important limitations to take note of when applying climate change scenarios to each sub-basin; primarily, the scenarios and economic value of water are somewhat roughly aggregated. However, the water shortage-induced economic damage due to climate change was still successfully minimized and quantified using the model. In future work, the WAMM will be modified to more comprehensively consider water sources such as the conjunctive use of surface water, groundwater, and reclaimed water. Furthermore, more precise climate change scenarios and water valuations would also contribute to specified water resources management. Once effectively derived and demonstrated, the WAMM is expected to offer a robust decision-making tool to resolve water shortages and disputes among river basin units.

Author Contributions

Conceptualization, G.J. and D.K.; methodology, G.J. and D.K.; software, G.J.; validation, D.K.; formal analysis, G.J. and D.K.; writing—original draft preparation, G.J.; writing—review and editing, D.K.; supervision, D.K.; funding acquisition, D.K. All authors have read and agreed to the published version of the manuscript.

Funding

This work was financially supported by the Korea Ministry of Environment (MOE) as the Graduate School specializing in Climate Change.

Data Availability Statement

The data presented in this study are available on request from the corresponding author. The data are not publicly available due to privacy.

Conflicts of Interest

The authors declare no conflict of interest.

References

  1. The World Bank. “Water Resources Management.” World Bank 20 September 2017. Available online: www.worldbank.org/en/topic/waterresourcesmanagement#2 (accessed on 7 May 2021).
  2. UNESCO, UN-Water. United Nations World Water Development Report 2020: Water and Climate Change, Paris, UNESCO. 2020. Available online: http://www.unwater.org/publications/world-water-development-report-2020/ (accessed on 7 May 2021).
  3. Adetoro, A.A.; Ngidi, M.; Nyam, Y.S.; Orimoloye, I.R. Temporal evaluation of global trends in water footprint, water sustainability and water productivity research. Sci. Africa 2021, 12, e00732. [Google Scholar]
  4. Strzepek, K.M.; Lenton, R.L. Analysis of Multipurpose River Basin Systems: Guidelines for Simulation Modelling. In Technical Report No. 236 Ralph M. Parsons Laboratory for Water Resources and Hydrodynamics, Department of Civil Engineering; Massachusetts Institute of Technology: Cambridge, MA, USA, 1978. [Google Scholar]
  5. Strzepek, K.M.; MITSIM-2 a Simulation Model for Planning and Operational Analysis of River Basin Systems. 1981. WP-81-124. Available online: http://pure.iiasa.ac.at/id/eprint/1637/ (accessed on 20 August 2020).
  6. Shafer, J.; Labadie, J. Synthesis and Calibration of a River Basin Water Management Model. Completion Report No. 89, Colorado Water Resources Research Institute, Colorado State University, Ft. Collins. 1978. Available online: http://former.iemss.org/sites/iemss2006//papers/w5/MODSIMpaper.pdf (accessed on 20 August 2020).
  7. Andreu, J.; Capilla, J.; Sanchis, E. AQUATOOL: A computer-assisted support system for water resources research management including conjunctive use. In Decision Support Systems. NATO ASI Series (Series G: Ecological Sciences); Loucks, D.P., da Costa, J.R., Eds.; Springer: Berlin/Heidelberg, Germany, 1991; Volume 26, pp. 333–355. [Google Scholar]
  8. Raskin, P.; Hansen, E.; Zhu, Z.; Stavisky, D. Simulation of water supply and demand in the Aral Sea Basin. Water Int. 1992, 17, 55–67. [Google Scholar] [CrossRef]
  9. Yates, D.; Sieber, J.; Purkey, D.; Huber-Lee, A. WEAP21—A demand-, priority-, and preference-driven water planning model: Part 1: Model characteristics. Water Int. 2005, 30, 487–500. [Google Scholar] [CrossRef]
  10. Diaz, G.E.; Brown, T.C.; Sveinsson, O. AQUARIUS: A modeling system for river basin water allocation. General Technical Report RM-GTR-299. In U.S. Department of Agriculture, Forest Service; Rocky Mountain Forest and Range Experiment Station: Fort Collins, CO, USA, 1997. [Google Scholar]
  11. Choi, S.; Lee, D.; Moon, J.; Kang, S. Application of integrated water resources evaluation and planning system (K-WEAP). J. Korea Water Resour. Assoc. 2010, 43, 625–633. [Google Scholar] [CrossRef] [Green Version]
  12. Zagona, E.A.; Fulp, T.J.; Shane, R.; Magee, T.; Goranflo, H.M. Riverware: A generalized tool for complex reservoir system modeling. J. Am. Water Resour. Assoc. 2001, 37, 913–929. [Google Scholar] [CrossRef]
  13. Howitt, R.E.; Lund, J.R.; Kirby, K.W.; Jenkins, M.W.; Draper, A.J.; Grimes, P.M.; Ward, K.B.; Davis, M.D.; Newlin, B.D.; van Lienden, B.J.; et al. Integrated Economic-Engineering Analysis of California’s Future Water Supply. Project Completion Report, Department of Civil and Environmental Engineering, University of California, Davis. 1999. Available online: https://www.researchgate.net/profile/Marion_Jenkins/publication/238672816_Integrated_Economic-Engineering_Analysis_of_California’s_Future_Water_Supply/links/54871eba0cf2ef34478eb92e/Integrated-Economic-Engineering-Analysis-of-Californias-Future-Water-Supply.pdf (accessed on 20 August 2020).
  14. Newlin, B.D.; Jenkins, M.W.; Lund, J.R.; Howitt, R.E. Southern California water markets: Potential and limitations. J. Water Resour. Plan. Manag. 2002, 128, 21–32. [Google Scholar] [CrossRef]
  15. Pulido-Velazquez, M.; Jenkins, M.W.; Lund, J.R. Economic values for conjunctive use and water banking in southern California. Water Resour. Res. 2004, 40. [Google Scholar] [CrossRef] [Green Version]
  16. Costanza, R.; d’Arge, R.; de Groot, R.; Farber, S.; Grasso, M.; Hannon, B.; Raskin, R.G. The value of the world’s ecosystem services and natural capital. Nature 1997, 387, 253–260. [Google Scholar] [CrossRef]
  17. De Groot, R.S.; Wilson, M.A.; Boumans, R.M. A typology for the classification, description and valuation of ecosystem functions, goods and services. Ecol. Econ. 2002, 41, 393–408. [Google Scholar] [CrossRef] [Green Version]
  18. Portela, R.; Bezerra, M.O.; Alam, M.; Shaad, K.; Banerjee, O.; Honzák, M. Discussion Paper 8: Water Supply Services: Biophysical Modeling and Economic Valuation in Ecosystem Accounting. Proceedings of Expert Meeting on Advancing the Measurement of Ecosystem Services for Ecosystem Accounting, New York, NY, USA, 22–24 January 2019; Subsequently Revised. Version of 15 March 2019. Available online: https://seea.un.org/events/expert-meeting-advancing-measurement-ecosystem-services-ecosystem-accounting (accessed on 7 May 2021).
  19. Hwang, S.; Um, M.; Kim, T. The valuation of the reliability of municipal water supply using contingent valuation method in Korea. Environ. Resour. Econ. Rev. 1999, 8, 109–126. [Google Scholar]
  20. Park, S.; Ryoo, K.; Kim, J.; Kim, B. The case study of economic value assessment of spring rainfall in the aspect of water resources. J. Environ. Sci. Int. 2014, 23, 193–205. [Google Scholar] [CrossRef] [Green Version]
  21. K-water. Improving Measures of Feasibility Study for Water Resources Projects. Research Report, K-Water. 2008. Available online: https://scienceon.kisti.re.kr/srch/selectPORSrchReport.do?cn=TRKO201800028815 (accessed on 20 August 2020).
  22. Lim, J.; Lee, M. Marginal benefit-cost analysis of irrigation water in rice production. J. Agric. Sci. Chungnam Nat’l Univ. 2001, 28, 132–146. [Google Scholar]
  23. KEI (Korea Environment Institute). EVIS (Environment Valuation Information System). Available online: http://evis.kei.re.kr/research (accessed on 20 August 2020).
  24. Krol, M.; Jaeger, A.; Bronstert, A.; Güntner, A. Integrated modelling of climate, water, soil, agricultural and socioeconomic processes: A general introduction of the methodology and some exemplary results from the semi-arid north-east of Brazil. J. Hydrol. 2006, 328, 417–431. [Google Scholar] [CrossRef]
  25. Ray, P.A.; Kirshen, P.H.; Watkins, D.W., Jr. Staged climate change adaptation planning for water supply in Amman, Jordan. J. Water Resour. Plan. Manag. 2012, 138, 403–411. [Google Scholar] [CrossRef]
  26. Ashofteh, P.S.; Haddad, O.B.; Marino, M.A. Risk analysis of water demand for agricultural crops under climate change. J. Hydrol. Eng. 2015, 20, 04014060. [Google Scholar] [CrossRef] [Green Version]
  27. Liu, Y.; Guo, H.; Zhang, Z.; Wang, L.; Dai, Y.; Fan, Y. An optimization method based on scenario analysis for watershed management under uncertainty. Environ. Manag. 2007, 39, 678–690. [Google Scholar] [CrossRef] [PubMed]
  28. Basupi, I.; Kapelan, Z. Evaluating flexibility in water distribution system design under future demand uncertainty. J. Infrastruct. Syst. 2015, 21, 04014034. [Google Scholar] [CrossRef]
  29. Jeong, G.; Choi, S.; Kang, D. Development and application of hydro-economic optimal water allocation and management model. J. Korea Water Resour. Assoc. 2019, 52, 707–718. [Google Scholar]
  30. MLTM (Ministry of Land, Transport and Maritime Affairs). National Water Resources Plan (2011–2020), Republic of Korea. 2011. Available online: https://www.kwater.or.kr/gov3/sub03/annoView.do?seq=1889&s_mid=54 (accessed on 20 August 2020).
  31. Cho, J.; Jung, I.; Park, J.; Lee, J. Development of AR5 Representative GCMs Selection Technique and Generation of Downscaled Climate Change Scenarios, 2020, CCAW-TR-01, Climate Change Adaptation for Water Resources, Republic of Korea. Available online: https://drive.google.com/file/d/13RY1wOfh8tTtOaRXP75LU3OzkPYrt7qi/view (accessed on 20 August 2020).
  32. Collins, W.J.; Bellouin, N.; Doutriaux-Boucher, M.; Gedney, N.; Halloran, P.; Hinton, T.; Martin, G. Development and evaluation of an Earth-System model–HadGEM2. Geosci. Model Dev. Discuss 2011, 4, 997–1062. [Google Scholar]
  33. Duda, P.; Kittle, J., Jr.; Gray, M.; Hummel, P.; Dusenbury, R.; Decatur, G.; Kinerson, R. An Interactive Windows Interface to HSPF (WinHSPF). In User’s Manual, AQUA TERRA Consultants, 2001. Available online: https://textarchive.ru/c-1882560-pall.html (accessed on 20 August 2020).
  34. Neitsch, S.L.; Arnold, J.G.; Kiniry, J.R.; Williams, J.R.; King, K.W. Soil Water Assessment Tool Theoretical Document, Version 2005. Grassland, Soil and Water Research Laboratory, Agricultural Research Service, 808, 2005. Available online: https://swat.tamu.edu/media/1292/SWAT2005theory.pdf (accessed on 20 August 2020).
  35. Markstrom, S.L.; Regan, R.S.; Hay, L.E.; Viger, R.J.; Webb, R.M.; Payn, R.A.; LaFontaine, J.H. PRMS-IV. The Precipitation-Runoff Modeling System, Version 4. US Geological Survey Techniques and Methods, (6-B7). 2015. Available online: https://pubs.er.usgs.gov/publication/tm6B7 (accessed on 20 August 2020).
  36. Lee, D.; Choi, S.; Kang, S. Results of the National Climate Change Impact Assessment Based on AR5, 2020, CCAW-TR-17, Climate Change Adaptation for Water Resources, Republic of Korea. Available online: https://drive.google.com/file/d/1mBH0L0kJny8FquUiOkzBXJasCjKv8PlY/view (accessed on 20 August 2020).
  37. Korea Statistics. Korea Statistics Yearbook, Republic of Korea. 2017. Available online: https://www.bok.or.kr/eng/bbs/B0000289/view.do?nttId=10046080&menuNo=400366&pageIndex=1 (accessed on 20 August 2020).
  38. Korea Statistics. Population Projections by Province: 2017–2067, Republic of Korea. 2019. Available online: http://kostat.go.kr/portal/eng/pressReleases/8/8/index.board (accessed on 20 August 2020).
  39. Chou, F.N.F.; Linh, N.T.T.; Wu, C.W. Optimizing the management strategies of a multi-purpose multi-reservoir system in Vietnam. Water 2020, 12, 938. [Google Scholar] [CrossRef] [Green Version]
Figure 1. Scheme of water allocation in a river basin.
Sustainability 13 06005 g001
Figure 2. Graphical user interface (GUI) of the water allocation and management model (WAMM). (a) Project management window; (b) allocation management and results window.
Sustainability 13 06005 g002aSustainability 13 06005 g002b
Figure 3. Comparison of long-term water allocation optimization. (a) Single-step linear programming (SSLP) optimization framework and (b) full-step linear programming (FSLP) optimization framework.
Sustainability 13 06005 g003
Figure 4. Case study area with seven sub-basins of the Namhan River basin, South Korea.
Sustainability 13 06005 g004
Figure 5. Schematic of the Namhan River basin water supply network.
Sustainability 13 06005 g005
Figure 6. Rainfall and temperature predictions in the Namhan River sub-basins (in June).
Sustainability 13 06005 g006
Figure 7. Runoff predictions in the Namhan River sub-basins (in June).
Sustainability 13 06005 g007
Figure 8. Water demand prediction in the Namhan River basin (in June). (a) Agricultural water demand of each demand site (30-year average); (b) total agricultural water demand changes over 30 years; (c) municipal/industrial water demand of each demand site (30-year average); and (d) total municipal/industrial water demand changes over 30 years.
Sustainability 13 06005 g008aSustainability 13 06005 g008b
Figure 9. Comparison of predicted river flow and water demand in the Namhan River basin.
Sustainability 13 06005 g009
Figure 10. Water allocation simulation results obtained using reliability-based single-step linear programming (SSLP). (a) Water shortage and (b) economic damage.
Sustainability 13 06005 g010
Figure 11. Water allocation simulation results obtained using economy-based single-step linear programming (SSLP). (a) Water shortage and (b) economic damage.
Sustainability 13 06005 g011aSustainability 13 06005 g011b
Figure 12. Water allocation simulation results obtained using reliability-based full-step linear programming (FSLP). (a) Water shortage and (b) economic damage.
Sustainability 13 06005 g012
Figure 13. Water allocation simulation results obtained using economy-based full-step linear programming (FSLP). (a) Water shortage and (b) economic damage.
Sustainability 13 06005 g013
Table 1. Average water demand at individual sites in the Namhan River basin (in June 2015).
Sub-Basin Demand Sites Water Demand (1000 m3) Sub-Basin Demand Sites Water Demand (1000 m3)
External transmissionM/I. 1303245 1005 A. 100511,280
M/I. 2001780M/I. 1005615
M/I. 1101225 1006 A. 100618,559
M/I. 30113170M/I. 10066095
1001A. 10013900 1007 A. 1007017649
M/I. 10013090M/I. 1007012820
1002 A. 10027361A. 1007023318
M/I. 1002955M/I. 1007021960
1003A. 100311,227A. 10070349,057
M/I. 10034175M/I. 1007036880
1004 A. 100428,585A. 1007044584
M/I. 10044815M/I. 1007042875
Note: A: agricultural water demand; M/I: municipal and industrial water demand.
Table 2. Economic valuation of water supply to municipal/industrial water demand sites.
Demand Site Municipal Water Demand Ratio (%) Industrial Water Demand Ratio (%) Economic Value of Supply (KRW/m3)
M/I. 1001 38 62 3949
M/I. 1002 92 8 1627
M/I. 1003 69 31 2616
M/I. 1004 80 20 2143
M/I. 1005 63 37 2874
M/I. 1006 92 8 1627
M/I. 100701 61 39 2960
M/I. 100702 61 39 2960
M/I. 100703 61 39 2960
M/I. 100704 61 39 2960
M/I. 1101 100 0 1283
M/I. 1303 100 0 1283
M/I. 2001 100 0 1283
M/I. 3011 100 0 1283
Table 3. Comparison of full-step linear programming (FSLP) and single-step linear programming (SSLP) water allocation results.
Water Allocation Method Total
Reliability
Average Maximum Minimum
Water Shortage
(106 m3/Month)
Economic Damage
(109 KRW/Month)
Water Shortage
(106 m3/Month)
Economic Damage
(109 KRW/Month)
Water Shortage
(106 m3/Month)
Economic Damage
(109 KRW/Month)
Reliability-based SSLP 0.95 9.7 5.0 32.3 16.9 0.7 0.9
Economy-based SSLP 0.97 6.7 3.8 21.5 10.6 0.7 0.9
Reliability-based FSLP 0.99 2.5 2.03 8.3 4.38 0.7 0.9
Economy-based FSLP 0.99 2.5 2.02 8.3 4.36 0.7 0.9
Publisher’s Note: MDPI stays neutral with regard to jurisdictional claims in published maps and institutional affiliations.