Abstract
When integrating the Internet of Things (IoT) with Unmanned Aerial Vehicles (UAVs) occurred, tens of applications including smart agriculture have emerged to offer innovative solutions to modernize the farming sector. This paper aims to present a low-cost platform for comprehensive environmental parameter monitoring using flying IoT. This platform is deployed and tested in a real scenario on a farm in Medenine, Tunisia, in the period of March 2020 to March 2021. The experimental work fulfills the requirements of automated and real-time monitoring of the environmental parameters using both under- and aboveground sensors. These IoT sensors are on a farm collecting vast amounts of environmental data, where it is sent to ground gateways every 1 h, after which the obtained data is collected and transmitted by a drone to the cloud for storage and analysis every 12 h. This low-cost platform can help farmers, governmental, or manufacturers to predict environmental data over the geographically large farm field, which leads to enhancement in crop productivity and farm management in a cost-effective, and timely manner. Obtained experimental results infer that automated and human-made sets of actions can be applied and/or suggested, due to the innovative integration between IoT sensors with the drone. These smart actions help in precision agriculture, which, in turn, intensely boost crop productivity, saving natural resources.
1. Introduction
The Food and Agriculture Organization (FAO) predicts that by 2050, the world population will hit 9.73 billion, and by 2100, it will be 11.2 billion; with the current population of approximately 7.84 billion, this shows an increase of approximately 25% [1]. To feed this larger population, food production should double by 2050 [2]. For example, the current figure of 2.1 billion tons of annual cereal production should reach approximately 3 billion tons [3]. This means there is a serious need to enhance productivity and meet the demands of nations [4]. However, the current agricultural land is restricted by various factors such as land and climate patterns, population density, and rapid urbanization, which are constantly posing threats to the availability of arable land [5]. To illustrate, in 1991, the total arable area for food production was 19.5 million square miles (39.47% of the world’s land area), which was reduced to approximately 18.6 million square miles (37.73% of the world’s land area) in 2013 [6]. Thus, the gap between the demand and supply of food is becoming more significant and alarming as time progresses. Therefore, authors in the literature [7,8] emphasize the significance of enhancing farm management by using scientific strategies and technology in the agricultural field, which, in turn, drastically boost crop productivity and help in saving natural resources [9,10].
In recent years of the Fourth Industrial Revolution (4IR), researchers, engineers, and IT specialists are striving to participate in employing advanced technology to achieve a better life for our planet, as Figure 1 shows [11,12]. One of those pillars of 4IR is IoT, which is considered as the fuel of the 4IR since it contributes effectively by linking trillions of objects and sensors, all of which generate real-time data. It is expected that around 100 billion devices have been connected to the internet by 2020 [13,14]. This number will further increase since the IoT is progressively entering a wide array of sectors and industries, ranging from manufacturing, health, communications, and energy to the agricultural industry [15]. In an agricultural environment, for instance, IoT technology has been utilized to deal with distributed data collection from farming environments and, important for directing farmers, with real-time information of the farming field [16]. On the other hand, integration between IoT and Unmanned Aerial Vehicles (UAVs) attracts researchers’ attention for various reasons. UAVs’ reliability, flexibility, portability, line of sight (LoS) connectivity, efficiency, applicability, rapid deployment, and low maintenance cost are valid reasons for considering such a technology. UAVs cover a wide range of platforms, from drones to high altitude platforms (HAPs), low altitude platforms (LAPs), or tethered platforms [17,18]. UAVs have drawn tremendous attention, both in the industry and academia, due to their advantages and wide applications [19]. For example, telecommunications, monitor disaster-relief missions, empowering smart cities, atmospheric studies, service delivery, surveillance, high-resolution imaging, and military applications [20,21].
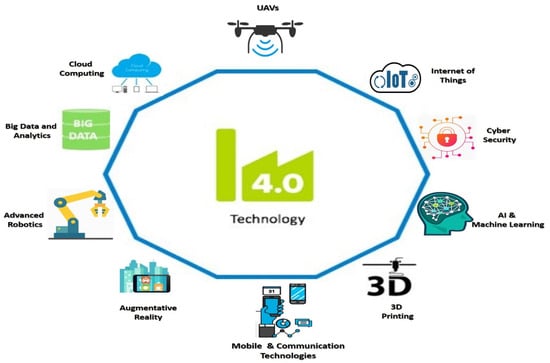
Figure 1.
Technological pillars of the 4IR including UAV and IoT.
Goldman Sachs predicts that the agriculture sector will be the second-largest user of drones in the world in the next five years [22]. Thus, the use of UAVs in agriculture is expanding rapidly to assist farmers with monitoring and making decisions that support crop productivity via acquiring field data in easy, fast, and cost-effective ways, compared to traditional methods [23]. Farmers and other stakeholders can access the data gathered through UAVs from cloud-based platforms remotely through apps from their smart devices, which can help in predicting the yield of the crop, pesticides, fertilizers, seed sowing, etc. Figure 2 illustrates various scenarios of smart farming using a UAV, where a wide range of agricultural parameters can be monitored to improve crop yields, reduce costs, and optimize process inputs, such as environmental conditions, growth status, soil status, irrigation water, pest, and fertilizers, weed management, and greenhouse production environment [24]. The evolution of IoT and UAVs has enabled the vision of sustainable smart farming, in which data can be obtained and processed autonomously, to enhance production time, and farm management practices more efficiently [25].
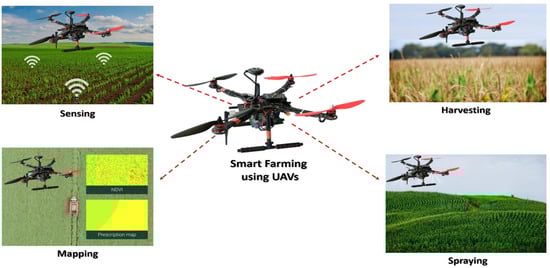
Figure 2.
Different types of agricultural UAVs.
The rest of this paper is organized as follows: related works are investigated in Section 2; a state-of-the-art review is outlined in this section with a highlight of major applications of coupling IoT with UAV technology in smart farming. Materials and methods are presented in detail in Section 3; this section presents the architecture of the proposed system. In Section 4, we describe the implementation and testbed; the proposed solution has been deployed and validated in a farmhouse that covers a large set of different agricultural activities using flying IoT. The experimental results are described in Section 5; experimental results in this section are discussed from two aspects—first, the results of smart farming’s environmental monitoring of temperature, humidity, soil moisture, rain level, and solar radiation are presented, and second, results of the Hata propagation model, which include PL and RSS. Finally, Section 6 concludes this paper.
2. Related Works
A state-of-the-art review is outlined in this section with a highlight of major applications of coupling IoT with UAV technology in smart farming. Communication technologies, network functionalities, and connectivity requirements of such integration are covered in this section. A related work windup is presented in Table 1, before using this review to highlight the research gaps and report own research motivations.

Table 1.
Related work windup in smart farming based on the IoT and UAV.
Georgios et al. [26] proposed a low-cost Long-Range Wide-Area Network (LoRa)-based IoT platform for Smart Farming Modular IoT Architecture called LoRaFarM that aims to improve generic farms management in a highly customizable way. The proposed LoRaFarM platform has been evaluated in a real farm in Italy, where it collected environmental data (air, soil, temperature, and humidity) related to the growth of farm products (e.g., grapes and greenhouse vegetables) over a period of three months. A web-based visualization tool for the collected data is also presented, to validate the LoRaFarM architecture.
Authors in [27] developed a hierarchical smart farming structure based on the collaboration between UAVs and federated Wireless Sensor Networks (WSNs) for crop monitoring. Two important aspects of such collaboration have been considered: designing the UAV trajectories for efficient data collection and implementing effective data processing algorithms (consensus and symbolic aggregate approximation) at the network level to assess relevant data transmission. Experiments were carried out at a Romanian research institute where different crops and methods are developed. The results demonstrate that the collaborative UAV–WSN–IoT approach increases the performances in both smart farming and ecological agriculture.
A smart agriculture management system (SAMS) was introduced in [28], which proposed an automated system to help farmers to increase crop production by crashing into natural resources. The system used different sensors to collect data required for the growth of the crop, where these data were fed into the ThingSpeak IoT cloud platform for data visualization. The real-time data were stored on Firebase Database and then used for crop prediction using Support Vector Machine (SVM) classifier.
Researchers in [29] presented an intelligent antifrost irrigation management system that contains a climatological station and ecological anti-disaster frost irrigation. The solar-powered system interacts with the environmental system through a website, allowing the real-time interconnection, acquisition, and monitoring of information through mobile phone systems (GSM/GPRS) and internet (TCP/IP) services. Additionally, the proposed system uses an intelligent Fuzzy Expert System (FES) to predict the greenhouse temperature and control activation of a water pump, considering humidity, the temperature of inside and outside air, solar radiation, and wind speed. The intelligent model gives a prediction by determining coefficients with the analysis of variance method.
Nestor et al. in [30] developed an application for water irrigation called “Agrinex.” This system is an alternative approach in collecting and measuring physical parameters from the environment, particularly in smart irrigation systems. Agrinex is connected to several in-field sensors such as a water level sensor, paddy temperature sensor, and a field weather station. This work aimed to make this information accessible anywhere wherever there is internet access using a mobile application, which makes Agrinex scalable and adaptable to changes. The mesh-based network recorded a maximum transmission distance of 11 m from sink to sensor node with a 90% success rate. Data from the field can be accessed remotely close to real-time when short network delays are accounted for. It also gives the additional benefit of equipping lands with an automated irrigation system that conserves up to 81% of water consumption.
Authors in [31] proposed a system that decides whether or not water is needed for farms by predicting the rainfall using the Genetic Algorithm (GA) approach. In the proposed system, voluminous weather and soil moisture data are stored inside the cloud servers. Based on data collected by a UAV and then fed to the GA, water spraying is performed, which can be monitored using a mobile application. Cloud servers are used for storing and processing large volumes of weather and soil moisture data. Results show that the sensor-based system is activated to check whether the GA-based system completes its prediction correctly or not by sensing moisture levels from the soil. If the moisture level of the soil crosses the predefined threshold value, then plant watering is performed by quadrotor UAV.
Researchers in [32] developed a framework for monitoring pests and diseases of crops based on IoT and UAV that attempts to solve the correlation between the occurrence of pests/diseases and weather parameters. The proposed framework is deployed in the Yangtze River Zone of China, where it uses rotary devices based on sun perception to obtain solar energy. Results infer that low-altitude remote sensing and monitoring through aerial imaging of pests and diseases using UAV is reasonable, while more analyses of climate changes would provide some precautions in advance.
A Narrow Band IoT (NB-IoT) system is proposed in [33] to collect underground soil parameters in potato crops using a UAV network. Around 2500 sensors deployed under and above ground are connected to UAV using Low-Power Wireless Personal Area Network (LPWPAN). Simulation results show that due to UAV altitude and path loss, the link quality between the ground sensor and UAV is reduced. Another observation is that the lifetime of sensor batteries was varied depending on the location of the sensor under or above ground. Using LoRa technology and proper path loss model are recommended as future work to enhance link accuracy and performance. Regarding path loss, authors in [22,23,24,25] discussed different types of propagation path loss from an aerial platform perspective, where Free-Space and Air-to-Ground are typical deterministic propagation models, while Hata and Okumura are typical empirical ones. Results show that an appropriate model can be selected based on coverage range, adaption across different terrains, and better Quality of Service (QoS).
Authors in [34] suggested a heterogeneous IoT sensor node system to sense acoustic, rain, wind, light, temperature, and pH levels of the cornfields for smart agriculture applications. The system aimed to achieve productive corn harvest in large-scale fields using a drone that gathers data and sends it to a gateway. The simulation results that monitored at the gateway using the IoT application called Grafana show that it offers maximum efficiency from the soil and follows the crop development according to the weather and soil conditions, in addition to reducing the workload and the risk of disease and pest, as well as optimizing irrigation and obtaining better quality products at low cost. As future work, collecting a wider range of climatic data and geographical conditions would be useful in designing a model of smart farming.
A related work windup in smart farming based on the IoT and UAV is presented in Table 1, before using this review to highlight the research gaps and report the authors’ research motivations.
This paper is motivated to present a low-cost platform for comprehensive environmental parameter monitoring using flying IoT. This integration between IoT and drone is also coupled with cloud computing technology, which, in turn, helps in building sustainable smart agriculture and enhancing crop productivity and farm management in a cost-effective, and timely manner.
Thus, the paper aims to implement a system that periodically collects data using both under- and aboveground sensors on farms and sends them to the gateway; then, using a drone with a LoRa module onboard, the obtained data are transmitted to the cloud for storage, analysis, and monitor the status of crops and farms. The proposed platform is based on experimental work to fulfill the requirements of automated and real-time monitoring of the environmental parameters for 12 months. Thus, a clear picture can be obtained to make wise decisions in managing the crop and enhancing its productivity. This integrated system of multiple technologies used in the proposed platform develops comprehensive under- and aboveground sensors, along with considering an optimized propagation path loss, which is a noteworthy shift from existing works. In this context and to achieve the paper’s aim, the following research objectives need to be pursued:
- O1.
- Identification of environmental parameters affecting crop productivity;
- O2.
- Selection of a propagation model that is suitable for smart farming;
- O3.
- Hardware calibration of related devices for experimental work;
- O4.
- Implementation of the proposed platform and testing ti in a real scenario;
- O5.
- Analyzing findings and drawing smart action plans to help in precision agriculture.
3. Materials and Methods
This section presents the architecture of the platform, which aims to monitor using both under- and aboveground sensors and a drone for smart farming. Figure 3 shows the conceptual work in a bird’s-eye view of the proposed architecture, which consists of space segment and ground segment. The space segment comprises the drone, with its payloads including the camera, and LoRa module, which is responsible for collecting data from a wireless server gateway and then transmitting them to the cloud for storage and further analysis. The ground segment contains three parts: (1) ground control station that is controlled by the end user; (2) underground sensors gateway node that collects data from underground sensors (soil moisture); and (3) HOBO U30 Weather Station Starter Kit, which is an aboveground sensor that measures temperature/humidity, rain, and solar radiation. Clearly, in the proposed platform architecture, the drone acts as a focal point between ground devices including sensors, relays, and gateways, on the one hand, and cloud, on the other hand, which reflects the reliability and robustness of such a technology.
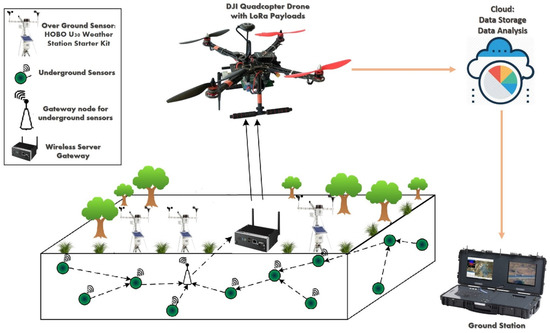
Figure 3.
Overview of the agricultural IoT platform.
The rest of this section discusses the proposed architecture from functions and specifications in five layers, namely, sensor nodes layer, wireless server gateway, drone-LoRa layer, cloud layer, and end-user layer.
3.1. Sensor Nodes Layer
For smart farming, we considered two main types of IoT sensors to measure various parameters of an agricultural field, which are underground sensors and aboveground sensors. The former is related to sensors measure soil moisture. These sensors can transmit data to the wireless server gateway node for storage and processing. The latter, as Figure 4 shows, uses the HOBO U30 Weather Station Starter Kit, which can accept up to 10 plug-and-play smart sensors to measure temperature/humidity, rain, and solar radiation. The nodes are powered with a rechargeable battery using solar panels. The goal of having a comprehensive sensor is to provide stakeholders in the agricultural field with a full range of data that would help in making a wise decision in managing crops and resources (e.g., water), besides enhancing farm productivity. These wireless sensors can be placed in various locations throughout a farm, even in the harshest environmental conditions.
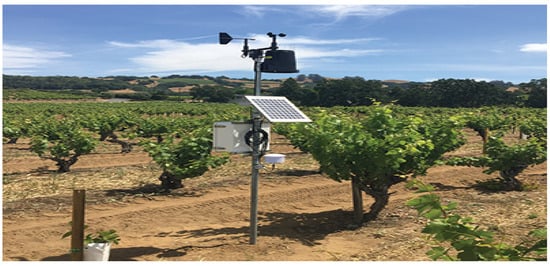
Figure 4.
HOBO U30 Weather Station Starter Kit in Medenine, Tunisia.
Figure 5 shows sensors that are attached to HOBO U30 Weather Station Starter Kit. Figure 5 illustrates an S-THB-M008 temperature/humidity smart sensor, which consists of a monitoring system for recording two environmental parameters. The temperature paraments can be measured within a range between −40 to 75 °C, while the humidity range is between 0 and 100 %. The stainless-steel sensor tip and durable cable, rated for submersion in water at 50 °C for up to one year, ensure reliable operation. The length of this model is 2 m. Figure 5 displays the S-RGB-M002 rain gauge, which considers a smart rainfall sensor used to measure up to 5 inches of rain per hour with an accuracy of 0.01 inches and a maximum interval of 4000 tips; also, the sensor contains two-meter cables.
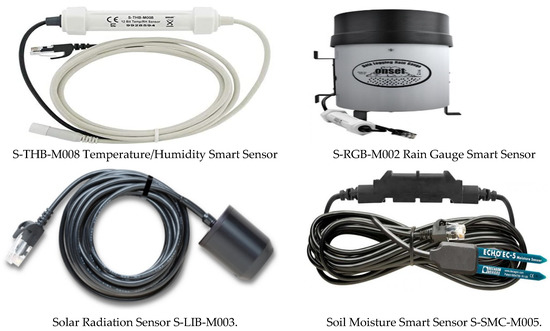
Figure 5.
Sensors that attached to HOBO U30 Weather Station Starter Kit.
Figure 5 displays the solar radiation sensor S-LIB-M003, which can effectively measure light levels with a silicon pyranometer sensor. This product offers a measurement range of 0 to 1280 W/m2 over a spectral range of 300 to 1100 nm. A measurement averaging mode is available. All these smart sensors can transfer all stored data automatically to the recorder without the need for any programming or comprehensive user configuration. Figure 5 shows a soil moisture smart sensor S-SMC-M005, which offers a two-tine design for easy installation. In addition, S-SMC-M005 is a smart sensor, allowing users to launch monitoring systems quickly, easily, and affordably. It provides ±3% accuracy in typical soil conditions and ±2% accuracy with soil-specific calibration. Readings are provided directly in volumetric water content, where this sensor is designed to maintain low sensitivity to salinity and textural effects.
3.2. The Wireless Server Gateway
This layer is responsible for collecting data from sensor nodes and aggregating and transmitting to the drone–LoRa layer using LoRa module, which is a long-range wide-area network technology, such as a cellular network, but designed for lower energy consumption. It enables devices to send small amounts of data over long distances, for years, running on a small battery. The range of the LoRa gateways is 15 km in rural areas and 5 km in urban areas. Table 2 shows the difference between the main low-power wide-area network (LPWAN) technologies, one of which is LoRa. Figure 6 shows communication between the HOBO U30 Weather Station Starter Kit and wireless server gateway.
Table 2.
Comparison between short-range and long-range technologies [7,8].
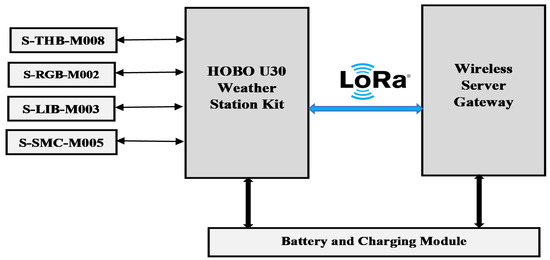
Figure 6.
Block diagram of wireless server gateway.
3.3. The Drone–LoRa Layer
This layer is responsible for collecting data from wireless server gateway and transmitting them to the cloud using LoRa technology. Since at remote areas such as farms, there might be no network deployment, and/or the installation of a LoRa gateway might impose a significant cost without guaranteeing the interconnection of all the installed devices, this proposal used a drone as a mobile gateway to collect data from time to time from various sensors located in the farm. Besides the drone mobility and flexibility, it allows accessing remote and hard locations, which is represented as a flying LoRa gateway. The drone–LoRa gateway is a multi-radio device that is endowed with at least two different wireless interfaces for communication between the IoT devices and the cloud. Dragino, a manufacturer of IoT systems, created a LoRa gateway device called LG02, which was used for this system. LG02 is an open-source dual-channel LoRa Gateway. It lets you bridge LoRa wireless network to an IP network via WiFi, Ethernet, 3G, or 4G cellular, with a frequency range of 862~1020 MHz.
Figure 7 shows the drone configurations of the experiment, where the drone is presented, along with its components including electronic speed controllers (ESCs), motors, propellers, flight controller (Pixhawk-4), BME280 sensor, battery, and Raspberry Pi 3 microcontroller, and the LoRa module. This module, which is located onboard the drone, uses a 4G transceiver as a channel to establish communication between the ground server gateway and the cloud, as seen in Figure 8. Of note, the gateway server represents the interface between a large area with a significant number of nodes and the cloud.
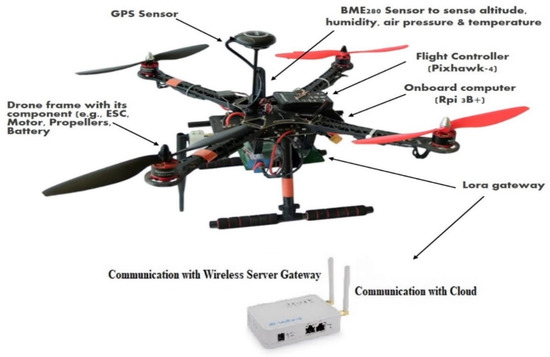
Figure 7.
The drone–LoRa gateway.
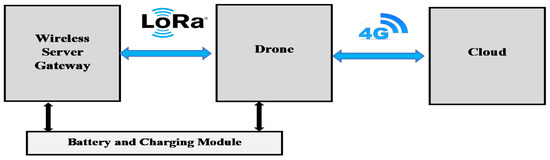
Figure 8.
Block diagram of drone–LoRa gateway.
3.4. The Cloud Layer
Collaboration of IoT and cloud computing in agriculture provides pervasive access to shared resources. To meet various agricultural needs upon request over a network and execute operations, cloud computing plays a vital role. Cloud provides a large amount of storage through large, virtualized servers that are connected to perform necessary action. Analytics resources and web services are also installed on the cloud or the internet, which are accessible by cloud services. Cloud computing can be used for a twofold purpose in smart farming applications, i.e., (i) to gather and store information that is transmitted from the remote client and (ii) to process the data and display the results to the users. Data processing includes visualization, data analytics, decision making, etc.
3.5. The End-User Layer
This layer represents the ground station, which is typically sets of ground-based hardware and software to communicate with the drone via wireless telemetry in the hand of an admin user. This portable and universal ground station also provides a range of applications (e.g., control the launch, flight, aerial imaging, and recovery of the drone). This work considered the optimized Hata empirical propagation path loss model to bridge the gap between the ground station and the drone at the cloud layer. The novel twist on the considered Hata path loss model used in this work involves using the elevation angle instead of distance to optimize the model when propagating signals from the drone to terrestrial sensors and using LoS connectivity to improve reliability, increased end-user mobility, and reduce power consumption [35,36]. This is a noteworthy shift from what exists in models presented in the literature, as presented in related works of the previous section.
Hata’s equations are classified into urban, suburban, or rural areas; yet, here, it was considered only in rural areas since it involved farm zones [37,38]. The distance of the Hata propagation model is computed based on elevation angle , which is a notable shift from existing propagation models. The is a vital element in calculating path loss from space such as in drone scenarios. Path loss in a rural area is given by
where f denotes frequency (MHz), ht denotes transmitter altitude (m), which represents drone altitude, hr denotes receiver altitude (m), which represents the ground station, d denotes transmitter to receiver separation in (km), denotes Earth’s radius at 6378 km, and a(hr) denotes correction factor for effective mobile antenna altitude, which is a function of the size of the coverage area. Received signal strength (RSS) represents the strength of wireless signals as measured by the receiver, which is typically measured in units of decibels (dB) [39]. Calculating PL model and RSS are useful in monitoring system performance, network planning, and coverage to achieve perfect reception. The RSS can be calculated as follows:
where Pt denotes transmitter power (dBm), Gt denotes transmitter antenna gain (dBi), Gr denotes receiver antenna gain (dBi), PL demotes path loss of Hata model in a rural area, and L denotes connector loss (dB).
4. Implementation and Testbed
This section presents the proposed solution as deployed and validated in a farmhouse that covered a large set of different agricultural activities using flying IoT. The low-cost proposal platform was considered for comprehensive monitoring of environmental parameters using both under- and aboveground sensors. Field experiments were carried out from March 2020 to March 2021 at Medenine, Tunisia; some background information about this region, such as geographic location, soil property, and climate can be referred to the map of world climates.
The proposed system can be explained in five steps, as Figure 9 shows. S-THB-M008 refers to temperature/humidity sensor, S-RGB-M002 refers to rain gauge sensor, S-LIB-M003 refers to solar radiation sensor, and S-SMC-M005 refers to soil moisture smart sensor. First, both under- and aboveground sensors collected relevant data from the farm every 1 h. Second, these data were stored temporarily on an embedded Secure Digital (SD) card in the wireless server gateway. Third, the drone flew and collected data from various wireless server gateways located in the farm every 12 h. Fourth, the drone sent the data to the cloud. Fifth, automated and human-made sets of actions could be taken to apply smart actions for precision agriculture, which, in turn, dramatically boost crop productivity, and help in saving natural resources. These actions could be obtained from the cloud into the user interface smart device. However, a decision support system could be introduced in a future study to link the farm’s smart devices together to achieve an autonomous system.
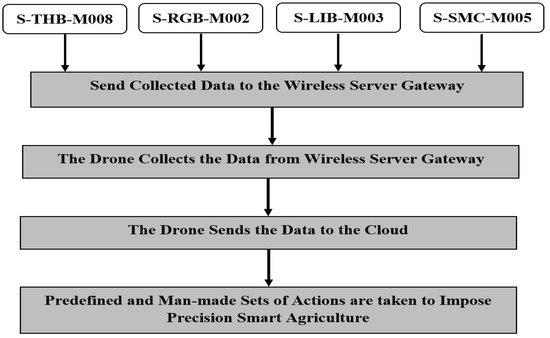
Figure 9.
Five steps of executing the proposed model.
Figure 10 shows the sensor placement that was considered in our practical experiments. In total, there were 4 HOBO U30 Weather Station Kits deployed in the field in various experimental parcels from our farm. Each Station Kit had one temperature/humidity sensor (Ref: S-THB-M008), one rain sensor (Ref: S-RGB-M002), two soil moisture sensors (S-SMC-M005), and one solar radiation sensor (S-LIB-M003). This layout of the farm was divided into four sections according to its current layout, where each HOBO Weather Station Kit was placed in every section with a distance of about 0.5 km between each other. Each HOBO Weather Station was powered with renewable energy from the sun via solar panels, while smart sensors to measure temperature/humidity, rain, and solar radiation were linked to this kit. This means the lifetime of these sensors are very long and sufficient, due to rechargeable battery using solar panels.
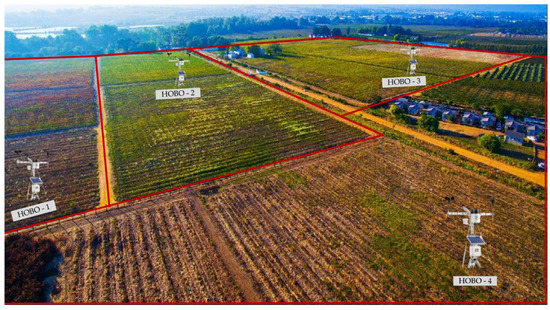
Figure 10.
Topographic map of HOBO U30 Weather Station Starter Kit in four zones.
For UAV setup, the DJI Quadcopter drone was used for the testing scenario. All hardware modules for the sender were mounted on the drone including, the LoRa transceiver. The considered drone was a fixed-wing type, which enabled coverage of large geographic areas with low energy consumption. For the sake of improving energy utilization efficiency, the flight path of the drone was planned previously using Strip’s approach, as Figure 11 demonstrates, using freeware Mission Planner software calibrated by remote control [40]. The considered drone was equipped with a rechargeable battery with a flight time of about 30 min, where the drone flew every 12 h to collect data from four server ground gateways that linked to HOBO, before transmitting it to the cloud for storage and analysis.
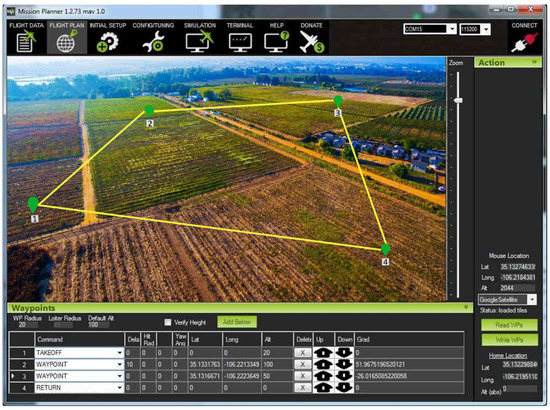
Figure 11.
Drone path planning of topographic map in four zones using Mission Planner software.
5. Experimental Results
After defining the main parts of the proposed design system and methodology, along with the main structure of the testbed, this section highlights practical measurements and results.
This proposed design was deployed and tested in a real scenario on a farm in Medenine, Tunisia in the period of March 2020 to March 2021. This system was deployed and validated in Medenine, Tunisia, due to its varied terrain and options of open farms that covered a large set of different agricultural activities. Indeed, the chosen farm covered both open-field and greenhouse cultivation, together with the production of several different agricultural products. Furthermore, the farms were manually controlled by the farmers without the support of any technology, just based on their experiences.
Assessing the impact of environmental factors and prototyping outdoor applications as part of live projects provides a better understanding of smart IoT that greatly combined with UAV technology, which helps in precision agriculture, and, in turn, intensely boosts crop productivity, saving natural resources in a real-case scenario.
Experimental results in this section are discussed from two aspects—first, the results of smart farming’s’ environmental monitoring of sensing temperature, humidity, soil moisture, rain level, and solar radiation are presented, and second, the results of the Hata propagation model, which include PL and RSS. These parameters show the focal point between the ground station and the drone at the cloud layer.
5.1. Monitoring of Environmental Parameters
The IoT sensor devices on a farm collect vast amounts of environmental data, through which they are sent to ground gateways every 1 h, and then the obtained data are collected and transmitted by a drone to the cloud for storage and analysis each 12 h. In this subsection, smart farming’s environmental monitoring of sensing temperature, humidity, soil moisture, rain level, and solar radiation are presented. Along with these environmental monitoring, automated and human-made sets of actions have been highlighted to apply smart actions for precision agriculture. It is worth mentioning that Figure 12, Figure 13, Figure 14, Figure 15 and Figure 16 are representative experimental results from massive results that we collected in the field in one year.
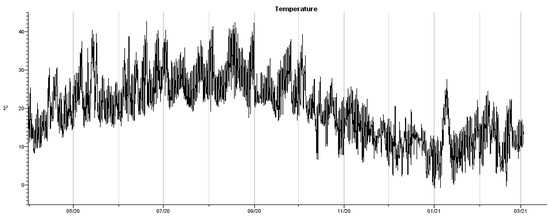
Figure 12.
Experimental results gained from the S-THB-M008 temperature sensor.
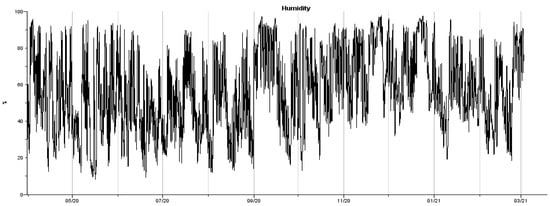
Figure 13.
Experimental results gained from the S-THB-M008 humidity sensor.
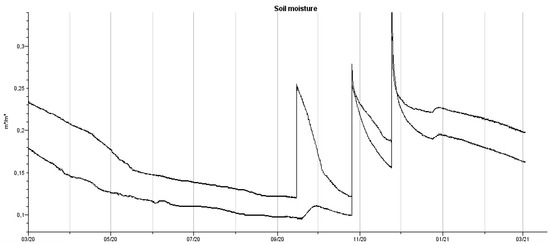
Figure 14.
Experimental results gained from S-SMC-M005 refer to soil moisture smart sensor.
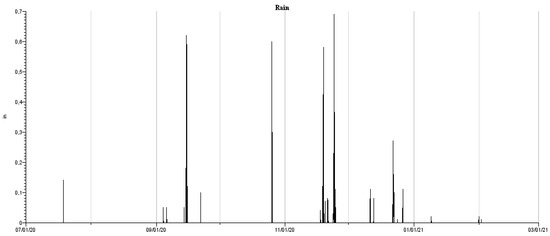
Figure 15.
Experimental results gained from the S-RGB-M002 rain gauge sensor.
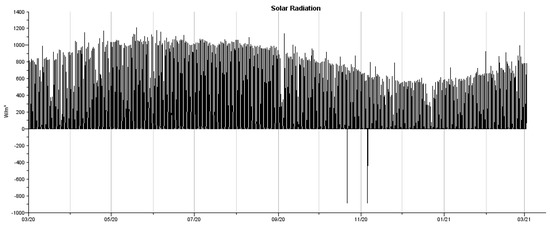
Figure 16.
Experimental results gained from the S-LIB-M003 solar radiation sensor.
Figure 12 and Figure 13 show temperature and humidity reading, respectively, from its relevant sensor in a period from March 2020 to March 2021 in Medenine, Tunisia. Clearly, during early summer (June to September), temperature ranges from 25 °C to 40 °C, while in autumn and winter temperature, it reaches below 20. Another observation is in December and January when the temperature reaches single digits, which represents the coldest period of the year, whereas July and August have the highest temperatures. The average humidity is usually linked to temperature, which depends on the actual wind and the sunshine amount and temperature. Crops have minimum and maximum temperatures at which growth developments are affected. Thus, examples of automated and human-made sets of actions that can be driven from the sensed temperature data include the following:
- At minimum temperatures (e.g. early spring), farmers are advised to focus on seeds germination, and watering should be discrete since this period is favorable for growing crops;
- During the periods with temperatures below the minimum temperatures (e.g. winter or autumn) planting processes should stop;
- At maximum temperatures (e.g. summer), water sprinklers in farms can increase the watering of plants and should be continuous through the summer;
- High humidity and temperatures are more favorable for the spread of crop pests and diseases; thus, farmers are advised to consider various strategies such as spraying chemicals on plants.
- Plantings and quarterly grains that are suggested for the Medenine area in case of high humidity and temperature conditions are Apricot, apples, Figs, Peaches, Grapes, and Almonds.
Monitoring meteorological parameters such as soil moisture is an essential stage of agriculture. Figure 14 shows the soil moisture reading from its relevant sensor in a period from March 2020 to March 2021 in Medenine, Tunisia. Soil moisture reflects the water that is held in the spaces between soil particles, where having these data would help in understanding soil temperature, soil nutrients, soil density, and viscosity. It is noticeable from experiential results that soil moisture is overlapped with rainfall and/or water irrigation, where autumn and winter seasons represent peak values due to high rainfall. Therefore, smart actions can be considered based on soil moisture data include the following:
- Water sprinklers in farms can automatically be on or off based on the level of soil moisture to irrigate the crops;
- Farmers can make the right decision to spray pesticides or apply fertilizers that are based on the current state of the soil moisture;
- Soil management can be gained via on-site soil monitoring (nutrient analysis, soil erosion, soil organic carbon, and insects) and then choosing the right plants for the right lands;
- Plantings and quarterly grains that are suggested for the Medenine area in case of middle-range soil moisture conditions are potatoes, pomegranate, orange, and lemon.
Watering is an essential aspect in agriculture, either by relying on rainfall and/or irrigation. Figure 15 demonstrates the rainfall reading from its relevant sensor in a period from March 2020 to March 2021 in Medenine, Tunisia. As can be seen from the experimental results, autumn and early winter months (September to January) represent peak values due to high rainfall with average floats between 14 and 20 mm, whereas the rest of the year with average floats around 2–6 mm. Hence, smart actions can be considered based on rainfall data such as the following:
- Before irrigation using automated dripping and sprinkling, check the soil moisture in the root zone at several locations;
- Estimate the amount of water needed to bring the soil to field capacity to save resources;
- High and concentrated rainfall might destroy some types of crops; thus, rain sensors would give precaution measures to farmers (e.g. use temporary greenhouses to protect crops);
- Improve water-use efficiency via controlling irrigating status based on rainfall level;
- Plantings and quarterly grains that are suggested for the Medenine area in case of high-level rainfall conditions are orange and lemon.
Solar radiation has vital importance for crop growth, yield, prevention of pests and diseases, and quality enhancement in agricultural products, where eaves absorb sunlight and use it as the energy source for photosynthesis. Figure 16 shows the solar radiation reading from its relevant sensor in a period from March 2020 to March 2021 in Medenine, Tunisia. Experimental results indicate that the average radiation floats between 400 and 1000; in winter readings display around 400 , while autumn readings show around 600–800 , and summer readings show around 1000. Therefore, smart actions can be considered based on solar radiation data such as the following:
- Providing valuable data on solar light intensity and duration since plants do not absorb all sunlight, due to reflection, possible damage leaves, and respiration requirements of photosynthesis;
- Farmers are advised to consider greenhouses to protect plants from the high light intensity in open fields during summer;
- Adjust irrigation using automated dripping and sprinkling based on the solar radiation measurements since the temperature is usually linked to the actual amount of sunshine;
- Using solar panels for powering the weather station leads to energy efficiency;
- Farmers are advised to seed (e.g., wheat seeded) early spring since seeding earlier can provide crops a yield advantage;
- Plantings and quarterly grains that are suggested for the Medenine area in case of middle-range of solar radiation conditions are beans, pineapple, lettuce, and raspberries.
To sum up, the more we understand the relationships between the monitored crops their surrounding climate, the better we can plan and design stronger cropping practices. The proposed design in this paper emphasizes automated and real-time monitoring of the environmental parameters and making wise decisions and actions, either automated or human-made sets of actions, which, in turn, lead to vegetative growth, root growth, water uptake, saved resources, and flowering. Moreover, these sets of actions would support smart decisions for precision agriculture during four seasons and hence increase crop productivity.
Figure 17 shows sensing temperature, humidity, soil moisture, rain level, and solar radiation in 24 h on 15 September 2020 as representative experimental results in a short period of time. Clearly, temperature and humidity readings show similar characteristics during summertime such as in September. The solar radiation line graph shows a spike value at around 12.30 afternoon. Rainfall and soil moisture show a positive correlation.
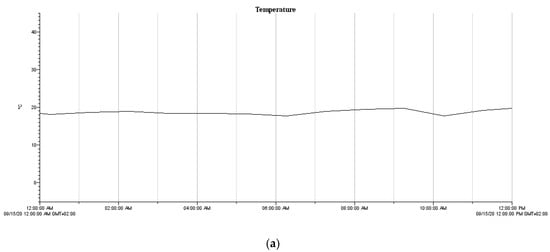
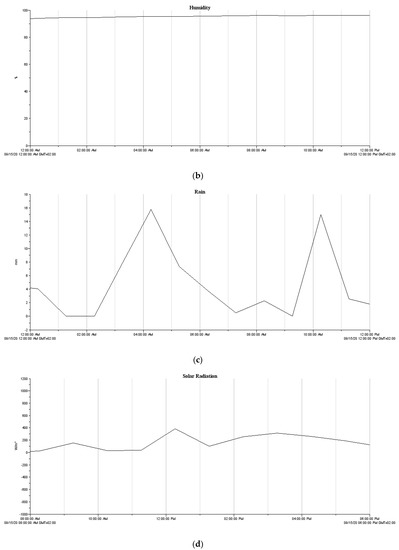
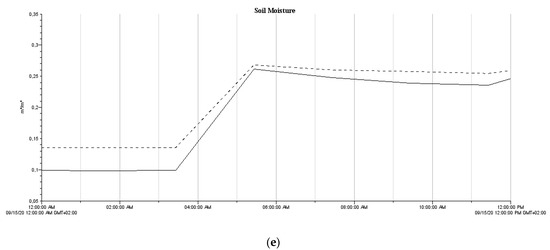
Figure 17.
Sensing temperature, humidity, soil moisture, rain level, and solar radiation in 24 h on 15 September 2020: (a) sensing temperature in 24 h on 15 September 2020; (b) sensing humidity in 24 h on 15 September 2020; (c) sensing rain level in 24 h on 15 September 2020; (d) sensing solar radiation in 24 h on 15 September 2020; (e) sensing soil moisture in 24 h on 15 September 2020.
5.2. Propagation Model Parameters
Figure 18 shows the obtained PL and RSS of the Hata propagation model of the distance between the ground station and the drone at the cloud layer. Experimental predictions of the considered Hata propagation model show that the range of PL floats between −97 dB to −127.5 dB. Additionally, PL has a positive correlation with distance, which represents the drone altitude. Noticeably, the shadowing effect and reflection of signals from interfering obstacles were low, due to line-of-sight connectivity between the ground station and the drone. As RSS is linked to PL, results show RSS varying between −40 dBm to −70 dBm, which has again a positive correlation with distance (drone altitude). Unsurprisingly, increasing transmission power would enhance RSS, since RSS depends on transmitter power, antenna gains, and environmental factors. Having the results of the propagation model including PL and RSS is useful in monitoring system performance, network planning, and coverage to achieve perfect reception. In our scenario, this means communication between drone and ground station as well as wireless server gateway showing a high level of reception with the smallest attenuated signal, besides achieving stronger wireless connectivity. This also helps in delivering collected data from the drone to the cloud for storage and analysis in an efficient and timely manner.
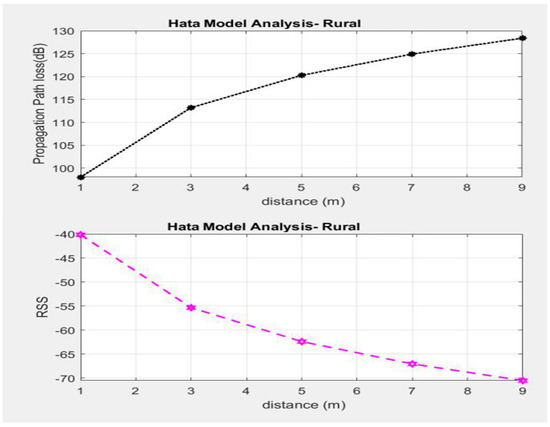
Figure 18.
PL and RSS of Hata propagation model results.
5.3. Comparison between the Proposed System and Other Existing Systems
A comparison between the proposed system and other existing systems is presented in Table 3. This comparison is based on the major advantages, validation, decision support, and critical challenges.
Table 3.
Qualitative comparison between the proposed system and other existing systems.
6. Conclusions
Smart farming involves the integration of advanced technologies into existing farming practices to increase production efficiency and quality of agricultural products. The evolution of IoT and UAVs has enabled the vision of sustainable smart farming, where these smart technologies have proven to increase the quality of crop yield and reduce the environmental footprint from the agricultural sector. This paper shows a low-cost platform for comprehensive environmental parameter monitoring using flying IoT. The proposal is based on experimental work to fulfill the requirements of automated and real-time monitoring of the environmental parameters using both under- and aboveground sensors. These IoT sensors devices on a farm collect vast amounts of environmental data, where it is sent to ground gateways every 1 h, after which the obtained data are collected and transmitted by a drone to the cloud for storage and analysis every 12 h. This platform is deployed and tested in a real scenario on a farm in Medenine, Tunisia, in the period of March 2020 to March 2021, covering open-field and greenhouse cultivation. This low-cost platform can help farmers, governmental, or manufacturers to predict environmental conditions data over the geographically large farm field, which leads to enhancement of crop productivity and farm management in a cost-effective, and timely manner. Obtained practical results indicate that automated and human-made sets of actions have been applied and/or suggested that are smart actions for precision agriculture, which, in turn, dramatically boost crop productivity and help in saving natural resources. Examples of these actions are the following:
- Farmers are advised to consider various strategies such as spraying chemicals on plants during some seasons;
- Various plantings and quarterly grains are suggested;
- Estimate the amount of water needed to bring the soil to field capacity;
- Farmers are advised to consider greenhouses to protect plants from high light intensity during summer;
- Adjust water irrigation using automated dripping and sprinkling based on environmental parameters;
- Using solar panels for powering the weather station leads to energy efficiency.
From a practical point of view, the deployed nodes, which are fed by a solar panel-recharged battery, have correctly transmitted data for 12 months, with underground and aboveground sensors and despite bad weather conditions. Indeed, even though some samples were lost during several rainy days, once their batteries were recharged by solar light during the following sunny days, nodes restarted to transmit properly.
PL and RSS of the Hata propagation model of the distance between the ground station and the drone at the cloud layer show reasonable results, in which the obtained values satisfy a high level of reception with the smallest attenuated signal, besides achieving line of sight wireless connectivity in an efficient and timely manner. More elaboration can be taken into consideration for future work, e.g., to develop a machine learning algorithm to predict environmental conditions and then suggest solutions and/or precautions. A decision support system framework could be introduced as part of a future project to link the farm’s smart devices together to achieve an autonomous system. Moreover, the power consumption of the drone can be optimized to enhance flight time, which leads to covering wider farm zones.
Author Contributions
Conceptualization, methodology, software, validation, writing, visualization, review, and editing, F.A.A. and B.O.S.; Project administration, and funding acquisition, F.A.A.; Supervision, S.H.A. and H.S. All authors have read and agreed to the published version of the manuscript.
Funding
This research received no external funding for practical work.
Institutional Review Board Statement
Not applicable.
Informed Consent Statement
Not applicable.
Data Availability Statement
The data that support the findings of this study are available on request from the corresponding author.
Acknowledgments
The authors are grateful to the Deanship of Scientific Research at Taif University, Kingdom of Saudi Arabia for funding this project through Taif University Researchers Supporting Project Number (TURSP-2020/265).
Conflicts of Interest
The authors declare no conflict of interest.
References
- Ullo, S.L.; Sinha, G.R. Advances in Smart Environment Monitoring Systems Using IoT and Sensors. Sensors 2020, 20, 3113. [Google Scholar] [CrossRef] [PubMed]
- Kim, J.; Kim, S.; Ju, C.; Son, H.I. Unmanned Aerial Vehicles in Agriculture: A Review of Perspective of Platform, Control, and Applications. IEEE Access 2019, 7, 105100–105115. [Google Scholar] [CrossRef]
- Shafi, U.; Mumtaz, R.; García-Nieto, J.; Hassan, S.A.; Zaidi, S.A.R.; Iqbal, N. Precision Agriculture Techniques and Practices: From Considerations to Applications. Sensors 2019, 19, 3796. [Google Scholar] [CrossRef]
- Islam, N.; Rashid, M.; Pasandideh, F.; Ray, B.; Moore, S.; Kadel, R. A Review of Applications and Communication Technologies for Internet of Things (IoT) and Unmanned Aerial Vehicle (UAV) Based Sustainable Smart Farming. Sustainability 2021, 13, 1821. [Google Scholar] [CrossRef]
- Farooq, M.S.; Riaz, S.; Abid, A.; Umer, T.; Bin Zikria, Y. Role of IoT Technology in Agriculture: A Systematic Literature Review. Electronics 2020, 9, 319. [Google Scholar] [CrossRef]
- Zhang, X.; Cao, Z.; Dong, W. Overview of Edge Computing in the Agricultural Internet of Things: Key Technologies, Applications, Challenges. IEEE Access 2020, 8, 141748–141761. [Google Scholar] [CrossRef]
- Sagheer, A.; Mohammed, M.; Riad, K.; Alhajhoj, M. A Cloud-Based IoT Platform for Precision Control of Soilless Greenhouse Cultivation. Sensors 2020, 21, 223. [Google Scholar] [CrossRef] [PubMed]
- Farooq, M.S.; Riaz, S.; Abid, A.; Abid, K.; Naeem, M.A. A Survey on the Role of IoT in Agriculture for the Implementation of Smart Farming. IEEE Access 2019, 7, 156237–156271. [Google Scholar] [CrossRef]
- Kour, V.P.; Arora, S. Recent Developments of the Internet of Things in Agriculture: A Survey. IEEE Access 2020, 8, 129924–129957. [Google Scholar] [CrossRef]
- Sharma, A.; Jain, A.; Gupta, P.; Chowdary, V. Machine Learning Applications for Precision Agriculture: A Comprehensive Review. IEEE Access 2021, 9, 4843–4873. [Google Scholar] [CrossRef]
- Hamdan, S.; Ayyash, M.; Almajali, S. Edge-Computing Architectures for Internet of Things Applications: A Survey. Sensors 2020, 20, 6441. [Google Scholar] [CrossRef] [PubMed]
- Awan, K.A.; Din, I.U.; Almogren, A.; Almajed, H. AgriTrust—A Trust Management Approach for Smart Agriculture in Cloud-based Internet of Agriculture Things. Sensors 2020, 20, 6174. [Google Scholar] [CrossRef]
- Lezoche, M.; Hernandez, J.E.; Díaz, M.D.M.E.A.; Panetto, H.; Kacprzyk, J. Agri-food 4.0: A survey of the supply chains and technologies for the future agriculture. Comput. Ind. 2020, 117, 103187. [Google Scholar] [CrossRef]
- Abba, S.; Namkusong, J.W.; Lee, J.-A.; Crespo, M.L.; Abba, L. Design and Performance Evaluation of a Low-Cost Autonomous Sensor Interface for a Smart IoT-Based Irrigation Monitoring and Control System. Sensors 2019, 19, 3643. [Google Scholar] [CrossRef]
- Alsamhi, S.H.; Ma, O.; Ansari, M.S.; Almalki, F.A. Survey on Collaborative Smart Drones and Internet of Things for Improving Smartness of Smart Cities. IEEE Access 2019, 7, 128125–128152. [Google Scholar] [CrossRef]
- Haseeb, K.; Din, I.U.; Almogren, A.; Islam, N. An Energy Efficient and Secure IoT-Based WSN Framework: An Application to Smart Agriculture. Sensors 2020, 20, 2081. [Google Scholar] [CrossRef] [PubMed]
- Tsouros, D.C.; Bibi, S.; Sarigiannidis, P.G. A review on UAV-based applications for precision agriculture. Information 2019, 10, 349. [Google Scholar] [CrossRef]
- Almalki, F.A.; Soufiene, B.O. EPPDA: An Efficient and Privacy-Preserving Data Aggregation Scheme with Authentication and Authorization for IoT-Based Healthcare Applications. Wirel. Commun. Mob. Comput. 2021, 2021, 1–18. [Google Scholar] [CrossRef]
- Ghubaish, A.; Salman, T.; Jain, R. Experiments with a LoRaWAN-Based Remote ID System for Locating Unmanned Aerial Vehicles (UAVs). Wirel. Commun. Mob. Comput. 2019, 2019, 1–11. [Google Scholar] [CrossRef]
- Almalki, F.A. Utilizing Drone for Food Quality and Safety Detection using Wireless Sensors. In Proceedings of the 2020 IEEE 3rd International Conference on Information Communication and Signal Processing (ICICSP), Shanghai, China, 12–15 September 2020; pp. 405–412. [Google Scholar]
- Almalki, F.A.; Angelides, M.C. Deployment of an aerial platform system for rapid restoration of communications links after a disaster: A machine learning approach. Computing 2019, 102, 829–864. [Google Scholar] [CrossRef]
- Almalki, F.A. Optimisation of a Propagation Model for Last Mile Connectivity with Low Altitude Platforms Using Machine Learning. Ph.D. Dissertation, Brunel University, London, UK, 2018. [Google Scholar]
- Almalki, F.A.; Angelides, M.C. Empirical evolution of a propagation model for low altitude platforms. In Proceedings of the 2017 Computing Conference, Institute of Electrical and Electronics Engineers (IEEE), London, UK, 18–20 July 2017; pp. 1297–1304. [Google Scholar]
- Almalki, F.A. Comparative and QoS Performance Analysis of Terrestrial-aerial Platforms-satellites Systems for Temporary Events. Int. J. Comput. Netw. Commun. 2019, 11, 111–133. [Google Scholar] [CrossRef]
- Almalki, F.A.; Angelides, M.C. Considering near space platforms to close the coverage gap in wireless communications: The case of the Kingdom of Saudi Arabia. In Proceedings of the 2016 Future Technologies Conference (FTC), San Francisco, CA, USA, 6–7 December 2016; pp. 224–230. [Google Scholar]
- Codeluppi, G.; Cilfone, A.; Davoli, L.; Ferrari, G. LoRaFarM: A LoRaWAN-Based Smart Farming Modular IoT Architecture. Sensors 2020, 20, 2028. [Google Scholar] [CrossRef] [PubMed]
- Popescu, D.; Stoican, F.; Stamatescu, G.; Ichim, L.; Dragana, C. Advanced UAV–WSN System for Intelligent Monitoring in Precision Agriculture. Sensors 2020, 20, 817. [Google Scholar] [CrossRef]
- Ratnakumari, K.; Koteswari, S. Design & implementation of innovative IoT based smart agriculture management system for efficient crop growth. J. Eng. Sci. 2020, 11, 607–616. [Google Scholar]
- Castañeda-Miranda, A.; Castaño-Meneses, V.M. Internet of things for smart farming and frost intelligent control in greenhouses. Comput. Electron. Agric. 2020, 176, 105614. [Google Scholar] [CrossRef]
- Tiglao, N.M.; Alipio, M.; Balanay, J.V.; Saldivar, E.; Tiston, J.L. Agrinex: A low-cost wireless mesh-based smart irrigation system. Measurement 2020, 161, 107874. [Google Scholar] [CrossRef]
- Roy, S.K.; De, D. Genetic Algorithm based Internet of Precision Agricultural Things (IopaT) for Agriculture 4.0. Internet Things 2020, 100201. [Google Scholar] [CrossRef]
- Gao, D.; Sun, Q.; Hu, B.; Zhang, S. A Framework for Agricultural Pest and Disease Monitoring Based on Internet-of-Things and Unmanned Aerial Vehicles. Sensors 2020, 20, 1487. [Google Scholar] [CrossRef] [PubMed]
- Castellanos, G.; Deruyck, M.; Martens, L.; Joseph, W. System Assessment of WUSN Using NB-IoT UAV-Aided Networks in Potato Crops. IEEE Access 2020, 8, 56823–56836. [Google Scholar] [CrossRef]
- Cicioğlu, M.; Çalhan, A. Smart agriculture with internet of things in cornfields. Comput. Electr. Eng. 2021, 90, 106982. [Google Scholar] [CrossRef]
- Alsamhi, S.H.; Almalki, F.A.; Ma, O.; Ansari, M.S.; Angelides, M.C. Performance optimization of tethered balloon technology for public safety and emergency communications. Telecommun. Syst. 2019, 75, 235–244. [Google Scholar] [CrossRef]
- Almalki, F.A.; Angelides, M.C. Propagation modelling and performance assessment of aerial platforms deployed during emergencies. In Proceedings of the 12th International Conference for Internet Technology and Secured Transactions (ICITST), Cambridge, UK, 11–14 December 2017; pp. 238–243. [Google Scholar]
- Alsamhi, S.H.; Ansari, M.S.; Ma, O.; Almalki, F.; Gupta, S.K. Tethered Balloon Technology in Design Solutions for Rescue and Relief Team Emergency Communication Services. Disaster Med. Public Health Prep. 2019, 13, 203–210. [Google Scholar] [CrossRef] [PubMed]
- Almalki, F.A.; Angelides, M.C. A machine learning approach to evolving an optimal propagation model for last mile connectivity using low altitude platforms. Comput. Commun. 2019, 142–143, 9–33. [Google Scholar] [CrossRef]
- Almalki, F.A. Developing an Adaptive Channel Modelling using a Genetic Algorithm Technique to Enhance Aerial Vehicle-to-Everything Wireless Communications. Int. J. Comput. Netw. Commun. 2021, 13, 37–56. [Google Scholar] [CrossRef]
- Ardupilot. Mission Planner Home—Mission Planner Documentation. Available online: https://ardupilot.org/planner/ (accessed on 23 April 2020).


Publisher’s Note: MDPI stays neutral with regard to jurisdictional claims in published maps and institutional affiliations. |
© 2021 by the authors. Licensee MDPI, Basel, Switzerland. This article is an open access article distributed under the terms and conditions of the Creative Commons Attribution (CC BY) license (https://creativecommons.org/licenses/by/4.0/).