1. Introduction
In South Korea, the Act of National Territorial Planning and Land Use designates urban residential areas against commercial and industrial uses to protect the safe and sound living environment. An exception to the scope of commercial and industrial use includes small retail stores that can open and operate in existing residential structures (e.g., the first floor of a two-story multifamily structure) in order to facilitate the local residents’ easy and frequent access. Some kinds of the small stores—such as the laundry room, small office, and kids’ afterschool program—are embedded into the residential area, while the café and restaurant have pros and cons when opened in low-rise residential areas. Cafés and restaurants play positive roles in cities, such as increasing urban vitality, providing street natural surveillance, achieving land use mix, and increasing walkability and urban sustainability. In contrast, cafés and restaurants may raise a serious policy concern derived from the increased passenger population and noise, and further gentrification and even crimes. Particularly in the context of South Korea, public awareness of the negative effects on surrounding residential areas has also been rising in recent years.
The major competing explanations on the commercialization of urban housing emphasize institutional niche and gentrification pressure. Other empirical explanations include incidence rate, pace of the urban transition, and the changing trend over time. Furthermore, studies by architects and urban designers suggest that because small commercial stores fit into narrow floor areas, they can open in small housing structures compared to mid- and high-rise commercial buildings. Neighborhood-specific contexts also matter in explaining the commercialization of urban housing as seen in other countries [
1].
A puzzling problem for researchers and policymakers is that the change in the urban residential context in Seoul is so fast and widespread that a timely response is challenging. In other words, the currently existing tools are not sufficient to answer the question of “where is next?” Although one solution would be to change the law and rewrite the local land use regulations, a tool that can predict rapidly spreading urban events and potentially play the role of an early warning system is still needed [
1].
To fill this gap, we propose a model that predicts the commercialization of urban housing in Seoul via the machine learning technique. We are not suggesting a new theory or discounting existing evidence derived from traditional approaches. Rather, our contribution is threefold. First, we attempt to contextualize an emerging machine learning approach in urban research. Second, we show that the XGBoost machine learning model outperforms the random forest machine learning model and the traditional binary logit model, given their imbalanced data structures. Third, this study is the first that specifically focuses on cafés and restaurants opening in urban housing structures in Seoul.
This paper proceeds as follows.
Section 2 provides a trend in commercialization of urban housing in Seoul and a review of the existing explanations.
Section 3 summarizes the data assembly, variable construction, alternative model nomination, model determination and specification, and tunings. In
Section 4, we demonstrate partial-data prediction results and then full-data predictions.
Section 5 discusses and
Section 6 concludes.
2. Background
2.1. Spread of Café and Restaurant into Urban Residential Area in Seoul
In South Korea, commercial stores are generally required to receive permits and licenses to ensure legitimate opening. Those permit and license requirements aim to protect public health as well as to preserve the surrounding environment, particularly in and close to residential areas, which are similar to a business license, employer identification number, and other permit requirements in the U.S. The legal procedure has long preserved residential areas throughout South Korea, especially in Seoul, against rapid urbanization, which has been often accompanied with conversion of the entire or a part of the residential structure to commercial use.
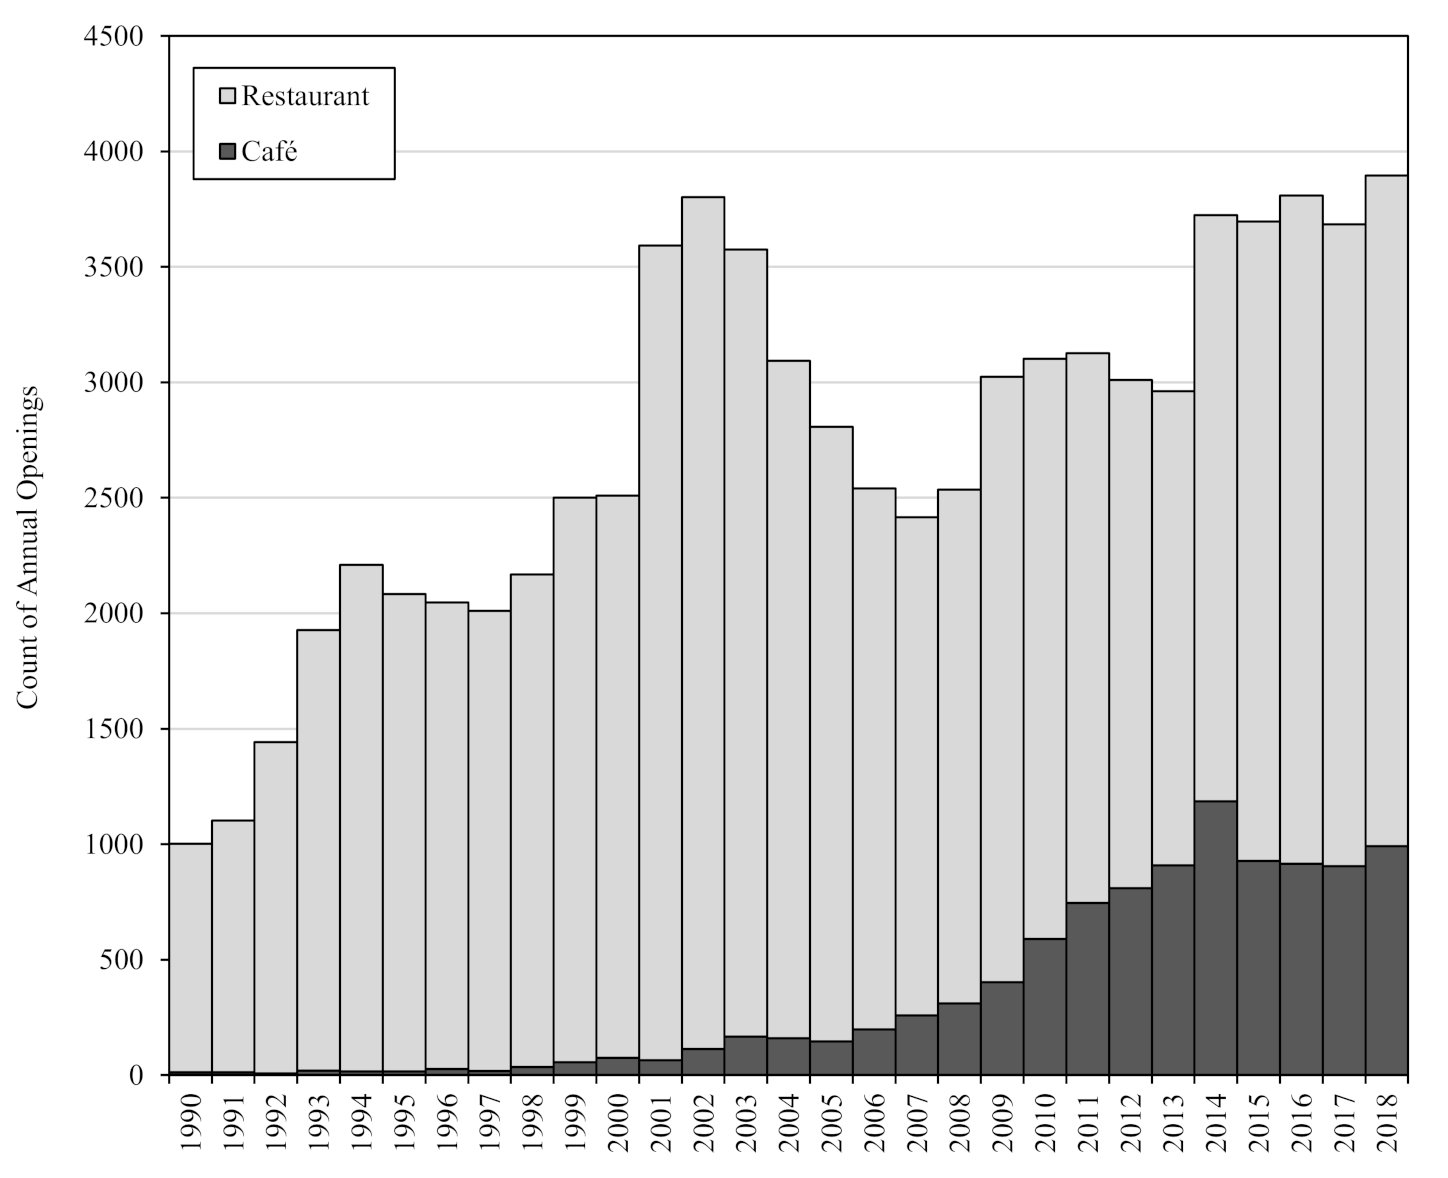
However, café and restaurant openings have been rapidly emerging in residential areas across Seoul (see
Figure 1). Around one thousand cafés and restaurants opened in residential areas in 1990, which has nearly quadrupled in the past three decades, reaching 3896 openings in 2018. Restaurant openings have continuously increased since 1990, except the upsurge in the years followed by the 1997 Asian financial crisis and the International Monetary Fund (IMF) interventions.
Of note is the advent of cafés in residential areas since the beginning of this century. Only 22 cafés opened per year back in the 1990s. During the early-2000s recovery from the financial crisis, however, a much greater number of cafés started to open in residential areas though sill much fewer than restaurant openings, which were largely led by individuals who lost their job under the financial crisis. Starting in the mid-2000s, however, café openings in residential areas rapidly increased and then plateaued in recent years recording nearly one thousand additional openings per year. For that trend, Seoul had the most Starbucks, 284 stores in 2014, in the world, which was even greater than 277 stores in the city of New York, U.S.
2.2. Existing Explanations on Commercialization of Urban Housing
The following two main streams of literature dominate the explanation on the commercialization of urban housing: institutional niche [
2,
3] and gentrification pressure [
4,
5]. Other empirical explanations include incidence rate, pace of the urban transition, and the changing trend over time [
6,
7]. Furthermore, studies by architects and urban designers suggest that because small commercial stores fit into narrow floor areas, they can open in small housing structures compared to mid- and high-rise commercial buildings [
8,
9,
10]. The commercialization of urban housing can also be explained by the place-specific phenomenon as seen in other countries such as the U.S. and China, or European nations, who experience similar urban commercialization in different contexts [
11,
12,
13,
14].
2.2.1. Institutional Niche of Waiver from Permit Requirement
The Act of National Territorial Planning and Land Use protects residential areas against potentially hazardous uses to secure the safe and sound living environment, similar to zoning in the U.S. An exception by law is small stores—such as cafés, restaurants, and supermarkets—and those stores are allowed to operate within and close to residential structures to facilitate the local residents’ easy access. A common finding is that the waiver provides an institutional basis for the rapid spread of small commercial stores into residential areas [
2,
3].
2.2.2. Commercial Gentrification Pressure
On top of the institutional base, the gentrification explanation dominates scholarly discussions on urban commercialization and its impact on nearby neighborhoods. Unlike the western context of neighborhood change, gentrification in South Korea is often understood as large-scale (re)development that turns a cluster of existing lower-floor housing structures into a new complex (or superblock) of high-rise apartment buildings [
4,
5,
15].
Contrasting to the large-scale residential gentrification, the spread of cafés and restaurants into urban housing occurs in Seoul at a much smaller scale than individual structures. Studies found that single-family housing structures, either attached or detached, are most prone to commercialization [
7,
16,
17]. Restaurants and cafés may also attract a large number of passenger populations, and in turn may affect residential areas through increasing real estate price [
2,
18], reducing affordable housing stock for the poorest households [
6], and displacing existing lower-income residents [
17,
19]. Of alarming evidence is that it is very unlikely that a once-commercialized structure returns to the original residential use because commercialization often involves physical changes to the structure [
10].
2.2.3. Location, Extent, and Pace of Commercialization
Additional empirical studies focus on one or a few selected places for in-depth site analyses. Studies find that café and restaurant openings are geographically concentrated in some residential areas across the city of Seoul, mostly main commercial corridors [
9,
20,
21,
22,
23] and hot places for young adult populations such as Millennials [
3,
7,
10,
16,
20,
24].
Residential commercialization evolves relatively slowly in a geographically limited area, but it expedites once the commercial demand meets supply [
6]. Another research showed that competition between the retails stores becomes fiercer, and the pace of neighborhood change has also become more rapid in recent years [
7,
25]. The spread of cafés and restaurants not only occurs horizontally in an urban context but also vertically in two- or three-floor residential buildings [
26].
2.3. Machine Learning Approach in Context of Urban Research
The machine learning technique, often jointly with big data and artificial intelligence approaches, has been emerging in general urban studies, particularly among land use modelling studies and neighborhood change research [
8,
12,
13,
27,
28,
29,
30,
31,
32,
33,
34]. The traditional econometric model is used to test hypotheses and draw inferences about the possible relation between explanatory variables and land use changes. The traditional models are also used to estimate the marginal effect of explanatory variables, which helps policymakers to develop an effective land use policy and responses to neighborhood changes, especially gentrification and displacement [
27,
29]. The causality-focused approach tends to simplify data to meet multiple assumptions, such as independency of explanatory variables, normal distribution of data, linearity of dependent and independent variables, among many [
12,
28]. The explanatory advantage of the traditional econometric model, however, does not necessarily provide high predictability due to its innate assumptions [
13,
23,
31,
32].
The machine learning approach fills the gap by prioritizing predictive power over inference. A high prediction accuracy of the machine learning method arises from its ability to model a complicated non-linear relationship, including threshold changes. This contrasts to the existing cellular automata and agent-based models (ABMs), in that those models operate according to variables and rules defined by the researcher. For that reason, the progress of the machine learning technique in South Korean urban scholarship has been mostly made to predict a continuous target (dependent) variable whose pattern is more easily identified than its categorical counterpart. For example, the house price prediction model has been of most interest among researchers through a variety of machine learning and artificial intelligence approaches, such as the deep neural network (DNN), long short-term memory network (LSTM) [
35], gradient boosting model, decision tree model [
36], random forest model [
37], and artificial neural network (ANN) [
38]. In contrast, the categorical target variable has been less explored by the machine learning method, though a few recent studies were conducted to predict land use changes and land value brackets, and to develop a land cover classification [
20].
The limitations of the machine learning approach should be noted. A lack of a standardized model is a limitation for urban researchers to adopt and utilize the machine learning technique [
12,
32]. Unlike traditional econometric models, which should result in the same result from the same inputs, the machine learning approach may result in different results even from the same inputs [
13,
29]. Furthermore, the end result is sensitive to how the training and testing data are defined from the same universe of samples, which requires careful data processing [
13,
30].
3. Data and Methods
This study predicts which residential parcel is most prone to café and restaurant opening and to determine which conditions in those parcels may have led to the greater commercialization probability. We built machine learning models and comparable binary logit models to predict commercial opening in urban housing and to evaluate the importance of different predictor variables that facilitate or limit urban commercialization.
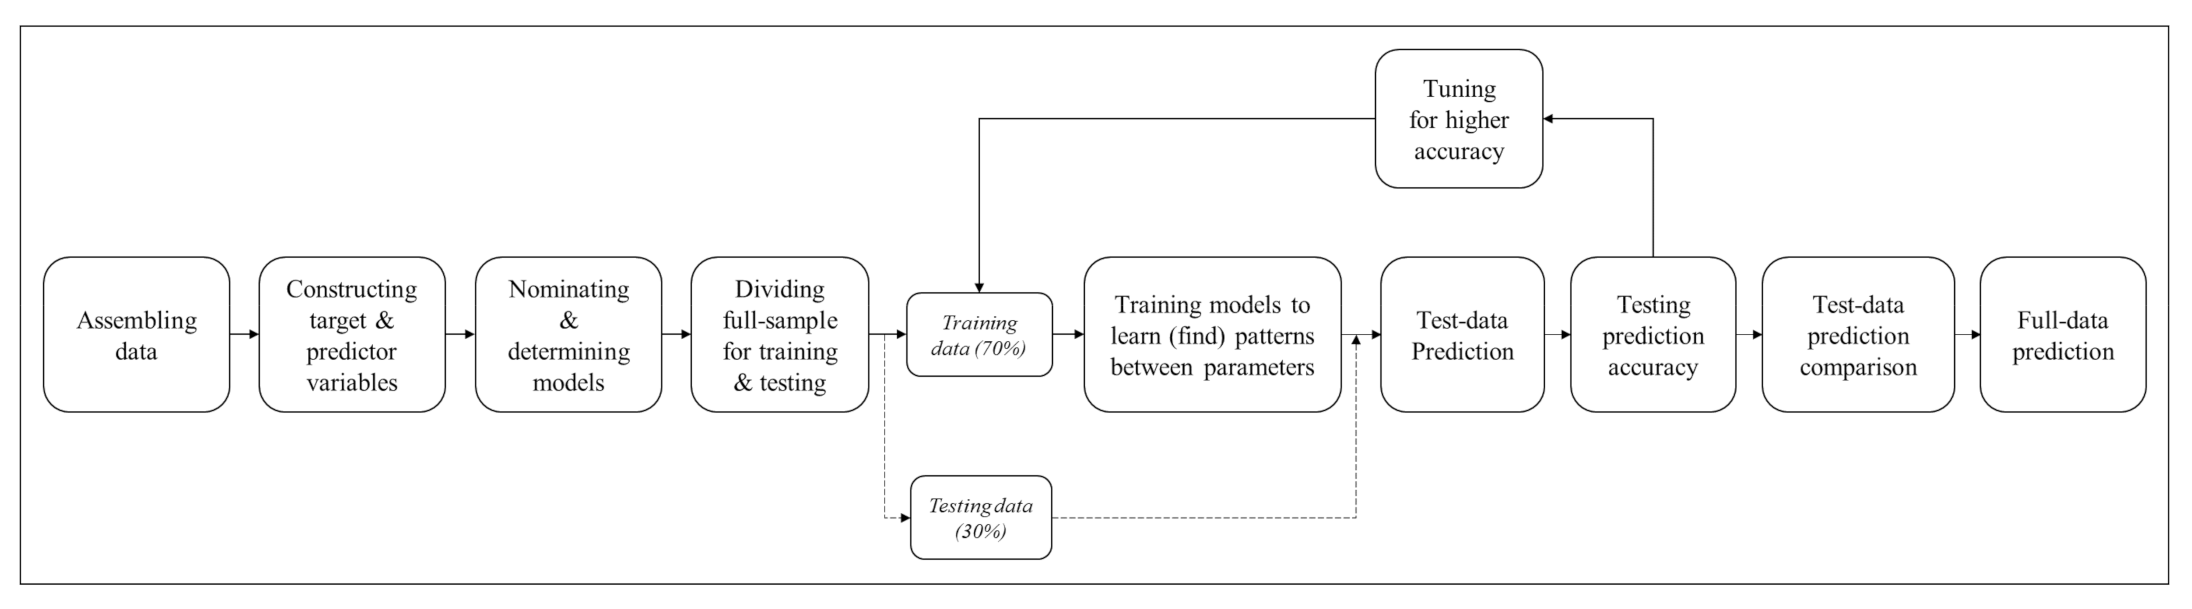
The machine learning approach involves a series of steps as diagramed in
Figure 2. First, we assemble data and build target and predictor variables. This study nominates alternative models and determines the XGBoost model and random forest model as final models. We divided data into train data and test data, and a cyclical process—training, testing, and tuning—was repeated until it reached the highest prediction accuracy. Based on the test-data analysis, we performed full-data prediction for the entire city of Seoul.
3.1. Assembling Data
This study combines data from multiple sources, most of which are derived from the national databases collected by South Korea government and local jurisdictions, to predict café and restaurant openings in residential structures. This is an aggregate-level analysis of parcels, rather than an individual building structure-level analysis with markers for land parcels. Our sample comprises 278,647 residential land parcels, which are designated for single-family housing structures and other smaller residential structures, which is explained in the following section. The sample accounts for 74.7% of all residential parcels in Seoul. The city consists of 25 constituent Gus for which we built dummy variables to control Gu-specific characteristics.
3.2. Constructing Target and Predictor Variables
We collected physical and socioeconomic characteristics of individual residential structures as well as land parcels and neighborhoods, including 40 independent (predictor) variables in total. Given that the beginning year of our dependent (target) variable is 2011, we attempted to collect 2011 data though a slightly earlier or later year is used instead depending on data availability. Definitions of target variable and predictor variables are summarized in
Table 1.
3.2.1. Café and Restaurant Opening in Residential Structure
This study identifies café and restaurant openings at the land parcel level by using national administrative records on commercial permits. The data collect daily counts of permits and licenses authorized for every café and restaurant and therefore sampling error does not occur. Other types of commercial stores—such as apparel shops and office supply stores—that neither sell alcohol nor cook raw ingredients can be waived from permit and license requirements as long as they meet mandated guidelines. Our sample of cafés and restaurants is not eligible for the waiver. A binary target (dependent) variable is identified either 1 (opening) or 0 (no-change) for individual parcels. Opening means that one or more new cafés and restaurants opened in a given residential parcel between 2011 and 2016. We aggregated any of the four major constructions (new construction, structure expansion, major repair, and use conversion) between 2011 and 2016 as well as café and restaurant openings for the same time period for individual parcels. Due to data accuracy limitations, we do not attempt to match the specific year of major construction to the specific year of café and restaurant openings. Otherwise, the binary variable is coded zero, indicating no change. Note that a parcel that is used for multiple land uses—such as both residential and commercial—is identified as residential only if its majority use in terms of floor area is residential.
We focus on single-family residential structures, either attached or detached, and smaller-sized residential structures that are located on parcels zoned as an exclusive residential area and the general residential area. We exclude the 3rd-tier general residential area because it is often filled with high-rise apartment buildings which rarely allow café and restaurant openings. Also excluded is the semi-residential area, which is in fact mainly used for commercial purpose.
3.2.2. Building Structure Characteristics
Residential structures on the same land parcel may have distinct physical and socioeconomic characteristics. Small-sized residential structures in Seoul are generally similar in height and volume because building-to-land ratio and floor area ratio are strictly regulated by zoning. The physical similarity plays an important role in the prediction model because it provides a spatially consistent urban context on which predictions are conducted. We identified three characteristics such as year structure was built, structure type, and total floor area.
Year structure was built specifies the age of the structure. A categorical variable is also built to identify structure type to consider that, unlike single-family structures, units within the same multifamily structure can be used for different uses. Single-family structures can be either detached or attached while a multifamily structure includes 5 or lower floors, excluding apartments that are generally 6 or higher floor buildings with an elevator. Apartments are prevalent across the city of Seoul but especially concentrated in Gangnam areas, which will be visually shown in the result section.
Size of building structure may affect size of potential commercial store and even its opening decision. Floor area ratio to reflect the building size effect on café and restaurant openings, which is derived by summed floor areas of all structures in each parcel because we cannot exclude areas of base floor and others. Detailed uses were collapsed into eight broader uses, including lower-density residential, higher-density residential, neighborhood facilities, commercial use, industrial use, religious use, hotels, education and research, restaurants, and others.
3.2.3. Land Parcel Characteristics
Many studies have characterized influences of the built environment on passenger’s travel behavior, which should be of most importance to commercial store openings [
39,
40,
41,
42]. Given our spatial unit of analysis is land parcel, parcel characteristics should be most critical in the model specification, which largely consist of economic value, accessibility, and land regulation.
Economic value of land parcel is emphasized as a major leading factor of urban commercialization and is typically specified in two ways—absolute level of land price and relative land price premium [
2,
3,
18]. The land price is derived from the national land price estimate (thousand Won/m
2) which is announced by the South Korea government every year. We also considered land price premium, which is calculated as the parcel land price divided by the average 500 m × 500 m grid land price where the parcel belongs.
Accessibility should be of most importance to opening decisions on any commercial stores [
7,
9,
10,
17,
26,
43]. We used the GIS technique to measure Euclidean distance (so called as the crow flies distance) between parcel centroid and a variety of built environments [
44,
45,
46,
47,
48,
49,
50,
51,
52,
53], including transit (bus, city subway, and interregional rail) station, educational structure (e.g., K-12 school and university), public building (e.g., city hall, library, fire station, and police station), franchise supermarket, large hospital, sports center, museum, gallery, public parking, and green space (e.g., park, green field, Han River, and other rivers). We also consider car accessibility by including area of parcel, number of the adjacent roads, and width of the major adjacent road.
Land use regulation should precondition whether a residential parcel can be converted to commercial use or not. We factor in two variables, such as zoning and Gu dummy. Zoning variable is categorical—1st and 2nd exclusive residential area and 1st and 2nd general residential area—to reflect land use regulations. Individual parcel geographically belongs to one of 25 Gus in Seoul, which reflects Gu-specific characteristics that may affect commercial store opening in housing structures.
3.2.4. Neighborhood Characteristics
Opening decision on a new café and restaurant should be affected by neighborhood characteristics. We utilized 500 m-by-500 m fishnet of the entire city of Seoul as a set of individual neighborhoods, which are built by the South Korean government. A variety of socioeconomic and built environment characteristics are identified at the grid level and thus different parcels located in the same grid share the same four groups of neighborhood characteristics—land price, population and jobs, building structure, and transportation.
Neighborhood land price represents average price per meter squared (thousand Won/m2) of each grid. We built variables about neighborhood population and jobs, which proxy commercial demand. We built four different commercial demand variables—population, single-person share of households, jobs, and the average number of daily passenger population—to fully account for different sources of commercial demand; the population and single-person household reflect resident demand while the jobs and passenger population represent non-resident demand.
Neighborhood building characteristics include physical and socioeconomic attributes of all buildings within each 500 m × 500 m grid, such as floor area ratio, old structure (built in 30 years or earlier) share, and residential structure share. We also created neighborhood transportation characteristics that reflect overall transit accessibility of each grid, which is distinct from the previously described parcel-level accessibility variables that measure transit access to individual parcel [
54,
55,
56,
57]. We built three variables, such as road area share, number of bus stops, and transit-oriented development area (within 500 m from city subway station) share.
Alternative measures and potential limitations of the specified variables in this study—such as density measure [
52], mesoscale factors [
34], and micro-level street network [
8]—are discussed in the conclusion section.
3.3. Nominating and Determining Machine Learning Models
In general, machine learning models are nominated and determined in terms of data characteristics, including type of target variable, number of predictors, sample size, and overall data structure. Basically, we predict whether a café or restaurant opens on a given residential parcel, which leads us to nominate machine learning models that are appropriate for binary prediction. Despite other available models such as ANN (artificial neural network) and SVM (support vector machine), we nominate the XGBoost model as our main model for two reasons. First, the XGBoost model allows a wide range of fine-tunings and flexible weighting, which can lower the degree to which model predictions are skewed towards no-change due to the imbalanced structure of our data. This ability to reduce model overfitting in imbalanced data is the most important reason to adopt XGBoost. Second, the XGBoost model is featured by its fast computing, which is appropriate to deal with a large sample size (278,647 parcels) and 40 different predictors, in addition to the exploratory model running about over 8 million combinations of parameters and weights.
For comparison purposes, we nominated two binary models—random forest model and binary logit model—and performed test-data predictions. The decision tree model—preceding version of random forest model—is often used due to its intuitive display of prediction results. However, it accounts for a single parameter at a time among multiple parameters (i.e., hierarchy of tree structure). For that reason, the more parameters in the model, the more likely the problem of overfitting occurs. A large number of parameters may also entail biases because a minor change in train data would lead to major changes in the end result. To address the limitations of the traditional decision tree, Breiman introduced the random forest model that operates through shallow decision trees based on randomly selected sub-samples and parameters [
56]. Though individual shallow models have relatively weak explanatory power, the sum of those numerous weak models provide very strong and consistent predictions. An additional advantage of random forest is to alleviate the problem of overfitting and multicollinearity by randomly selecting a small number of parameters. Random forest is also less sensitive to outliers than traditional models and operates efficiently with parameters of different types.
The XGBoost model, first introduced by Chen and Guestrin, is one of the most widely used machine learning models [
57]. It made significant improvements from the existing gradient boosting model in terms of model efficiency, prediction accuracy, and computing time. The XGBoost model creates multiple decision trees as random forest does. The key difference between XGBoost and random forest is that random forest creates independent trees while XGBoost creates interrelated tress. An XGBoost tree evolves and advances by reflecting errors of the previous tree. For that reason, model accuracy often increases as the number of trees increases in the XGBoost model, requiring efficient model specifications. XGBoost is known to result in more accurate predictions when parameters are imbalanced because it weighs individual trees depending on their accuracy, while random forest simply sums up trees through a process called voting.
3.4. Specifying XGBoost Model and Random Forest Model
We divided the full sample (278,647 parcels) into a 70% data (196,053 parcels) for the purpose of training—a similar process as repeated running of regression models to determine best-fitted model—and the remaining 30% data (83,594 parcels) for testing the trained model. Testing is followed by tuning in which we made adjustments to the prediction model in order to increase prediction accuracy. We repeated the cyclical steps until the model does not make additional improvements.
We inputted test data into the trained model to validate generalizability of the model, specifically validity and prediction accuracy. A significantly lower prediction rate in test data than that in train data implies overfitting. We used the k-fold cross validation test that divides training data into k sub-data. The first sub-data (i.e., k-1 data) is used for testing and the remaining sub-data is used for training. A parallel process is repeated k times while improving model performance.
Random forest utilizes out-of-bag (OOB) samples that are not used for training purposes because the algorithm randomly selects samples for individual trees. An advantage is that the model can use OOB samples for test purposes to estimate OOB error. This study uses the OOB error instead of k-fold cross validation because it is similar with k-fold cross validation in that they both use a part of the training data for test. XGBoost also includes the k-fold cross validation process within its algorithm.
We used a confusion matrix to compute model accuracy, sensitivity, and specificity (see
Supplemental Table S1 for summary of conceptual elements of confusion matrix). In case of imbalanced data structure, accuracy may be skewed towards a more prevalent incidence of data (no-opening in this study). Thus, we computed balanced accuracy to prevent the potential skewness and draw a receiver operating characteristic curve (ROC Curve) in combination with sensitivity and specificity. Test measures based on confusion matrix are as follow:
The random forest approach creates multiple alternative prediction models which are compared to each other in terms of precision–recall curve’s area under curve (AUC), identifying the best random forest model. We took the same approach to the XGBoost model and identified the best-fitted XGBoost model. Given the café and restaurant openings account for only 3.7% of all residential parcels in Seoul—in other words, data structure is imbalanced—common accuracy indicators may overestimate prediction of no-opening and may lead predictions towards the 96.3% majority cases (no-opening).
Alternative indicators, such as kappa coefficient and F1-score, have proven more appropriate for evaluating model predictions based on imbalanced data [
57]. Kappa coefficient shows prediction accuracy that reflects imbalanced data structure by comparing the common accuracy indicator with the probability accuracy indicator as shown in equations below.
P0 shows the common accuracy rate while
Pe is hypothetical probability of change agreement. Kappa coefficient measures relative accuracy by subtracting the
Pe from all probability (1 or 100%) in denominator as well as from
P0 in numerator, in order to capture net model contribution to prediction accuracy.
Separately, F1-score equals harmonic mean of precision and recall rate as shown in equations below. The score reflects precision of predicted opening locations as well as recall rate of data itself.
3.5. Tuning XGBoost Model and Random Forest Model
3.5.1. XGBoost Model Tuning
We carefully set (interchangeably tune) parameters and weights in the XGBoost model and reached a final model that produces stable and the most accurate prediction. For robustness check, we tested alternative tunings and confirmed largely consistent prediction results. The alternative tuning results are described in this section and relevant tables and figures are provided in the
Supplementary Material of this study.
The XGBoost model consists of largely three types of parameters, including general parameters, learning task parameters, and boost parameters. First, the general parameters specify which booster we use to conduct boosting (i.e., tree or linear model). We adopted the gbtree booster type, which is appropriate to classify binary target variable and control for the overall functioning of our model.
Second, the learning task parameters relate to evaluation and decision on a series of learning scenarios. The area under the precision–recall curve (AUCPR) was adopted as evaluation metric which can alleviate the issue of model overfitting by weighing less frequent cases; in this study, openings of cafés or restaurants. We compute and obtain the weight variable of 47.436, which equals to the number of more frequent cases (no-changes) divided by the number of less frequent cases (opening), as described in the official XGBoost model website. An alternative of 6.887—square root of 47.436—is also tested.
Third, tuning tasks in the XGBoost model are often focused on adjusting a set of booster parameters because they control for the performance of boosters. In order to reach the best model, we fine-tuned seven booster parameters—maximum depth of tree, minimum sum of instance weight, minimum loss reduction, subsample ratio of columns, subsample ratio of training instances, L1 regularization term on weights, and learning rate—separately for each of the two weights (see
Supplemental Table S2 for summary of weights and booster parameters). We conducted a somewhat laborious fine-tuning, which involves running 8,131,200 possible combinations of parameters and weights as parameters change by a unit at a time for a given weight. For the example of the booster parameter on the maximum depth of the tree, we would start with the default value of 6 and test it from 3 through 10 by a unit of 1, and eventually reach the final value of 3 (see
Supplemental Table S2 for details on range, unit, default value, and final value for booster parameters and weights).
The best combination among the 8,131,200 results has an F1-score of 0.327 given the weight of 6.887, which outperforms combinations based on the weight of 47.436 (see
Supplemental Figure S1 for F1-score for combinations of parameters and weights). F1-score also appears much more stable under the weight of 6.887 than 47.436 when we cross-validate it against the most impactful booster parameter on the maximum depth of the tree (see
Supplemental Figure S2 for F1-score for cross-validation between weight and booster parameter on the maximum depth of the tree).
For final model validation, we computed a cross-validation error—AUCPR as discussed—and saw if our final model could achieve convergence with whichever partial data (sub-data) was given from the whole train data. We first randomly divided train data into five sub-data (5-folds). Four of the five sub-data were used to train the model and the remaining sub-data was used to test the trained model, which was repeated for each of the five sub-data in 500 iterations, respectively. We found that the level of train error is stabilized beyond 309 iterations, indicating that our final model reached the state of convergence rather than divergence (see
Supplemental Figure S3 for line graph that displays test error and train error by the number of iteration). The final XGBoost model was adopted to predict the opening of cafés and restaurants, with 500 iterations, and its prediction results are shown in the following section.
3.5.2. Random Forest Model Tuning
Unlike XGBoost turning, the random forest model involves relatively simple tunings. The key parameter in the random forest model is mtry which determines the total number of parameters. An optimal value of mtry may alleviate model overfitting and determine the most efficient model with the appropriate number of parameters.
We found the optimal mtry through a similar cross validation (CV) as we did in XGBoost, adopting AUCPR as the evaluation metric and using five-folds with 3 iterations, respectively. We started with the default mtry of 10 and tested it from 2 through 15 by a unit of 1, and found the optimal value of 5. Thus, our final random forest model made the tree by randomly choosing five of the total 40 variables as listed in
Table 1.
We used R software (version 3.6.0) to build the random forest model and XGBoost model, respectively. Our models are replicable by following the footnote that details model tunings. Based on these model specifications, the following section describes prediction results with test data and full data.
4. Results
We first show the prediction results based on the test data, 30% of the full data (83,594 of 278,647 parcels). The test prediction was performed by three models—random forest, XBGoost, and binary logit—and the comparison of the model performance shows the highest prediction accuracy for the XGBoost model. Focusing on the XGBoost model, we show which predictor is most important to the model and whether the effect is positive or negative in attracting new cafés and restaurants. Then we perform a full-data prediction, which shows a consistent result with the test prediction but with a greater difference in the predicted opening rates across the entire city of Seoul.
4.1. Test-Data Prediction on Café and Restaurant Opening in Housing Structure
4.1.1. Prediction Accuracy
Overall, we found that XGBoost outperforms the random forest model and binary logit model, across accuracy indicators.
Table 2 presents the sample size and accuracy measurements by model.
A residential land parcel is identified to be predicted opening—or positive (P)—when the model reports a 50% or greater opening probability. The XGBoost model predicts 2770 openings of cafés and restaurants across 83,594 residential structures, resulting in the opening rate of 3.3%, while random forest and binary logit models predict clearly lower opening rates of 0.2 (149 and 169 parcels, respectively). These much lower opening rates (and absolute counts) among the logit and random forest methods indicate that their predictions were skewed towards majority cases, here no-change or negative (N).
The basic accuracy indicator (
Table 2 (c)) shows that the logit and random forest models (both 0.978) slightly outperform XGBoost (0.963), while the balanced accuracy indicator (
Table 2 (d)) reports a higher accuracy of XGBoost (0.692) than random forest (0.518) and logit (0.512), confirming that random forest and logit predictions are likely to be biased by the imbalanced data structure as we discussed in the earlier section.
Kappa coefficient and F1-score—indicators of our focus—are higher in XGBoost (0.302 and 0.321, respectively) than logit and random forest, supporting that random forest and logit are skewed towards no-change. Other accuracy indicators for the binary classification model—AUC of PR curve and AUC of ROC curve—are consistent with other indicators, showing a higher accuracy of XGBoost than random forest and logit (see
Supplemental Figure S4 for graphs about precision and sensitivity of the XGBoost model). Based on the model comparisons, we determine XGBoost as our final model and thus the remainder of this article focuses on XGBoost prediction results in more detail.
4.1.2. Predictor Importance
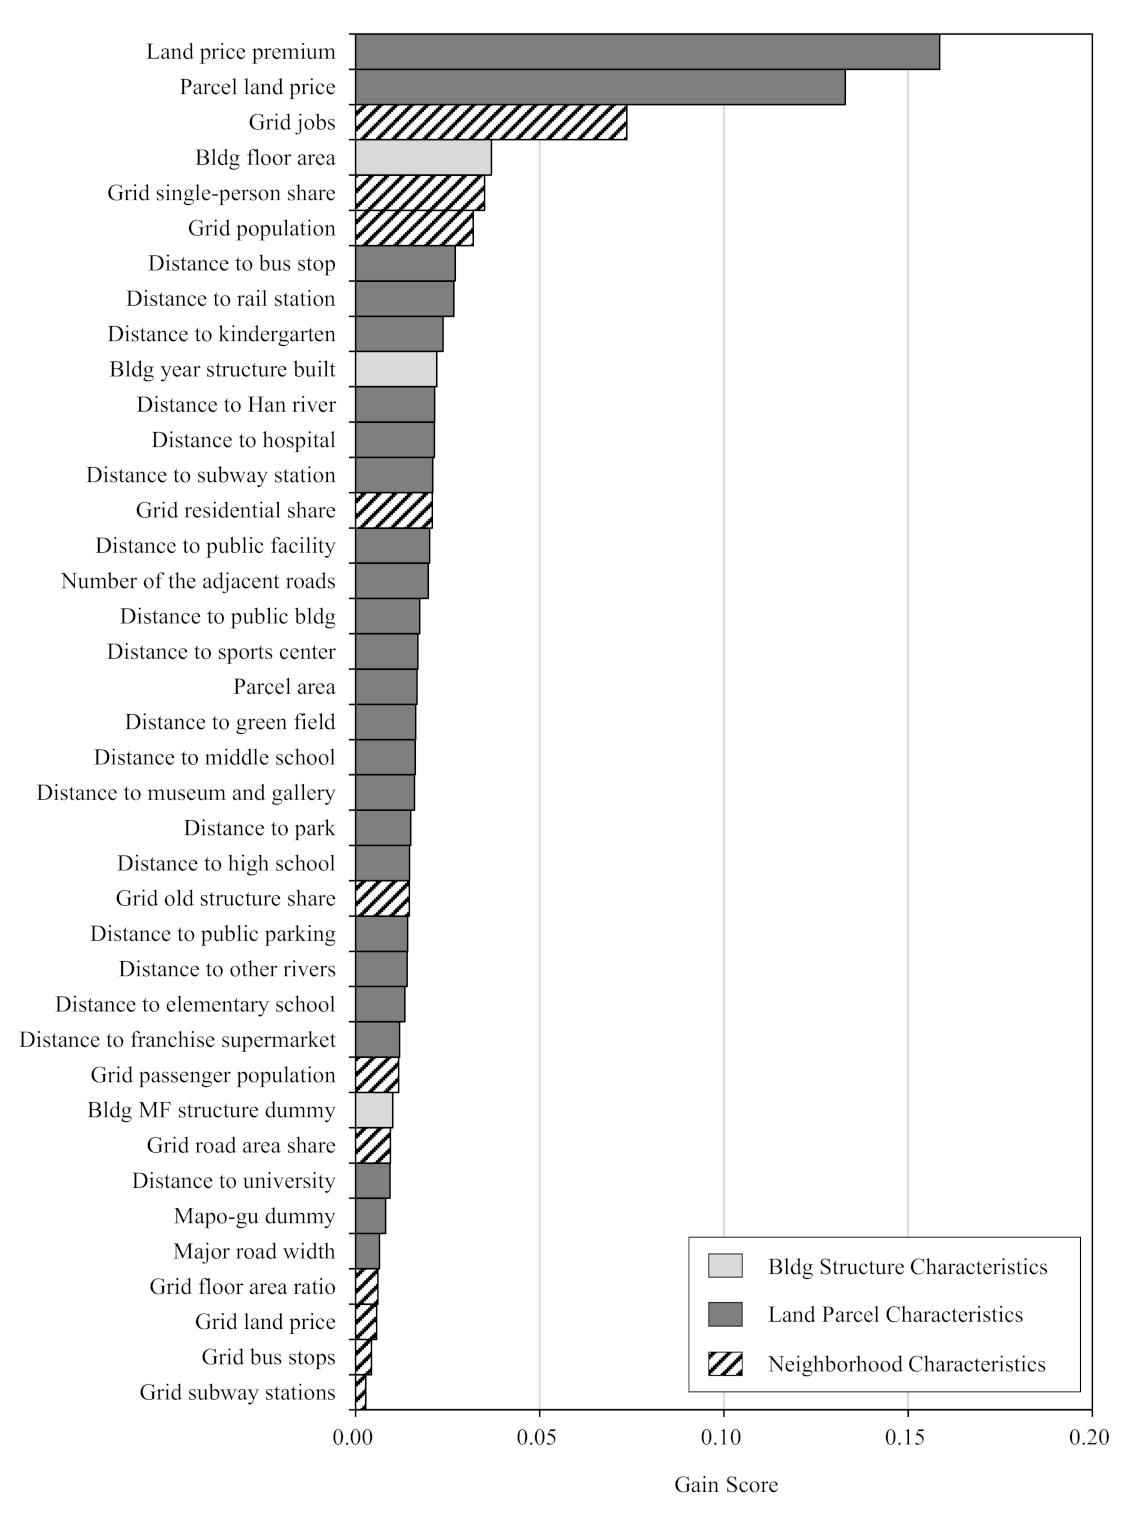
We describe which predictor variables the XGBoost model were found to be most important for predicting commercial store openings in residential structures. Gain score, a common feature importance measure, is considered as the relative contribution to the model, similarly to the marginal effects of one variable conditioned on the others. This score is measured out of a maximum value of 1—so higher values indicate a greater importance.
Figure 3 ranks the most important features for store opening at the top and the least at the bottom.
The most important two features are both related with parcel-level economic values—land price premium and level of land price. Demand-side factors are also found important to the model, such as the number of jobs, single-person share of households, and population, all of which may imply potential benefit from potential commercial demands. The floor area of the residential structure also appears important, showing development potential of the land parcel.
Transportation variables also appear to be important to the model, including the distances to the nearest local bus stop and local subway station, but rather less expected is the fact that the distance to the metropolitan rail station also does feature strongly, assumedly because many Seoul citizens commute a long distance from the metropolitan station to outside the city.
4.1.3. Positive and Negative Effects of Predictor
The predictor importance result tells which variables are the strongest association with café and restaurant openings in residential structures, but it does not show whether the relation is positive or negative. Thus, we examine whether variables that were identified important for predictions have positive or negative effects on café and restaurant openings.
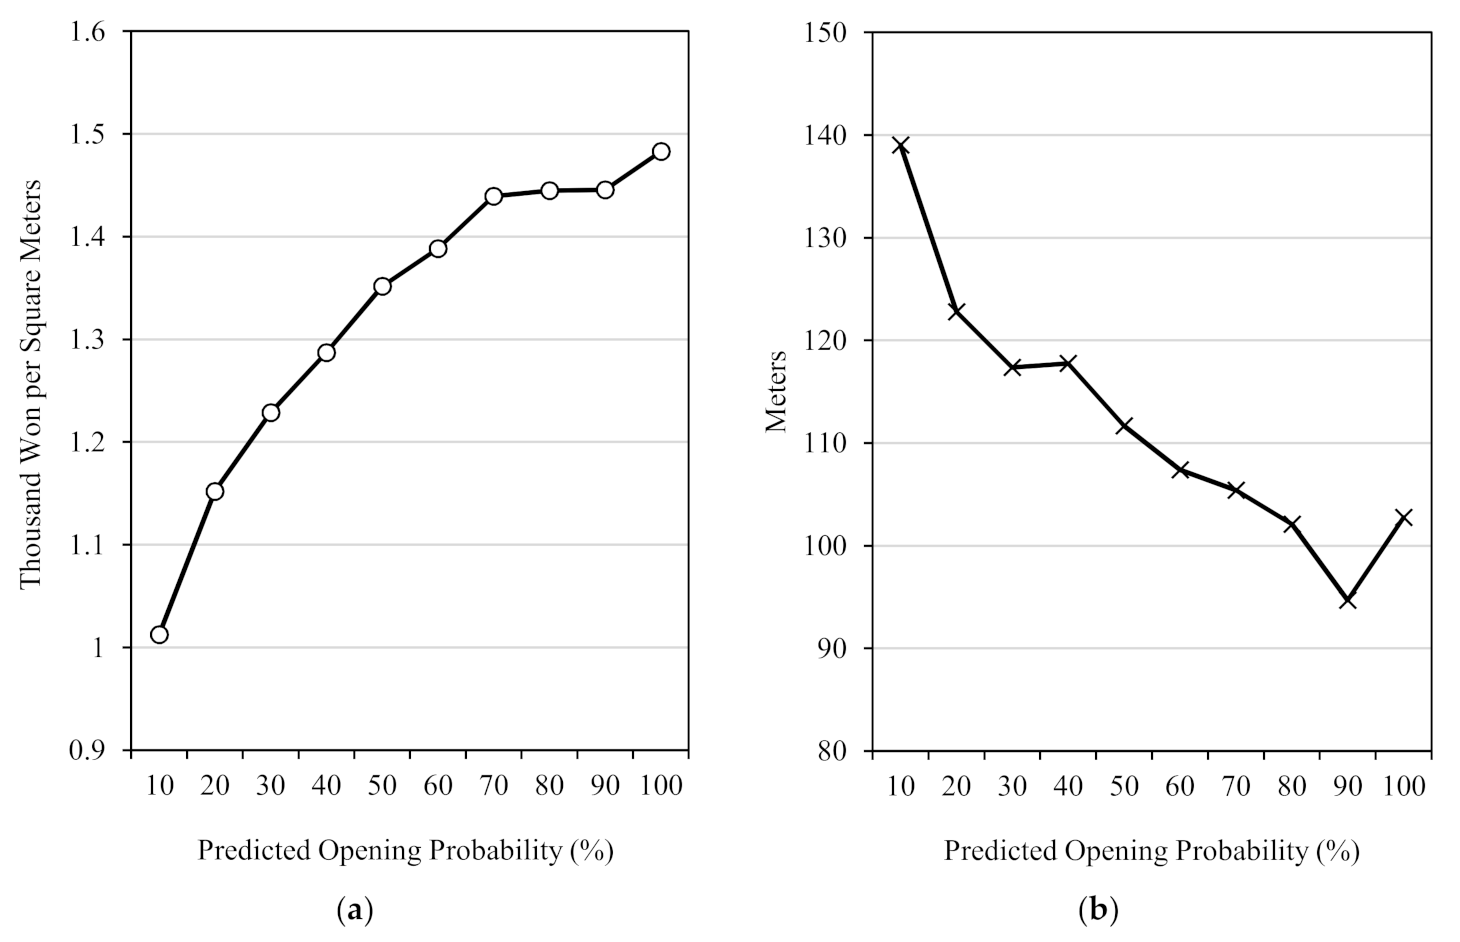
The
Figure 4 panel (a) shows a positive relation between land price premium and predicted opening probability, implying a residential structure on land with a relatively higher price than the surrounding areas is more likely to have a new café and restaurant on the parcel. In contrast, distance to bus stop has a negative association with café and restaurant opening. Panel (b) shows that the longer the distance to the local bus stop is, the less likely a commercial store opens on the parcel. Given that around 65% of commuters in Seoul relied on public transit in 2017, the negative association makes sense and implies that residential structures nearby a major transit node are more likely to be converted to commercial use in the future.
Though a building’s floor area and year the structure was built were found relatively important (fourth and tenth, respectively, as shown in
Figure 3), its relational direction (either positive or negative) appears weak. It is likely due to the physical similarity among the residential structures in Seoul. In other words, the physical characteristics of urban housing structures have a mixed effect on their commercialization.
4.2. Full-Data Prediction and Heatmap Visualization
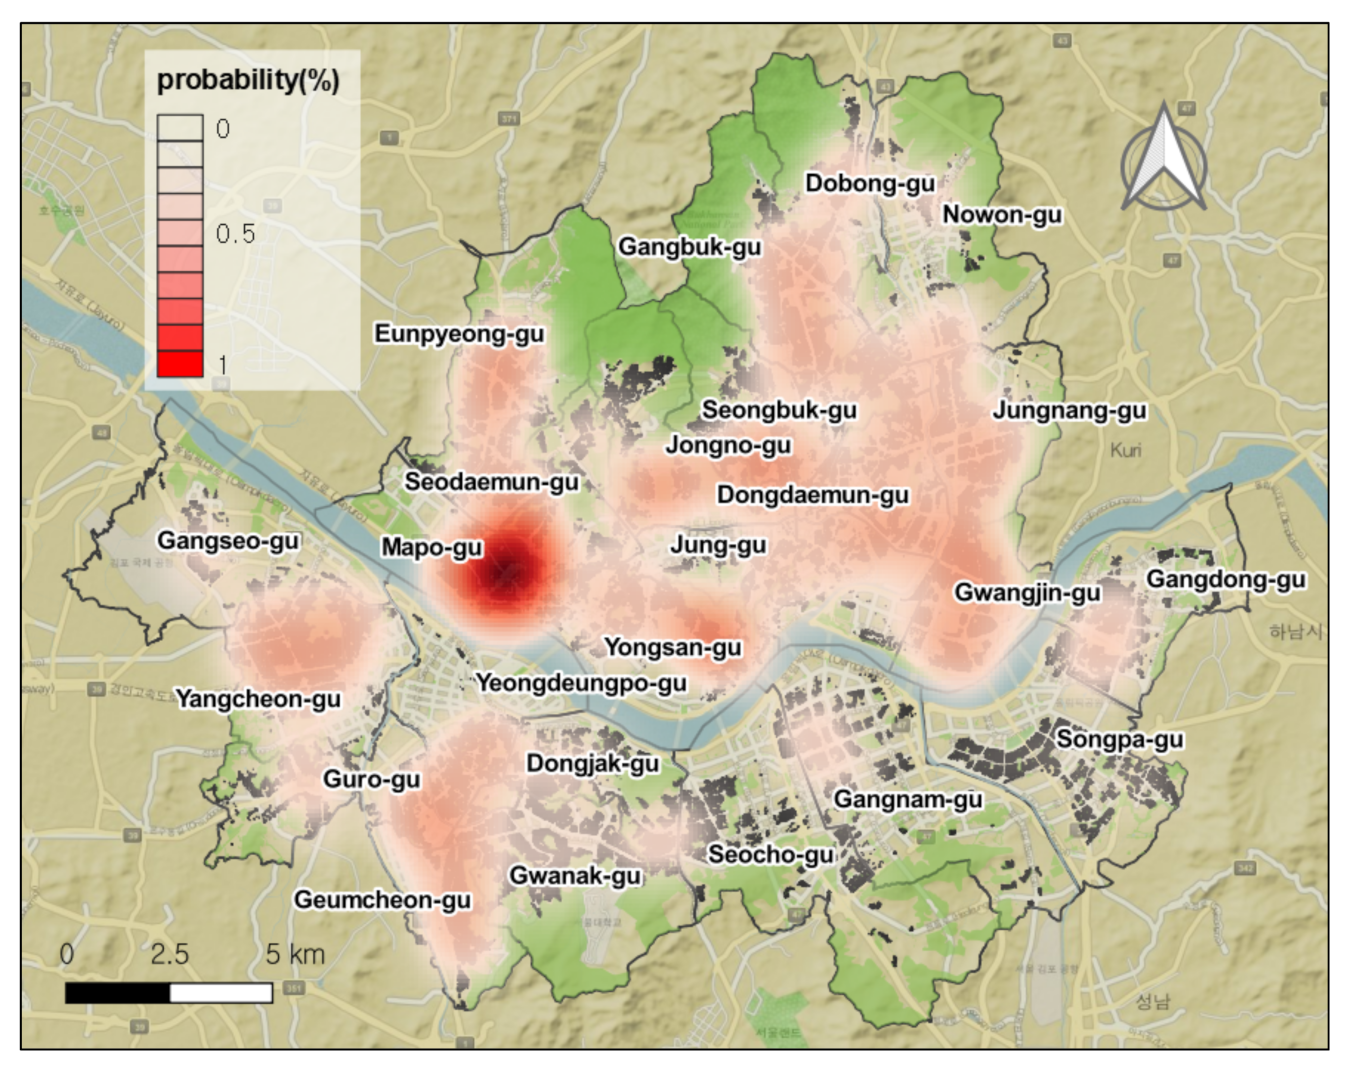
The opening rates of cafés and restaurants could vary across Seoul, in close relation to the characteristics of urban landscape as considered in this paper. Unlike the separate use of train data and test data in the machine learning studies, we attempted to use the full sample of 278,647 parcels (train data plus test data) in our final model of XGBoost. Mapping the predicted rates at the parcel level may be neither readable nor effective to display the overall picture of Seoul. Rather, we take full advantage of heatmapping to show the areas of higher or lower attraction to new cafés and restaurants, highlighting any spatial patterns. They are colored in dark red representing hot or heated areas.
4.2.1. Distribution of the Predicted Opening Rates across the Entire Seoul
As displayed in
Figure 5, north of Han River—called Gangbuk in Korean—shows a prevalent and higher probability of café and restaurant openings in residential structures, saving mountainous areas in the far northern area of Seoul. In contrast, south-east of Han River—called Gangnam in Korean—shows a lower probability of commercial opening.
The most attractive area for new cafés and restaurants is Mapo-gu. The Mapo area, particularly nearby Hongik university, generally has a very high land price premium compared to the rest of Seoul. Mapo is also geographically close to Han River as well as Yongsan where the major metropolitan transit stations are concentrated.
In contrast, the most unattractive areas for openings were concentrated in Gangnam. The three major Gus of Gangnam—Seocho, Gangnam, and Songpa—clearly show a very low probability, presumably due to three reasons. Commercialization expanded in those Gangnam-Gus in advance of our study period of 2011 to 2016, which led to a lower probability of openings. Historically, the Gangnam had also been developed in large scales and was re-developed in recent years again in large scales, which is often called a Korean version of gentrification leaving a smaller number of single-family and smaller multifamily structures than Gangbuk. In addition, even single-family and smaller residential structures are much less likely to be converted to cafés and restaurants because these three Gus are the most affluent neighborhoods in Seoul and even across the entire South Korea, which means potential rent in the three Gus should be high.
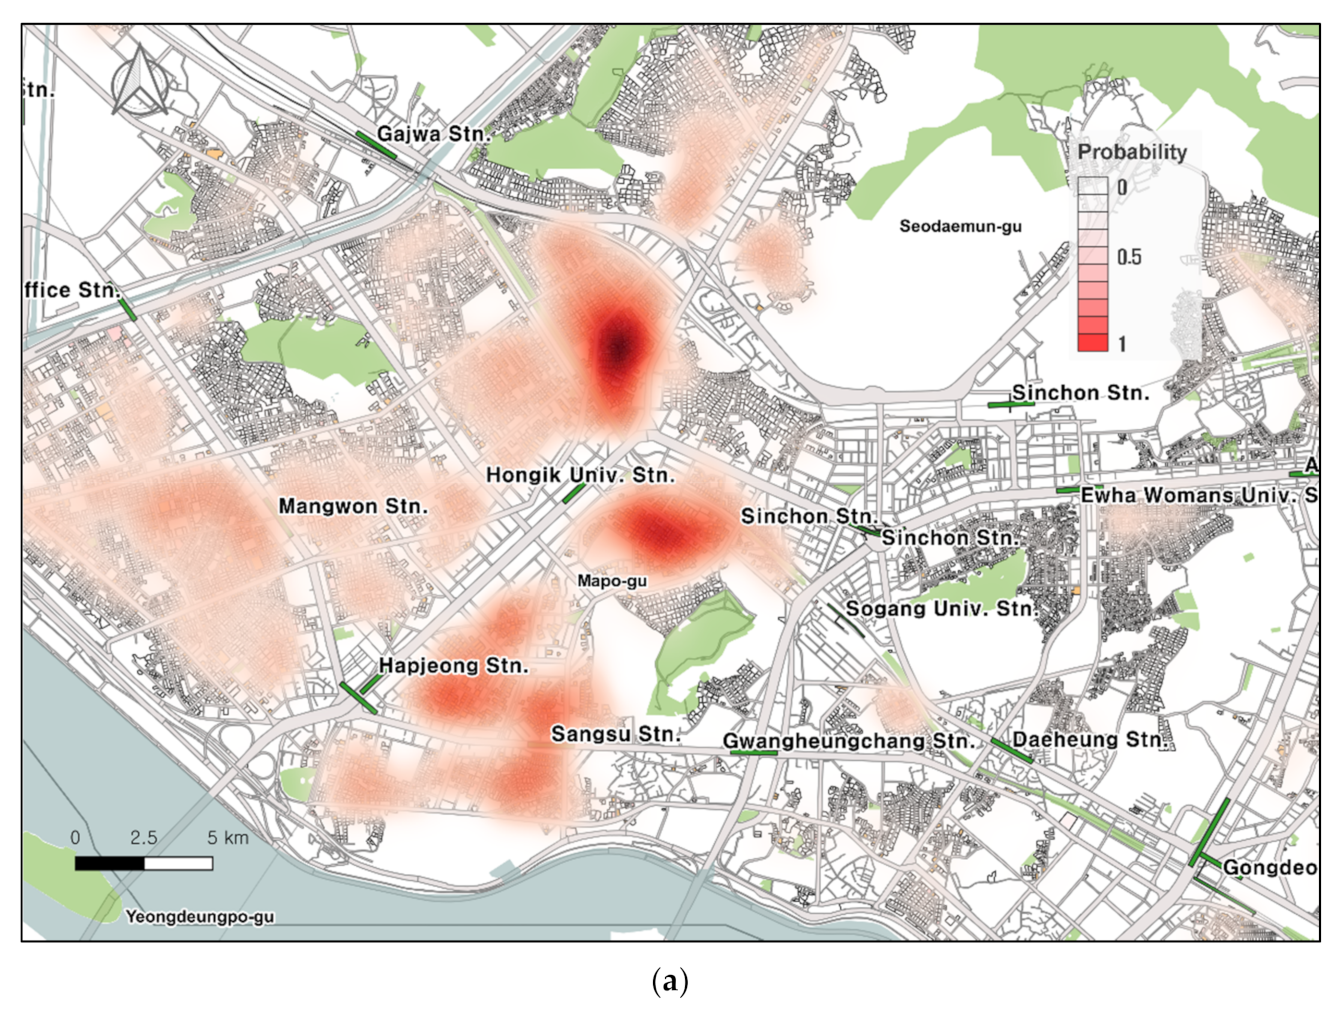
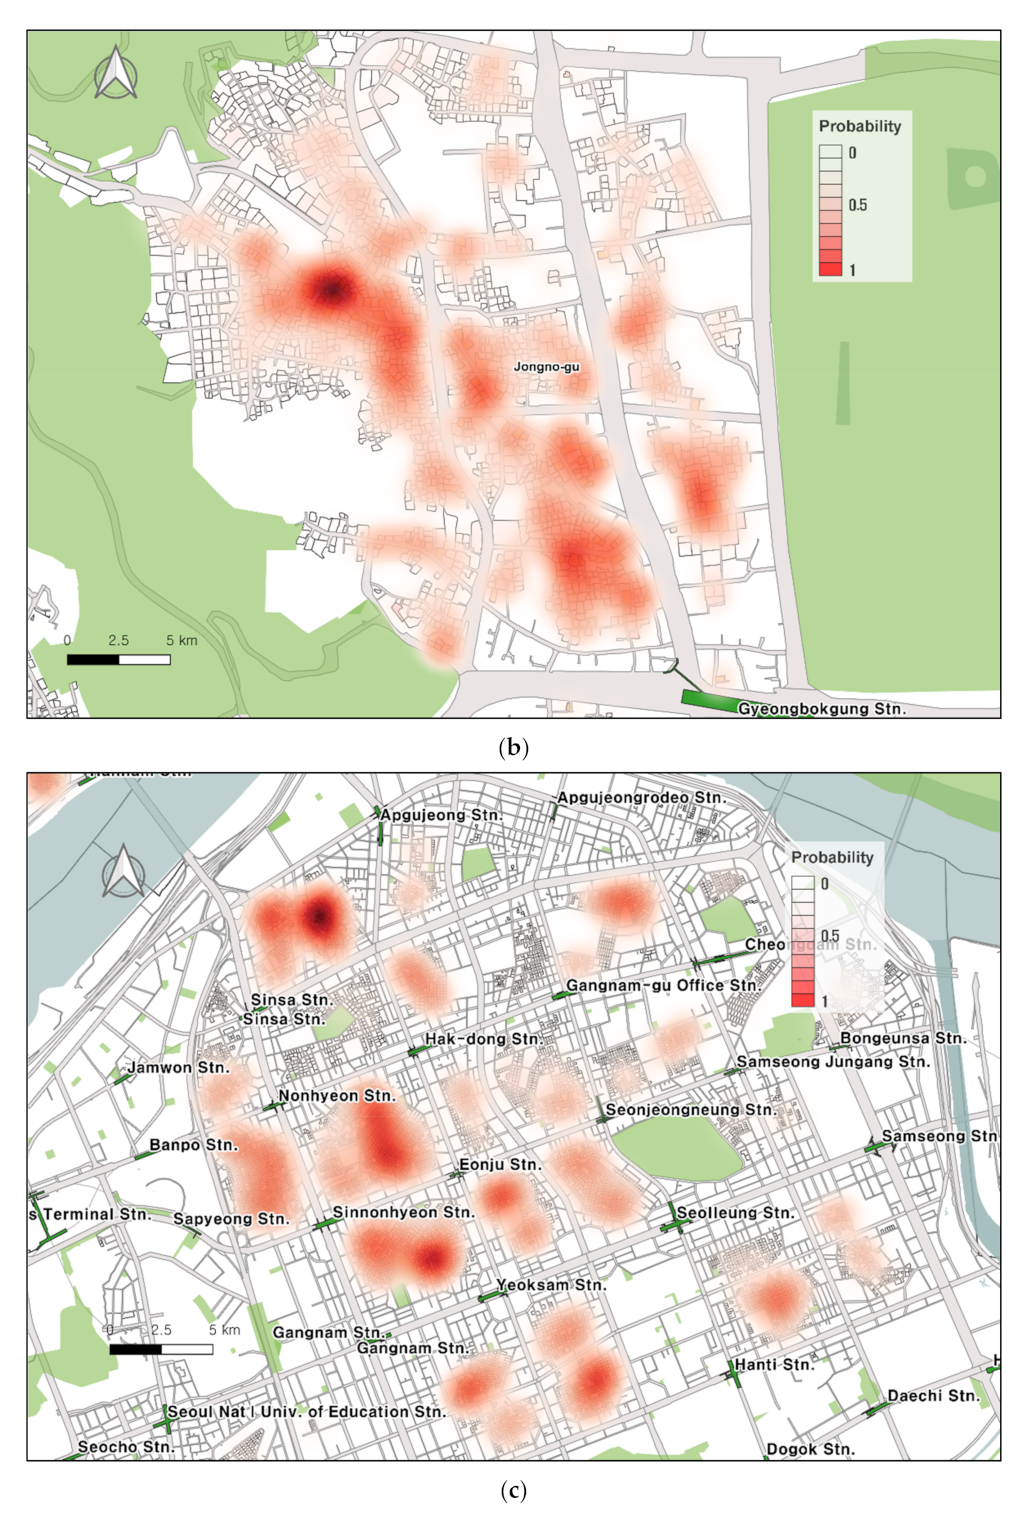
4.2.2. Closer Look into the Selected Hot Areas
Although
Figure 5 has an advantage of overviewing the entire city of Seoul, it is limited to show specific areas with fuller details. In
Figure 6, we take a closer look at three distinct areas—Mapo as potentially the hottest place for café and restaurant openings, Seochon as another hot place due to its historical unique context, and Gangnam as the most affluent neighborhood in Seoul but the least likely area for commercial store openings.
Panel (a) presents the Mapo neighborhood, and especially the Hongik university area appears to include parcels that are most likely to be converted from housing to cafés and restaurants. The major universities—Hongik, Seogang, Yonsei, and Iwha—attract college students and other young Millennials. In addition, Hongik subway station directly links to Incheon national airport (the largest airport in South Korea), which brings many foreign visitors directly from the airport into the area, contributing to one of the places that has the greatest number of passenger populations in Seoul.
Particularly along the corridors with the large number of passenger populations, café and restaurant openings are predicted with a probability of 0.8 (80%) and higher. We find that the southern and northern areas of Hongik station are the most likely to be converted to cafés and restaurants. This finding implies that the boundaries between the residential and commercial areas are where café and restaurant openings are most likely to occur and potentially expand into residential areas.
Panel (b) shows the Seochon area in Jongro-gu—often called Hanok Village—where historic residential structures and deprived lower-story residential structures are concentrated. For example, Gyeongbokgung Palace—the royal palace of the Joseon dynasty that was built in 1935—and Sajik Park are historical sites that have long been preserved by the government. The uniqueness of the historic structures, however, turned into the greatest attraction resulting in a rapid conversion of residential areas to unique cafés and restaurants. In contrast to the university and accessibility-based Hongik area, the Seochon area gains its popularity without good transit access but through social network services (SNS) where visitors posted photos and video clips to attract more young Millennials—often called the hot place. Indeed, the Seochon area has been experiencing rapid changes where commercialization expands while existing residents have difficulties, which is often called gentrification in South Korea. The policy concern is that the Seochon area is one of a few places where historic buildings exist and have been preserved, but it is unclear how these historic building can survive through the emerging openings of cafés and restaurants.
Lastly, we look into the Gangnam area (panel c) where large-scale (re)development has been prevalent. For that reason, the size of parcel is generally much bigger in Gangnam than Mapo and Seochon areas. Unlike Mapo and Seochon, where cafés and restaurants are predicted to open along the road, it is predicted in Gangnam that most commercial stores are to open in parcels that are distant from major corridors. This finding is understandable because many high-rise office buildings dominate in major commercial roads in Gangnam, similarly to Manhattan in New York and downtown Los Angeles in California. Gangnam is also renowned for luxury boutiques and wedding shops, or other high-end commercial stores. This implies that cafés and restaurants that are expected to open in Gangnam would differ from its counterparts in Mapo and Seochon, in terms of product type and socioeconomic profiles of potential visitors, which is beyond the scope of this study.
5. Discussion and Urban Policy Implications
The empirical evidence supports several important implications for the policy responses to the commercialization of urban residential areas, in both the South Korean context and international background. These include (1) conducting full-data predictions to identify areas in most urgent policy need, and (2) incorporating recent data to develop an early warning system. Taken together, these findings may substantially narrow the arena for policy responses to urban commercialization, and limit the key factors that should be considered for urban policy.
5.1. Conducting Full-Data Prediction to Identify Areas in Most Urgent Policy Need
One important finding of the preceding analysis is that the XGBoost model predicts an opening rate of 3.3%, which is much closer to the actual opening rate of 3.7% than other comparison models—predicted opening rate of 0.2% in both the random forest model and the binary logit model, as shown in
Table 2. The accuracy in the XGBoost model is achieved mainly by resolving the imbalanced data structure through fine-tunings and careful weightings across over eight million possible combinations. This high level of prediction accuracy is also consistently found in the test-data predictions and full-data predictions. What is altered by using the full data is the identification of any spatial patterns about higher or lower attractions to new cafés and restaurants, and, by implication, the specific geographic location to which the policy responses called for to prepare the expected commercialization. The use of partial data (either train data or test data), however, would fail to give priority for policy response to areas in most urgent need.
An additional notable in
Table 2 is that the number of true positive cases in the XGBoost model (730 cases, 0.87 percent of the entire sample) is 11 to 16 times greater than those in the other comparison models (45 cases in logit and 65 cases in random forest), implying a substantially improved prediction accuracy. The heightened accuracy, however, was accompanied by an increased number of false-positive cases in the XGBoost model (2040 cases, 2.4 percent of the entire sample) compared to other models (124 cases in logit and 84 cases in random forest). The increased number of false-positive cases may be seen as inaccurate predictions but those false-positive parcels in fact may indicate places with a high probability of openings in the near future. Thus, the false-positive parcels and adjacent areas are the most amenable to policy influence, and so their importance for responding to the potential impact of café and restaurant openings deserves emphasis. When our preliminary prediction model was presented at the annual Seoul Big Data Forum, public servants from the Seoul city government were intrigued by a higher predictability relative to traditional economic models, as well as the simplicity of our model to be applied to public services.
5.2. Incorporating Recent Data to Develop Early Warning System
The second overall finding is that the predicted hot areas in 2011—Mapo, Seochon, and Gangnam as shown in
Figure 6—see a continued commercialization even today in 2020. For those who reside in Seoul, most of these following predictions may seem obvious: these areas attract many Seoulians on a daily basis, especially over the weekend, and might even be seen to be places where commercialization has long been and even gone. Nevertheless, it is worthwhile acknowledging that the contextual factors of the commercialization must have been in place by 2011 for our predictions to be made and that, had we had access to the data in 2011, then we could have made these predictions at that time. A similar policy implication was drawn from a London study in which urban gentrification was predicted through the machine learning approach [
13]. Thus, it would be feasible to incorporate more recent data into our machine model and develop a tool that predicts rapidly evolving urban events—commercialization of urban housing in this study—and plays the role of an early warning system [
1]. The early warning system may lead to significant insights as to which residential areas of a given city would attract new cafés and restaurants more strongly than others. The system would also have the advantage of helping city planners and policymakers identify and design policy responses to any disproportionate spatial patterns of the over-attraction.
6. Conclusions
This study was motivated by the fact that small café and restaurant openings have been rapidly spreading into residential areas across Seoul, the capital of South Korea. This urban commercialization is so fast and prevalent that neither policymakers nor residents can respond to it timely without a handy prediction tool. In contrast to previous studies, our work focused on developing a machine learning model that predicts café and restaurant openings at the land parcel level across the entire city of Seoul.
We found a large degree of difference in predictor importance to our machine learning model. The most important predictors are related with land prices, both the absolute level of price and relative price premium, suggesting that economic motivation leads to the conversion of urban housing to small cafés and restaurants. The importance of accessibility to the bus stop and city subway station, or interregional rail station, as a predictor of commercialization shows that transit accessibility, and subsequently greater passenger demand, may lead to commercial store openings in the near future.
Our machine learning model generated the probability of commercialization at the individual parcel level, demonstrating a clear difference in areas that are very likely versus less likely to be commercialized. Of all the 25 Gus that consist of Seoul, Mapo-gu was predicted as the most prone to commercialization of urban housing, and so its urgency to be prepared against the expected conversion deserves underscoring. Our finding that the Mapo-gu is expected to undergo commercialization along the major corridors nearby the cluster of universities and the interregional rail station emphasizes the special need of urban policy responses to be focused on those areas.
A major limitation of this study is that we predicted somewhat rarely occurring phenomenon—only 3.7% of all small-sized housing structures were in fact commercialized in Seoul—which has long been tricky in prediction modelling. The more algorithms that are advanced to increase prediction accuracy, the more tuning is needed to predict rare events. For that reason, we suspect that our final machine learning model (XGBoost) was able to outperform other alternative models (random forest model and binary logit model), simply because it allows more tuning options. The machine learning approach also has its innate limitation that standardized modelling does not exist, and so researchers have to make their own decision depending on their data characteristics. Further, the prediction accuracy was not much stronger than alternative models despite multiple tunings, which is mainly due to the small-target problem.
Also noteworthy is the possibility of a sequential model that may predict today and tomorrow in relation to past trends, but we built a static model which aggregated opening data for an analysis period because the administrative records on existing cafés and restaurants are not publicly available. Even if we built a time-series opening database across the entire city of Seoul, it would be difficult to build corresponding parameters that were observed as frequently as the opening database. The limited count of commercial openings in residential areas also constrained the time-series approach. If we accumulated a temporal database for opening and predictor parameters, however, sequential machine learning models such as RNNs (recurrent neural networks) and LSTM (long short-term memory) would be feasible for not only the entire city of Seoul but also selected areas in policy needs.
The predictors of this study may also be improved by alternative specifications. The land parcel characteristics that measured accessibility to specific facilities and locations can be substituted by density measures, such as the number of transit stations and public facilities per area (or population). Between neighborhood and parcel characteristics, mesoscale factors, such as street design quality and socio-symbolic characteristics, may play an important role in predicting the opening of new cafés and restaurants. Also possible upon micro-level street network data would be replacing distance-based predictors with network-based variables to reflect the actual walkability.
Overall, our results show that the machine learning approach can be applied to predict changing land uses and potentially contribute to timely urban policy designs in rapidly changing urban context. At the same, we expect machine learning models and tuning techniques would continue to advance to better predict rare but stimulating urban changes, including café and restaurant openings in urban housing.
Supplementary Materials
The following are available online at
https://www.mdpi.com/article/10.3390/su13105699/s1, Figure S1: F1-score for combinations of parameters and weights in XGBoost model, Figure S2: F1-score for cross-validation between weight and booster parameter on the maximum depth of tree, Figure S3: test error and train error in XGBoost model, by the number of iteration, Figure S4: precision and sensitivity of XGBoost model, Table S1: conceptual elements of confusion matrix, Table S2: weights and booster parameters in XGBoost model.
Author Contributions
Conceptualization, S.-C.N. and J.-H.P.; methodology, S.-C.N.; software, S.-C.N.; validation, S.-C.N.; formal analysis, S.-C.N.; investigation, S.-C.N. and J.-H.P.; resources, S.-C.N. and J.-H.P.; data curation, S.-C.N.; writing—original draft preparation, S.-C.N. and J.-H.P.; writing—review and editing, S.-C.N. and J.-H.P.; visualization, S.-C.N. and J.-H.P.; supervision, S.-C.N.; project administration, J.-H.P. Both authors have read and agreed to the published version of the manuscript.
Funding
This research received no external funding.
Institutional Review Board Statement
Not applicable.
Informed Consent Statement
Not applicable.
Data Availability Statement
New data were built and analyzed in this study. Data will be shared upon request and consideration of the authors.
Acknowledgments
The authors benefited from comments by the editor and anonymous reviewers, particularly when academic conferences are limited due to the COVID-19 pandemic.
Conflicts of Interest
The authors declare no conflict of interest.
References
- Chapple, K.; Zuk, M. Forewarned: The Use of Neighborhood Early Warning Systems for Gentrification and Displacement. Cityscape 2016, 18, 109–130. [Google Scholar]
- Choi, M.J.; Yang, W.J. Physical, Economic, and Social Effects of Commercial Gentrification in Residential Area. J. Korea Plan. Assoc. 2018, 53, 123–136. [Google Scholar] [CrossRef]
- Heo, J.Y.; Jeong, Y.J.; Jung, C.M. Gentrification Process and Changing Shop Owners in Commercial Area on Gyeongridan Street. Seoul Stud. 2015, 16, 19–33. [Google Scholar]
- Lee, S.Y. Cities for profit: Profit-driven gentrification in Seoul, South Korea. Urban Stud. 2018, 55, 2603–2617. [Google Scholar] [CrossRef]
- Shin, H.B.; Kim, S.-H. The developmental state, speculative urbanisation and the politics of displacement in gentrifying Seoul. Urban Stud. 2016, 53, 540–559. [Google Scholar] [CrossRef]
- Kim, D.Y.; Kim, K.; Kim, G. The Impact of Commercialization-induced Gentrification on Poor Urban Neighborhoods: A Case Study of Dongja-dong JJok-bang District. Seoul Stud. 2017, 18, 159–175. [Google Scholar]
- Yoon, Y.-C.; Park, J.-A. The Rate of Commercial Gentrification in Seoul Focusing on Changing Type of Business. Seoul Stud. 2016, 17, 17–32. [Google Scholar]
- Chu, M.-S.; Kwon, S.-A.; Kwon, Y.-S. The Analysis of Commercialization and Building Changes in Low-rise Residential Area with SNS data: The Case of Sharosoo-Gil, Seoul. In Proceedings of the Annual Conference of Architectural Institute of Korea, Jeju, Korea, 26–29 April 2017. [Google Scholar]
- Kim, S.-H. The Commercialization of Residential Areas and Changes of Architecture at Kangnam in Seoul. Plan. Des. 2012, 2, 127–136. [Google Scholar]
- Lee, H.-W.; Kwon, Y.-S. Commercial Use Expansion Patterns in the Cultural Quarter near Hongik University—With Special Emphasis on a Residential District near the Cultural Quarter Consisting Mainly of Detached, Low-rise Houses. J. Urban Des. 2016, 17, 101–117. [Google Scholar]
- Kauko, T. Classification of Residential Areas in the Three Largest Dutch Cities Using Multidimensional Data. Urban Stud. 2009, 46, 1639–1663. [Google Scholar] [CrossRef]
- Li, F.; Xie, Z.; Clarke, K.C.; Li, M.; Chen, H.; Liang, J.; Chen, Z. An agent-based procedure with an embedded agent learning model for residential land growth simulation: The case study of Nanjing, China. Cities 2019, 88, 155–165. [Google Scholar] [CrossRef]
- Reades, J.; De Souza, J.; Hubbard, P. Understanding urban gentrification through machine learning. Urban Stud. 2019, 56, 922–942. [Google Scholar] [CrossRef]
- Wang, Y.P.; Murie, A. The Process of Commercialisation of Urban Housing in China. Urban Stud. 1996, 33, 971–989. [Google Scholar] [CrossRef]
- Jun, J.; Yang, W. The Comparison of Current Building Uses and Land Use Plan of a Superblock in Urban Residential Area. In Proceedings of the Annual Conference of the Korean Housing Association, Seoul, Korea, 15 November 2014. [Google Scholar]
- Jung, J.H. The Uptrending Commercialization of Samcheong-dong Street in Seoul, Due to the Location of Cultural and Artistic Amenities. Rev. Cult. Econ. 2008, 11, 123–157. [Google Scholar]
- Lee, G.; Lee, S.; Cheon, S. An Analysis of Locational Characteristics and Business Change in the Commercially Gentrified Residential Areas in Seoul, Korea. J. Korean Reg. Sci. Assoc. 2018, 34, 31–47. [Google Scholar]
- Rho, T.; Kang, C. The Impacts of Urban Environment on the Price of Residential Land. J. Korea Real Estate Anal. Assoc. 2009, 15, 81–101. [Google Scholar]
- Zuk, M.; Bierbaum, A.H.; Chapple, K.; Gorska, K.; Loukaitou-Sideris, A. Gentrification, Displacement, and the Role of Public Investment. J. Plan. Lit. 2018, 33, 31–44. [Google Scholar] [CrossRef]
- Jun, M.-J. The effects of polycentric evolution on commute times in a polycentric compact city: A case of the Seoul Metropolitan Area. Cities 2020, 98, 102587. [Google Scholar] [CrossRef]
- Kang, M.; Lee, S.; Cho, N. A Prediction Modeling for the Commercialization of Urban Residential Area Using GIS. Plan. Des. 2002, 18, 197–208. [Google Scholar]
- Kim, H.J.; Choi, M.J. Characteristics of Commercial Gentrification and Change in Perception of Placeness in Cultural Districts: The Case of Samcheong-dong and Sinsa-dong Streets in Seoul. J. Korea Plan. Assoc. 2016, 51, 97. [Google Scholar] [CrossRef]
- Jun, J.; Yang, W. An Investigation of the Building-use Changes of Residential and Commercial Areas in the Land-used Superblocks in Seoul. J. Korean Hous. Assoc. 2015, 26, 127–137. [Google Scholar] [CrossRef]
- Lee, S.-K.; Woo, S.-K. An Analysis on the Transformation of Street Structure in the Detached House Area by the Commercialization—Focused on the “Mannam-Gil Block” in the Jangjeon-Dong, Busan. Plan. Des. 2006, 22, 253–262. [Google Scholar]
- Sevtsuk, A. Path and Place: A Study of Urban Geometry and Retail Activity in Cambridge and Somerville, MA. Ph.D. Thesis, Massacusetts University of Technology, Cambridge, MA, USA, 11 August 2010. [Google Scholar]
- Lee, J.-Y.; Kim, S.-H. The Commercialization and Changes of Urban Fabric and Architecture at Hwayang-dong Residential Area in Seoul. Plan. Des. 2013, 29, 31–40. [Google Scholar]
- Lee, S.-Y.; Kim, B.-S.; Park, J.-A. Characteristics of Transitional Area in Gangnam Superblock. J. Korean Urban Manag. Assoc. 2015, 28, 219–246. [Google Scholar]
- Hong, H.-Y.; Koo, J.-H. Commercial Cluster Characteristics in Residential District Focusing on Garosu Street. J. Cadastre Land Inf. 2016, 46, 57–77. [Google Scholar]
- Allam, Z.; Dhunny, Z.A. On big data, artificial intelligence and smart cities. Cities 2019, 89, 80–91. [Google Scholar] [CrossRef]
- Easton, S.; Lees, L.; Hubbard, P.; Tate, N. Measuring and mapping displacement: The problem of quantification in the battle against gentrification. Urban Stud. 2020, 57, 286–306. [Google Scholar] [CrossRef]
- Ibrahim, M.R.; Haworth, J.; Cheng, T. Understanding cities with machine eyes: A review of deep computer vision in urban analytics. Cities 2020, 96, 102481. [Google Scholar] [CrossRef]
- Kiely, T.J.; Bastian, N.D. The spatially conscious machine learning model. Stat. Anal. Data Min. ASA Data Sci. J. 2019, 13, 31–49. [Google Scholar] [CrossRef]
- Carpio-Pinedo, J.; Hurtado, S.D.G.; De Madariaga, I.S. Gender Mainstreaming in Urban Planning: The Potential of Geographic Information Systems and Open Data Sources. Plan. Theory Pr. 2019, 20, 221–240. [Google Scholar] [CrossRef]
- Carpio-Pinedo, J.; Gutiérrez, J. Consumption and symbolic capital in the metropolitan space: Integrating ‘old’ retail data sources with social big data. Cities 2020, 106, 102859. [Google Scholar] [CrossRef]
- Bae, S.-W.; You, J.-S. Predicting the Real Estate Price Index Using Deep Learning. Real Estate Res. 2017, 27, 71–86. [Google Scholar]
- Yeon, G.-P. A Machine Learning Approach for Enhancing the Appropriateness of Posted Prices. Real Estate Res. 2015, 21, 83–92. [Google Scholar]
- Lee, C.-R.; Park, K.-H. Application of machine learning models for estimating house price. Korean Geogr. Res. 2016, 51, 219–233. [Google Scholar]
- Mun, K.-S.; Choi, J.-G.; Lee, H.-S. An Analysis for Price Determinants of Small and Medium-sized Office Buildings Using Data Mining Method in Gangnam-gu. J. Korea Contents Assoc. 2015, 15, 414–427. [Google Scholar] [CrossRef]
- Liu, C.; Deng, Y.; Song, W.; Wu, Q.; Gong, J. A comparison of the approaches for gentrification identification. Cities 2019, 95, 102482. [Google Scholar] [CrossRef]
- Preis, B.; Janakiraman, A.; Bob, A.; Steil, J. Mapping gentrification and displacement pressure: An exploration of four distinct methodologies. Urban Stud. 2021, 58, 405–424. [Google Scholar] [CrossRef]
- Ewing, R.; Tian, G.; Lyons, T. Does compact development increase or reduce traffic congestion? Cities 2018, 72, 94–101. [Google Scholar] [CrossRef]
- Park, K.; Ewing, R.; Sabouri, S.; Larsen, J. Street life and the built environment in an auto-oriented US region. Cities 2019, 88, 243–251. [Google Scholar] [CrossRef]
- Ewing, R.; Tian, G.; Park, K.; Sabouri, S.; Stinger, P.; Proffitt, D. Comparative case studies: Trip and parking generation at Orenco Station TOD, Portland Region and Station Park TAD, Salt Lake City Region. Cities 2019, 87, 48–59. [Google Scholar] [CrossRef]
- Jun, M.-J.; Hur, J.-W. Commuting costs of “leap-frog” newtown development in Seoul. Cities 2001, 18, 151–158. [Google Scholar] [CrossRef]
- Jun, M.-J.; Kim, J.I.; Kwon, J.H.; Jeong, J.-E. The effects of high-density suburban development on commuter mode choices in Seoul, Korea. Cities 2013, 31, 230–238. [Google Scholar] [CrossRef]
- Jun, M.-J.; Kim, H.-J. Measuring the effect of greenbelt proximity on apartment rents in Seoul. Cities 2017, 62, 10–22. [Google Scholar] [CrossRef]
- Kang, C.-D. The effects of spatial accessibility and centrality to land use on walking in Seoul, Korea. Cities 2015, 46, 94–103. [Google Scholar] [CrossRef]
- Park, K.; Ewing, R.; Scheer, B.C.; Tian, G. The impacts of built environment characteristics of rail station areas on household travel behavior. Cities 2018, 74, 277–283. [Google Scholar] [CrossRef]
- Park, K.; Ewing, R.; Sabouri, S.; Choi, D.-A.; Hamidi, S.; Tian, G. Guidelines for a Polycentric Region to Reduce Vehicle Use and Increase Walking and Transit Use. J. Am. Plan. Assoc. 2020, 86, 236–249. [Google Scholar] [CrossRef]
- Rodríguez, D.A.; Kang, C.-D. A typology of the built environment around rail stops in the global transit-oriented city of Seoul, Korea. Cities 2020, 100, 102663. [Google Scholar] [CrossRef]
- Kang, C.-D. Measuring the effects of street network configurations on walking in Seoul, Korea. Cities 2017, 71, 30–40. [Google Scholar] [CrossRef]
- Carpio-Pinedo, J.; Benito-Moreno, M.; Lamíquiz-Daudén, P.J. Beyond land use mix, walkable trips. An approach based on parcel-level land use data and network analysis. J. Maps 2021, 17, 23–30. [Google Scholar] [CrossRef]
- Gutiérrez, J.; García-Palomares, J.C. Distance-Measure Impacts on the Calculation of Transport Service Areas Using GIS. Environ. Plan. B Plan. Des. 2008, 35, 480–503. [Google Scholar] [CrossRef]
- Kang, C.-D. The S + 5Ds: Spatial access to pedestrian environments and walking in Seoul, Korea. Cities 2018, 77, 130–141. [Google Scholar] [CrossRef]
- Breiman, L. Random Forests. Mach. Learn. 2001, 45, 5–32. [Google Scholar] [CrossRef]
- Jun, M.-J. Quantifying welfare loss due to longer commute times in Seoul: A two-stage hedonic price approach. Cities 2019, 84, 75–82. [Google Scholar] [CrossRef]
- Chen, T.; Guestrin, C. XGBoost: A Scalable Tree Boosting System. In Proceedings of the 22nd ACM SIGKDD International Conference on Knowledge Discovery and Data Mining, San Francisco, CA, USA, 13–17 August 2016. [Google Scholar] [CrossRef]
| Publisher’s Note: MDPI stays neutral with regard to jurisdictional claims in published maps and institutional affiliations. |
© 2021 by the authors. Licensee MDPI, Basel, Switzerland. This article is an open access article distributed under the terms and conditions of the Creative Commons Attribution (CC BY) license (https://creativecommons.org/licenses/by/4.0/).


