Abstract
The tourism industry is one of the fastest-growing industries today, and it is important to obtain insights into its good and bad practices. This will provide policymakers with as much information as possible to tailor specific policies to facilitate tourism and economic growth. The main purpose of this paper is a critical overview of the related research on the topic of evaluating sustainable tourism in European countries and extensive empirical research on achieving sustainable tourism. This research includes Grey Systems Theory (GST) as the main tool in evaluating the efficiency of sustainable tourism. Robustness checking is done via the multiple criteria decision making (MCDM) approach. Although the literature on tourism efficiency is vast, there is a smaller amount of research related to the approach taken in this paper. Thus, a comprehensive and insightful analysis will be done so that relevant and timely information can be obtained for the future decision-making process. Furthermore, a dynamic analysis will be provided so that changes in time can be observed and a detailed analysis can be made.
1. Introduction
The importance of tourism sustainability related to the competitiveness of a destination has been recognized for some time now [1]. This is even more visible today, during the COVID-19 pandemic. Furthermore, the EC recognizes that the role of natural and social resources, alongside sustainability, is fundamental to increasing the economic benefits. However, measuring sustainable tourism is one of the most under-researched topics in the tourism research, as practical tools for implementation are lacking, as well as systematicity [2]. The topic of measuring sustainability, not only within the area of tourism, has been discussed extensively in the literature. There are issues regarding how to construct proper measures [3,4], how to connect the planning processes with the scientific approach and principles in research [5,6,7], and how to connect the political aspects of sustainability planning and decision making with the technical side of constructing sustainability indicators [8,9,10]. There are even issues with how agents and customers observe sustainability [11]. The UNWTO and UNDP both recognize the importance of sustainable tourism in the overall contribution to the sustainable development (SD) of an economy [12]. The UN General Assembly declared the year 2017 to be the International Year of Sustainable Tourism for Development. Moreover, the UNWTO has launched a Statistical Framework for Measuring Sustainable Tourism [13] so that an adequate measurement of sustainable tourism can be established, a dialogue can be created between different sectors, and better decision-making can be made in the future. Furthermore, the authors agree that management policies with a focus on environmental quality increase tourism competitiveness [14,15,16]. Thus, it is visible that the literature and international organizations recognize the importance of tourism sustainability and environmental aspects [17] within the overall sustainable development of countries.
Issues arise when seeking to define the relevant variables to measure the tourism sustainability and in constructing indices that objectively measure (un)successfulness in achieving the goals and concepts of sustainability so that effective measures of economic policy can be made in a timely manner. The majority of existing work that tries to establish a ranking system, measures of achieving certain goals, and similar topics focuses on specific case studies of regions, cities, or specific tourism destinations [18]). Other work focuses on composite index construction based mostly on economic data, which measures the monetary and similar outcomes of the tourism industry and destination competitiveness [19,20,21]. There is official tourism competitiveness and total sustainability competitiveness of countries (Travel and Tourism Competitiveness Index, TTCI, World Economic Forum, [22]; Global Sustainable Competitiveness Index, GSCI, [23]); these indices do not offer detailed insights into the sustainability of the tourism industry, especially in the area of the environmental dimension of sustainability. As [24] emphasize, policymakers need synthetic measures that indicate the competitiveness of tourism. However, some caution should be used when utilizing secondary data. Other problems of sustainable tourism literature include the engagement of the authors solely with parts of sustainability [6,25,26]. However, recent literature has found that sustainability is perceived as a strong predictor of key prosperity dimensions [27].
Thus, the contribution of this research is found in the following. First of all, a quantitative approach in this study allows for a robust ranking system between the selected countries based on relevant sustainability variables. As [28,29] state, sustainability needs to be measurable in order to enable its evaluation. The approach used in this study is objective, with straightforward interpretations. The objectivity of sustainability ranking is emphasized in [30], and [31]. Furthermore, a gap in the literature is found in terms of observing only some aspects of sustainability, as [32] found. Here, the aim is to include different aspects by incorporating available relevant variables in order to compare the countries. Although research mostly focuses on local-level sustainable tourism, the local levels cannot be observed in isolation, as found by [33]. As local levels are part of large networks, country level should be analyzed as well. The supply chain management within tourism is, thus, important on individual or local levels but on the country-level as well. Findings in [33] conclude that the environmental performance on a country level increases the strength of the supply chain (in tourism), which is in line with the industry-level data findings in previous literature. Local level data are hard to collect and compare from one city, region, etc. level to another, whereas country level data are more available (e.g., Eurostat). Such aggregate data on this level can be observed as the supply chain strength at the country level, which can be comparable among countries. The efficiency measurement provided in this research belongs to the strand of literature that deals with dynamic analysis. Necessary policy decision-making relies on a dynamic approach, due to structural and other relevant changes in economies [34]. Furthermore, the research of previous literature in [35] concludes that dynamic performance evaluation is crucial for the improvement of performance measurement itself. That is why the dynamic approach is utilized here and can provide insights into the changes of sustainable tourism performance so that timely decisions can be made. Moreover, [36] claim that sustainability indicators indicate changes over time that either contribute or not to the concept of sustainability. This is why dynamic analysis provides meaningful comparisons between locations and between different periods of time, as stated in [37]. Finally, achieving sustainable tourism has its issues due to problems of measuring the concept [38]. This paper follows a methodology that is intuitive and easy to understand. Thus, it makes it competitive in relation to more complex approaches in which many variables are needed in order to construct sub-indices that then construct one final index used in rankings (e.g., the SDG index, sustainable development goals index).
That is why the purpose of this research is to provide an empirical approach to measuring and comparing the sustainability of the tourism industry of selected European Union (EU) countries, with a focus on environmental aspects. There are several reasons for this. Firstly, the EU countries have to follow the same legislation regarding sustainable development, circular economy, and related concepts. This makes the outcomes of these countries in these areas more comparable than countries from different world regions. Secondly, the empirical research on comparisons of tourism output, although rather large, has a gap in this specific area of measuring tourism sustainability on a macro, i.e., country level. Such analysis would provide better comparisons between countries, so that future policy tailoring could be made properly, with a country-specific focus. Thirdly, if an objective ranking system can be established and used based on available data, it could provide a starting point in constructing more complex measures if needed. Finally, based on publicly available data which will be used in this research, a ranking system can be made every year, instead of some other measures that are published every several years (e.g., the Travel and Tourism Competitiveness Index is published every 2 years). This enables a richer dynamic analysis so that if some inefficiency is found in a country’s performance, the reaction of the policymakers can be faster. Thus, the empirical research of this paper includes the analysis of selected European Union countries, for the period from 2008 to 2017, with a focus on environmental aspects of tourism sustainability. The methodology of this research will utilize the nonparametric approach of Grey Relational Analysis as the main tool in constructing the ranking system, with robustness checking via another approach—Multiple Criteria Decision Making (MCDM).
The rest of this research is structured as follows. The second section gives a critical overview of previous related research. Thus, literature gaps can be observed in a better manner. Next, the third section describes the methodologies utilized in the study, with the empirical results provided in the fourth section. The final (fifth) section deals with conclusions and recommendations.
2. Literature Review
The literature on the topics of tourism competitiveness without the environmental aspect is growing, as well as the success of overall sustainability or circular economy. This section will focus on research that is closely related to the topics covered in this research. The sustainability concept within the tourism industry was recognized by authors almost as early as the concept of sustainability of the total economy. Early literature deals with definitions of sustainable tourism [39,40,41,42] (. Interested readers can refer to [28] on the early research. However, there are problems in quantifying the sustainable tourism even today [38] due to the lack of a generally accepted statistical framework [2] and the lack of objective criteria [30,31]. By observing the previous literature, several conclusions can be made. Firstly, there are several approaches to measuring sustainable tourism. The three most common approaches are using the indicator sets (existing indicators from SD indicators or other relevant variables from publicly available data), construction of composite indices, and wealth accounting [43]. Secondly, various methodologies are used to obtain answers to specific questions. Part of the literature utilized data envelopment analysis (DEA) to construct a ranking system of countries, regions, etc. Other parts used econometric techniques, such as panel regression or conduct surveys, such as the Delphi survey. The methodology used in research depends on the research questions. Next, there is a greater amount of papers that focus on local level analysis, such as specific regions and cities. A smaller amount of research deals with country-level analysis. Other researchers focus on the circular economy concepts and/or sustainability of the whole economy, with analysis on how these concepts affect the (macro)economic variables or vice versa. The overview of these conclusions is as follows.
Several papers deal with the construction and measurement of variables and methodological systems that are complementary to the Travel and Tourism Competitiveness Index (TTCI): [44,45,46,47], or [48]. In the last couple of years there has been a rise in the segment of sustainability within the tourism industry, as the United Nations WTO is developing Measuring Sustainable Tourism (MST) [2], which is a procedure to measure the effect of tourism on sustainability. Thus, studies like [30,49,50] have emerged. However, the majority of this work focuses on specific destinations. This makes it difficult to make comparisons between regions or countries. Panel regression approach can be found in the paper [51], in which the authors observed a panel regression for 28 EU countries to obtain insights into the effects of the circular economy on economic growth. This research utilized the following variables: resource productivity, recycling rate of packaging waste, recycling rate of biowaste, recycling rate of municipal waste, environmental tax revenues, and research activity (related to recycling). It is clear that this research is more focused on the recycling and innovation aspects of the level of economy (not tourism). Ref. [52] also utilize country-level data, but authors focus on 12 Central America and Caribbean countries in their panel quantile regression approach. The main idea of this research is to observe how ecotourism and related sustainability indicators affect the economic development of selected countries. Controlling for economic and social effects, the authors found that sustainability indicators have a positive effect on economic growth. This is an important finding in favour of achieving sustainable tourism in order to achieve not only sustainable economy but growth as well. Sustainable economic growth was in the focus of [53], where authors also observed EU countries and found that infrastructure, higher education, and research and development (R&D) are some of the main factors related to achieving sustainable growth over time. As authors assume that there is a feedback relationship between economic growth and selected variables, a system GMM (generalized method of moments) was applied over 28 EU member states for a long period (from 1977 to 2014). However, tourism was not in the focus of this research. However, factors that influence general SD goals of a country surely affect the tourism sector as well. Some other newer studies also include [54], where authors observed the Eurozone countries to determine the relationship between pollution levels and the use of renewable energy resources. This research belongs to a group of papers that deal with the environmental Kuznets curve, where effects of economic growth on pollution and environment in general are observed (again, via panel regression approach). Such research is important as well, as the relationship between sustainability and growth is not one directional.
Approaches such as the aforementioned DEA, and similar nonparametric ones, such as the GRA or MCDM (multiple criteria decision making) approach, are present in the literature as well. Renewable energy systems have been measured in [55], in which authors utilize the regression approach alongside the Grey Relational Analysis, on a sample of Australian data. Here, authors utilize the Grey regression to aggregate 11 basic sustainability indicators into a general indicator. This approach was utilized, as authors state, due to uncertainties in the assessment of sustainability. However, the study did not focus on the aspects of sustainable tourism but rather on general sustainability. This approach could be interesting to apply on specific industries, such as tourism, which is the focus of this research. Selected Chinese regions and their urban environmental sustainability were examined in [56], as well as environmental protection levels. However, this research is short and a rather technical one. As the methodology of the Grey convex relational degree is explored, a simple numerical example is given in the empirical part of the paper. Several Chinese provinces are observed, and only three variables (gross domestic product per capita, energy footprint per capita, and ecological footprint per capita) are taken into account. Thus, there is room for improvement regarding variable selection, depending on the research question about sustainability. However, the paper is more technically oriented. That is why the application part is lacking more depth compared to some other studies. The application of a DEA model can be found in [57], who focused on the 22 Asia-Pacific Economic Cooperation countries. This research uses the DEA methodology to construct a composite indicator of the energy index. The empirical part is simpler, due to showing the possibilities of the developed model, as it focuses on data from only one year (2002) and 18 countries. Ref. [58] have observed 27 Annex I countries via a two-stage DEA model. Authors propose this model to construct sustainability efficiency indices. However, the main variables in focus are air pollutants regarding the environmental factors. The contribution of such research is found in the idea that the efficiency can be evaluated in more than one period, with comparisons of changes of the efficiency itself. Ref. [59] ranked 20 Italian regions regarding environment output. In this research, authors gave an overview of 4 DEA models that were developed over the years. These models take into consideration the sustainability variables and their differences compared to purely economic ones. The paper is a technical exercise of the mentioned models, with basic interpretations of the results to see how they can be used in practice. Policy recommendations are scarce. Recycling rates and CO2 emissions were part of the study in [60], alongside economic variables. Thus, the economic and environmental factors are observed at once when evaluating the economic growth. The analysis in this research is static, with a sample of 29 OECD countries included in the empirical research. Efficiency scores obtained from the DEA model were then analyzed via the clustering approach, as this resulted in meaningful groups of countries. However, the tourism aspects were not observed here, as in the majority of previously commented papers. The SD concepts were examined on the whole economy level [61] focused on Chinese provinces in determining the simultaneous achievement of economic prosperity and environmental protection. A dynamic approach was made, as the observed period included yearly data from 2003 to 2014. A DEA model with undesirable outputs was utilized in the study. Such outputs refer to the pollution aspects that are outputs of economic activity. As differences were found between the observed provinces, authors propose that the national policymakers tailor different approaches with respect to differing results. Again, this paper focuses on the total economy SD aspect. Ref. [62] also applied the DEA methodology in their study (meta-frontier slacks-based measure (SBM)), to assess growth sustainability. Only CO2 emissions and energy consumption variables were included as environmental aspects, on a sample of 37 European and 36 Asian countries members of the UN (United Nations).
Ref. [34] has obtained a ranking system of 22 European countries regarding simultaneous achievement of sustainable development and circular economy goals, with additional analysis of the factors that are closely linked to those goals. This ranking system was obtained by using the GRA approach as in this study. However, the research from 2020 focuses on the circular economy (CE) concepts on the whole economy level and not in the tourism industry. Some authors have connected the measurement of sustainability to the circular economy [63]. Such research is currently rare in the literature but is important, as the results here show that the SD and CE concepts are very much connected and cannot be observed disjointedly. The author used the GRA approach of modelling, over the sample of 23 EU member states, for the period 2010–2016. Although recommendations are given for the worst performing countries in the study, this paper also observes the total economy results and not only the tourism aspect. Ref. [64] focus on the same countries as this study, 23 European Union member states, and the same period (2008–2017). However, the authors utilize a different set of variables, and several MCDM approaches are used. The goal of this study was to contrast several methods within MCDM, in order to see the consistency of the ranking systems. The study did not focus that much on the economic interpretations and policy recommendations. This research rather complements it, due to more extended interpretations, which are important for the policy makers. Refs. [65,66,67] focused on the Italian municipalities and regions, where authors utilized the tourism pressure, solid waste generation, and public expenditures in environmental protection as main variables related to sustainability within the tourism industry. Here, basic DEA models (BCC and CCR, i.e., Banker-Charnes-Cooper and Charnes-Cooper-Rhodes) and the window analysis (i.e., a dynamic one) were used in order to compare the efficiency of the mentioned municipalities and regions. As the previous literature mostly focused on economic aspects of the efficiency, these papers incorporated the environmental aspects that cannot be ignored when observing tourism performance.
Other Grey Systems Theory applications within the tourism industry are found in the following research. By observing these papers, it is clear that the authors give a brief overview of the methodology, with basic interpretations, and some even fill the space of the paper with calculations that are intermediate steps in the overall process (and not essential at all). The majority of these papers are focused on Chinese data: [68,69,70,71]. To the knowledge of the author, greater and more detailed analysis such as this one does not exist, just the aforementioned papers that resemble practice interpretations. Although the research is increasingly more interested in the aforementioned concepts, there are gaps in the literature that can be filled. They mostly refer to a reliable approach to constructing a ranking system that can be used in the decision-making process of policy makers. Some research results cannot be compared to one another due to different research questions asking for different methodologies. E.g., panel regressions are used to estimate average effects of selected variables on other ones, whereas ranking methodologies are constructed in such a way that the best and worst performance is calculated and not solely the average one. However, based on this review section, it can be seen that many questions in this area of research still exist, in research focusing on methodological aspects, along with economic and SD interpretations.
3. Methodology Description
There are many different approaches, both parametric and nonparametric, which can be used as tools in output efficiency comparisons. Each approach has certain advantages and shortfalls when compared to another. If used correctly, an approach can provide the researcher with much useful information about the topic of interest and how the results can be implemented in the decision-making process. Thus, the approach of this research is parsimony, i.e., if the main results of interest can be obtained via simpler approaches, which are intuitive, and many interested parties could understand how to interpret the results. There is no need to over-complicate the procedure of obtaining the results.
3.1. Grey Relational Analysis
Grey Systems Theory (GST) includes one relatively unknown methodology that is very useful in obtaining a ranking, called the Grey Relational Analysis (GRA). It is a relatively newer theory and a modelling approach when compared to, e.g., DEA (Data Envelopment Analysis) or other approaches within the OR (Operational Research). GST has been developed since the 1980s [72], and it is mostly used when the data is so-called grey. This means that the data contains uncertainties; the decision-maker has incomplete information about the entities being observed, etc. The advantage of this approach compared to others is that it is simpler to implement, the interpretations of the results are very straightforward, and it is a nonparametric approach since it does not require any distribution assumption about the data that are observed. We follow Liu and [73,74,75] in the main description of GRA methodology as follows.
The decision maker is dealing with I behavioural sequence data on J alternatives that have to be ranked, I ∈ {1, 2, ..., I}, j ∈ {1, 2, ..., J}. Behavioural data refers to the criteria that are ranked, in our case, environmental variables of a country. Alternative j is the country that is contrasted to others. All of the data in year t are collected in a matrix:
where rows refer to the countries and columns to the criteria (variables) that are used to compare countries to one another. (xj(1), xj(2), ..., xj(I)) is the behavioural sequence for the j-th country. The first step is to normalize the data, based on the definition of the variable. If the value of a variable should be the greatest possible, the normalization in every year t is obtained as follows:
If a variable should have the smallest possible values, the normalization is defined as:
Such normalizations enable the new values to be in the range [0.1]. The closer a normalized value is to the unit value, and the country j is better performing with respect to variable i. The second step is to compare the normalized data in (2) and (3) to a referent sequence y*(i). This value is the optimal value for a criterion, which is determined by the researcher. The values (2) and (3) will be compared to the value of 1, as the normalized values fall in the mentioned range [0.1], so that every country is compared to the best value 1, i.e., the best country with respect to a criterion. More details can be seen in [75]. Thus, the differences are calculated as: . In the third step, the Grey Relational Coefficients (GRC) are calculated for every country in every year t as the ratio:
where p is the distinguishing coefficient, between 0 and 1, . The final, fourth step is to calculate the Grey Relational Degree (GRD) for every country in year t as a weighted average of the values in (4) for every criterion:
The weights wi are determined based on the previous knowledge of the researcher, legislation, or any other approach. The sum of all weights has to be equal to 1. In order to be as objective possible, this research uses equal weights in the ranking system. Comments on other weights will be given in the discussion section. The value of the GRD coefficient for every country is then compared to one another in order to obtain the ranking system. The higher the value of a GRD coefficient is, the better performing the country is in a year t.
3.2. MCDM Models
As a robustness checking of the rankings from the GRA approach, two MCDM approaches will be utilized, as this methodology is within the area of OR (Operations Research), popular in constructing ranking systems. The often-conflicting criteria within economic applications makes it difficult for the decision maker to make final decisions. More details on MCDM applications within the area of environment, linked to this study, can be found in [76]. We follow the steps for obtaining the ranking system via MCDM approach as in [77,78,79]. We observe a matrix of data on every country j and objective (i.e., the variables) i, Xij = [xij], where i ∈ {1, 2, ..., I}, j ∈ {1, 2, ..., J}. The multi objective optimization by ratio analysis (MOORA) ranking system is as follows. A ratio between each country j and all alternatives regarding the variable i is calculated as:
as a means of normalization, where is the normalized response of the i-th country, with the value falling in the range between 0 and 1. The next step is to calculate the normalized assessment for every country j by adding values , which should be the greatest possible and subtracting those , which should be the smallest possible:
The values of countries can be ranked now in every year t. Again, equal weights are given to all criteria in (7). A second approach is the Full Multiplicative form of Multiple Objectives, FMFMO, with the MOORA (MultiMOORA), based in the utility theory [80]. Instead of using (7) in the ranking system, the utility value within MultiMOORA is calculated as:
The reasoning why the MCDM approach is used in this study is that it is designed to be used in comparisons of alternatives based on (often) conflicting criteria. Thus, it results in a ranking system based on a different approach compared to the GRA one, but the rankings can be comparable, as the idea is similar to the GRA approach: higher values of criteria are treated as having a positive effect on the ranking, whereas lower values of criteria have negative effects. Environmental applications of the MCDM models and other details can be found in [76]. The MOORA and MultiMOORA utilized in this paper are robust with respect to seven different criteria important in constructing a ranking system, as found in [79].
3.3. Comparisons of GRA to Related Approaches
Using different methodological approaches that deal with constructing a ranking system based on (often conflicting) criteria, this subsection compares the GRA approach to others. Some of the main approaches utilized in the construction of ranking systems with uncertain data are probability and statistics, rough set theories, the Grey approach, and fuzzy mathematics. The main differences between these approaches compared to the GRA used here are as follows: probability and statistics rely on the assumptions about large samples and distribution assumptions as well [81]. The Grey methodology deals well with smaller samples and problems with information (grey data, uncertain and poor information) [72,74]. In order to contrast the Grey approach to similar ones in prediction and ranking construction, [82] compared the obtained results across different approaches. The results showed that the Grey approaches were more efficient in obtaining the results. Finally, as the Grey methodology is often contrasted to the fuzzy set theory, [83] compared the two. The fuzzy approach has to include membership functions in which the decision maker needs to define the absolute belongingness to a set. On the other hand, the Grey approach limits the grey numbers over a defined universe, as it is based on relativity.
3.4. Hypotheses of Research
Based on the literature overview, the two following hypotheses are formulated:
Hypotheses 1 (H1).
Sustainable tourism ranking of a country is affected by tourism pressure, waste management, water treatment, and renewable energy treatment. This hypothesis is based on findings in [53,65,66,67,84,85,86,87,88,89,90,91], where the aforementioned variables are found to be predictors of the results of sustainable tourism. However, this research observes the relevant variables simultaneously.
Hypotheses 2 (H2).
The obtained ranking system of sustainable tourism is robust. This hypothesis is based on previous research that emphasizes the great role of robust rankings as this is important for policymakers and other relevant stakeholders [92,93,94].
4. Empirical Results
4.1. Data Preparation
In order to obtain the rankings of the sustainable tourism aspects, the following data were collected from the [95] online database: nights spent at tourist accommodation establishments; tourism pressure; waste treated; investments related to circular economy sectors; water exploitation; and share of renewable energy consumption. Detailed descriptions are given in Table 1. The available data included the following countries: Austria, Belgium, Bulgaria, Croatia, Cyprus, Denmark, Finland, France, Germany, Greece, Hungary, Italy, Latvia, Lithuania, Netherlands, Poland, Portugal, Romania, Slovakia, Slovenia, Spain, Sweden, and United Kingdom. The years included in the study are from 2008 to 2017. Newer data are not available for the majority of variables (i.e., some variables had data for 2018, but not all, so the idea was to obtain as much comparable approaches as possible). Furthermore, the Travel and Tourism Competitiveness Index was not included in the study as a variable that could be used to compare the overall competitiveness of the observed countries, as data are available only bi-annually.

Table 1.
Variable description.
Nights spent at tourist accommodation establishments is one of the most commonly used variables in ranking tourism competitiveness [96,97,98,99,100]. Tourism pressure has been discussed extensively as well, as a problem of many destinations today [65,66,67,84,85,86,87,88]. The waste treatment within the tourism industry is also a key factor in achieving sustainable development. Thus, much empirical work has been focused on this variable as well [86,89,90,91]. The investments related to the circular economy are important in tourism as well [101,102]. Water usage has been investigated in the literature as well, as tourism produces such environmental pressures [103,104,105]. Finally, renewable energy also plays a key role not only in the circular economy in tourism but in the whole economy as well [106,107].
4.2. GRA Results
The described procedure of calculating the GRD coefficients has been done for every country in every year, based on the described variables. Then, all of the coefficients have been ranked in each year, with the ranking results shown in Table 2. As seen from the table, the overall best-performing countries were: Sweden, Latvia, Finland, Denmark, and France, with the worst performers being Cyprus, Greece, Belgium, Netherlands, and Portugal. The conclusive interpretations are provided in Section 4.4. Discussion.
Table 2.
Rankings of countries.
Besides the analysis provided in Table 2, the dynamics can be observed so that policymakers can get insights into whether the actions taken are producing results or not. This is shown in Figure 1, where the GRD values for the best and worst performers are shown. Both best and worst performers are either stagnating over time, or getting a bit worse in terms of the GRD value (increases of these values indicate better performance, and the opposite is true for decreases). This means that sustainable tourism, with increasing tourism demand, pressure, and overall environmental pressures, is a challenge for all countries, not just the worst-performing ones.
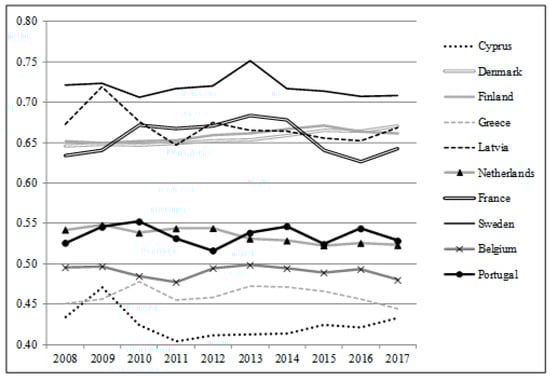
Figure 1.
GRD values of best and worst performers.
This is the reason why individual countries should focus on their specific sources of good and bad practices, which lead to such results. For these purposes, we are showing the needed reduction of variable tourism pressure as an example of what else can be done within this methodology. The researcher can calculate, based on the difference from the best-performing country, the needed increase or decrease of a variable of interest so that the performance is improved. Table 3 shows a percentage of how much each country should reduce its tourism pressure, relative to its starting values, so that it improves its performance. This also provides valuable information on which variables of interest should be tackled the most if their relative reduction or increase is greater compared to other ones.
Table 3.
Needed tourist pressure reduction, in %.
4.3. Robustness Checking
In order for the results to be reliable, the robustness check was done via the MCDM approach, where the rankings were re-done by the two mentioned approaches in Section 3.2. Next, the rankings from all approaches were compared and the correlation coefficients were calculated between the MCDM ranking systems and the GRA approach. As can be seen in Table 4, the correlation coefficients are fairly high, which means that the rankings are very similar. Another approach was to compare the rankings from the GRA approach to the Global Sustainability Competitiveness Index [108] and the natural capital section; the coefficients of correlation are of moderate level for 2015 and 2016, with an increase for 2017. The natural capital section does not provide full insights into the tourism industry sector. Thus, this is why the coefficients are a bit lower in Table 5. Nevertheless, the results obtained in this study provide the first insights into the measurement of sustainability of tourism on a national level.
Table 4.
Correlation coefficients between ranking systems.
Table 5.
Correlation coefficients between ranking systems.
4.4. Discussion and Policy Implications
The following reasoning is the main explanation of why such results were obtained. Sweden is the best performer as it is a leader in the environmental policy applications, its economy is innovation-oriented, and it has an excellent welfare state system. It has experienced significant innovation regarding the circular economy, environment, and sustainability, with good progress in cutting GHG (greenhouse gas) emissions over the years [105]. Although Latvia is not the best performer in terms of economic comparisons and total economic competitiveness, the environmental performance of this country has improved significantly over the last 20 years, with investment in the environment being one of the main drivers of progress [109]. Waste management has improved as well, alongside the increase in waste recovery rate. Finland has similar traits to Sweden, with a great capacity of EU funds that have been used in environment and resource efficiency via the LIFE Environment and Resource Efficiency stand [110].
Although Denmark has performed very well in terms of economic outcomes, it is not lagging concerning environmental policies, which have been the focus of economic policy for some time now [111]. Environmental issues have been incorporated into the government decision making process in France [112], which has increased green taxation. Some of the problems the worst-ranked countries are facing are as follows. Cyprus still has a problematic environmental policy with the legislation not being in accordance with the EU directives [113]; Greece has problems with great tourist inflows every year and no reliable waste management policy with waste overflows of landfills in tourist areas [114]. Furthermore, Belgium has problems with increasing public debt, which makes the government prioritize this matter instead of improving some sectors such as environmental protection [115]. The Netherlands has problems pursuing sustainability practices as a consequence of a decade of austerity policies [116]. The problems that Portugal is facing are as follows: challenges with nature conservation and waste management, political tensions regarding subsidies for the renewable energy sector, etc. [117]. Some best-ranked countries here still have other problems regarding the overall economic development and R&D policies, such as Latvia [86], which should be examined so that sustainable tourism growth can be achieved from that standpoint, not just the bulk of untouched water and other environmental resources. Renewable energy use as a variable used in this study is an important factor of environmental sustainability of tourism, as found in [106,118,119]. Furthermore, waste generation and treatment also play an important role, due to tourists generating greater waste streams compared to residents of a destination [120]. The lack of collaboration between all stakeholders of sustainable tourism is also an issue found in the literature [121,122].
Furthermore, the findings regarding good ranking of poorer countries are in line with [5], where authors state that it is a myth that green economy is a luxury good and prove it with empirical findings over a sample of 128 countries. Next, previous literature finds that poor literacy and knowledge about sustainability contribute to the problem of not achieving the SD goals of the economy, and tourism as well (see [53]). This implies that some countries that were found to be inefficient in this study surely have such problems. This should be one of the priorities of the policymakers, to conduct surveys in order to obtain the state of such knowledge. Other recommendations for public organizations include: trying to reduce tourism pressure regarding time and place. Differently put, dispersion of tourists over greater area and over a greater period over the year could be something to strive for in those countries that suffer from tourism pressure. This can be done via promotion, new attractions, changing the prices with respect to the period of the year, etc. As previous literature ([123,124,125]) found that some countries face lower awareness among consumers regarding CE concepts, authorities should focus on raising this awareness. This is not true just for the countries that are tourist attractions, but it is important to educate the public in those countries the tourists originate from. By focusing on the methodology utilized in this study and policy implications, there are several proposals that can be done to carry out this in practice. First of all, if policy-makers and other interested parties want to include other variables in the model, it can be done very easily. This is due to GRA being flexible and easy to interpret. Thus, more complex considerations can be made in practice, based on specific needs. Next, the approach used in this study can be tweaked in terms of comparing countries to some specific existing country, and not to the ideal one, as done in this paper. In other words, interested decision makers can compare the countries to a specific country whose results they aim to achieve, or good practices that they look upon.
Ref. [126] discusses the debate on two positions regarding sustainability indicators: one group of researchers agrees that indicators should be aggregated into simple numbers so that they are easy to interpret and are interesting to the media and policy makers. The other group thinks that a whole system should be generated with more complex issues and processes involved. However, [127] agree that the latter group is questionable for tourism planning and the whole management process, as the complexity makes everything more complicated. That is why the utility of the approach made in this study can be one of the stepping stones in sustainability evaluation on time, with fewer data, as opposed to complex indicators that are published with a great delay over time. Policymakers need to adjust quickly in order to promote tourism growth with respect to SD goals. The simple approach with selected variables is in line with the extensive discussion of [49], in which authors give a comprehensive analysis of different sustainable tourism indicators, their desirable characteristics, measurability, and variable coverage over time, etc.
5. Conclusions
The main purpose of this research was to obtain a robust ranking system of environmental performance within the sustainable tourism industry of selected European Union countries. Although much work needs to be done in the future, it is a hope that the methodology and interpretations given here provide a stepping stone for more extensive research in the future. This can be seen in the application part in which future research can provide a more detailed analysis of what is needed to be increased or decreased to achieve better performance and ranking in the future. Next, the analysis provided in this study has shown that a dynamic approach can be made, so that progress or regress over time can be indicated. In this way, policymakers can obtain better insights for the future decision-making process. Regarding the policy recommendations based on the results, there is a dichotomy. Some countries are classified as developed in terms of economic development and overall sustainability, are good innovators, and have excellent other relevant factors that affect the overall results. For those countries, the main results are achieved due to good practices and public awareness of the ideas and goals of sustainability that have been present for many decades. Such countries are good examples to follow. Other countries that were classified, i.e., ranked as best performers but are not best economic performers overall, have a good portion of natural resources that are still of excellent quality, and overall lower levels of pollution. Those countries are not the best in terms of research and development, thus they should aim to focus on how to attract as many international funds possible to increase the overall economic competitiveness, infrastructure, and sustainability of the tourism industry. Furthermore, public awareness towards the sustainability issues and environment should be increased, as some countries still have such problems. Next, as much data as possible should be recorded and collected, even on local levels. Today, gathering a large amount of data in the empirical analysis is not a problem as it was in the past. Thus, by collecting data over time, once it has been evaluated for different purposes, it could shed light on specific problems that can be solved. There are still problems with lower levels of cooperation between different stakeholders related to the sustainability and environmental issues in tourism. This should be resolved in the future as well. Thus, all those involved will achieve better results in the future, not only economic but environmental as well.
Some of the shortfalls of this study include things such as data unavailability for certain variables that could be relevant for the circular economy and sustainability concepts. Next, many of the variables are published with a great lag, i.e., the last available data for the majority of the variables used in this study were from 2017. This makes it difficult to conduct a timelier analysis to make economic policy decisions faster. Next, in the analysis, we have focused on equal weights in the modelling process to obtain a ranking system. However, the decision-maker could have other reasons as for why certain variables should have greater or smaller weights in modelling. Thus, future work should include a symbiosis of methodological knowledge and modelling with those who are experts in the areas of sustainability, environment, and circular economy. However, the analysis provided in this study shows that with a smaller amount of data, reliable results can be obtained faster, when compared to complex indices that are constructed by different world organizations.
Funding
No funding was received for this research.
Institutional Review Board Statement
Not applicable.
Informed Consent Statement
Not applicable.
Data Availability Statement
Data are available upon request.
Acknowledgments
The author is thankful to two anonymous reviewers and the Sustainability Editorial Office, for helpful comments and suggestions.
Conflicts of Interest
Author states that there is no conflict of interest. The author states that the views presented in this paper are those of the authors and do not necessarily represent the institution she works for.
References
- European Commission. The European Tourism Indicator System ETIS Toolkit for Sustainable Destination Management; Publications Office of the European Union: Luxembourg, 2016; ISBN 978-92-79-55249-6. [Google Scholar] [CrossRef]
- Guilarte, Y.P.; Quintáns, D.B. Using Big Data to Measure Tourist Sustainability: Myth or Reality? Sustainability 2019, 11, 5641. [Google Scholar] [CrossRef]
- Agyeiwaah, E.; McKercher, B.; Suntikul, W. Identifying core indicators of sustainable tourism: A path forward? Tour. Manag. Perspect. 2017, 24, 26–33. [Google Scholar] [CrossRef]
- Jurigova, Z.; Lencsesova, Z. Monitoring System of Sustainable Development in Cultural and Mountain Tourism Destinations. J. Compet. 2015, 7, 35–52. [Google Scholar] [CrossRef]
- Pulido-Fernández, J.I.; Andrades-Caldito, L.; Sánchez-Rivero, M. Is sustainable tourism an obstacle to the economic performance of the tourism industry? Evidence from an international empirical study. J. Sustain. Tour. 2015, 23, 47–64. [Google Scholar] [CrossRef]
- Ruhanen, L. Progressing the Sustainability Debate: A Knowledge Management Approach to Sustainable Tourism Planning. Curr. Issues Tour. 2008, 11, 429–455. [Google Scholar] [CrossRef]
- Zeppel, H.; Beaumont, N. Climate Change and Sustainable Tourism: Carbon Mitigation by Envi-ronmentally Certified Tourism Enterprises. Tour. Rev. Int. 2014, 17, 161–177. [Google Scholar] [CrossRef]
- Vardarlier, P.; Silahtaroglu, G. Gossip Management at Universities using Big Data Warehouse Model Integrated with a Decision Support System. Int. J. Res. Bus. Soc. Sci. 2016, 5, 1–14. [Google Scholar] [CrossRef]
- Buhalis, D.; Foerste, M. SoCoMo marketing for travel and tourism: Empowering co-creation of value. J. Destin. Mark. Manag. 2015, 4, 151–161. [Google Scholar] [CrossRef]
- Boes, K.; Buhalis, D.; Inversini, A. Smart tourism destinations: Ecosystems for tourism destination competitiveness. Int. J. Tour. Cities 2016, 2, 108–124. [Google Scholar] [CrossRef]
- Font, X.; English, R.; Gkritzali, A.; Tian, W. (Stella) Value co-creation in sustainable tourism: A service-dominant logic approach. Tour. Manag. 2021, 82, 104200. [Google Scholar] [CrossRef]
- UNWTO; UNDP. Tourism and the Sustainable Development Goals–Journey to 2030; World Tourism Organization: Madrid, Spain, 2017. [Google Scholar]
- UNWTO. Measuring Sustainable Tourism: A Call for Action. In Proceedings of the Report of the 6th International Conference on Tourism Statistics, Manila, Philippines, 21–23 June 2017; UNWTO: Madrid, Spain, 2017. ISBN 978-92-844-1895-4. [Google Scholar]
- Crouch, G.I. Destination Competitiveness: An Analysis of Determinant Attributes. J. Travel Res. 2010, 50, 27–45. [Google Scholar] [CrossRef]
- Hong, W.-C. Global competitiveness measurement for the tourism sector. Curr. Issues Tour. 2009, 12, 105–132. [Google Scholar] [CrossRef]
- Hu, W.; Wall, G. Environmental Management, Environmental Image and the Competitive Tourist Attraction. J. Sustain. Tour. 2005, 13, 617–635. [Google Scholar] [CrossRef]
- Loureiro, S.M.C.; Guerreiro, J.; Han, H. Past, present, and future of pro-environmental behavior in tourism and hospitality: A text-mining approach. J. Sustain. Tour. 2021, 1–21. [Google Scholar] [CrossRef]
- Hashemkhani Zolfani, S.; Sedaghat, M.; Maknoon, R.; Kazimieras Zavadskas, E. Sustainable tourism: A comprehensive literature review on frameworks and applications. Econ. Res. 2015, 28, 1–30. [Google Scholar] [CrossRef]
- Yi, T.; Liang, M. Evolutional Model of Tourism Efficiency Based on the DEA Method: A Case Study of Cities in Guangdong Province, China. Asia Pac. J. Tour. Res. 2015, 20, 789–806. [Google Scholar] [CrossRef]
- Man, D.; Zhang, H. The Study of DEA Application in Tourism City: A Case for Members of the World Tourism City Federation in China. In LISS 2014; Metzler, J.B., Ed.; Springer: Berlin/Heidelberg, Germany, 2015; pp. 831–835. [Google Scholar]
- Croes, R. Measuring and Explaining Competitiveness in the Context of Small Island Destinations. J. Travel Res. 2010, 50, 431–442. [Google Scholar] [CrossRef]
- World Economic Forum. 2019. Available online: https://www.weforum.org/reports/the-travel-tourism-competitiveness-report-2019 (accessed on 25 March 2021).
- Robecosam. Available online: https://www.robecosam.com/en/sustainability-insights/about-sustainability/country-sustainability-ranking/ (accessed on 25 March 2011).
- Mendola, D.; Volo, S. Building composite indicators in tourism studies: Measurements and applications in tourism destination competitiveness. Tour. Manag. 2017, 59, 541–553. [Google Scholar] [CrossRef]
- Higgins-Desbiolles, F.; Moskwa, E.; Wijesinghe, G. How sustainable is sustainable hospitality research? A review of sustainable restaurant literature from 1991 to 2015. Curr. Issues Tour. 2019, 22, 1551–1580. [Google Scholar] [CrossRef]
- Zhang, S.; Chan, E.S. A modernism-based interpretation of sustainable tourism. Int. J. Tour. Res. 2020, 22, 223–237. [Google Scholar] [CrossRef]
- Falatoonitoosi, E.; Schaffer, V.; Kerr, D. Does Sustainable Tourism Development Enhance Destination Prosperity? J. Hosp. Tour. Res. 2021. [Google Scholar] [CrossRef]
- Butler, R.W. Tourism-an evolutionary perspective. In Tourism and Sustainable Development: Monitoring, Planning, Managing; Nelson, J.G., Butler, R., Wall, G., Eds.; Heritage Resources Centre, University of Waterloo: Waterloo, ON, USA, 1999; pp. 26–43. [Google Scholar]
- McCool, S.F.; Moisey, R.N.; Nickerson, N.P. What should tourism sustain? The disconnect with in-dustry perceptions of useful indicators. J. Travel Res. 2001, 40, 124–131. [Google Scholar] [CrossRef]
- Castellani, V.; Sala, S. Sustainable performance index for tourism policy development. Tour. Manag. 2010, 31, 871–880. [Google Scholar] [CrossRef]
- Gahin, R.; Veleva, V.; Hart, M. Do Indicators Help Create Sustainable Communities? Local Environ. 2003, 8, 661–666. [Google Scholar] [CrossRef]
- Zhou, H.; Yang, Y.; Chen, Y.; Zhu, J. Data envelopment analysis application in sustainability: The origins, development and future directions. Eur. J. Oper. Res. 2018, 264, 1–16. [Google Scholar] [CrossRef]
- Vachon, S.; Mao, Z. Linking supply chain strength to sustainable development: A country-level analysis. J. Clean. Prod. 2008, 16, 1552–1560. [Google Scholar] [CrossRef]
- Škrinjarić, T. Empirical assessment of the circular economy of selected European countries. J. Clean. Prod. 2020, 255, 120246. [Google Scholar] [CrossRef]
- Sardi, A.; Sorano, E. Dynamic Performance Management: An Approach for Managing the Common Goods. Sustainability 2019, 11, 6435. [Google Scholar] [CrossRef]
- Stoeckl, N.; Walker, D.; Mayocchi, C.; Roberts, B. Douglas Shire Sustainable Futures: Strategic Planning for Implementation Project Report; CSIRO Sustainable Ecosystems: Canberra, Australia, 2004. [Google Scholar]
- Bell, S.; Morse, S. Measuring Sustainability: Learning from Doing; Earthscan Publications: London, UK, 2003. [Google Scholar]
- Navarro, J.-L.A.; Martínez, M.-E.A.; Jiménez, J.-A.M. An approach to measuring sustainable tourism at the local level in Europe. Curr. Issues Tour. 2019, 23, 423–437. [Google Scholar] [CrossRef]
- Eber, S. Beyond the Green Horizon: A Discussion Paper on Principles for Sustainable Tourism; Worldwide Fund for Nature: Godalming, UK, 1992. [Google Scholar]
- World Tourism Organization. Sustainable Tourism Development: Guide for Local Planners; WTO: Madrid, Spain, 1993. [Google Scholar]
- Payne, R. Sustainable tourism: Suggested indicators and monitoring techniques. In Tourism and Sustainable Development: Monitoring, Planning, Managing; Nelson, J.G., Butler, R.W., Wall, G., Eds.; Department of Geography Publication 37, University of Waterloo: Waterloo, ON, Canada, 1993; pp. 249–254. [Google Scholar]
- Butler, R.W. Sustainable tourism: A state-of-the-art review. Tour. Sustain. Dev. Goals 2020, 1, 11–29. [Google Scholar] [CrossRef]
- UNWTO. Statistical Framework for Measuring the Sustainability of Tourism, Consultation Draft. 2018. Available online: https://webunwto.s3.eu-west-1.amazonaws.com/s3fs-public/2020-09/wge_mst_2nd_item_2.1_doc_0.pdf (accessed on 25 March 2021).
- Kayar, Ç.H.; Kozak, M.A. Measuring Destination Competitiveness: An Application of the Travel and Tourism Competitiveness Index (2007). J. Hosp. Mark. Manag. 2010, 19, 203–216. [Google Scholar] [CrossRef]
- Leung, X.Y. Baloğlu, Şeyhmus Tourism Competitiveness of Asia Pacific Destinations. Tour. Anal. 2013, 18, 371–384. [Google Scholar] [CrossRef]
- Pulido-Fernández, J.I.; Rodríguez-Díaz, B. Reinterpreting the World Economic Forum’s global tourism competitiveness index. Tour. Manag. Perspect. 2016, 20, 131–140. [Google Scholar] [CrossRef]
- Gómez-Vega, M.; Picazo-Tadeo, A.J. Ranking world tourist destinations with a composite indicator of competitiveness: To weigh or not to weigh? Tour. Manag. 2019, 72, 281–291. [Google Scholar] [CrossRef]
- Rodríguez-Díaz, B.; Pulido-Fernández, J.I. Sustainability as a Key Factor in Tourism Competitiveness: A Global Analysis. Sustainability 2020, 12, 51. [Google Scholar] [CrossRef]
- Tanguay, G.A.; Rajaonson, J.; Therrien, M.-C. Sustainable tourism indicators: Selection criteria for policy implementation and scientific recognition. J. Sust. Tour. 2013, 21, 862–879. [Google Scholar] [CrossRef]
- Lozano-Oyola, M.; Blancas, F.J.; González, M.; Caballero, R. Sustainable tourism indicators as planning tools in cultural destinations. Ecol. Indic. 2012, 18, 659–675. [Google Scholar] [CrossRef]
- Vuta, M.; Vuta, M.; Enciu, A.; Cioaca, S.-I. Assessment of the Circular Economy’s Impact in the EU Economic Growth. Amfiteatru Econ. 2018, 20, 248–261. [Google Scholar] [CrossRef]
- Gunter, U.; Ceddia, M.G.; Tröster, B. International ecotourism and economic development in Central America and the Caribbean. J. Sustain. Tour. 2017, 25, 43–60. [Google Scholar] [CrossRef]
- Armeanu, D.Ş.; Vintilă, G.; Gherghina, Ş.C. Empirical Study towards the Drivers of Sustainable Economic Growth in EU-28 Countries. Sustainability 2017, 10, 4. [Google Scholar] [CrossRef]
- Fotis, P.N.; Pekka, V. The effect of renewable energy use and economic growth on pollution in the EUROZONE. Econ. Bus. Lett. 2017, 6, 88–99. [Google Scholar] [CrossRef]
- Liu, G.; Baniyounes, A.M.; Rasul, M.; Amanullah, M.; Khan, M. General sustainability indicator of renewable energy system based on grey relational analysis. Int. J. Energy Res. 2013, 37, 1928–1936. [Google Scholar] [CrossRef]
- Wu, L.; Liu, S.; Yao, L.; Yan, S. Grey convex relational degree and its application to evaluate regional economic sustainability. Sci. Iran. 2012, 20, 44–49. [Google Scholar] [CrossRef]
- Zhou, P.; Ang, B.; Poh, K. A mathematical programming approach to constructing composite indicators. Ecol. Econ. 2007, 62, 291–297. [Google Scholar] [CrossRef]
- Halkos, G.; Tzeremes, N. An Additive Two-Stage DEA Approach Creating Sustainability Efficiency Indexes. MPRA Working Paper. MPRA Paper No. 44231, 2013. Available online: https://ideas.repec.org/p/pra/mprapa/44231.html (accessed on 25 March 2021).
- Bruni, M.E.; Guerriero, F.; Patitucci, V. Benchmarking Sustainable Development via Data Envel-opment Analysis: An Italian case study. Int. J. Environ. Res. 2011, 5, 47–56. [Google Scholar] [CrossRef]
- Aguado, R.; Martinez, J. GDP and beyond: Towards new measures of sustainability based on Catholic social thought. Asia-Pac. J. Bus. Adm. 2012, 4, 124–138. [Google Scholar] [CrossRef]
- Sueyoshi, T.; Yuan, Y. Social sustainability measured by intermediate approach for DEA environmental assessment: Chinese regional planning for economic development and pollution prevention. Energy Econ. 2017, 66, 154–166. [Google Scholar] [CrossRef]
- Tsai, W.-H.; Lee, H.-L.; Yang, C.-H.; Huang, C.-C. Input-Output Analysis for Sustainability by Using DEA Method: A Comparison Study between European and Asian Countries. Sustainability 2016, 8, 1230. [Google Scholar] [CrossRef]
- Škrinjarić, T. Evaluating the sustainable development and circular economy goals of selected European countries. In Proceedings of the International Conference on the Economics of Decoupling (ICED), Zagreb, Croatia, 30 November–1 December 2020; Družić, G., Gelo, T., Eds.; Croatian Academy of Sciences and Arts and Faculty of Economics and Business-Zagreb: Zagreb, Croatia, 2020; pp. 323–341. [Google Scholar]
- Škrinjarić, T.; Vlah Jerić, S. Comparing the sustainable tourism of selected European countries. In Proceedings of the 2nd International Conference on the Economics of Decoupling (ICED), Zagreb, Croatia, 30 November–1 December 2021; Družić, G., Sekur, T., Eds.; Croatian Academy of Sciences and Arts and Faculty of Economics and Business University of Zagreb: Zagreb, Croatia, 2021; pp. 39–44. [Google Scholar]
- Bosetti, V.; Cassinelli, M.; Lanza, A. Using Data Envelopment Analysis to Evaluate Environmentally Con-Scious Tourism Management. Paper Prepared for the Conference Tourism and Sustainable Development, Domus de Maria, Italy; 2003. Available online: http://citeseerx.ist.psu.edu/viewdoc/download?doi=10.1.1.563.4347andrep=rep1andtype=pdf (accessed on 25 March 2021).
- Bosetti, V.; Cassinelli, M.; Lanza, A. Using Data Envelopment Analysis to Evaluate Environmentally Con-Scious Tourism Management. Paper Presented at the Conference Tourism and Sustainable Development, Domus de Maria, Italy; 2004. Available online: http://ssrn.com/abstract=541124 (accessed on 25 March 2021).
- Bosetti, V.; Cassinelli, M.; Lanza, A. Benchmarking in Tourism Destination, Keeping in Mind the Sus-tainable Paradigm. NRB–Natural Resources Management Working Paper, 2006. Available online: https://ageconsearch.umn.edu/bitstream/12156/1/wp060012.pdf (accessed on 25 March 2021).
- Yu, T.; Wu, C. A Grey Relational Analysis of the Influence Factors of Tourism Industry in Guangdong Province. In Proceedings of the 2016 2nd International Conference on Humanities and Social Science Research (ICHSSR 2016), Singapore, 29–31 July 2016; pp. 0135–0139. [Google Scholar]
- Su, J.; Huang, J. Analysis on the tourism resource evaluation factors based on grey relational analysis—Taking Guizhou minority areas as an example. J. Comput. Methods Sci. Eng. 2019, 19, 1093–1099. [Google Scholar] [CrossRef]
- Lei, Z.; Qingming, D. Research on tourism development of Xinjiang based on grey relational analysis and gravity model. In Proceedings of the 2013 IEEE International Conference on Grey systems and Intelligent Services (GSIS), Macao, China, 15–17 November 2013; pp. 62–66. [Google Scholar]
- Huang, Y.-L.; Lin, C.-T. Constructing grey relation analysis model evaluation of tourism competitiveness. J. Inf. Optim. Sci. 2009, 30, 1129–1138. [Google Scholar] [CrossRef]
- Liu, S.; Yang, Y.; Forrest, J. Grey Data Analysis: Methods, Models and Applications; Springer Science and Business Media: Singapore, 2016. [Google Scholar]
- Liu, S.; Lin, Y. Grey Information: Theory and Practical Applications; Springer: New York, NY, USA, 2006. [Google Scholar]
- Liu, S.; Lin, Y. Grey Systems, Theory and Applications; Springer: Berlin/Heidelberg, Germany, 2010. [Google Scholar]
- Kuo, Y.; Yang, T.; Huang, G.-W. The use of a grey-based Taguchi method for optimizing multi-response simulation problems. Eng. Optim. 2008, 40, 517–528. [Google Scholar] [CrossRef]
- Lahdelma, R.; Salminen, P.; Hokkanen, J. Using Multicriteria Methods in Environmental Planning and Management. Environ. Manag. 2000, 26, 595–605. [Google Scholar] [CrossRef] [PubMed]
- Bigaret, S.; Hodgett, R.E.; Meyer, P.; Mironova, T.; Olteanu, A.-L. Supporting the multi-criteria decision aiding process: R and the MCDA package. EURO J. Decis. Process. 2017, 5, 169–194. [Google Scholar] [CrossRef]
- Belton, V.; Stewart, T.J. Multiple Criteria Decision Analysis. In International Series in Operations Research & Management Science; Springer: New York, NY, USA, 2002. [Google Scholar]
- Brauers, W.K.M.; Zavadskas, E.K. Project Management by Multimoora as an Instrument for Transition Economies/Projektų Vadyba su Multimoora Kaip Priemonė Pereinamojo Laikotarpio Ūkiams. Technol. Econ. Dev. Econ. 2010, 16, 5–24. [Google Scholar] [CrossRef]
- Miller, D.W.; Starr, M.K. Executive Decisions and Operations Research, 2nd ed.; Prentice-Hall Inc.: Englewood Cliffs, NJ, USA, 1969. [Google Scholar]
- Škrinjarić, T. R&D in Europe: Sector Decomposition of Sources of (in)Efficiency. Sustainability 2020, 12, 1432. [Google Scholar] [CrossRef]
- Sun, C.X.; Li, J.; Zheng, H.P. A new method of faulty insulation diagnosis in power transformer based on degree of area incidence analysis. Power System Technol. 2002, 26, 24–29. [Google Scholar]
- Khuman, A.S.; Yang, Y.; John, R. A commentary on some of the intrinsic differences between grey systems and fuzzy systems. In Proceedings of the 2014 IEEE International Conference on Systems, Man, and Cybernetics (SMC), San Diego, CA, USA, 5–8 October 2014; pp. 2032–2037. [Google Scholar]
- Weber, F.; Stettler, J.; Priskin, J.; Rosenberg-Taufer, B.; Ponnapureddy, S.; Fux, S.; Camp, M.-A.; Barth, M. Tourism Destinations Under Pressure. Challenges And Innovative Solutions; Institute of Tourism, Lucerne University of Applied Sciences and Arts: Luzern, Switzerland, 2017. [Google Scholar] [CrossRef]
- Gross, S.; Klemmer, L.; Stettler, J.; Priskin, J.; Rosenberg-Taufer, B.; Ponnapureddy, S.; Fux, S.; Camp, M.-A.; Barth, M.; Weber, F. Tourism Destinations Under Pressure. In Challenges and Innovative Solutions; Lucerne University of Applied Sciences and Arts Institute of Tourism ITW: Lucerne, Switzerland, 2017. [Google Scholar] [CrossRef]
- Škrinjarić, T. Evaluation of environmentally conscious tourism industry: Case of Croatian counties. Tourism 2018, 66, 254–268. [Google Scholar]
- Koens, K.; Postma, A. Understanding and Managing Visitor Pressure in Urban Tourism. In A Study into the Nature and Methods Used to Manage Visitor Pressure in Six Major European Cities; CELTH: Leeuwarden/Breda/Vlissing, The Netherlands, 2016. [Google Scholar]
- Postma, A.; Schmuecker, D. Understanding and overcoming negative impacts of tourism in city destinations: Conceptual model and strategic framework. J. Tour. Futur. 2017, 3, 144–156. [Google Scholar] [CrossRef]
- Ezeah, C.; Fazakerley, J.; Byrne, T. Tourism Waste Management in the European Union: Lessons Learned from Four Popular EU Tourist Destinations. Am. J. Clim. Chang. 2015, 4, 431–445. [Google Scholar] [CrossRef]
- Arbulú, I.; Lozano, J.; Rey-Maquieira, J. Tourism and solid waste generation in Europe: A panel data assessment of the Environmental Kuznets Curve. Waste Manag. 2015, 46, 628–636. [Google Scholar] [CrossRef]
- Dileep, M.R. Tourism and Waste Management: A Review of Implementation of “Zero Waste” at Kovalam. Asia Pac. J. Tour. Res. 2007, 12, 377–392. [Google Scholar] [CrossRef]
- UNWTO. Measuring the Sustainability of Tourism; UNWTO: Madrid, Spain, 2017; Available online: https://www.unwto.org/standards/working-group-of-experts-on-mst (accessed on 25 March 2021).
- Rodriguez, J.; Martinez Codina, A.; Niavis, S.; Papatheochari, T. Measuring Tourism Sustainability in the MED Area Sustainable Tourism Community’s 2nd thematic Paper. Deliverable n° 3.02.08. Available online: https://sustainable-tourism.interreg-med.eu/me/special-pages/rss-feed/news/page/22/actualites/measuring-tourism-sustainability-in-the-med-area/ (accessed on 25 March 2021).
- OECD. Environmental Performance Reviews; OECD Publishing: Paris, France, 2016. [Google Scholar]
- Eurostat. 2020. Available online: https://ec.europa.eu/eurostat/data/database (accessed on 25 March 2021).
- Cracolici, M.F.; Nijkamp, P.; Rietveld, P. Assessment of Tourist Competitiveness by Analysing Destination Efficiency; TI 2006-097/2.7; Tinbergen Institute Discussion Paper; Tinbergen Institute: Amsterdam, The Netherlands, 2006. [Google Scholar]
- Rabar, D.; Blažević, S. Ocjenjivanje efi kasnosti hrvatskih županija u turizmu primjenom analize omeđivanja podataka [Efficiency Assessment of Croatian Counties in Tourism Using Data Envelopment Anal-ysis]. Privred. kretanja Ekon. Polit. 2011, 21, 25–56. [Google Scholar]
- Barros, C.P.; Botti, L.; Peypoch, N.; Robinot, E.; Solonandrasana, B. Performance of French destinations: Tourism attraction perspectives. Tour. Manag. 2011, 32, 141–146. [Google Scholar] [CrossRef]
- Croitoru, M. Tourism Competitiveness Index–An Empirical Analysis Romania vs. Bulgaria. Theor. Appl. Econ. 2011, 18, 155–172. [Google Scholar]
- Cugno, M.; Grimmer, M.; Viassone, M. Measuring Local Tourism Attractiveness: The Case of Italy, ANZAM (Australian and New Zealand Academy of Management) Working Paper, 2012. Available online: http://www.anzam.org/wp-content/uploads/pdf-manager/315_ANZAM-2012-253.PDF (accessed on 25 March 2021).
- Pan, S.-Y.; Gao, M.; Kim, H.; Shah, K.; Pei, S.-L.; Chiang, P.-C. Advances and challenges in sustainable tourism toward a green economy. Sci. Total. Environ. 2018, 635, 452–469. [Google Scholar] [CrossRef] [PubMed]
- Dong, S.; Li, Y.; Li, Z.; Li, F.; Cheng, H.; Yang, Y.; Bilgaev, A.; Zheng, J.; Bazarzhapov, T. Ecological environment risks and green development modes of China-Mongolia-Russia economic corridor. In Proceedings of the IOP Conference Series: Earth and Environmental Science, Irkutsk, Russia, 20–26 August 2018; IOP Publishing: Bristol, UK, 2018; Volume 190, pp. 12–53. [Google Scholar]
- Petit-Boix, A.; Devkota, J.; Phillips, R.; Vargas-Parra, M.V.; Josa, A.; Gabarrell, X.; Rieradevall, J.; Apul, D. Life cycle and hydrologic modeling of rainwater harvesting in urban neighborhoods: Implications of urban form and water demand patterns in the US and Spain. Sci. Total. Environ. 2018, 621, 434–443. [Google Scholar] [CrossRef]
- Margeta, J. A review of sustainable septage management strategies on the islands in Croatia. Water Sci. Technol. 2019, 79, 1833–1843. [Google Scholar] [CrossRef] [PubMed]
- OECD. OECD Environmental Performance Reviews; OECD Publishing—Sweden, 2014; Available online: https://www.oecd.org/environment/country-reviews/oecd-environmental-performance-reviews-sweden-2014-9789264213715-en.htm (accessed on 1 May 2021).
- Falcone, P.M. Tourism-Based Circular Economy in Salento (South Italy): A SWOT-ANP Analysis. Soc. Sci. 2019, 8, 216. [Google Scholar] [CrossRef]
- Wu, W. Modern Urban Planning and Design Based on Low Carbon Economy Concept. Open House Int. 2019, 44, 108–111. [Google Scholar] [CrossRef]
- Solability. The Global Sustainable Competitiveness Index Data. Available online: http://solability.com/the-global-sustainable-competitiveness-index/green-competitiveness (accessed on 25 March 2021).
- OECD. OECD Environmental Performance Reviews 2019; OECD Publishing—Latvia, 2019; Available online: https://www.oecd.org/environment/country-reviews/oecd-environmental-performance-reviews-latvia-2019.htm (accessed on 1 May 2021).
- European Commission EASME Finland Overview. 2020. Available online: https://ec.europa.eu/easme/sites/easme-site/files/life_co_finland_en_jan20.pdf (accessed on 25 March 2021).
- Laursen, F.; Andersen, T.M.; Jahn, D. Denmark Report–Sustainable Governance Indicators 2020; Bertelsmann Stifung: Gütersloh, Germany, 2020. [Google Scholar]
- OECD. An OECD Review of Statistical Initiatives Measuring Tourism at Subnational Level. OECD Tourism Papers; 2016; Available online: https://www.oecd-ilibrary.org/industry-and-services/an-oecd-review-of-statistical-initiatives-measuring-tourism-at-subnational-level_5jln3b32hq7h-en (accessed on 25 March 2021). [CrossRef]
- Christophoru, C.; Axt, H.-J.; Karadag, R. Cyprus Report Sustainable Governance Indicators 2020; Bertelsmann Stifung: Gütersloh, Germany, 2020. [Google Scholar]
- Sotiropolous, D.A.; Huliaras, A.; Karadag, R. Greece Report Sustainable Governance Indicators 2020; Bertelsmann Stifung: Gütersloh, Germany, 2020. [Google Scholar]
- Castanheira, M.; Rihoux, B.; Bandelow, N.C. Belgium Report Sustainable Governance Indicators 2020; Bertelsmann Stifung: Gütersloh, Germany, 2020. [Google Scholar]
- Hoppe, R.; Jeliazkova, M.I.; Krouwel, A.; Bandelow, N.C. Netherlands Report Sustainable Governance Indicators 2020; Bertelsmann Stifung: Gütersloh, Germany, 2020. [Google Scholar]
- Jalali, C.; Bruneau, T.C.; Colino, C. Portugal Report Sustainable Governance Indicators 2020; Ber-telsmann Stifung: Gütersloh, Germany, 2020. [Google Scholar]
- Ma, X.; Li, S.; Ai, Q.; Chen, K. Research on renewable energy systems used in tourism circular economy. In Proceedings of the 2016 Chinese Control and Decision Conference (CCDC), Yunchuan, China, 28–30 May 2016; pp. 6203–6206. [Google Scholar]
- Patti, S. Circular economy and sharing consumption: Attitudes towards low-carbon tourism. Econ. Policy Energy Environ. 2017, 16, 219–234. [Google Scholar] [CrossRef]
- Fuldauer, L.I.; Ives, M.C.; Adshead, D.; Thacker, S.; Hall, J.W. Participatory planning of the future of waste management in small island developing states to deliver on the Sustainable Development Goals. J. Clean. Prod. 2019, 223, 147–162. [Google Scholar] [CrossRef]
- Wondirad, A.; Tolkach, D.; King, B. Stakeholder collaboration as a major factor for sustainable ecotourism development in developing countries. Tour. Manag. 2020, 78, 104024. [Google Scholar] [CrossRef]
- Asmelash, A.G.; Kumar, S. Assessing progress of tourism sustainability: Developing and validating sustainability indicators. Tour. Manag. 2019, 71, 67–83. [Google Scholar] [CrossRef]
- Smol, M.; Avdiushchenko, A.; Kulczycka, J.; Nowaczek, A. Public awareness of circular economy in southern Poland: Case of the Malopolska region. J. Clean. Prod. 2018, 197, 1035–1045. [Google Scholar] [CrossRef]
- Kirchherr, J.; Piscicelli, L.; Bour, R.; Kostense-Smit, E.; Muller, J.; Huibrechtse-Truijens, A.; Hekkert, M. Barriers to the Circular Economy: Evidence From the European Union (EU). Ecol. Econ. 2018, 150, 264–272. [Google Scholar] [CrossRef]
- Liakos, N.; Kumar, V.; Pongsakornrungsilp, S.; Garza-Reyes, J.A.; Gupta, B.; Pongsakornrungsilp, P. Understanding circular economy awareness and practices in manufacturing firms. J. Enterp. Inf. Manag. 2019, 32, 563–584. [Google Scholar] [CrossRef]
- Sharpe, A. Literature Review of Frameworks for Macroindicators; Centre for the Study of Living Standards: Ottawa, ON, Canada, 2004; Available online: http://www.csls.ca/reports/LitRevMacro-indicators.pdf (accessed on 1 May 2021).
- Torres-Delgado, A.; Palomeque, F.L. Measuring sustainable tourism at the municipal level. Ann. Tour. Res. 2014, 49, 122–137. [Google Scholar] [CrossRef]
Publisher’s Note: MDPI stays neutral with regard to jurisdictional claims in published maps and institutional affiliations. |
© 2021 by the author. Licensee MDPI, Basel, Switzerland. This article is an open access article distributed under the terms and conditions of the Creative Commons Attribution (CC BY) license (https://creativecommons.org/licenses/by/4.0/).