Article

Comparing Passenger Satisfaction, Employees’ Perspective and Performance on Quality and Safety Indicators: A Field Study

by
Luca D’Alonzo
1,*,
Maria Chiara Leva
2 and
Edgardo Bucciarelli
1
1
Department of PPEQ Sciences, Section of Economics and Quantitative Methods, University of Chieti–Pescara, 65127 Pescara, Italy
2
Environmental Sustainability and Health Institute, Technological University Dublin, D07 EWV4 Dublin, Ireland
*
Author to whom correspondence should be addressed.
Sustainability 2021, 13(10), 5636; https://doi.org/10.3390/su13105636
Submission received: 24 March 2021 / Revised: 11 May 2021 / Accepted: 12 May 2021 / Published: 18 May 2021
(This article belongs to the Special Issue Mobility for Sustainable Societies: Challenges and Opportunities)

Abstract

:
This paper aims to analyze the impact that different attributes related to a Regional Airport service and the socio-economic factors of the passengers have on the passenger’s overall satisfaction. The study also compared passenger and employee satisfaction in relation to the service offered by the airport, to identify possible critical areas of improvement. An Ordinal Logistic Regression (OLR) approach was used to model how the attributes considered for qualifying airport services and the socio-economic variables impact the predicted variable (i.e., passenger satisfaction). Furthermore, the results were triangulated to include quality and safety performance indicators as an objective anchor point for the performance of the company. The findings indicate interesting areas of difference between the perceptions of the passengers and airport employees regarding a company’s services and its performance. The company managers in the key areas of operation were then asked to select the main areas of improvement among the ones highlighted by the survey’s results. Quality and safety indicators were also helpful in enriching the analysis and indicating good synergy with the suggestions collected from the passengers’ and the employees’ surveys, offering yet another complementary perspective.

1. Introduction

Service quality and traveler satisfaction are subjects of high interest within the airport industry [1]. Being the result of a cognitive process, perceived service quality is both subjective and context-dependent [2], and passengers’ expectations of the services supplied by the airport may also be influenced by socio-economic factors such as gender, age, purpose of travel and annual flight frequency [3]. Although the analysis of passenger satisfaction is crucial to improve the quality of airport services, it is also essential to consider the employees’ perspective. Indeed, the business motivation of the employee plays a very important role in meeting the passenger’s needs [4]. The measurement of the quality of the airport service represents a significant performance indicator for airport operations and management [5]. Indeed, without knowing the current performance on quality and safety indicators, it is difficult to identify which aspects could be improved [6]; the commercialization of the airport industry led airlines towards performance management systems that must take into account other important aspects of airport operation, such as service delays, safety and social responsibility [7].
Furthermore, another element that should not be underestimated is the likelihood of accidental events occurring, which is a required metric in any safety management system. Human error appears as a contributing factor in 70% to 80% of all aviation accidents, and, because errors can never be eliminated completely, a culture of open reporting can foster a better understanding of the nature of the possible errors, and the required improvement strategies [8].
Only a few authors have investigated the service quality of airports by jointly considering the points of view of travelers and airport employees [9,10,11], and fewer still have triangulated them with performance indicators [12]. Indeed, many researchers explore service quality and passenger satisfaction, but few studies identified middle management choices for improvement priorities in existing airports [13]. A similar study was conducted by Leva et al. [14], providing a systematic framework for performance management with an in-depth study on safety in day-to-day operations, analyzing the day-to-day performance of the key areas of an Italian regional airport having international reach. Other authors, such as Hong et al. [15], investigated the attributes that influence passenger and employee satisfaction, while Shahzad [4] studied the impact of employee motivation on passenger satisfaction in the airline industry of Pakistan. Bezerra and Gomes [1] analyzed airport service quality attributes and socio-economic factors, examining the effects of those considerations on overall passenger satisfaction using ordinal logistic regression. Logistic regression analysis and the ordinal logit model enable the study of how certain factors affect overall subject satisfaction, not only in the air transport sector but also in different contexts [16]. Indeed, Lu [17] estimated an ordinal logit model in his study on housing satisfaction, while Lawson and Montgomery [18] analyzed customer satisfaction using ordinal logistic regression models.
In this context, the aim of this paper is twofold. Firstly, to analyze the key drivers of overall passenger satisfaction in the airport, based on the 2020 Airport Service Charter data [19], and to compare these results with employee satisfaction in relation to the quality of the service offered. Secondly, to compare the service areas identified as having an impact on customers and employee satisfaction with the company performance indicators for the same level of service. This should allow the pinpointing of more comprehensively critical aspects to be improved, considering all perspectives. Additionally, the field study is accompanied by a simple survey, based on the literature [20], to elicit from the company middle managers’ perspective which areas of improvement are actually critical among the possible alternatives resulting from the employees’ survey. The paper is structured as follows. After the introduction, in Section 2 we give a review of the literature relating to the methodological approach and the experimental design considered for the field study. Section 3 presents the profiles of the respondents, the descriptive statistics on safety and quality indicators, and the results of the analysis of passenger satisfaction alongside the employees’ perspective. Lastly, we present the survey carried out with company managers. Section 4 concludes by providing some discussion on the results obtained and possible further work.

2. Materials and Methods

The models for examining traveler satisfaction and measuring airport service quality can be used in order to relate the service quality attribute to the overall satisfaction [21]; the various service aspects considered in this context can be expressed by qualitative variables on Likert ordinal scales, characterized by ordered categorical responses, like the judgments for the evaluation of a service: very bad, insufficient, discrete, good and excellent [21]. Logistic regression models are more commonly used in the literature to analyze passenger satisfaction and subjective qualitative measures, expressing the dependent variable as the passenger’s overall satisfaction, the predictors as the attributes related to the service quality and computing the weights of every attribute on the passenger’s overall satisfaction [21]. In this work, we used an extension of the technique referred to as ordinal logistic regression (OLR), modeled by the stepwise selection method, developed for ordinal response variables. A stepwise method is essential for this analysis because it finds the best combination of a set of attributes by automatically selecting the regressor to be added to, or removed from, the model and stopping when the variable has a significance level for entry (SLE) into the model >0.05, and the variable for removal has a significance level for staying (SLS) in the model <0.05 [22]. In this context, Eboli and Mazzulla [21] used an ordinal logistic regression (OLR) model to analyze the satisfaction of the passengers of the Lamezia Terme airport, and to identify the service aspects needing to be improved. This study was considered useful since the airport is comparable to the regional airport considered for the present study. In the OLR model, if the ordinal response variable assumes J as distinct values, the relationship with the Xk regressors can be expressed through the following formula:
log[ρ(Y ≤ j|X)/ρ(Y > j|X)] = αj − ∑Kk=1βkXk = α + Xβ,
for j varying between 1 and J-1, where αj are the intercepts indicating the probability that the Y variable assumes low values rather than high values in case of the nullity of all the predictors, and βk represents the log (ODDS) change corresponding to a unitary increase of the Xk variables; positive values of the βk coefficients correspond to higher probabilities that the response variable assumes high values, and vice versa [21].
The field study was conducted from January to October 2020, and the experimental context relates to the services offered by the terminal of an Italian regional airport with international reach. Passengers were recruited by answering questions on socio-economic characteristics, after introducing them to the scope of the study and informing them that it would be conducted for research purposes and the collection of experimental data would remain completely confidential and anonymous. They were asked to express their perception of the quality of the services offered by the airport, based on the 2020 Airport Service Charter quality factors. The first experimental session was replicated by recruiting airport employees, and their views were further elicited to identify the critical aspects to be improved. The interviewed subjects expressed a judgment to each factor according to an ordinal verbal scale varying on five levels, which are “Very bad/Severely Insufficient”, “Insufficient”, “Discrete”, “Good”, and “Excellent” as required by the ENAC (Italian Civil Aviation Transport) methodology on the standard Airport Service Charter. In addition, a judgment on the overall perception of airport services was asked of the subjects, according to the same verbal scale. The second experimental session was designed as a simple survey, based on the literature [20], to elicit from the company managers in the key areas of operations their preference on the improvement areas, based on the critical aspects highlighted by the employees’ survey results. The interviewed company managers expressed their alternative of choice between the two most critical operational aspects (or other aspects) resulting from the analysis of the employees’ perspective. The areas considered during the field study are reported in Figure 1, and the various sections of the questionnaire are reported in Appendix A (Figure A1, Figure A2, Figure A3, Figure A4, Figure A5, Figure A6, Figure A7, Figure A8, Figure A9, Figure A10 and Figure A11). Based on the findings obtained from the study of Eboli and Mazzulla [21], we decided to test the hypothesis of what variables are to be considered significant or not, in relation to overall passenger satisfaction. We used a modified version of the customer satisfaction survey for the employee to enable a comparison of the two perspectives; we have also considered extra sections for the employees’ survey on operational areas such as the corporate mission and its communication, organizational structure, employee participation, and safety performance.

3. Results

3.1. The Passenger and Employee Profiles and Descriptive Statistics on Safety and Quality Indicators

Of the 378 passengers recruited, descriptive statistics revealed a relative balance between male and female travelers: 57% versus 43%, respectively. The age distribution of travelers appeared to be heterogeneous: 33% of them were concentrated in the third age class (35–44 years old), 22% of them belonged to the fourth age class (45–54 years old), 19% of them were 25–34 years old, 14% of them were concentrated in the fifth age class (>54 years old) and 12% of them belonged to the first age class (<25 years old). However, the distributions of the annual flight frequency and the purpose of the trip appeared to be homogeneous: 67% of passengers listed “leisure” as their trip purpose and 33% of them answered “business” as their trip purpose, while 56% of them answered “6–10 times a year” as their annual flight frequency, 18% of them were concentrated in the fourth annual flight frequency class (11–15 times a year), 14% of them belonged to the second annual flight frequency class (1–5 times a year) and 12% of them answered “less than once a year” as their annual flight frequency. Of the 26 employees recruited for the survey, 42% of them were male, 4% of them belonged to the second and fifth age class and 46% of them were concentrated in the third and fourth age class, whereas the employees’ average period of service was 16 years. Table 1 shows the percentage frequency of satisfied passengers and employees, grouped by quality factors, compared to the target metrics set by the 2020 Airport Service Charter according to the ENAC (Italian Civil Aviation Transport) indications given by the airport operators. The relative frequency distributions of passengers’ vs. employees’ perceptions, related to the main indicators showing significant differences between the two groups of subjects, are reported in Figure 2, Figure 3, Figure 4, Figure 5, Figure 6, Figure 7, Figure 8, Figure 9, Figure 10, Figure 11, Figure 12, Figure 13, Figure 14, Figure 15, Figure 16 and Figure 17.
Satisfaction indicators were calculated by dividing the total number of satisfied respondents who answered “Discrete”, “Good”, or “Excellent” for the total number of respondents according to the ENAC (Italian Civil Aviation Transport) methodology on standard Airport Service Charter. Passengers’ perceptions elicited were in line with the 2020 target metrics, except for “Toilet tidiness and services” (as the number of available toilets seemed to be quite limited), “Vending machines” (the amount of vending machines also seems to be quite limited, and they need to be replenished more often), “Internal sign-posting” (few signs to direct the flow of people), and “Public information services” (limited availability of information points for passengers, with only the ticket service inside the terminal). On the other perspective, the employees’ perceptions elicited were in line with the 2020 target metrics, except for “Luggage trolley availability” (which is judged to be limited), “Wi-fi connectivity” (wi-fi connectivity inside the terminal for employees appears to be poor), “Recharge points” (recharging points for employees also appear to be scarce), “Internal sign-posting” and “Public information services”. The relative frequency distribution of passengers’ perceptions ranking is comparable with that expressed by the employees in relation to the same service attributes. Figure 2 reports the passengers’ and employees’ perception of the security of airport operations: 77% of employees perceived the level of security within the airport to be “Good” or “Excellent”, while only 47.7% of passengers judged this service to be “Good” or “Excellent”, 44.3% of them rated it as “Discrete” and 8% of them rated it below that level. Figure 3 shows the passengers’ and employees’ perception of the airport service punctuality: 85% of employees perceived the level of airport service punctuality to be “Good” or “Excellent”, while 46% of passengers judged this service to be “Good” or “Excellent”, 45.7% of them rated it as “Discrete” and 8.3% of them rated it below that level. The passengers’ and employees’ perception of the terminal tidiness is shown in Figure 4: 48% of employees perceived the level of terminal tidiness to be “Good” or “Excellent”, while only 37.3% of passengers judged this service to be “Good” or “Excellent”, 51.1% of them rated it as “Discrete” and 11.6% of them rated it below that level. Figure 5 shows the passengers’ and employees’ perception of the availability of luggage trolleys: 45% of employees perceived the availability of luggage trolleys to be “Good” or “Excellent”; while 42.3% of passengers considered this service to be “Good” or “Excellent”, 50% of them rated it as “Discrete” and 7.7% of them rated it below that level. Figure 6 shows the passengers’ and employees’ perception of the air conditioning: 50% of employees perceived the air conditioning available in the airport to be “Good” or “Excellent”, while 47% of passengers judged this service to be “Good” or “Excellent”, 44% of them rated it as “Discrete” and 9% of them rated it below that level. Figure 7 shows the passengers’ and employees’ perception of Wi-fi connectivity inside the terminal: only 30% of employees perceived the level of wi-fi connectivity inside the terminal to be “Good” or “Excellent”, while 36.9% of passengers judged this service to be “Good” or “Excellent”, 50.6% of them rated it as “Discrete” and 12.5% of them rated it below that level. Figure 8 shows the passengers’ and employees’ perception of recharge points for mobile devices: 46% of employees perceived the availability of recharge points for mobile devices in public areas to be “Good” or “Excellent”, while 42.9% of passengers judged this service to be “Good” or “Excellent”, 40.9% of them rated it as “Discrete” and 16.2% of them rated it below that level. Figure 9 reports the passengers’ and employees’ perception of the prices in bars and restaurants: 50% of employees perceived the prices in bars and restaurants to be “Good” or “Excellent”, while 42.6% of passengers judged this service to be “Good” or “Excellent”, 47.2% of them rated it as “Discrete” and 10.2% of them rated it below that level. Figure 10 shows the passengers’ and employees’ perception of the availability of vending machines: 57% of employees perceived the availability of vending machines to be “Good” or “Excellent”, while 27.3% of passengers judged this service to be “Good” or “Excellent”, 45.7% of them rated it as “Discrete” and 27% of them rated it below that level. Figure 11 reports the passengers’ and employees’ perception of the airport website: 65% of employees perceived the airport website to be “Good” or “Excellent”, while 38% of passengers judged this service to be “Good” or “Excellent”, 52.3% of them rated it as “Discrete” and 9.7% of them rated it below that level. Figure 12 shows the passengers’ and employees’ perception of airport information points: 50% of employees perceived the level of airport information points to be “Good” or “Excellent”, while 44% of passengers judged this service to be “Good” or “Excellent”, 47% of them rated it as “Discrete” and 9% of them rated it below that level. Figure 13 reports the passengers’ and employees’ perception of the internal sign-posting: 58% of employees perceived the level of internal sign-posting to be “Good” or “Excellent”; while 39.8% of passengers judged this service to be “Good” or “Excellent”, 47.7% of them rated it as “Discrete” and 12.5% of them rated it below that level. Figure 14 shows the passengers’ and employees’ perception of staff skills: 65% of employees perceived the level of staff skills to be “Good” or “Excellent”, while 55.7% of passengers judged this service to be “Good” or “Excellent”, 34.9% of them rated it as “Discrete” and 9.4% of them rated it below that level. Figure 15 reports the passengers’ and employees’ perception of ticket counter services: over 60% of employees perceived the level of ticket counter services to be “Good” or “Excellent”, while 47.5% of passengers judged this level to be “Good” or “Excellent”, 42.6% of them rated it as “Discrete” and 9.9% of them rated it as “Very bad” or “Insufficient”. Figure 16 shows the passengers’ and employees’ perception of check-in waiting times: over 80% of employees perceived the level of check-in waiting times to be “Good” or “Excellent”, while 44.8% of passengers judged this service to be “Good” or “Excellent”, 45.2% of them rated it as “Discrete” and 10% of them rated it below that level. Figure 17 reports the passengers’ and employees’ perception of the airport surface links: over 50% of employees perceived the level of airport surface links to be “Good” or “Excellent”, while 34.1% of passengers judged this service to be “Good” or “Excellent”, 54% of them rated it as “Discrete” and 11.9% of them rated it below that level.
In summary, looking at Figure 2, Figure 3, Figure 4, Figure 5, Figure 6, Figure 7, Figure 8, Figure 9, Figure 10, Figure 11, Figure 12, Figure 13, Figure 14, Figure 15, Figure 16 and Figure 17, the employees expressed a more positive judgment on the service of the airport than did the passengers, while they seemed to be aligned in their perception of airport terminal tidiness and they also seemed to be more critical in aspects related to “Luggage trolley availability”, wi-fi connectivity inside the terminal and recharge points for mobile devices in public areas. The judgment most frequently expressed by the passengers recruited was “Discrete”, followed by “Good”: therefore, they were considered not to be very satisfied, on the whole, with the services offered by the airport, but not particularly dissatisfied either.
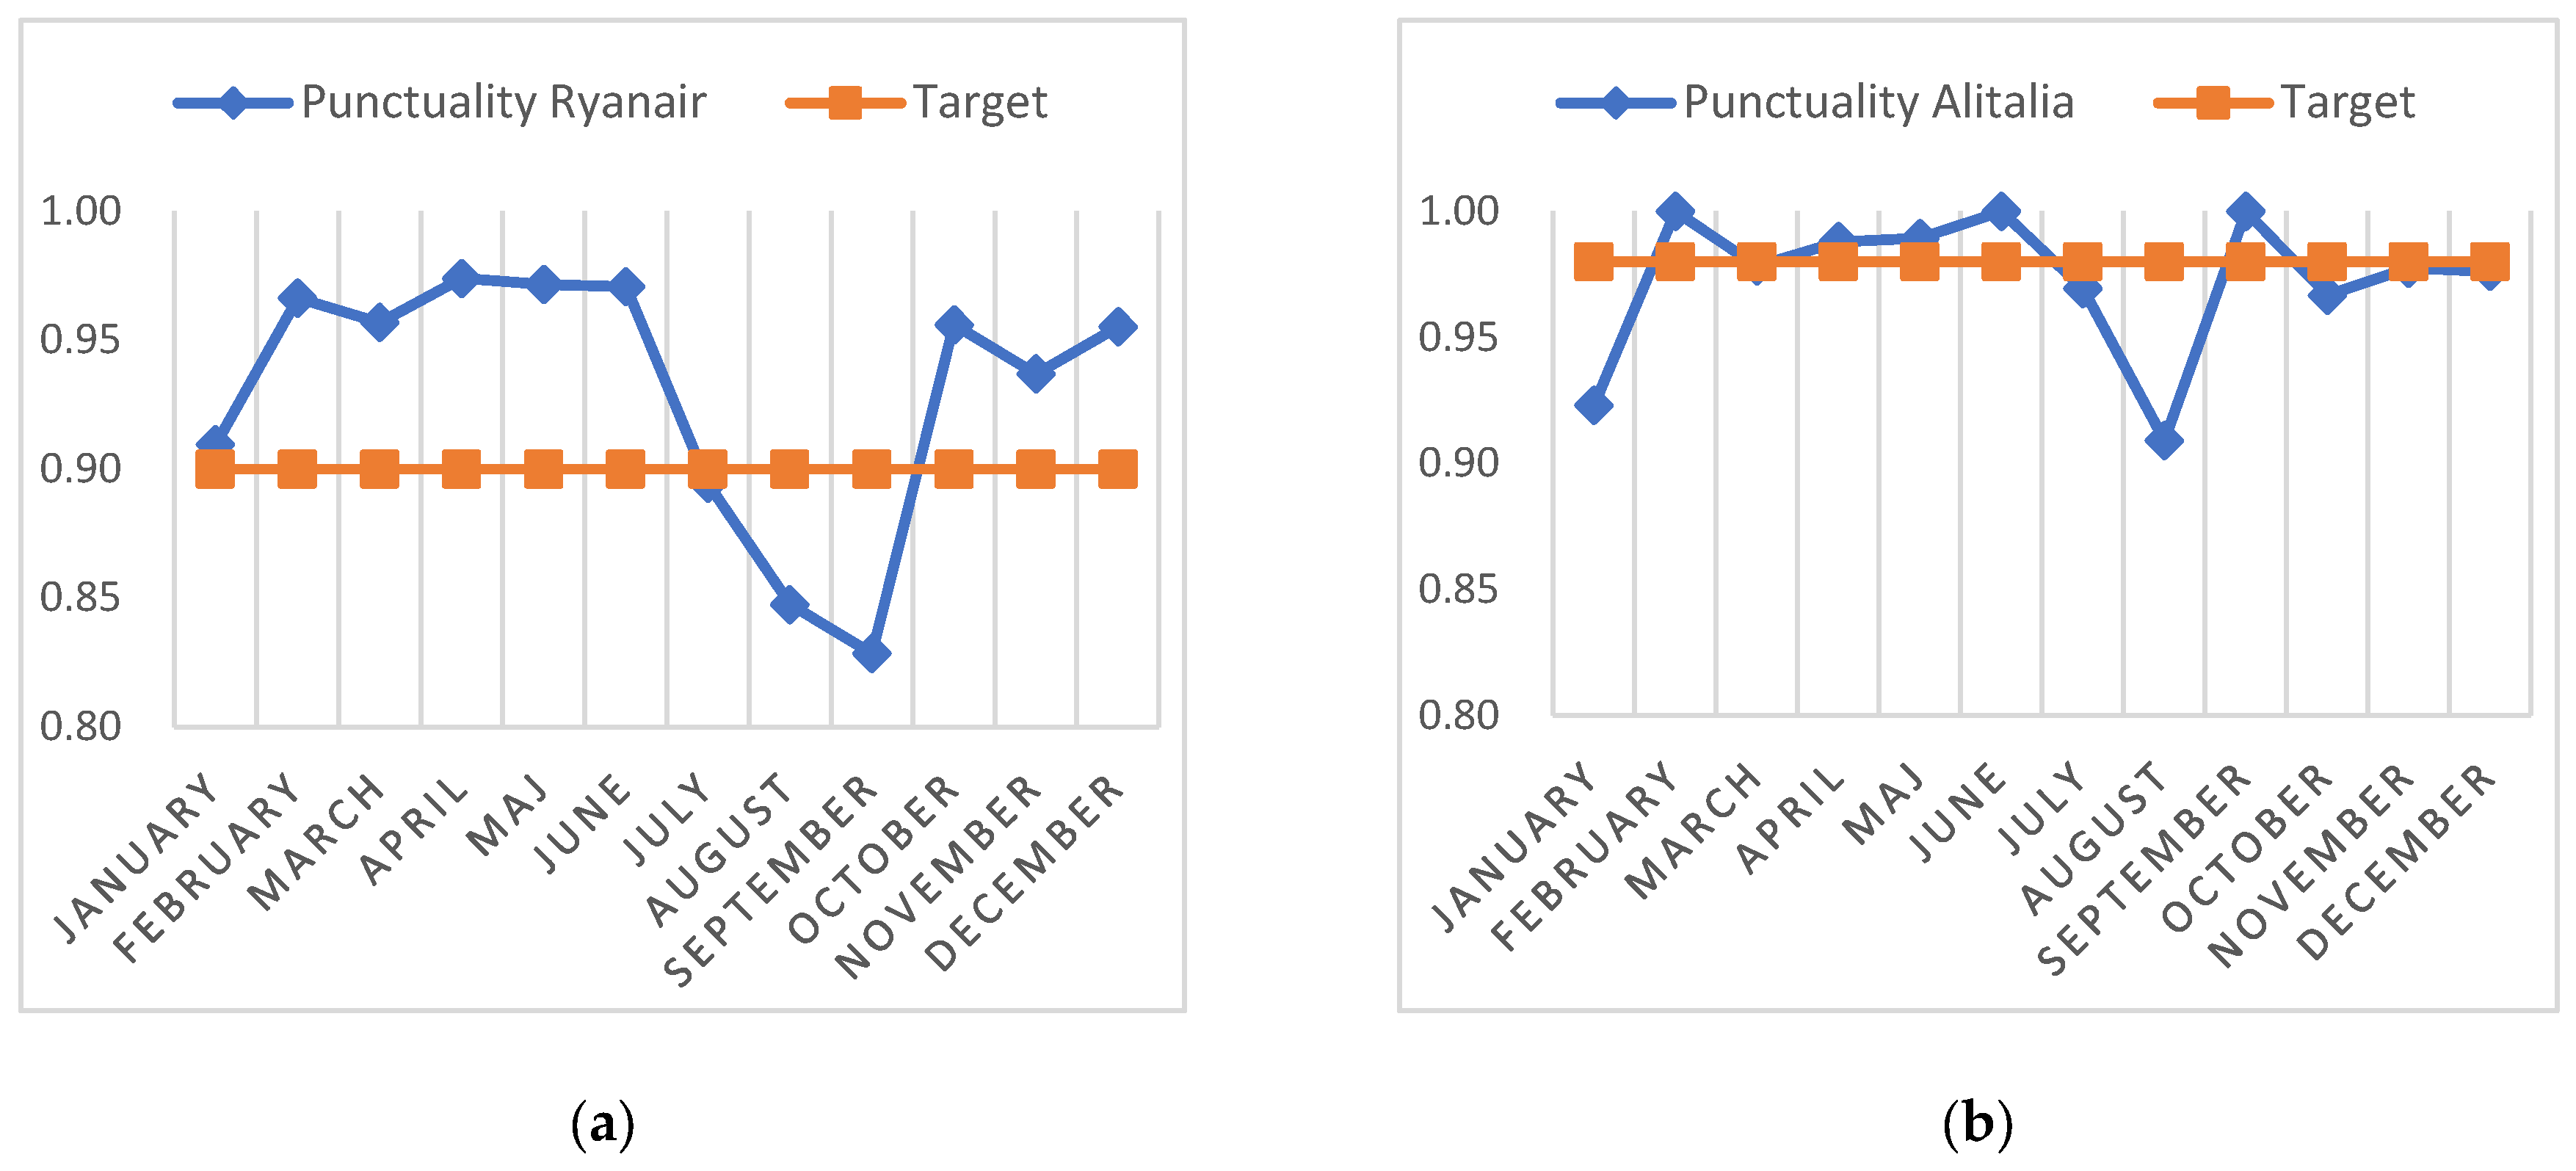
Performance on the overall flights regarding punctuality, grouped monthly for 2019, is shown in Figure 18, comparing the largest low-cost carrier (Ryanair) and the full-service carrier (Alitalia) operating from the regional airport considered. We found that in July and August 2019, the performance regarding punctuality was below the target, and this was at a time when the traffic of the airport increased, maintaining the same amount of personnel; the overall punctuality of Ryanair flights was on average higher than the punctuality target, compared to the overall punctuality of Alitalia flights. It is, however, worth noting that the Ryanair punctuality target is lower, at 90%, while the target of the full-service airline Alitalia is 98%.
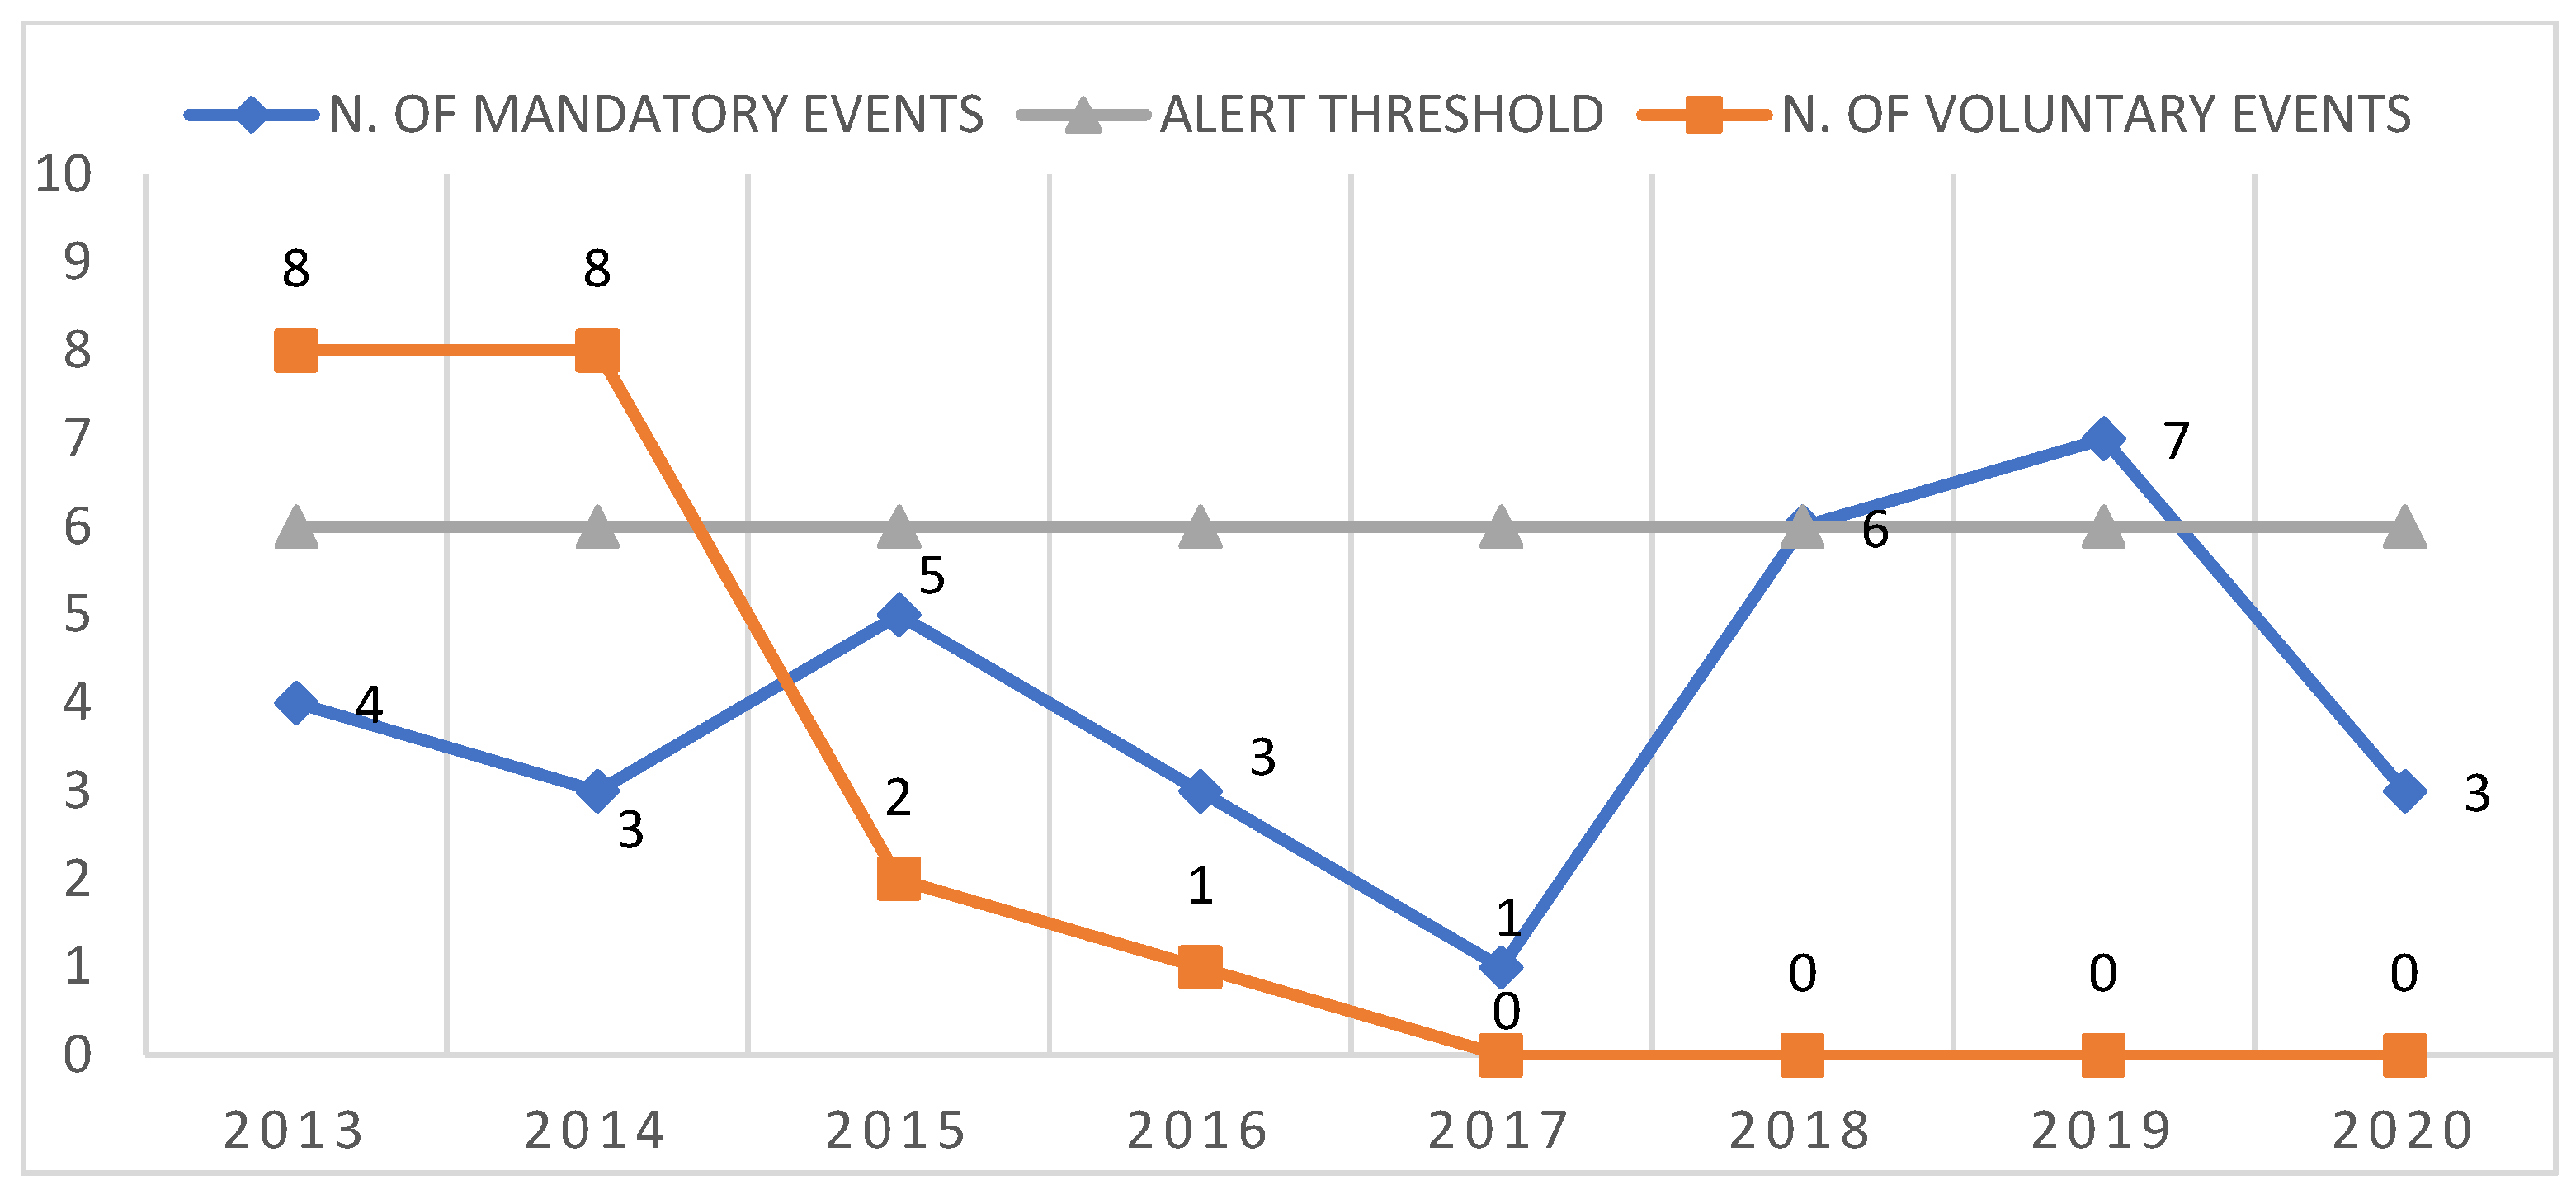
On the other hand, performance regarding safety indicators on the trend of voluntary and mandatory events occurring during the last eight years is shown in Figure 19. The results of Figure 19 are important, as the ratio between voluntary and mandatory reporting can be used as an indicator of the organization’s safety culture [23]. A voluntary occurrence is submitted by the reporter without any legal, administrative, or financial requirement to do so [24], whereas in mandatory reporting systems, operational personnel are required to report accidents and certain types of incidents specifically by the regulator [25]. Failure to do so can result in legal prosecution. However, learning from near-misses and operational incidents is considered a cornerstone of good safety management practices, as far back as the Heinrich [23] hierarchy; it is recommended that a good safety management system should be sustained by information provided by voluntary reports on minor events, as for every major incident there were many cases of smaller incidents, and behind those smaller incidents there were many near-misses that could occur within the organization, the knowledge and follow up of which can help prevent major occurrences [26]. The lack of voluntary reporting, therefore, in favor of only mandatory reporting is considered to be an index of under-reporting and lack of a good reporting culture within an organization, as pointed out by previous industrial studies [27,28,29], as the opportunity to use reporting to reduce the level of risk within an organization may be missed. Therefore, there could be a false sense of security due to an underestimation of actual occurrences within the organization, as voluntary events have not been reported since 2017.

3.2. Results of the Analysis of Passenger Satisfaction: The Ordinal Logistic Regression (OLR) Model

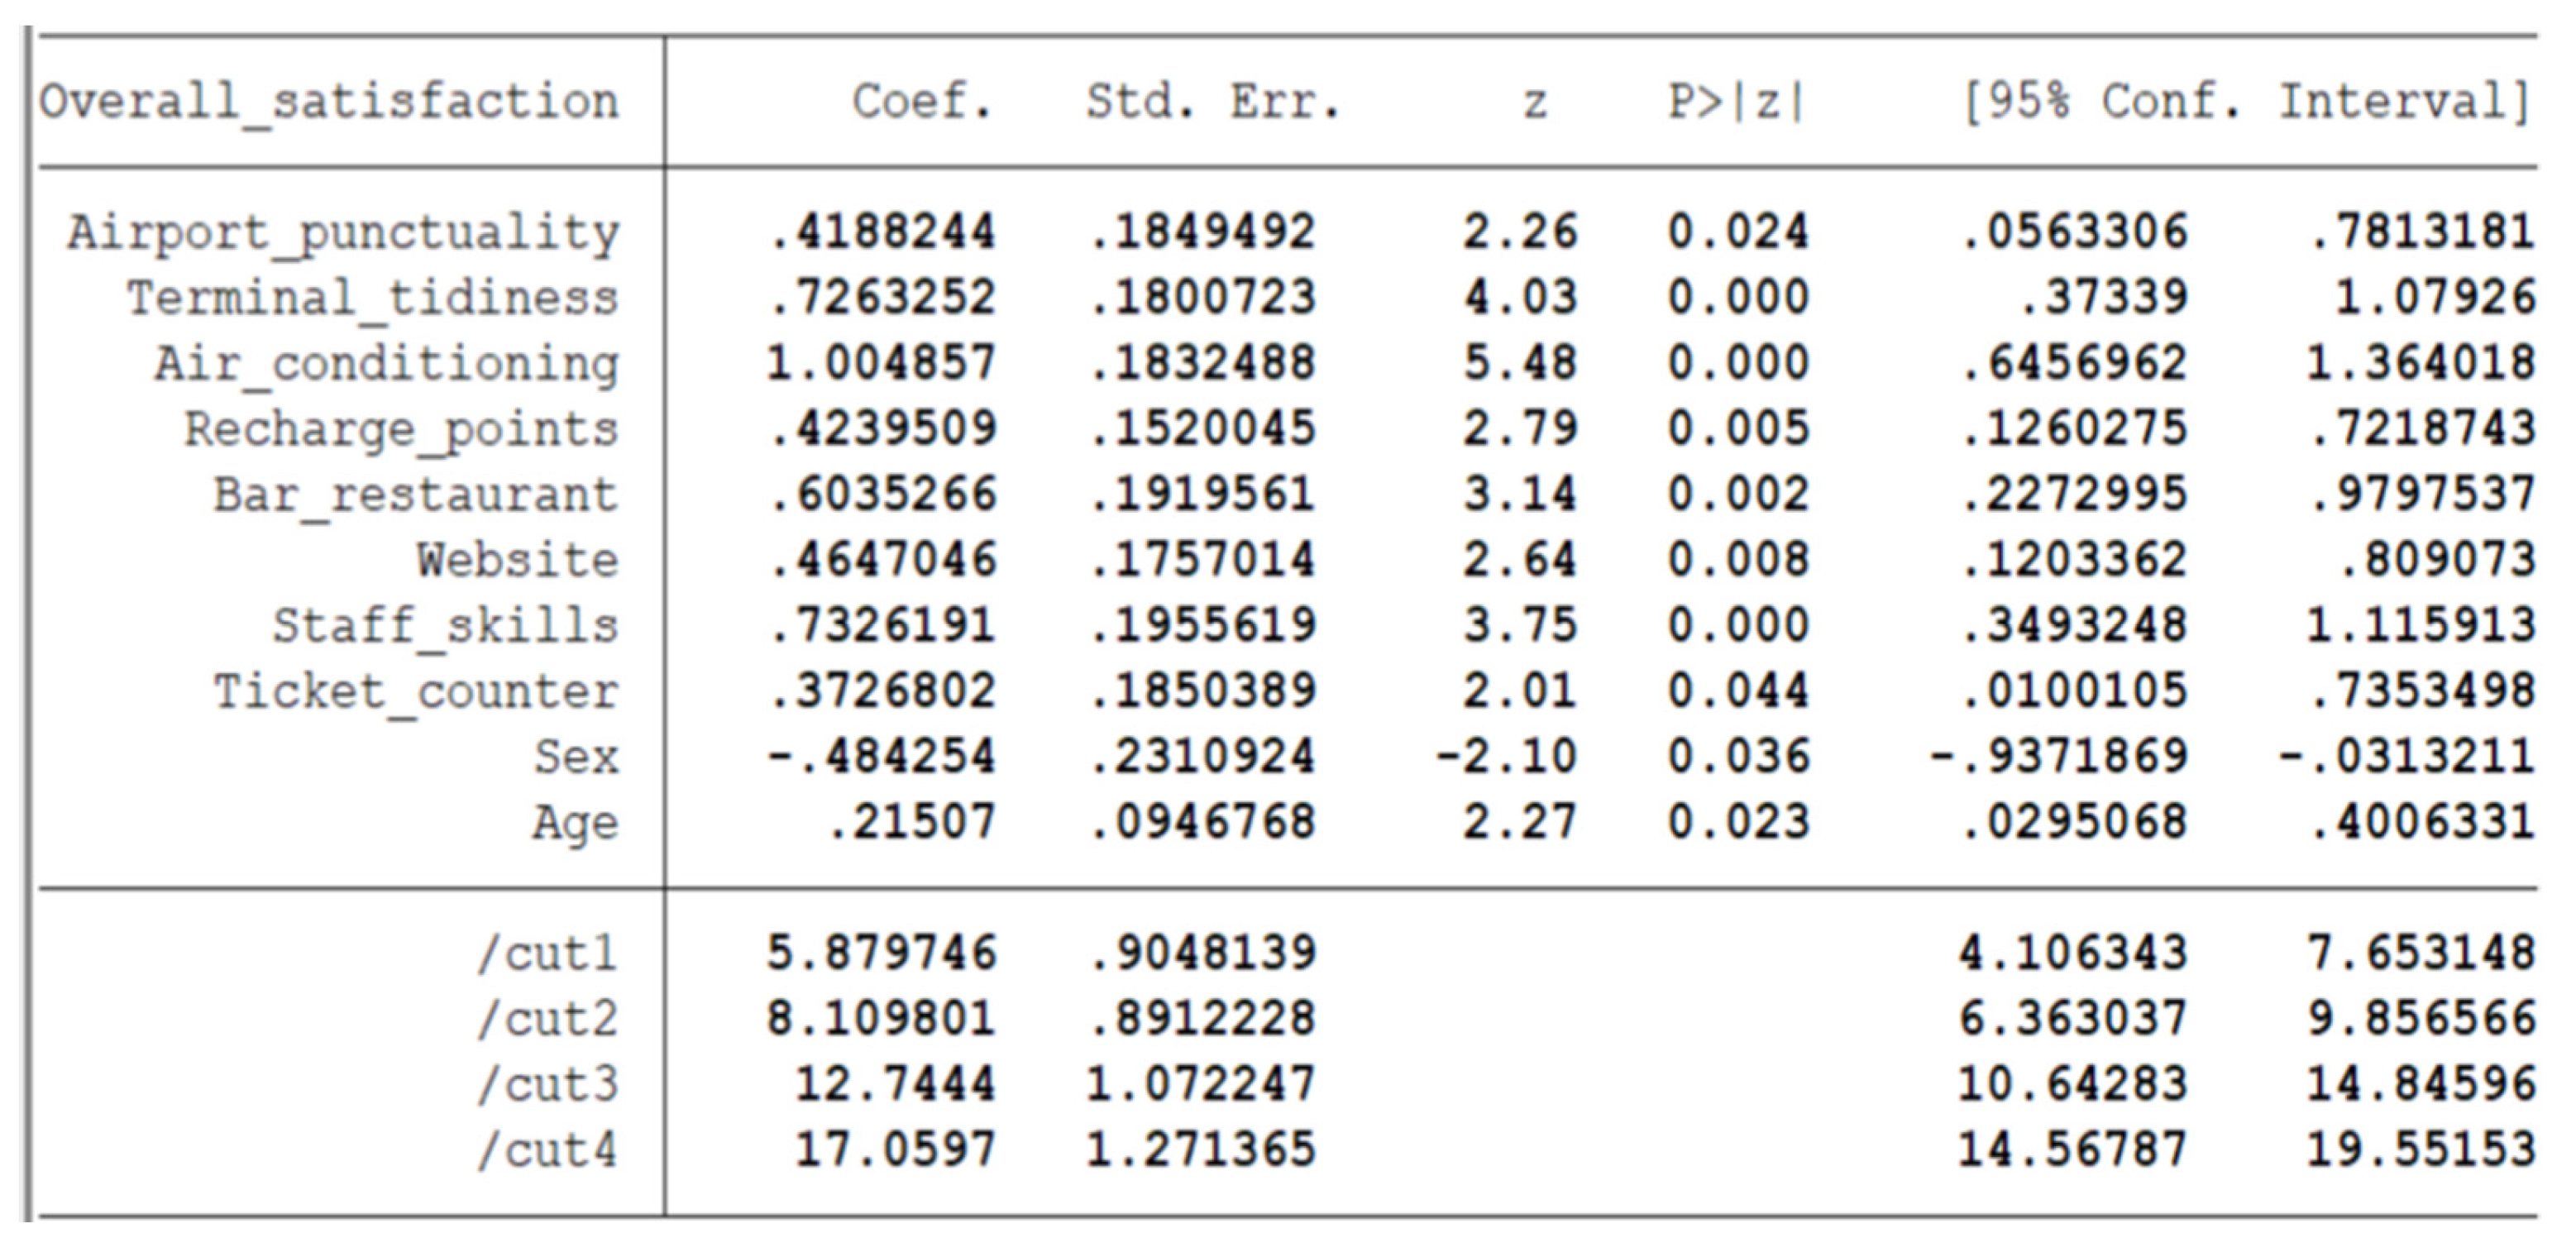
The estimated results obtained from Stata for the OLR stepwise model are reported in Figure 20. We used the ordinal logistic regression (OLR) model, instead of the ordinal probit regression model, because the OLR model gave us better results in terms of statistical significance of the parameters. The analysis included those attributes significantly different from zero at the 5% significance level, using the stepwise selection method. In the first column: “Overall satisfaction” indicates the dependent variable; “Airport punctuality”, “Terminal tidiness”, “Air conditioning”, “Recharge points”, “Bar restaurant”, “Website”, “Staff skills”, “Ticket counter”, “Sex” and “Age” represent the regressors. At the bottom of the table, “/cut1”, “/cut2”, “/cut3” and “/cut4” are the cut-points that depend on the specificity of the ordinal logistic regression (OLR) model. An OLR model, in fact, can also be interpreted in terms of a latent variable. Specifically, suppose that the manifest response Yi results from grouping an underlying continuous variable Y*i using cut-points θ1 < θ2 <…< θJ−1, so that Yi takes the value 1 if Y*i is below θ1, the value 2 if Y*i is between θ1 and θ2, and so on, taking the value J if Y*i is above θJ−1. The threshold parameters of 5.88, 8.11, 12.74 and 17.06 tell us that there are five possible values for Y: Yi = 1 if Y*i ≤ 5.88; Yi = 2 if 5.88 ≤ Y*i ≤ 8.11; Yi = 3 if 8.11 ≤ Y*i ≤ 12.74; Yi = 4 if 12.74 ≤ Y*i ≤ 17.06 and Yi = 5 if Y*i ≥ 17.06.
The other columns show, respectively, the coefficients, the standard errors, the z-test statistic values, the p-values and the confidence intervals, with a 95% level of confidence associated with independent variables and threshold parameters. A one-unit increase in the overall perception of airport services’ reliability and punctuality is associated with a 0.42 increase in the expected value of “Overall satisfaction” on the log odds scale, given that all of the other variables in the model are held constant. A one-unit increase in the perception of terminal tidiness is associated with a 0.73 increase in the expected value of “Overall satisfaction” on the log odds scale, given that all of the other variables in the model are held constant. A one-unit increase in the perception of air conditioning and heating efficiency is associated with a 1.00 increase in the expected value of “Overall satisfaction” on the log odds scale, given that all of the other variables in the model are held constant. A one-unit increase in the perception of recharge points for mobile devices in public areas is associated with a 0.42 increase in the expected value of “Overall satisfaction” on the log odds scale, given that all of the other variables in the model are held constant. A one-unit increase in the perception of availability, quality and prices of bars and restaurants is associated with a 0.60 increase in the expected value of “Overall satisfaction” on the log odds scale, given that all of the other variables in the model are held constant. A one-unit increase in the perception of the airport website is associated with a 0.46 increase in the expected value of “Overall satisfaction” on the log odds scale, given that all of the other variables in the model are held constant. A one-unit increase in the perception of staff skills is associated with a 0.73 increase in the expected value of “Overall satisfaction” on the log odds scale, given that all of the other variables in the model are held constant. A one-unit increase in the perception of ticket counter services is associated with a 0.37 increase in the expected value of “Overall satisfaction” on the log odds scale, given that all of the other variables in the model are held constant. “Sex = 1” (male) is associated with a 0.48 decrease in the expected value of “Overall satisfaction” on the log odds scale, given that all of the other variables in the model are held constant. A one-unit class increase in the variable “Age” is associated with a 0.22 increase in the expected value of “Overall satisfaction” on the log odds scale, given that all of the other variables in the model are held constant. The stepwise selection method allowed us to obtain all p-values < 0.05 and consequently, all regressors significantly different from zero at the 5% significance level. The passengers’ overall satisfaction appeared to be influenced by the perception of air conditioning and heating efficiency/control of environmental conditions within the airport, the skills and usefulness of the staff, the tidiness of the terminal, the availability, quality and prices of bars and restaurant services in the terminal, the quality of the information offered on the airport website, the availability of recharge points for mobile devices in public areas, airport services’ reliability and punctuality, and the ticket counter and information services offered; while among the socio-economic factors, “Sex” and “Age” were useful to explain differences between passengers’ overall satisfaction, unlike “Trip purpose” and “Flight frequency”, which were not found to be relevant in discriminating between different passengers’ expressed satisfaction. In line with the study of Eboli and Mazzulla [21], the services related to the helpfulness of personal safety and security, toilets inside the terminal, internal and external sign-posting, and the availability of city center–airport surface links were not useful to explain the passengers’ overall satisfaction.
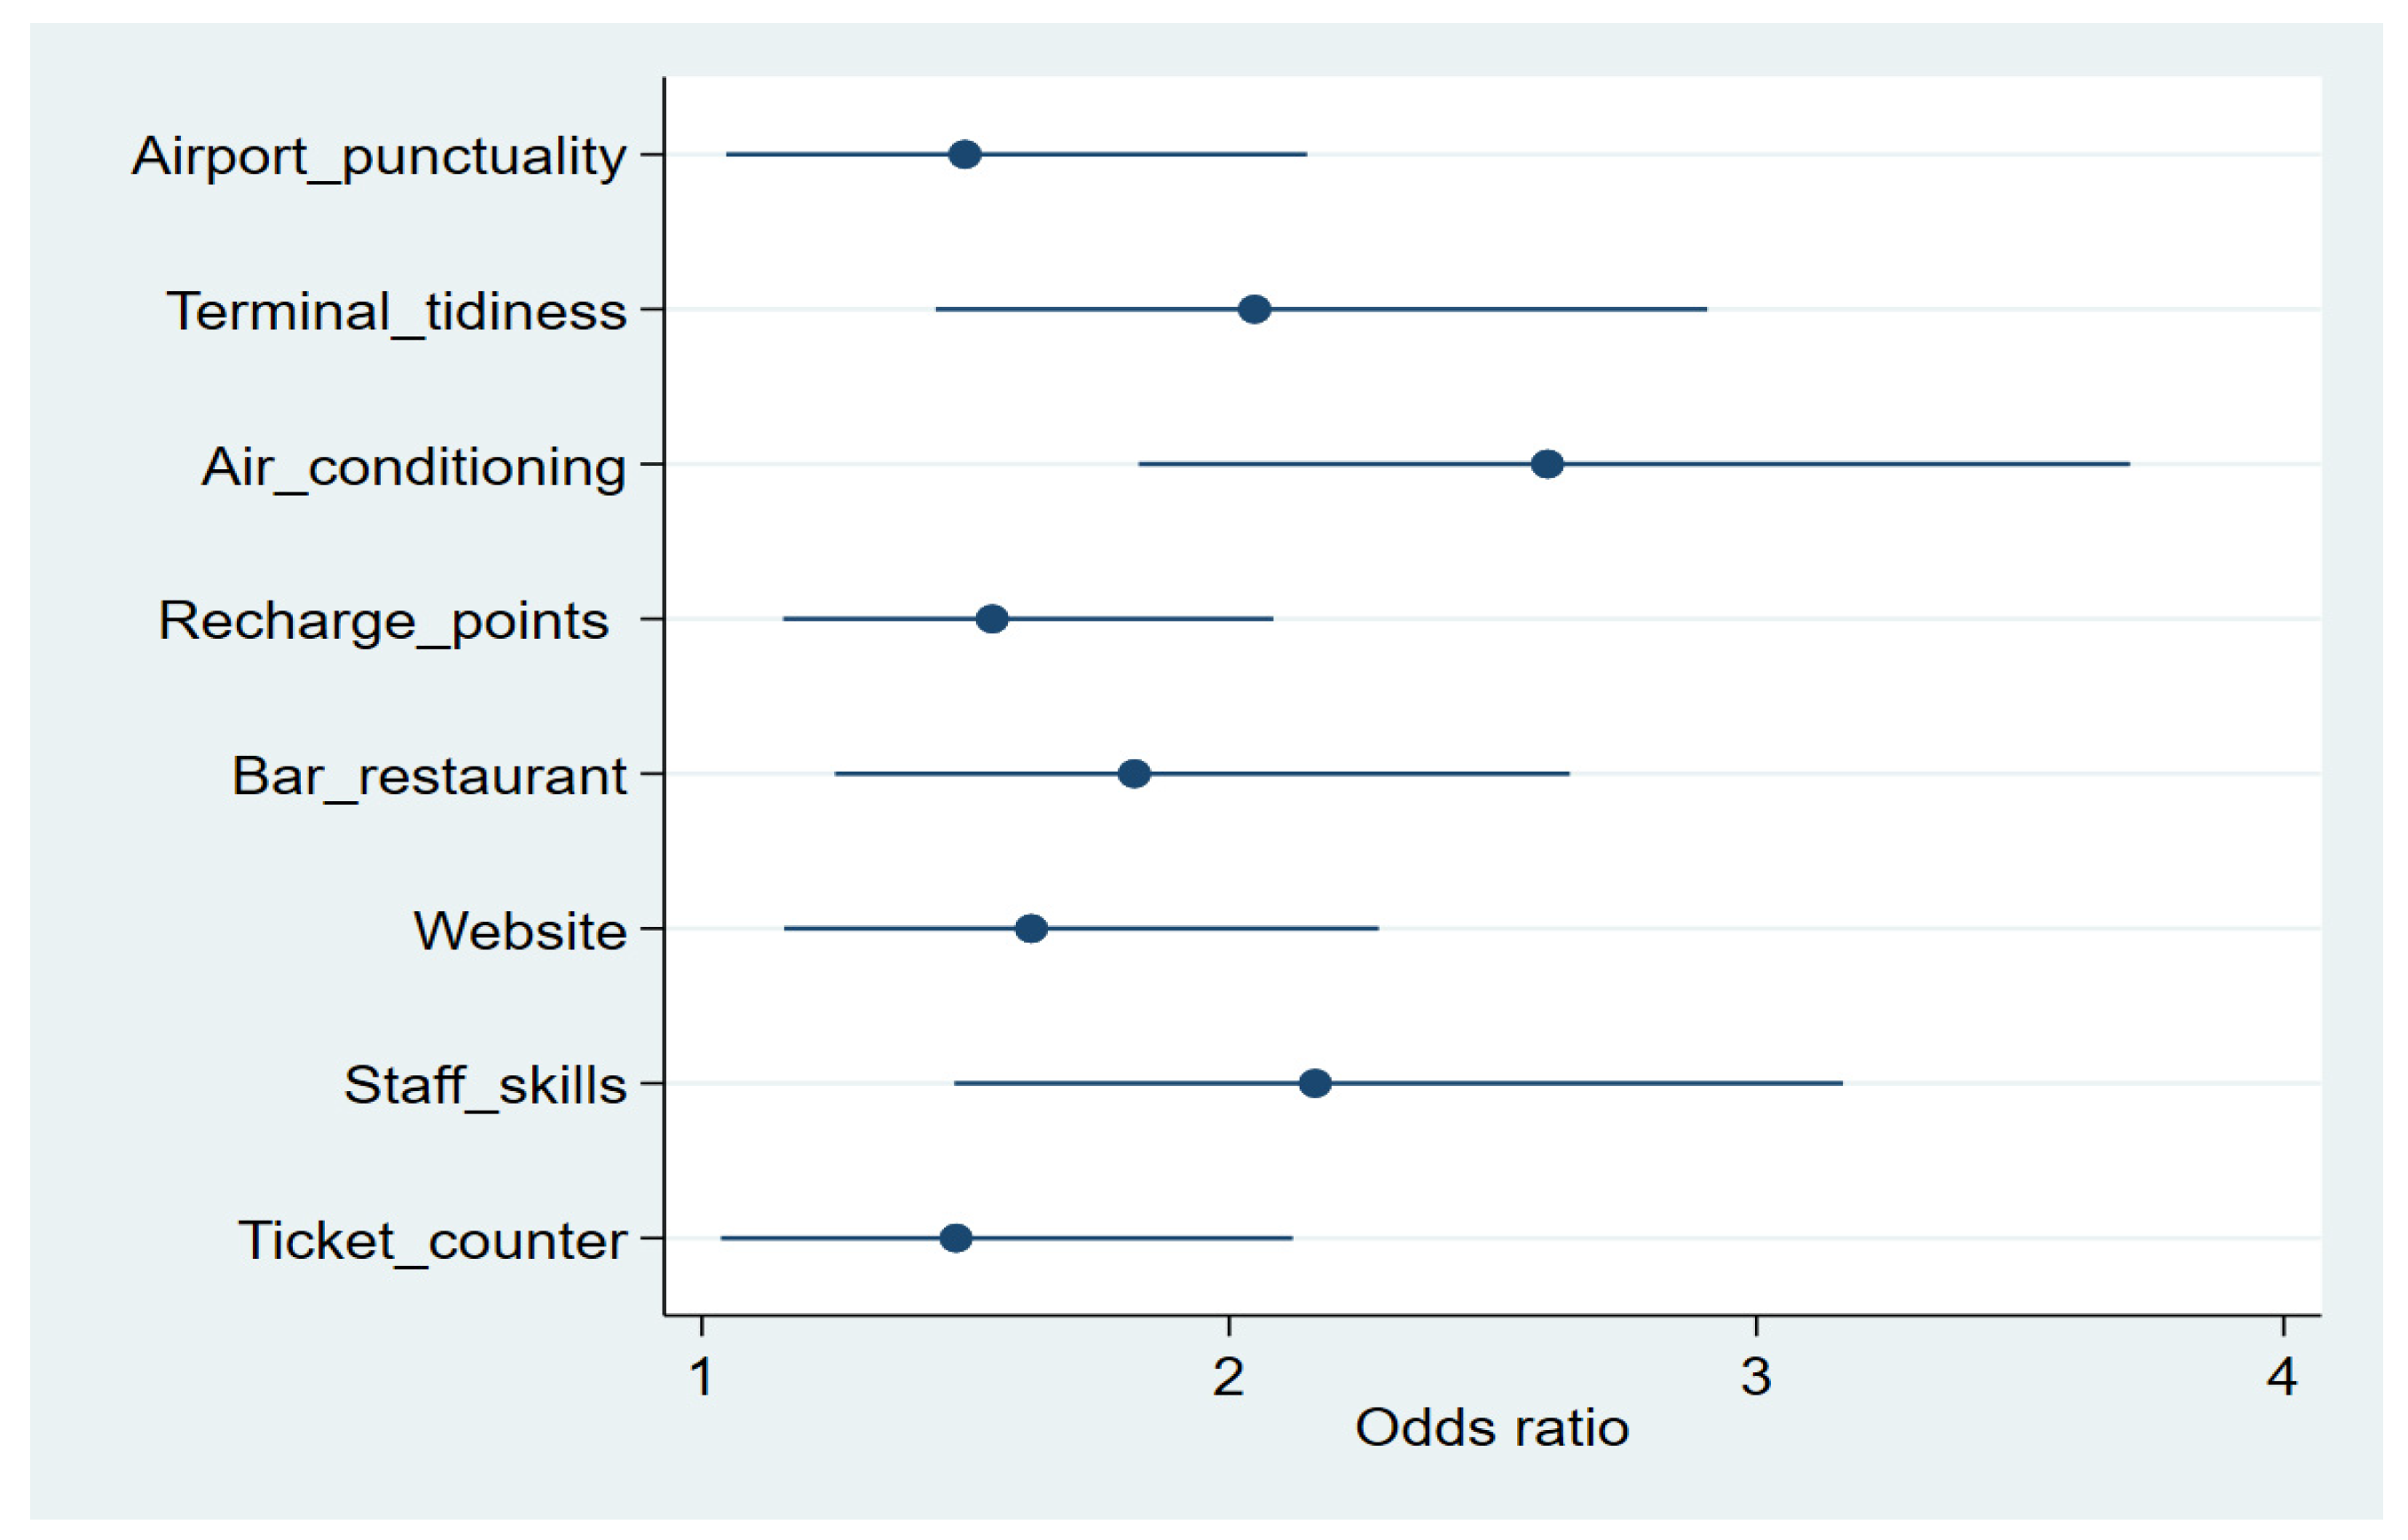
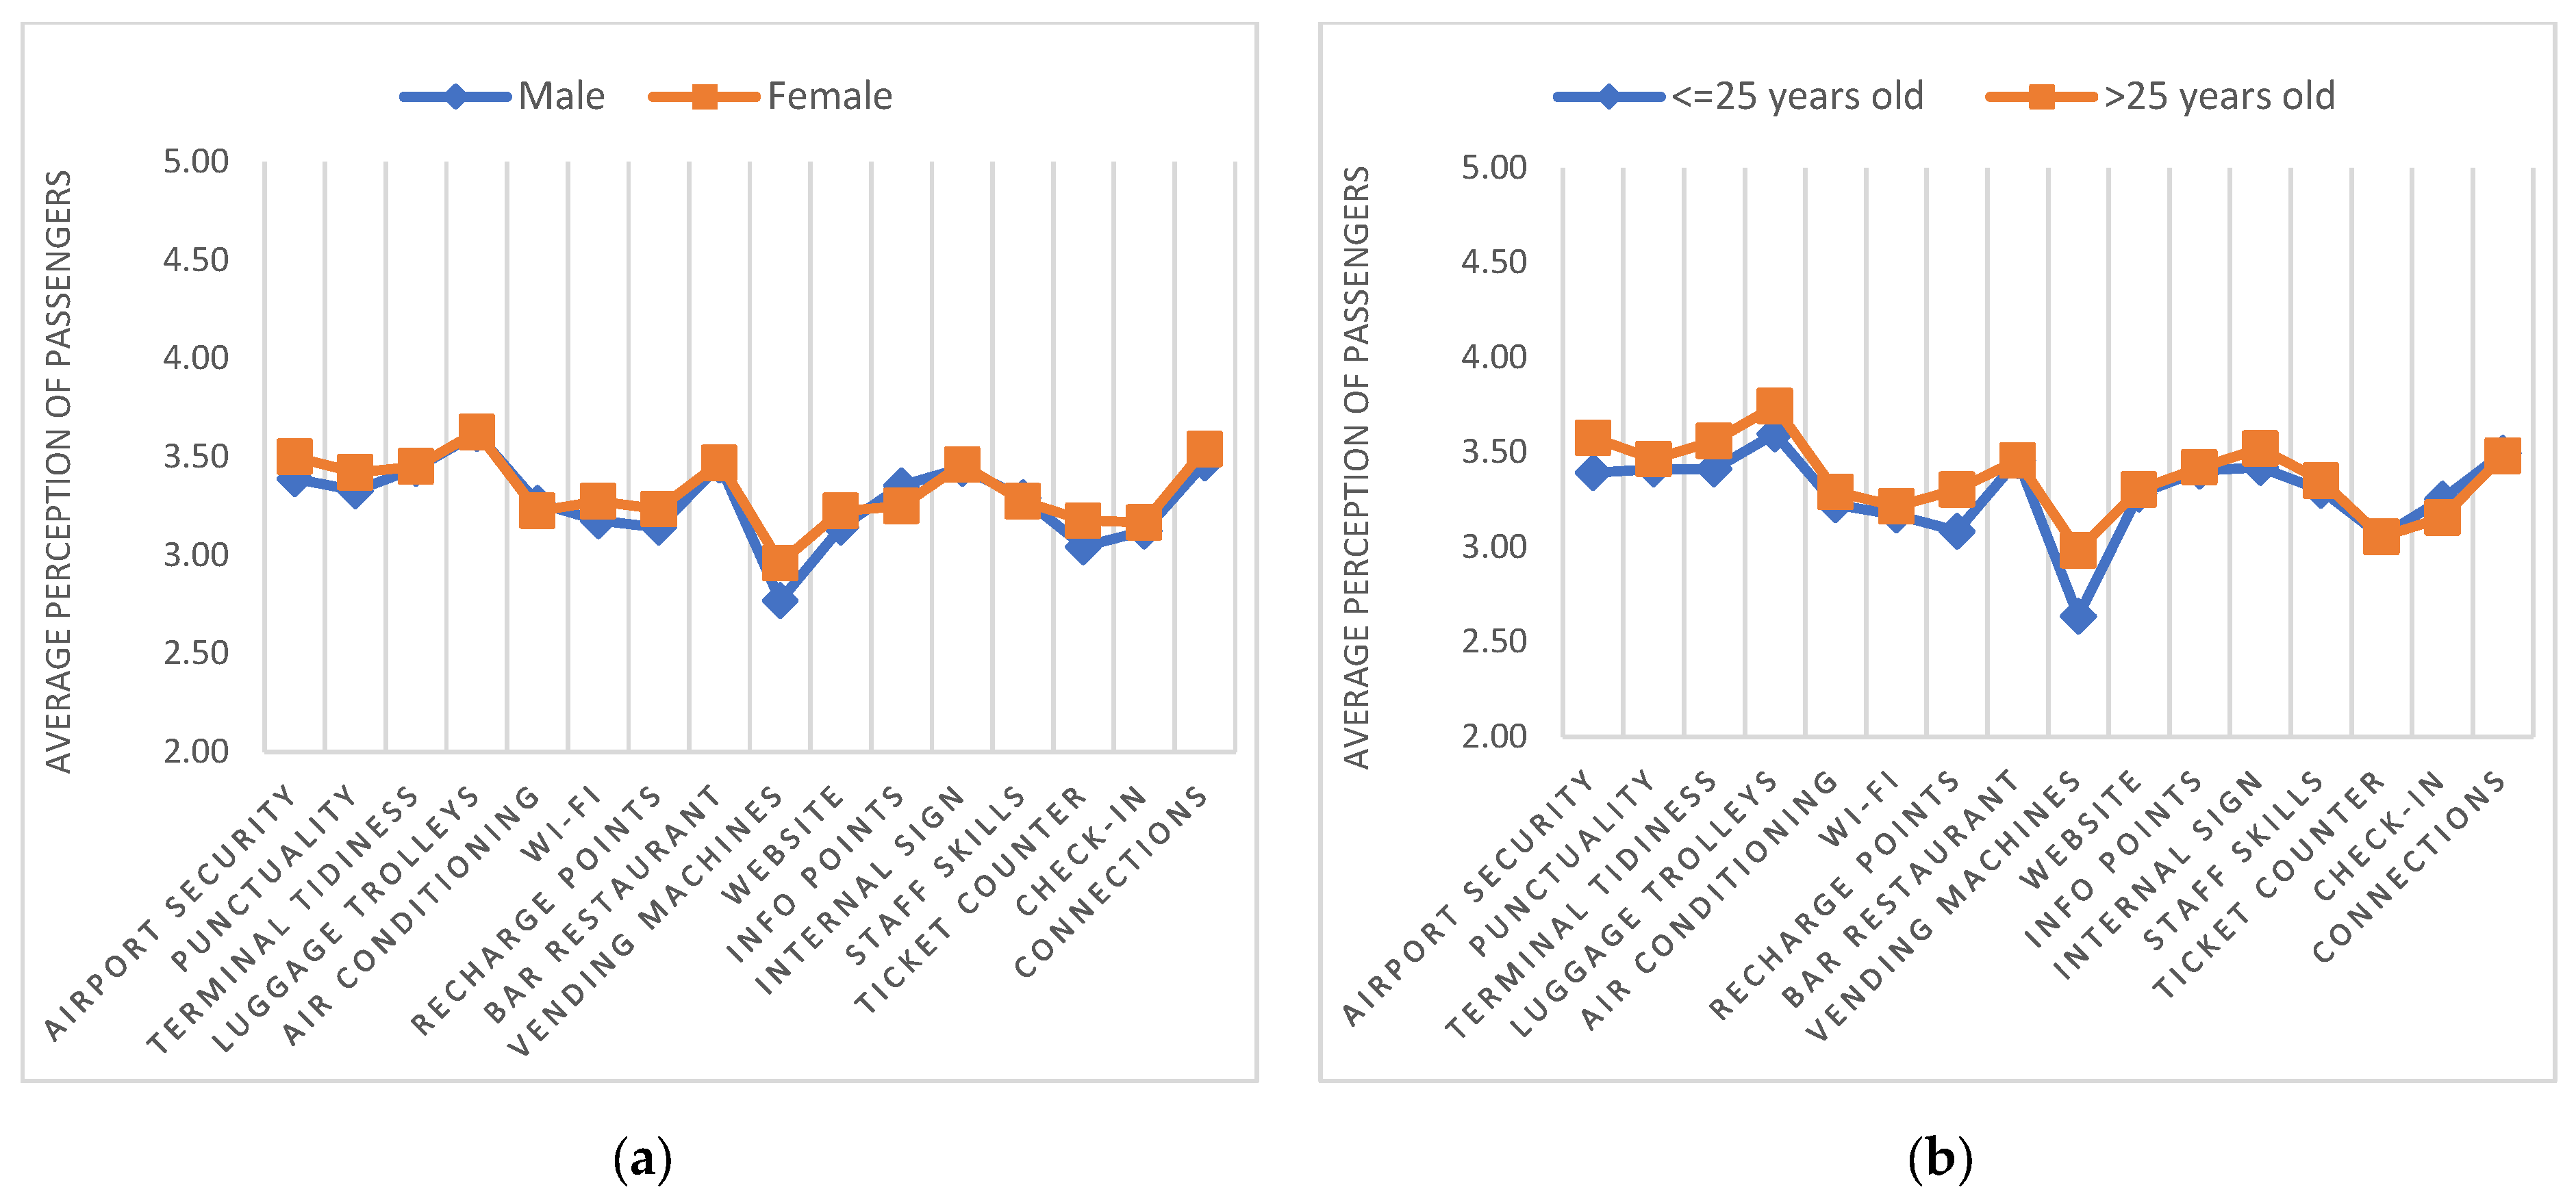
The proportional odds ratios for the ordered logistic regression model are obtained by exponentiating the ordered logit coefficients or by specifying the “or” option. For a one-unit increase in the perception of air conditioning available in the airport, the odds of the fifth category of overall satisfaction versus the combined fourth, third, second and first categories are 2.60 times greater, given that all of the other variables in the model are held constant. For a one-unit increase in the perception of staff skills, the odds of the fifth category of overall satisfaction versus the combined fourth, third, second and first categories are 2.16 times greater, given that all of the other variables in the model are held constant. For a one-unit increase in the perception of terminal tidiness, the odds of the fifth category of overall satisfaction versus the combined fourth, third, second and first categories are 2.05 times greater, given that all of the other variables in the model are held constant. For a one-unit increase in the perception of the prices of bars and restaurants, the odds of the fifth category of overall satisfaction versus the combined fourth, third, second and first categories are 1.82 times greater, given that all of the other variables in the model are held constant. For a one-unit increase in the perception of the airport website, the odds of the fifth category of overall satisfaction versus the combined fourth, third, second and first categories are 1.62 times greater, given that all of the other variables in the model are held constant. For a one-unit increase in the perception of recharge points for mobile devices, the odds of the fifth category of overall satisfaction versus the combined fourth, third, second and first categories are 1.55 times greater, given that all of the other variables in the model are held constant. For a one-unit increase in the perception of the airport service punctuality, the odds of the fifth category of overall satisfaction versus the combined fourth, third, second and first categories are 1.50 times greater, given that all of the other variables in the model are held constant. For a one-unit increase in the perception of ticket counter services, the odds of the fifth category of overall satisfaction versus the combined fourth, third, second and first categories are 1.48 times greater, given that all of the other variables in the model are held constant. The distribution of odds ratios obtained from Stata for the OLR stepwise model is shown in Figure 21. Looking at Figure 21, the points indicate the odds ratio values, and the horizontal lines represent the confidence intervals, with a 95% confidence level associated with each attribute without considering socio-economic factors. We found that the quality of air conditioning available in the airport (marked as “Air conditioning” in Figure 20 and Figure 21) showed the most significant weight in terms of odds ratio on the passenger’s overall satisfaction (2.60), followed by “Staff skills” (2.16), “Terminal tidiness” (2.05), “Bar restaurant” (1.82), “Website” (1.62), “Recharge points” (1.55), “Airport punctuality” (1.50) and “Ticket counter” (1.48). The distribution of the average satisfaction of passengers grouped by sex and age is reported in Figure 22, highlighting how young and male passengers were less satisfied than female passengers over the age of 25, in relation to the indicators shown in Figure 2, Figure 3, Figure 4, Figure 5, Figure 6, Figure 7, Figure 8, Figure 9, Figure 10, Figure 11, Figure 12, Figure 13, Figure 14, Figure 15, Figure 16 and Figure 17, except for “Check-in”, “Air conditioning” and “Information points”.

3.3. Results of the Analysis of the Employees’ Perspective

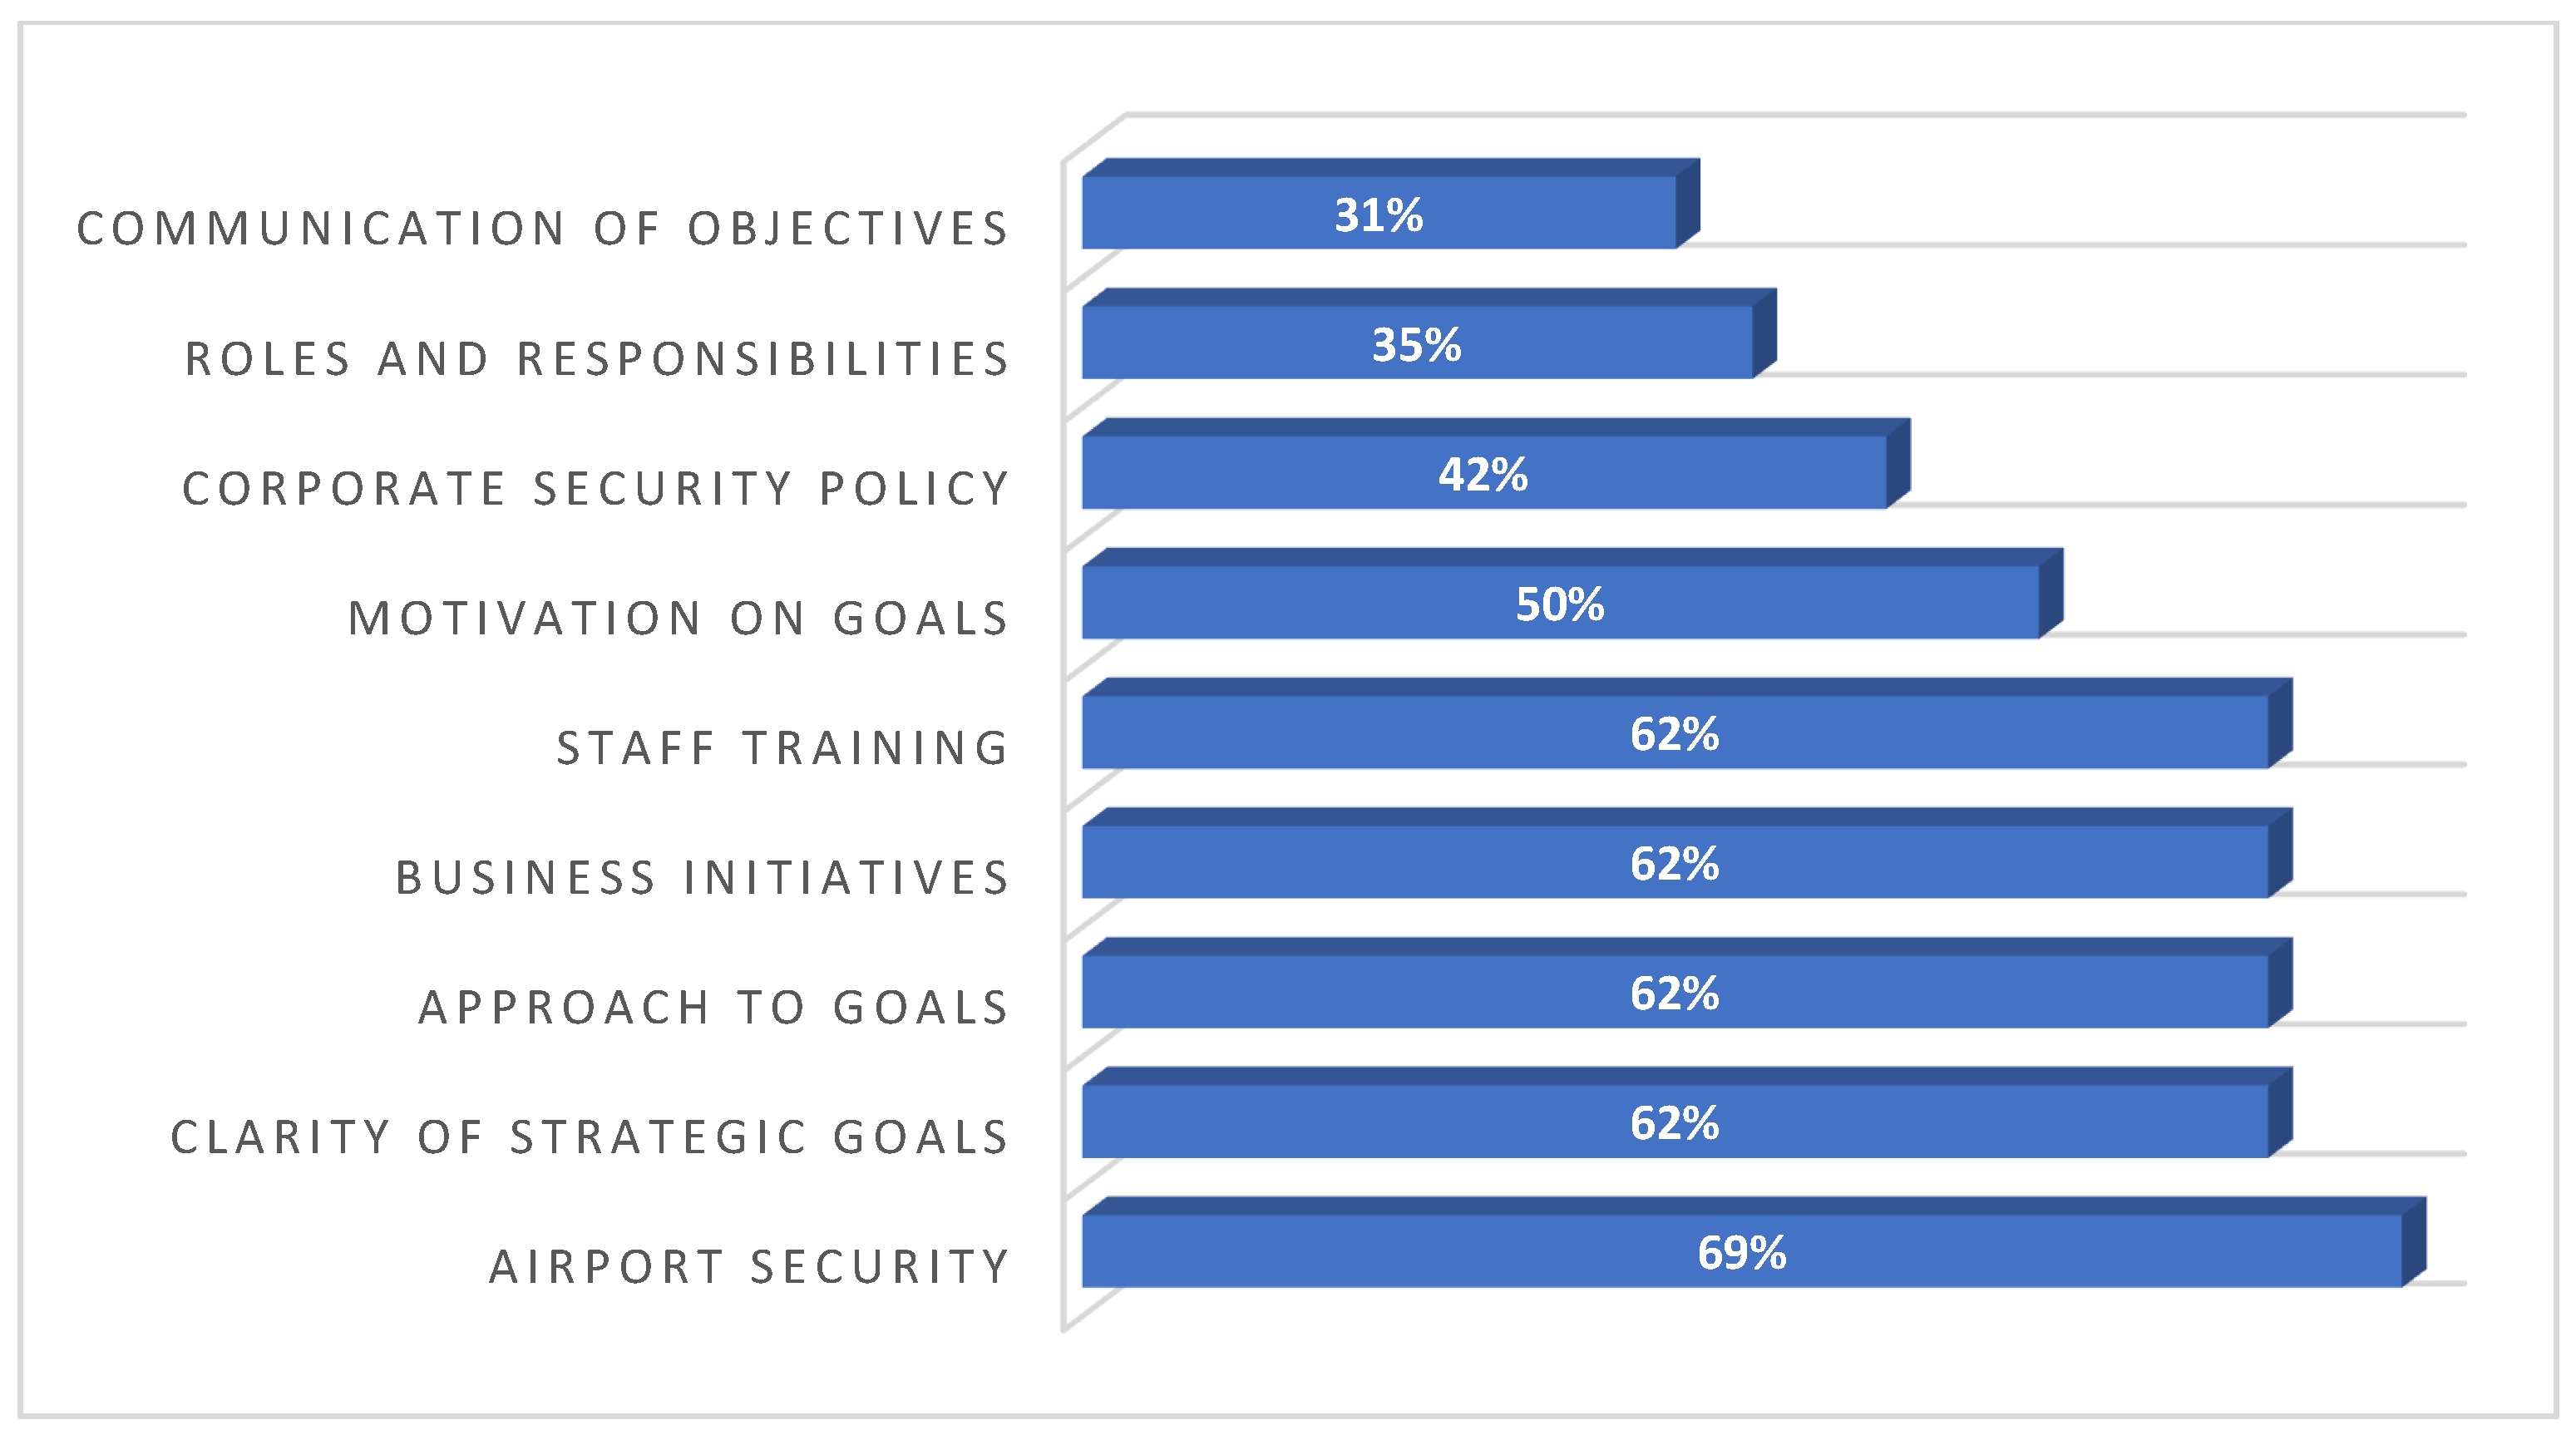
Of the 26 employees recruited for the study, we found that they perceived the airport security level as the best operational aspect (0.69), followed by the clarity of strategic goals (0.62) and the approach to goals (0.62), the business initiatives (0.62) and staff training (0.62), the motivation on goals (0.50) and the corporate security policy (0.42); whereas the critical areas of improvement for the service operator were “Roles and responsibilities” (0.35) and “Communication of objectives” (0.31). The results of the analysis of the employees’ perspective are reported in Table 2. Employees’ perspective indicators were calculated by dividing the total number of satisfied employees who answered “Discrete” or “Good” or “Excellent”, by the total number of employees interviewed according to the ENAC (Italian Civil Aviation Transport) methodology on a standard Airport Service Charter. The distribution of the indicators obtained from the analysis of the employees’ perspective is shown in Figure 23.
Regarding “Organizational structure”, 62% of the employees were happy about the training provided by the airport, and only 35% of them were satisfied with the matching between roles and responsibilities. “Corporate mission” indicators revealed that 62% of employees were happy about the clarity and approach of strategic goals and the business initiatives, whereas “Employee participation” indicators suggested that 50% of employees were satisfied with the motivation on goals, and only 31% of them were happy about the communication of objectives. Regarding “Safety performance”, 42% of employees were happy about the corporate security policy, and 69% of them were satisfied with the airport security.

3.4. Results of the Survey with Company Managers

The results of the analysis of the managers’ perspective, when asked about the choice of the main areas for improvement between the main critical operational aspects, resulted in the previous analysis reported in Table 3. We took into account the two worst operational aspects and included them in a choice set with three alternatives: “Roles and responsibilities”, “Communication of objectives” and “Other”. The experimental task is shown in Appendix A (Figure A11): it consisted of choosing which essential aspect to improve among the worst operational aspects ranked by the employees. The experimental subjects were company managers in the following key areas of operations:
  • Airside & Operations Manager
  • Sales & Marketing Manager
  • Financial Administration Manager
  • Safety & Compliance Monitoring Manager
  • Health & Safety Environment (HSE) Manager
  • Structural Asset Manager.
Of the 6 managers recruited, 50% of them were male and 35–44 years old, 33.3% of them belonged to the fourth age class (45–54 years old) and 16.7% of them were concentrated in the fifth age class (>54 years old), whereas the managers’ average period of service was 17 years. 33.3% of them chose “Communication of objectives” as the essential aspect to be improved, whereas 66.7% of them chose “Roles and responsibilities” as the critical area to be improved, and 0% of them chose the “Other” option.
From the managers’ perspective, the redistribution of the workforce for better matching between roles and responsibilities was the main area for improvement, as the middle managers explained that they found their roles to often be stretched to cover areas they are less comfortable with, and with the results of feeling less focused on the main area of competence. The area of communication of objectives was chosen mainly by the Sales & Marketing Manager and the Structural Asset Manager. However, this area was widely reported as needing improvement by the vast majority of the employees interviewed during the survey, therefore it also deserves to be taken into account.

4. Discussion

This study analyzed the satisfaction of the passengers of an Italian regional airport using an ordinal logistic regression (OLR) model. Furthermore, it compares the passengers’ perception with the employees’ perception, from the point of view of the quality of service and the employees’ perspective, in order to identify possible critical areas of improvement for the service operator. The value of this paper lies in the combination of the passengers’ perspective with the employees’ perception, and the insight derived from triangulating them with performance indicators collected for quality and safety metrics. The field study was also completed via a simple survey, based on the literature [20], aiming to identify which areas of improvement are actually chosen from the operational managers’ perspective, among the possible alternatives resulting from the employees’ survey.
Based on the findings obtained from the study of Eboli and Mazzulla [21], we tested the hypothesis of what variables are to be considered significant or not in relation to passengers’ overall satisfaction, using a modified version of the customers’ satisfaction survey for the employees, to enable a comparison of the two perspectives, and considering extra sections for the employees’ survey on operational areas such as the corporate mission and its communication, organizational structure, employee participation, and safety performance. In line with the study of Eboli and Mazzulla [21], the services related to the helpfulness of personal safety and security, toilets inside the terminal, internal and external sign-posting, and the availability of city center–airport surface links were not useful to explain the passengers’ overall satisfaction. The passengers’ overall satisfaction appeared to be influenced by the perception of air conditioning and heating efficiency, staff skills, terminal tidiness, availability, quality and prices of the bars and restaurants, the airport website, recharge points for mobile devices in public areas, airport services reliability and punctuality, and ticket counter services; while among the socio-economic factors, “Sex” and “Age” were useful to explain the differences between passengers’ overall satisfaction, unlike “Trip purpose” and “Flight frequency”, due to their homogeneous distribution. The findings indicate interesting areas of difference in the perceptions of the passengers and airport employees, both useful in highlighting necessary improvements. Employees were more satisfied compared to passengers, except for “Luggage trolley availability”, wi-fi connectivity inside the terminal, and recharge points for mobile devices in public areas. The judgment most frequently expressed by the passengers recruited was “Discrete”, followed by “Good”—therefore, they were not very satisfied on the whole with the services offered by the airport, but not very dissatisfied either. Young and male passengers were less satisfied than female passengers over the age of 25, in relation to the indicators shown in Figure 2, Figure 3, Figure 4, Figure 5, Figure 6, Figure 7, Figure 8, Figure 9, Figure 10, Figure 11, Figure 12, Figure 13, Figure 14, Figure 15, Figure 16 and Figure 17, except for “Check-in”, “Air conditioning” and “Information points”. On the other hand, the judgment most frequently elicited by the employees interviewed was “Good”, followed by “Discrete” (in line with expectations). Those passengers’ perceptions elicited were in line with the 2020 Airport Service Charter target metrics, except for “Toilet tidiness and services”, “Vending machines”, “Internal sign-posting” and “Public information services”. While employees’ perceptions as elicited were in line with the 2020 Airport Service Charter target metrics, except for “Luggage trolley availability”, “Wi-fi connectivity”, “Recharge points”, “Internal sign-posting” and “Public information services”.
The employees expressed higher satisfaction for the airport security’s level of service, and the critical areas of improvement they identified were around “Roles and responsibilities” and “Communication of objectives”.
From the managers’ perspective, the redistribution of the workforce to better match roles and responsibilities was the main area identified for improvement by the middle managers. They explained that they found their roles were often too stretched, covering areas reaching beyond their area of competence, and resulting in a lack of focus on the main core area of responsibility.
Finally, comparing the perceptions elicited on the quality of service by passengers and employees with the performance on quality indicators, they were in line with the 2020 Airport Service Charter target metrics with only minor deviations identified (e.g. “Toilet tidiness and services”, “Internal sign-posting” and “Public information services”), while it was not possible to compare the perceptions elicited on airport safety by employees with the performance on safety indicators, due to a potential issue of under-reporting that can give a false sense of security; therefore, further analysis on the possible lack of a good reporting culture within the company needs to be explored.

Author Contributions

Conceptualization, L.D., M.C.L. and E.B.; methodology, L.D., M.C.L. and E.B.; validation, L.D., M.C.L. and E.B.; formal analysis, L.D. and M.C.L.; investigation, L.D., M.C.L. and E.B.; resources, L.D., M.C.L. and E.B.; writing—original draft preparation, L.D. and M.C.L.; writing—review and editing, L.D., M.C.L. and E.B. All authors have read and agreed to the published version of the manuscript.

Funding

This research was funded by the Italian Ministry of Education, University and Research, Grant no. MIUR DOT1353443.

Institutional Review Board Statement

Not applicable.

Informed Consent Statement

Informed consent was obtained from all subjects involved in the study.

Data Availability Statement

See Reference [19].

Acknowledgments

The authors wish to thank Nicola Mattoscio, Enrico Paolini, Diana Del Sordo, Sara Perinetti, Donato Rapino, Aoife Burns, Alberto Caimo and three anonymous referees for their constructive criticisms, comments, and suggestions on earlier drafts.

Conflicts of Interest

The authors declare no conflict of interest.

Appendix A

This appendix lists the sections of the questionnaire designed for and used in the field study.
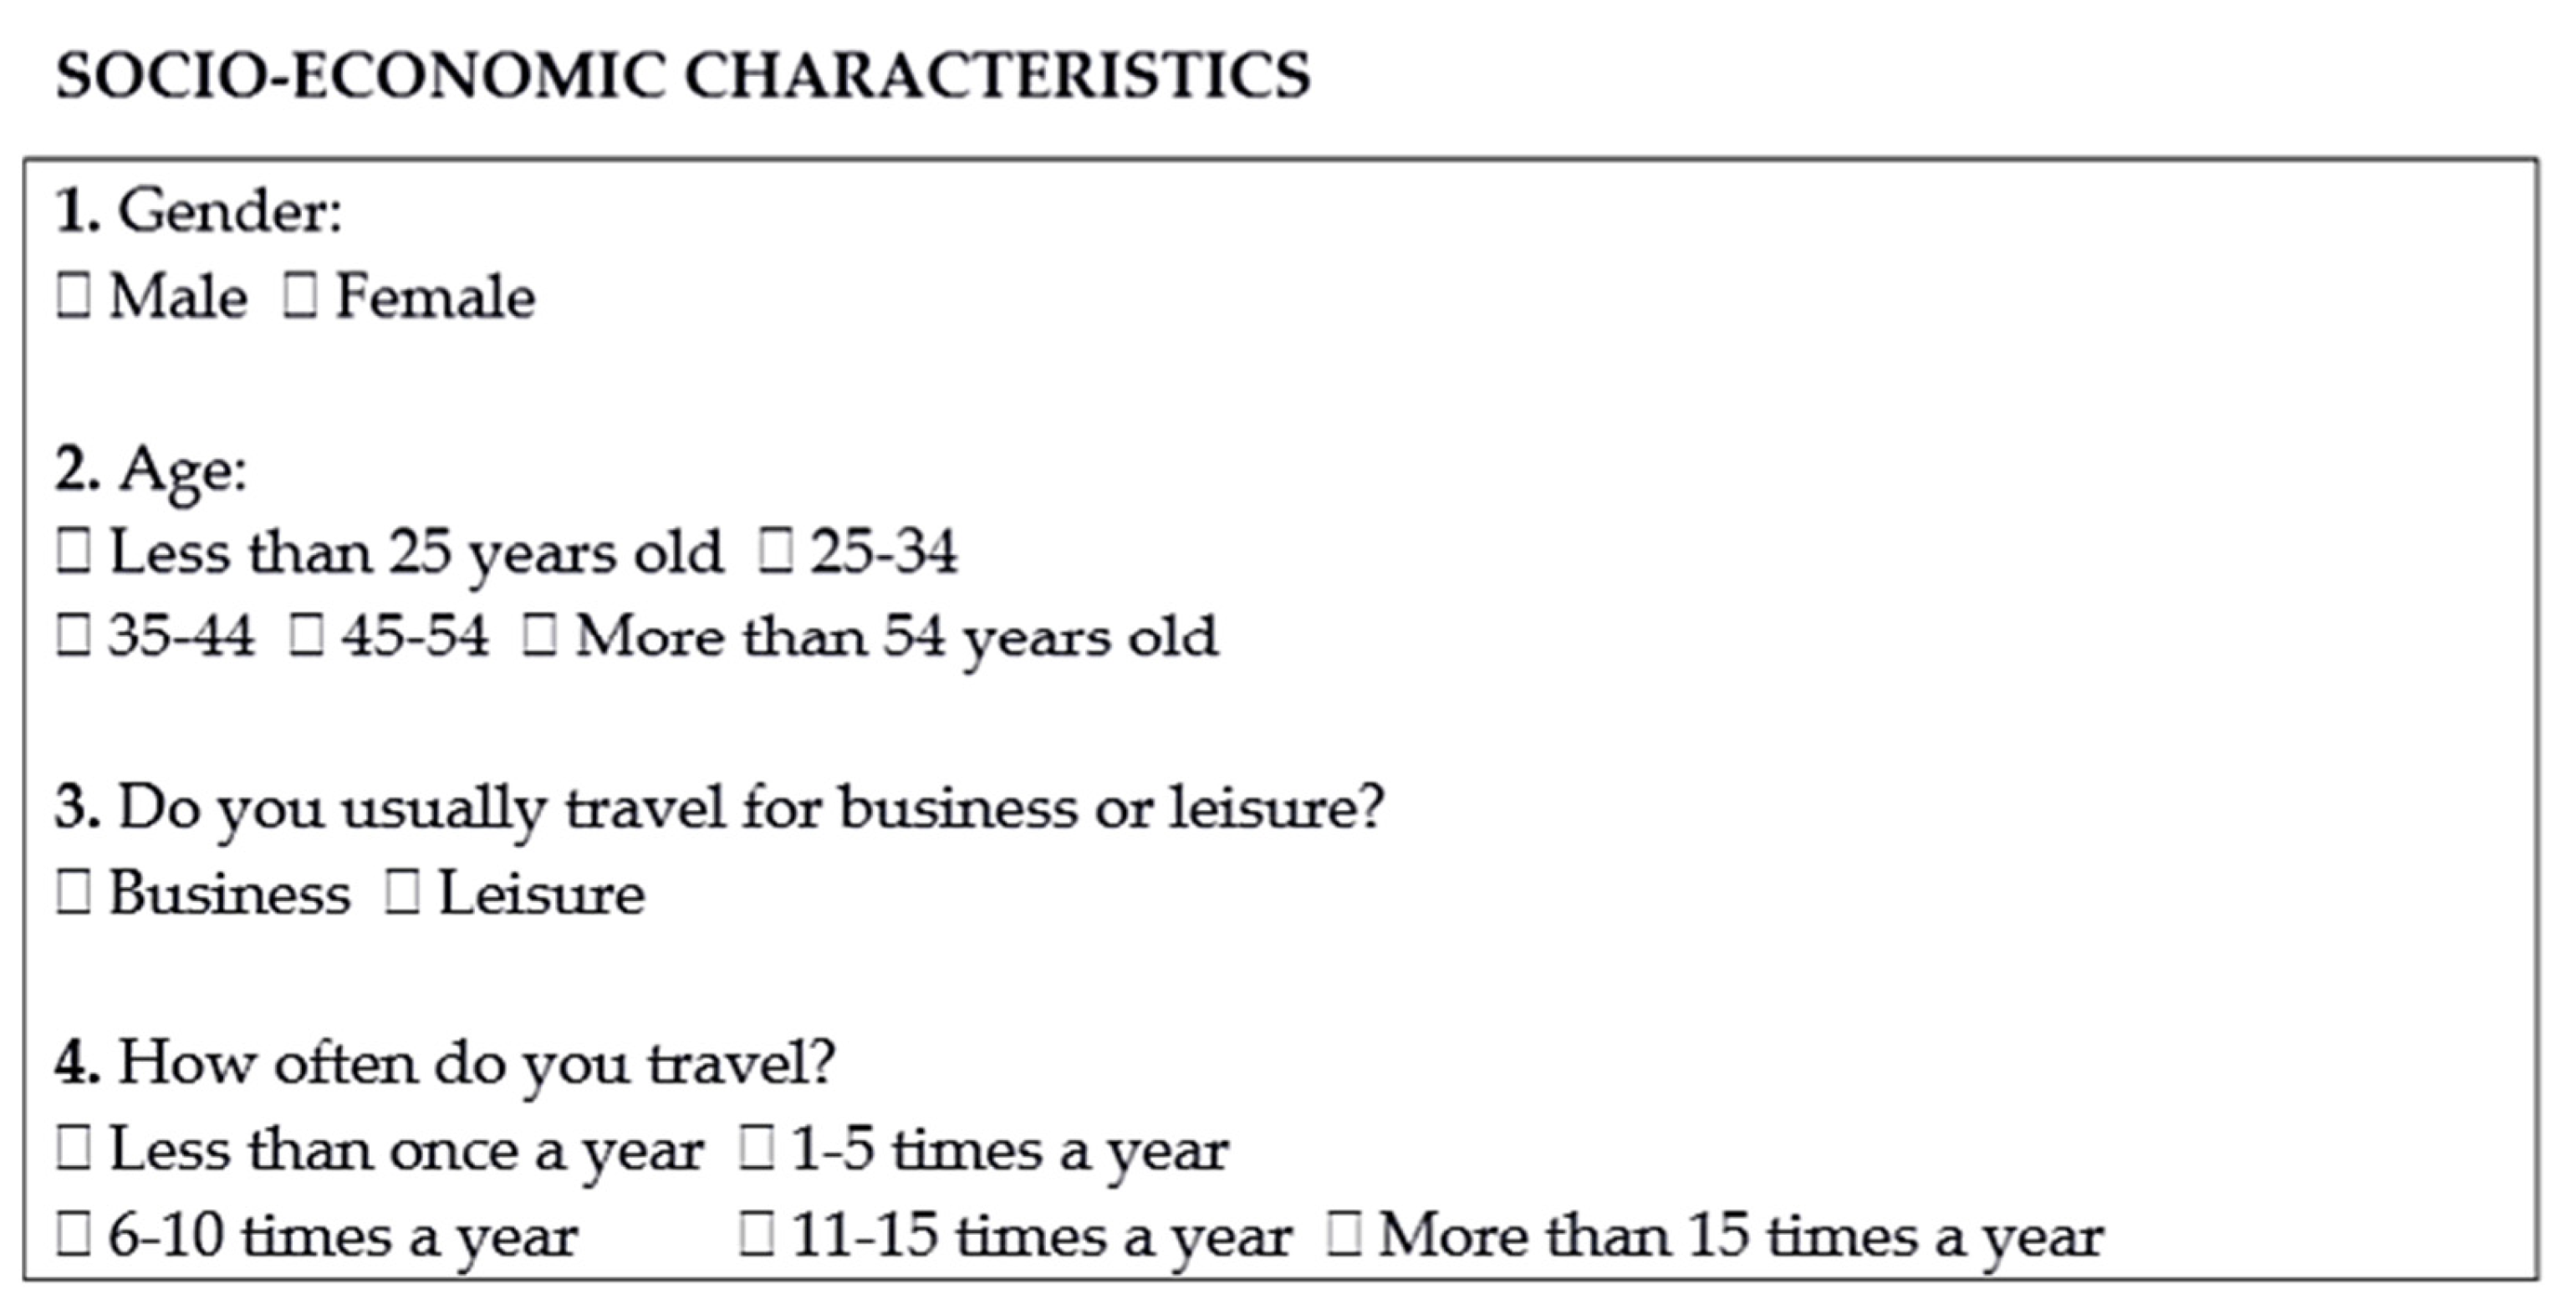
Figure A1. Socio-economic characteristics: gender, age, trip purpose and flight frequency.
Sustainability 13 05636 g0a1
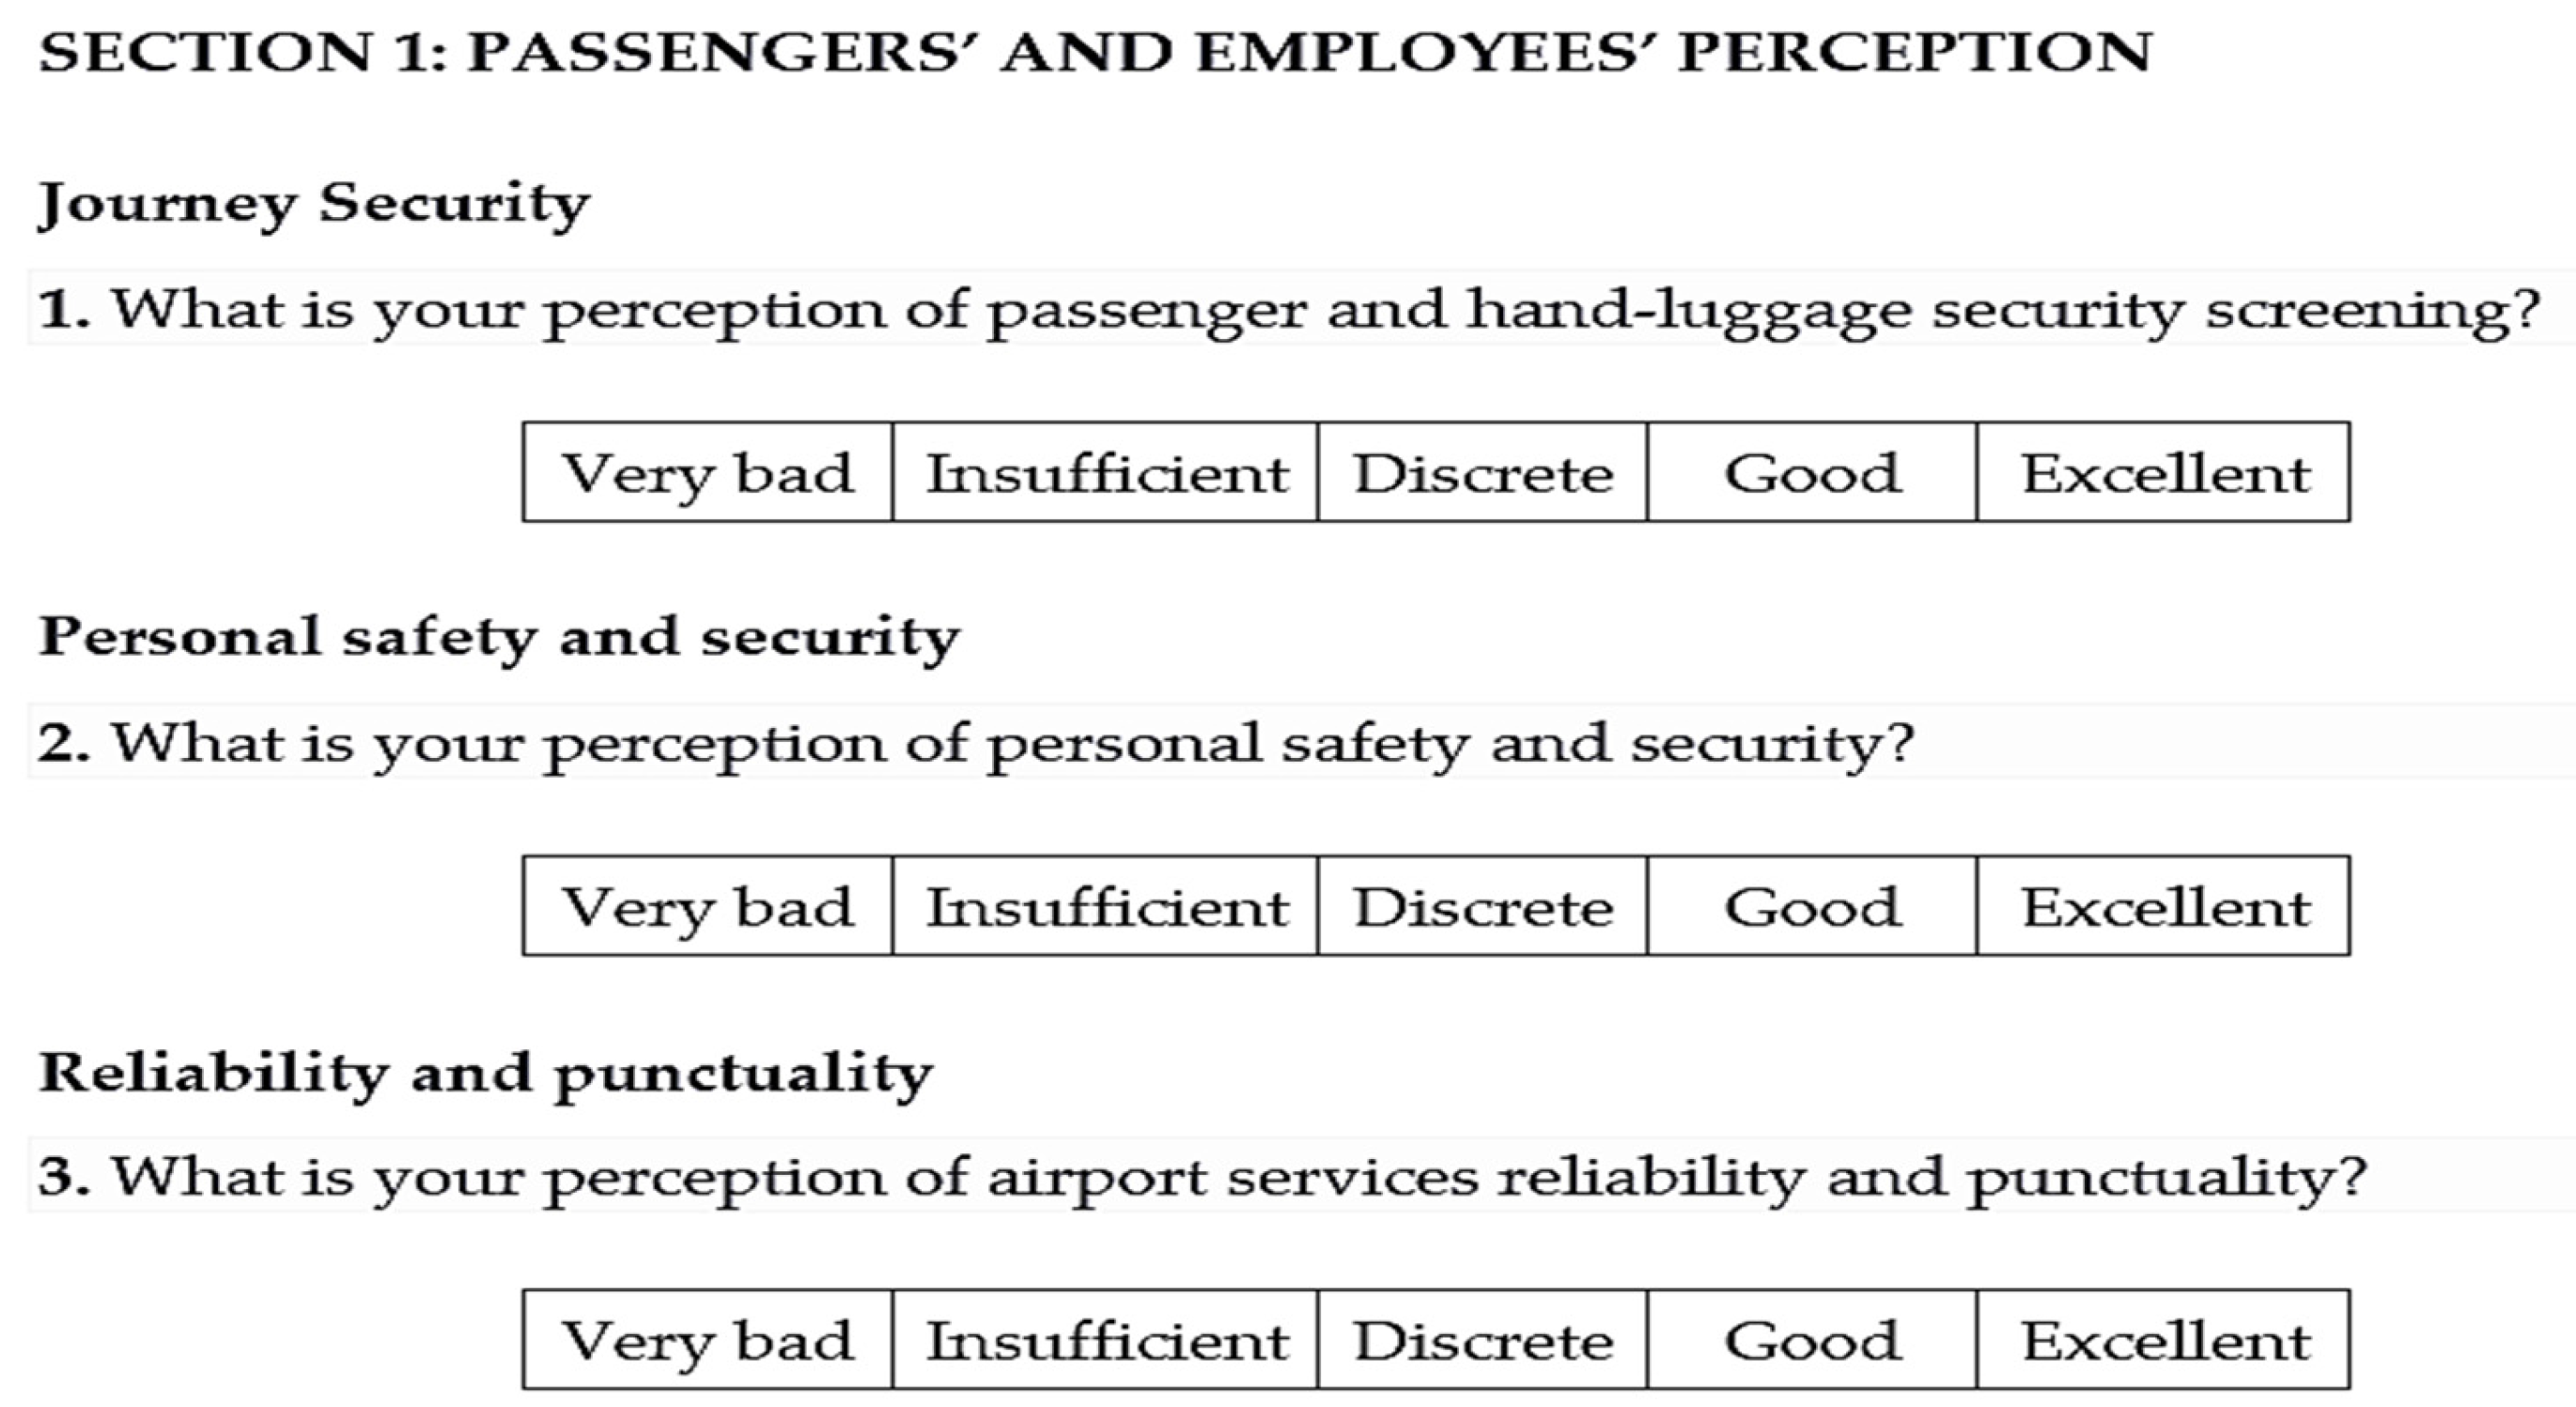
Figure A2. Section 1. Quality factor: journey security, personal safety and security, reliability and punctuality.
Sustainability 13 05636 g0a2
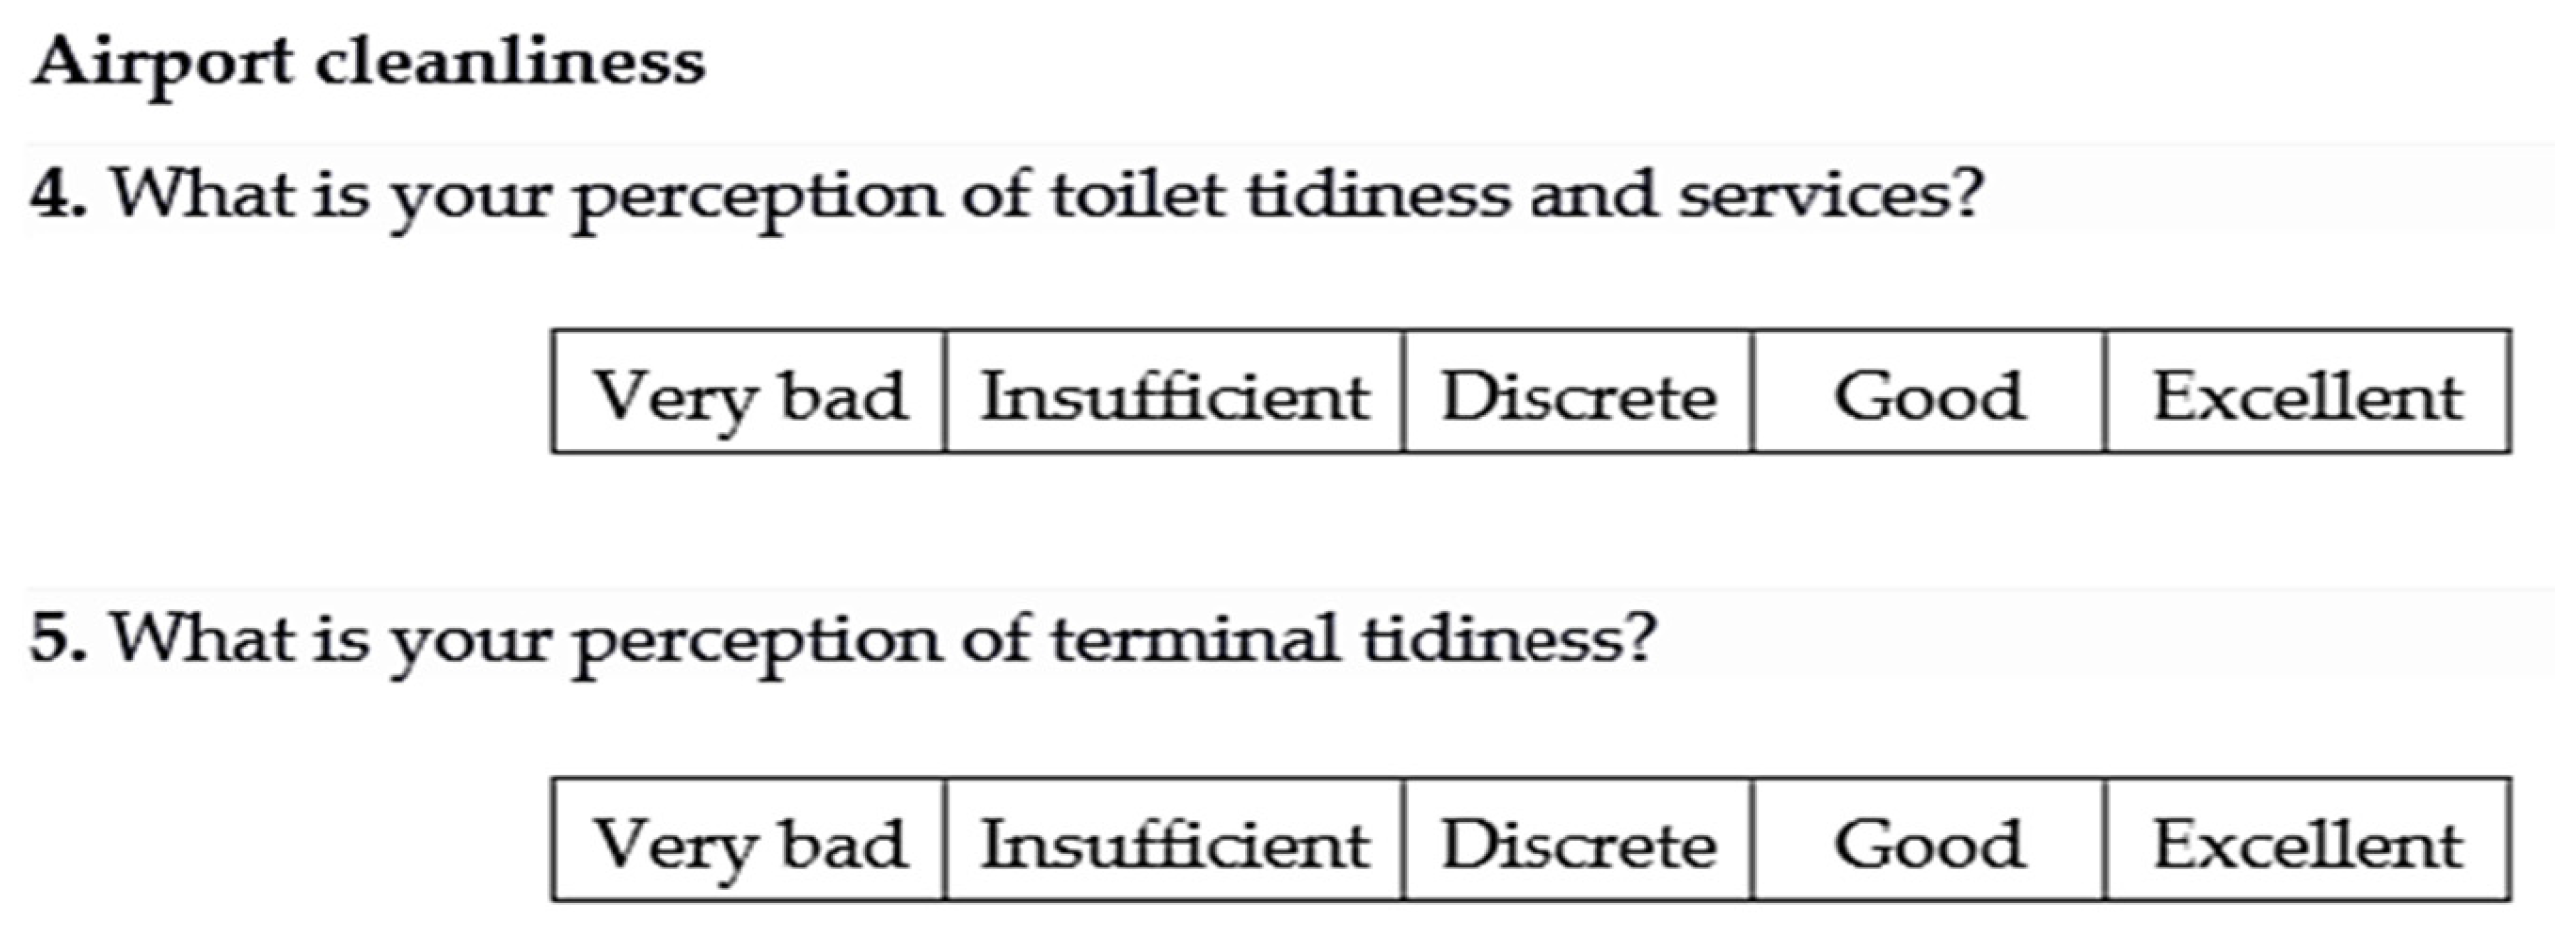
Figure A3. Section 1. Quality factor: airport cleanliness.
Sustainability 13 05636 g0a3
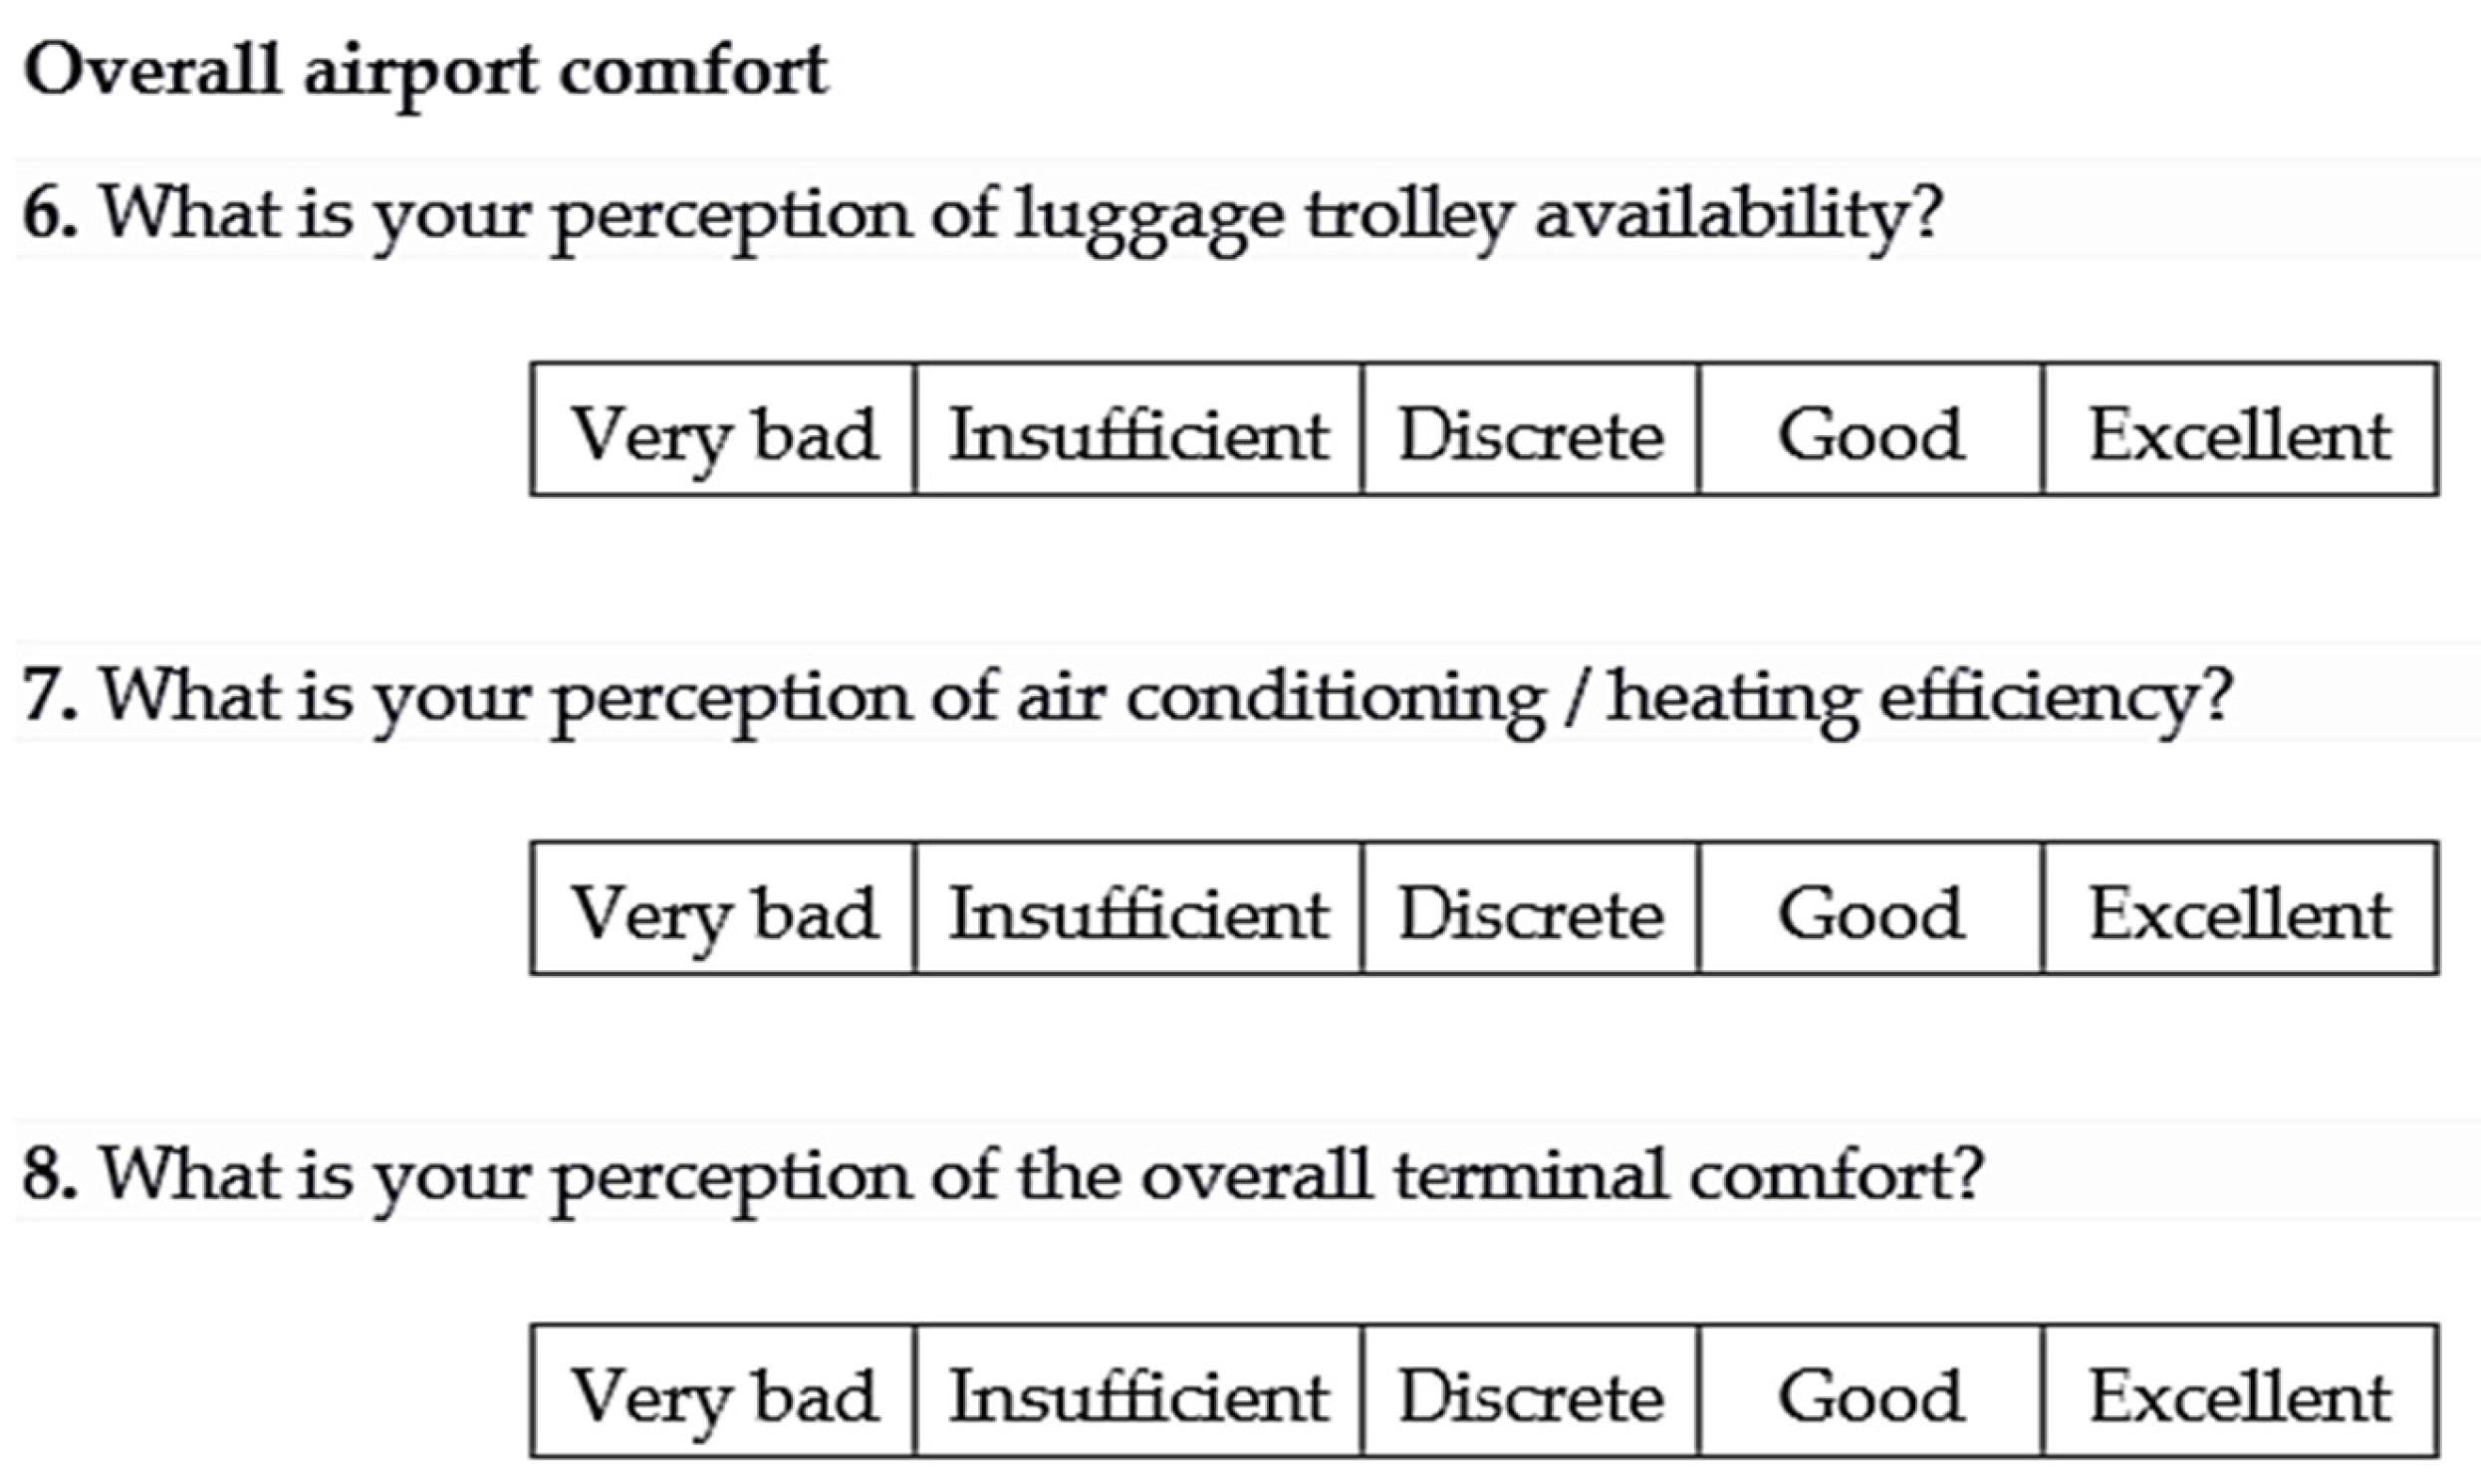
Figure A4. Section 1. Quality factor: Overall airport comfort.
Sustainability 13 05636 g0a4
Figure A5. Section 1. Quality factor: additional services.
Sustainability 13 05636 g0a5
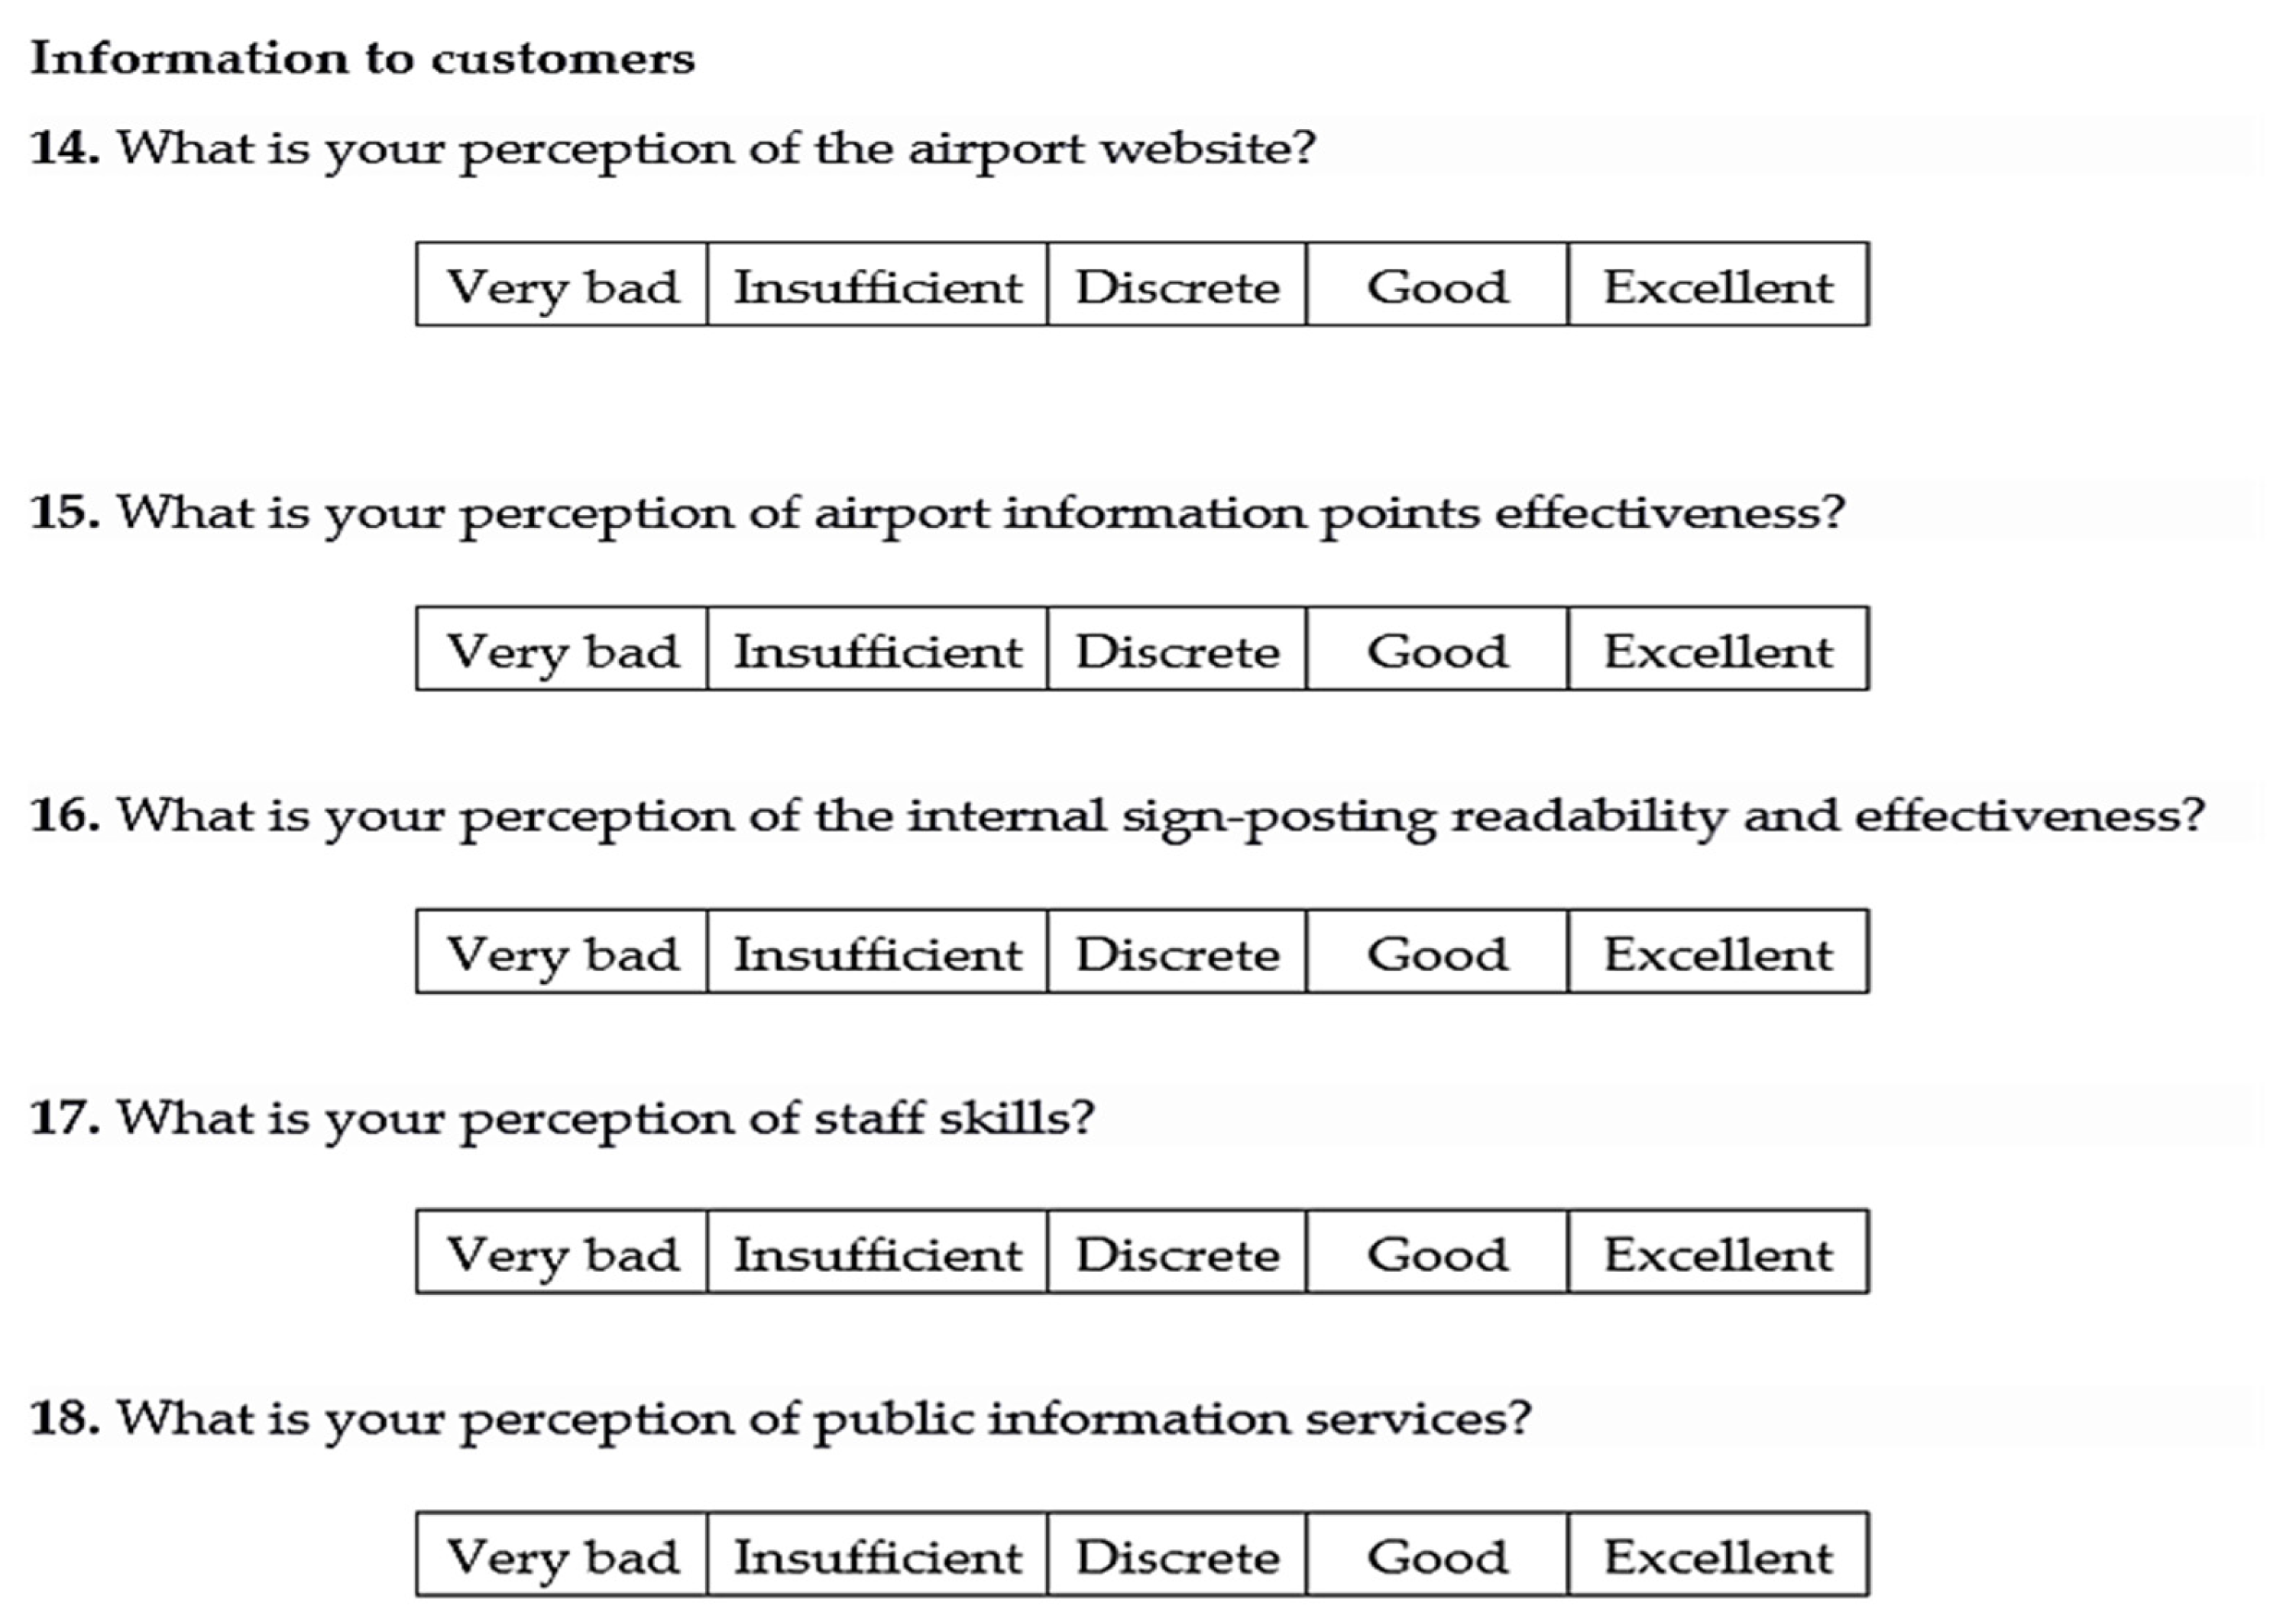
Figure A6. Section 1. Quality factor: information to customers.
Sustainability 13 05636 g0a6
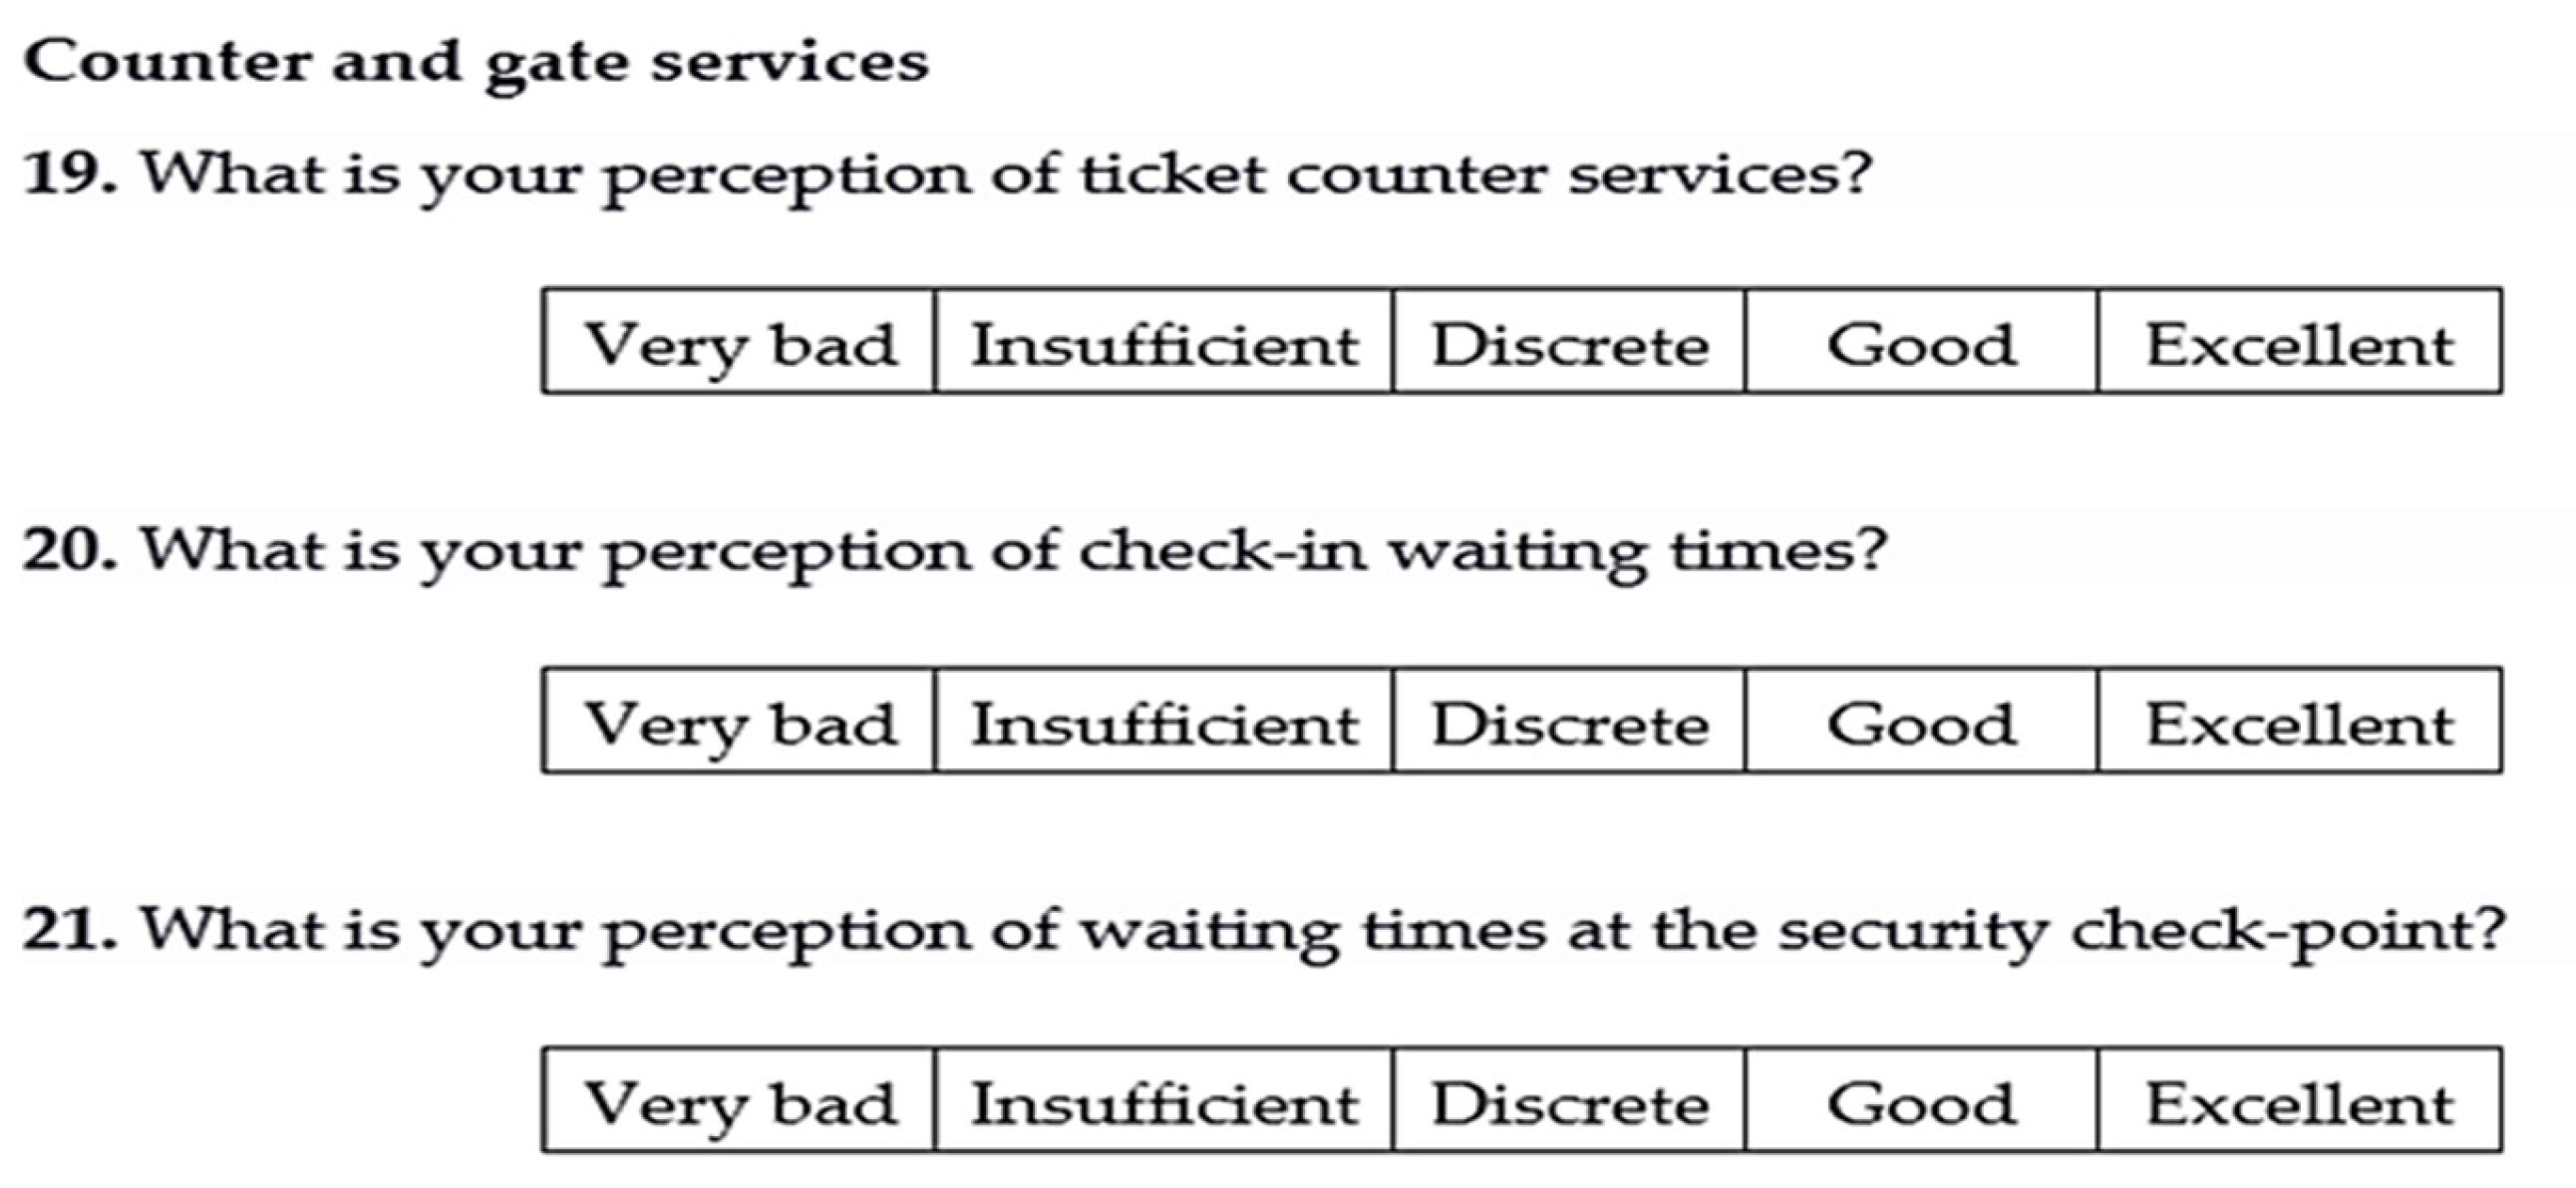
Figure A7. Section 1. Quality factor: counter and gate services.
Sustainability 13 05636 g0a7
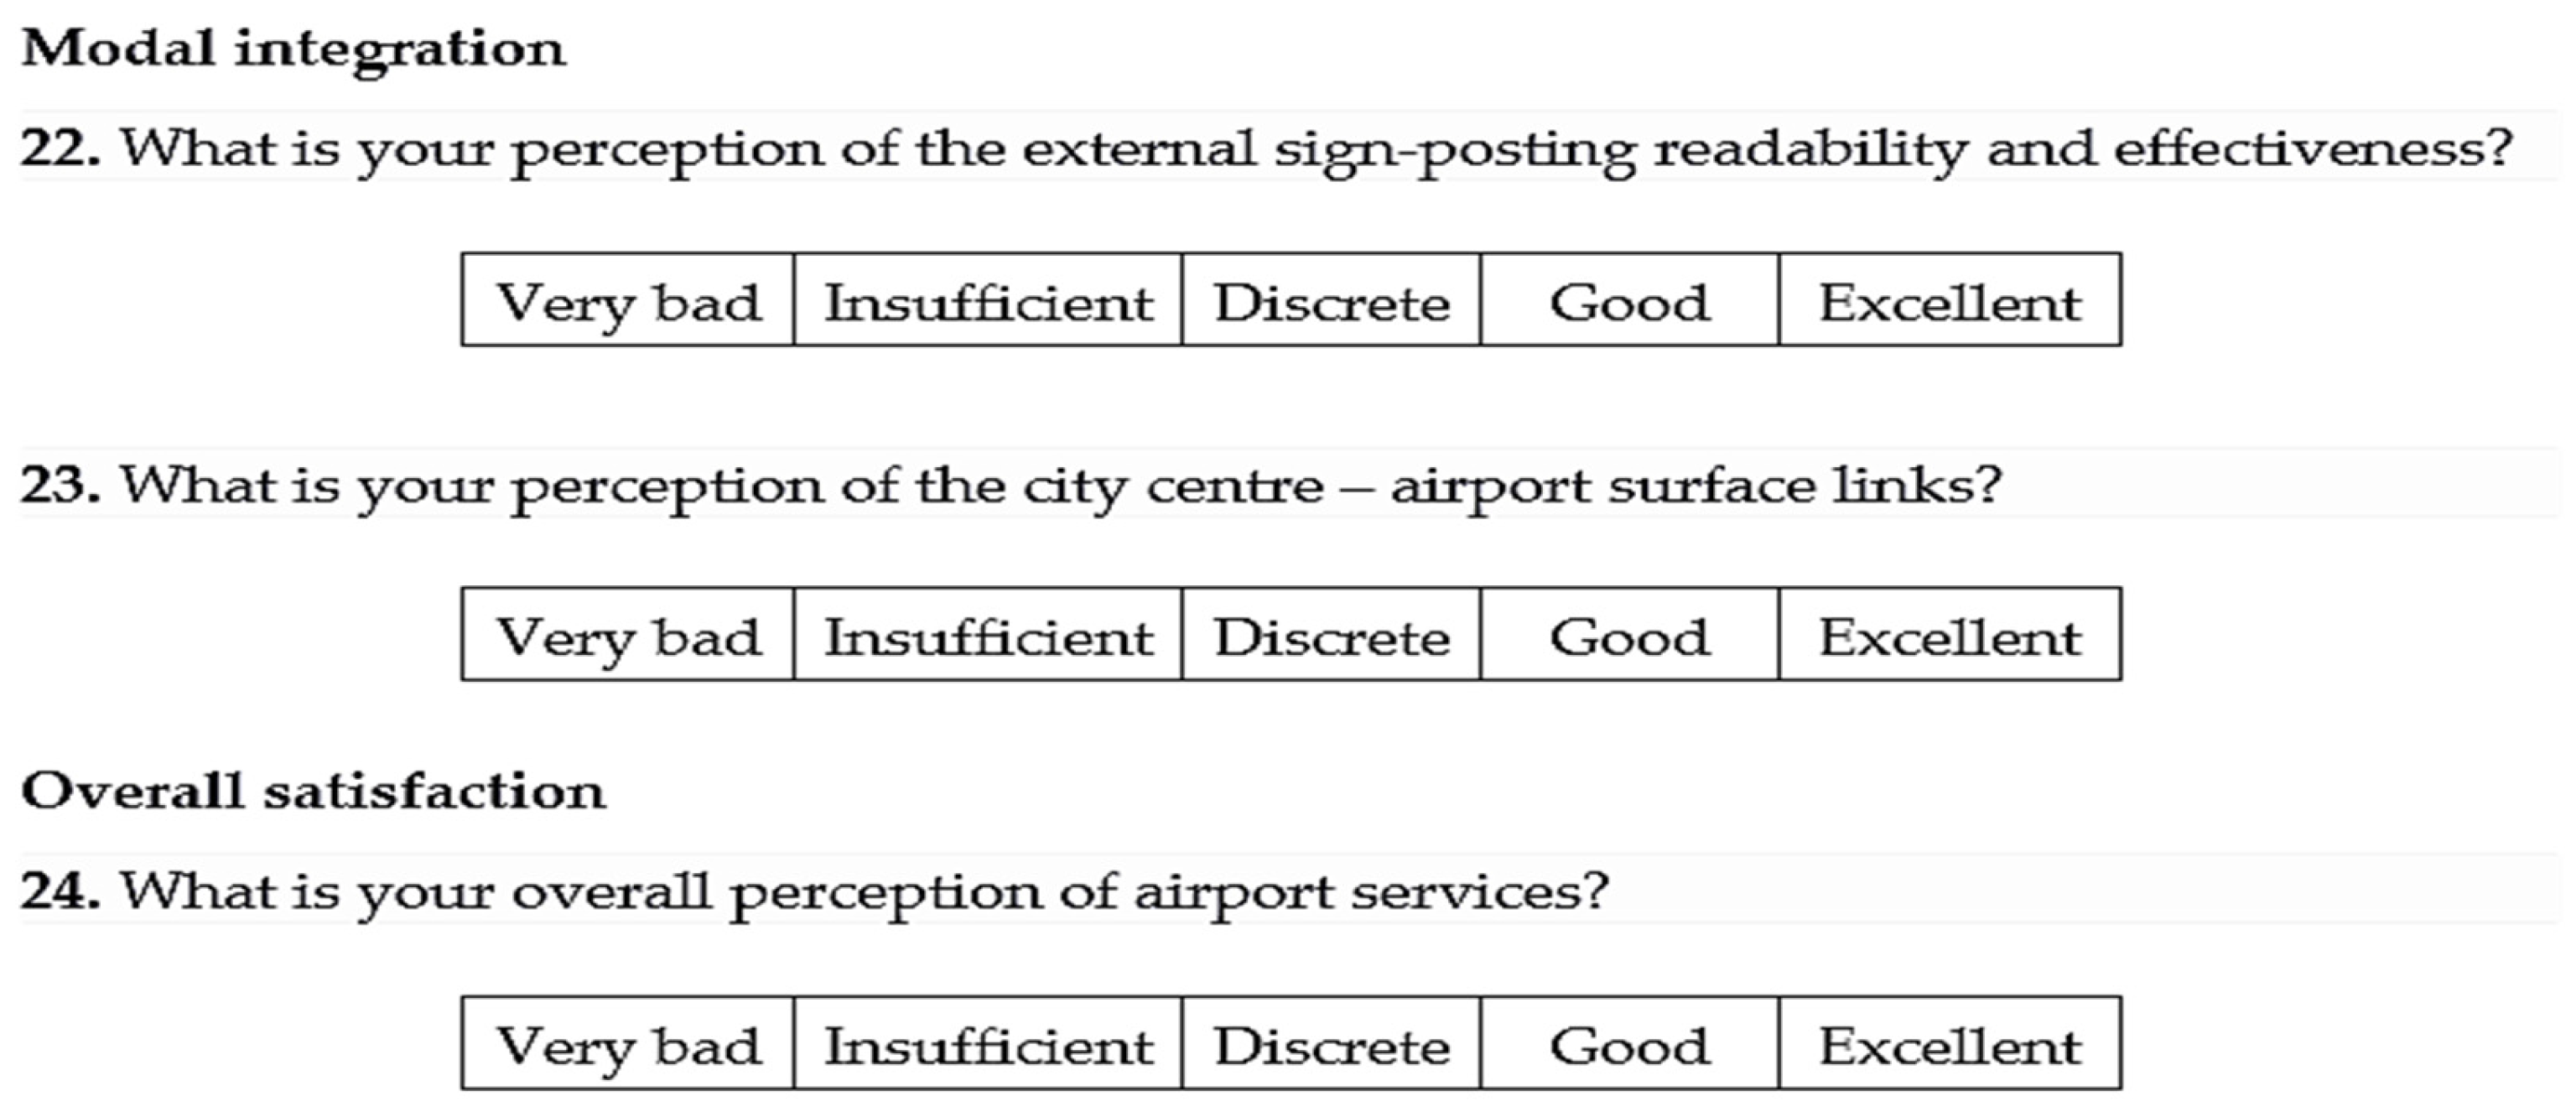
Figure A8. Section 1. Quality factor: modal integration and overall satisfaction.
Sustainability 13 05636 g0a8
Figure A9. Section 2. Category: corporate mission and organizational structure.
Sustainability 13 05636 g0a9
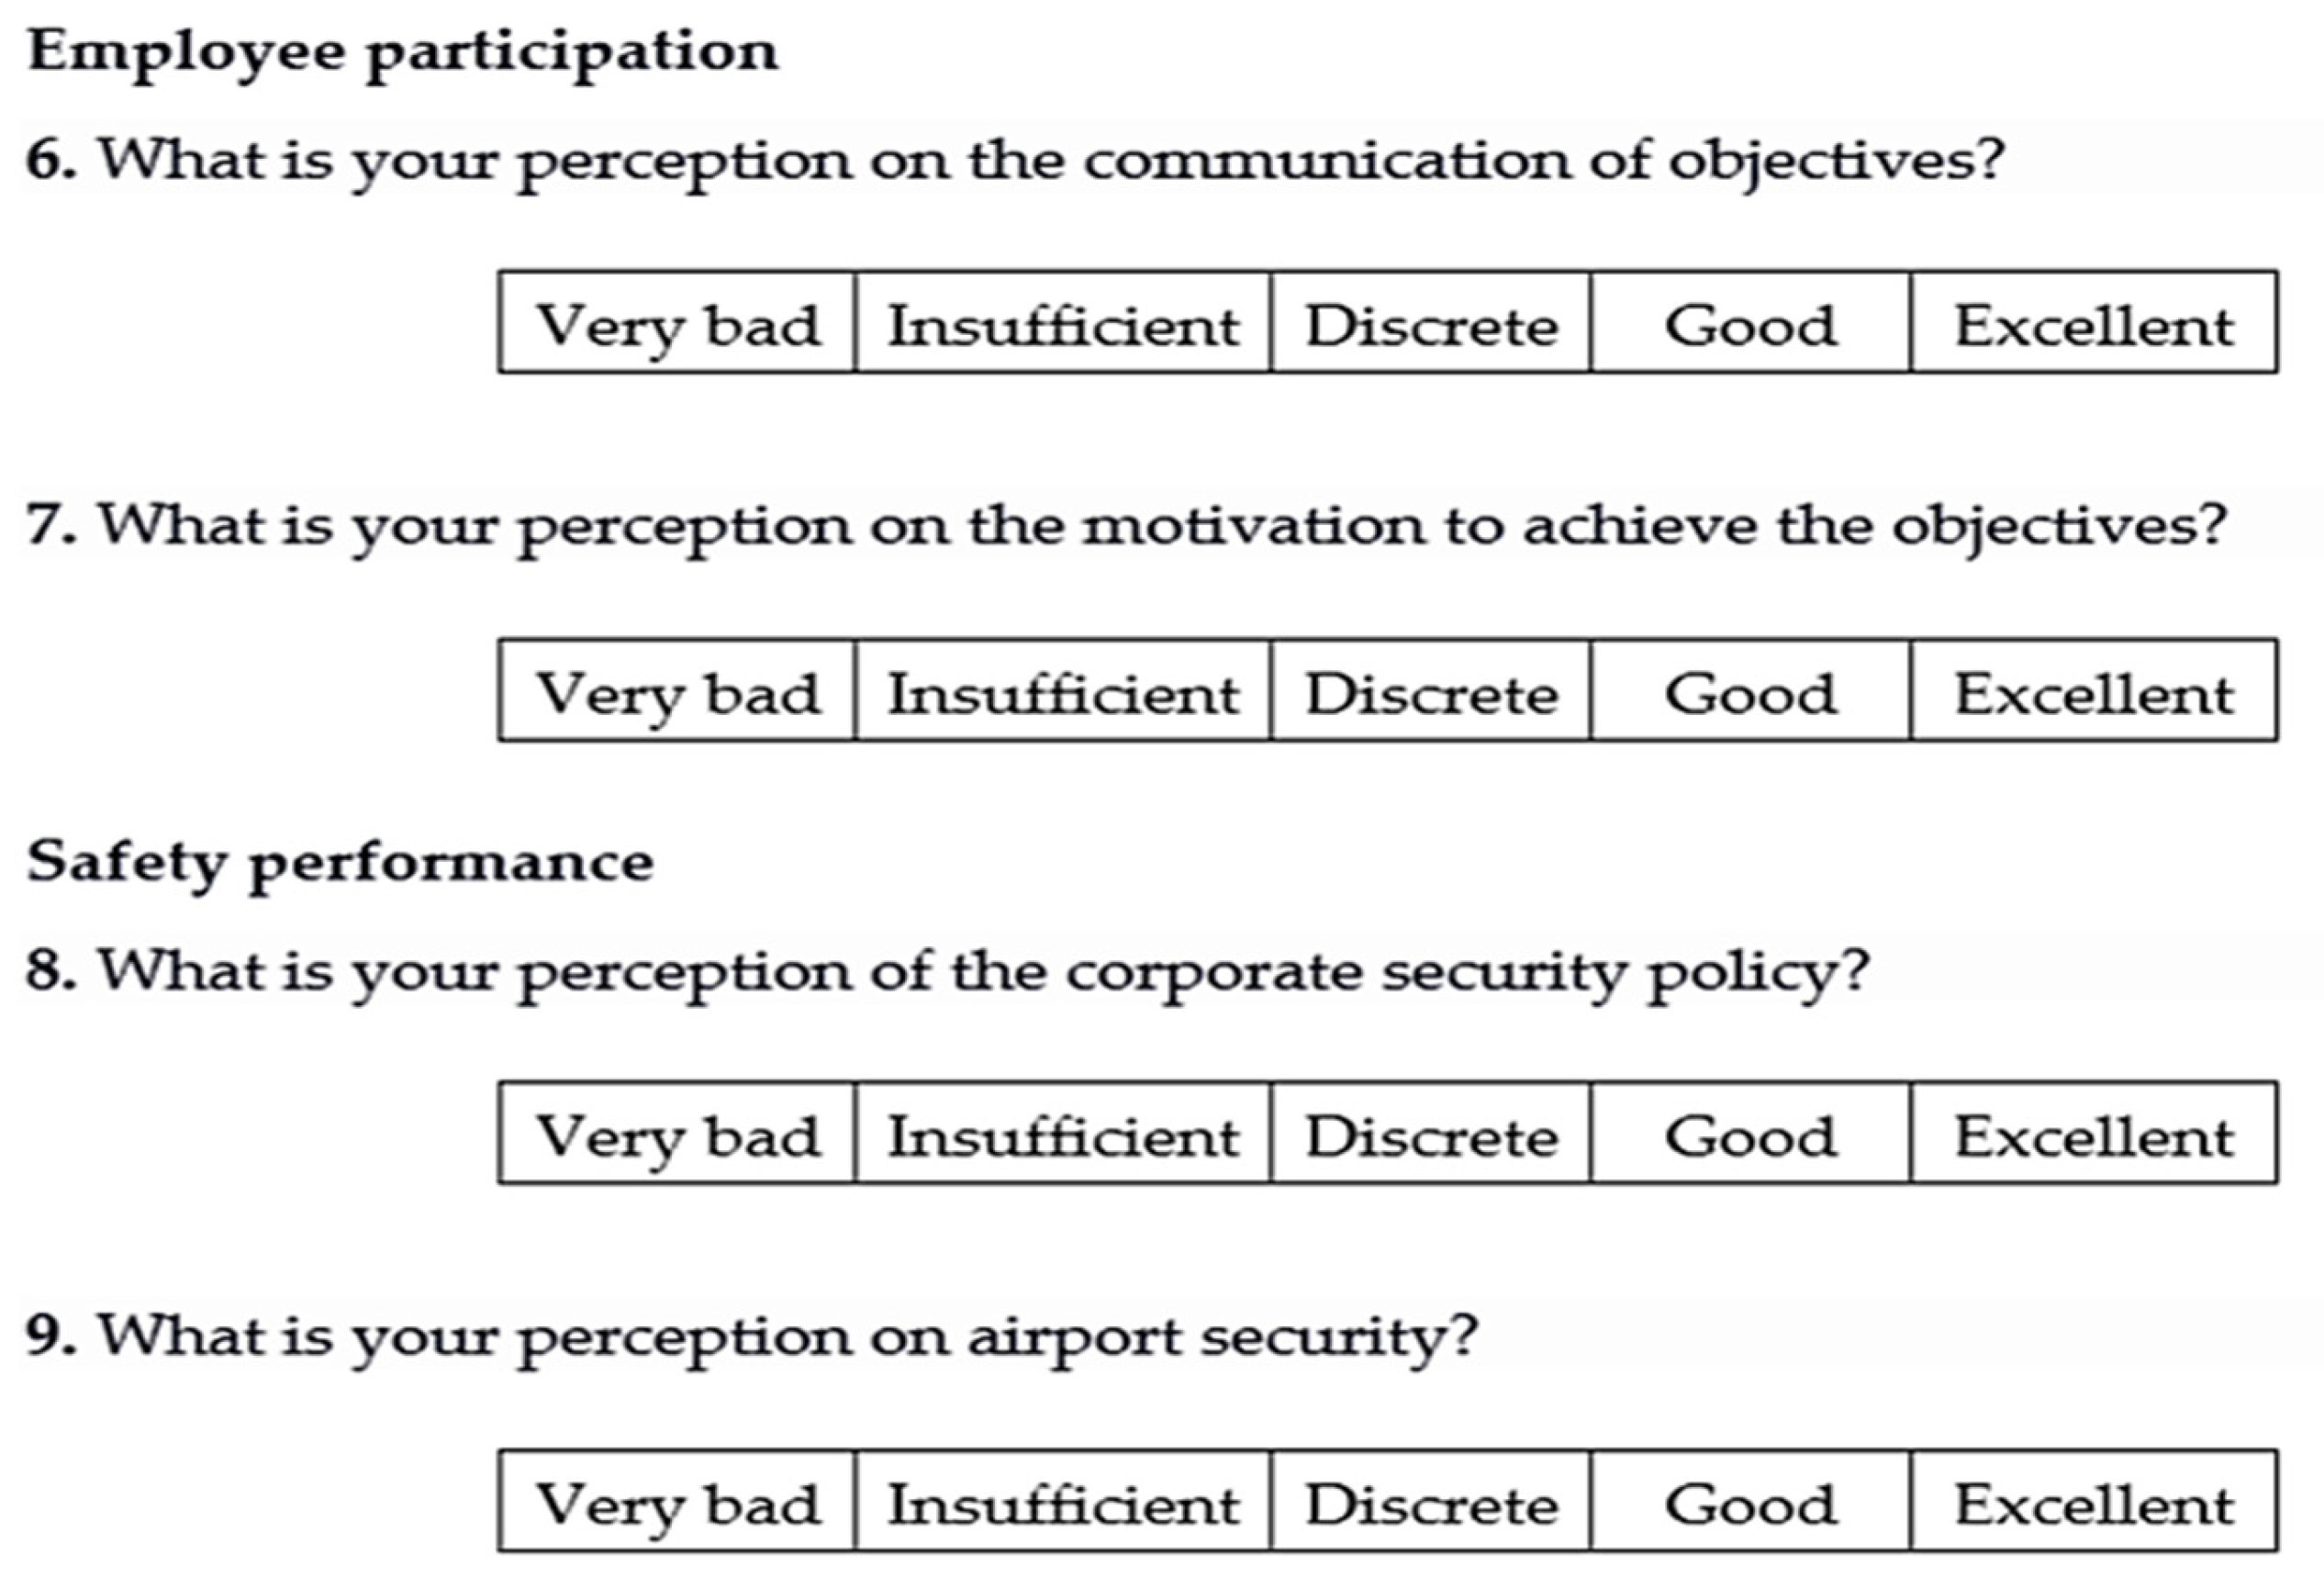
Figure A10. Section 2. Category: Employee participation and safety performance.
Sustainability 13 05636 g0a10
Figure A11. Section 3: managers’ perspective.
Sustainability 13 05636 g0a11

References

  1. Bezerra, C.L.; Gomes, C.F. The effects of service quality dimensions and passenger characteristics on passenger’s overall satisfaction with an airport. J. Air Transp. Manag. 2015, 44–45, 77–81. [Google Scholar] [CrossRef]
  2. Wilson, A.; Zeithaml, V.A.; Bitner, M.J.; Gremler, D.D. Services Marketing: Integrating Customer Focus Across the Firm, 2nd ed.; McGraw-Hill: Berkshire, UK, 2012. [Google Scholar]
  3. Fodness, D.; Murray, B. Passengers’ expectations of airport service quality. J. Serv. Mark. 2007, 21, 492–506. [Google Scholar] [CrossRef]
  4. Shahzad, N. Impact of employee motivation on customer satisfaction: Study of airline industry in Pakistan. J. Forensic Psych. 2018, 3, 1–5. [Google Scholar] [CrossRef]
  5. Yeh, C.-H.; Kuo, Y.-L. Evaluating passenger services of Asia-Pacific international airports. Transp. Res. E 2003, 39, 35–48. [Google Scholar] [CrossRef]
  6. Developing Key Performance Indicators for Airports—DiVA. Available online: http://liu.diva-portal.org/smash/get/diva2:618079/FULLTEXT01.pdf (accessed on 10 January 2021).
  7. Paraschi, E.; Georgopoulos, A. Airport Business Excellence Model: Development and First Application. SSRN 2016, 1–45. [Google Scholar] [CrossRef]
  8. Sarter, N.B.; Alexander, H.M. Error Types and Related Error Detection Mechanisms in the Aviation Domain: An Analysis of Aviation Safety Reporting System Incident Reports. Int. J. Aviat. Psychol. 2000, 10, 189–206. [Google Scholar] [CrossRef]
  9. Jun, I.; Hong, S.-J. An evaluation of the service quality priorities of air cargo service providers and customers. J. Korean Soc. Transp. 2004, 22, 35–45. [Google Scholar]
  10. Lemer, A. Measuring performance of airport passenger terminals. Transp. Res. A Policy Pract. 1992, 26, 37–45. [Google Scholar] [CrossRef]
  11. Seneviratne, P.N.; Martel, N. Criteria for evaluating quality of service in air terminals. Transp. Res. 1994, 1461, 24–30. [Google Scholar]
  12. Paraschi, E.P.; Georgopoulos, A.; Kaldis, P. Airport business excellence model: A holistic performance management system. Tour. Manag. 2019, 72, 352–372. [Google Scholar] [CrossRef]
  13. Zhen, F.; Cao, J.; Tang, J. Exploring correlates of passenger satisfaction and service improvement priorities of the Shanghai-Nanjing High Speed Rail. J. Transp. Land Use 2018, 11, 559–573. [Google Scholar] [CrossRef] [Green Version]
  14. Leva, M.C.; Del Sordo, D.; Mattei, F. Day-to-day performance management in a small regional airport and management of change for safer operations. Cogn. Tech. Work 2015, 17, 237–248. [Google Scholar] [CrossRef]
  15. Hong, S.-J.; Choi, D.; Chae, J. Exploring different airport users’ service quality satisfaction between service providers and air travelers. J. Retail. Consum. Serv. 2020, 52, 101917. [Google Scholar] [CrossRef]
  16. Eygu, H.; Gulluce, A.C. Determination of Customer Satisfaction in Conservative Concept Hotels by Ordinal Logistic Regression Analysis. J. Financial Risk Manag. 2017, 6, 269–284. [Google Scholar] [CrossRef] [Green Version]
  17. Lu, M. Determinants of Residential Satisfaction: Ordered Logit vs. Regression Models. Growth Chang. 1999, 30, 264–287. [Google Scholar] [CrossRef]
  18. Lawson, C.; Montgomery, D.C. Logistic Regression Analysis of Customer Satisfaction Data. Qual. Reliab. Eng. Int. 2006, 22, 971–984. [Google Scholar] [CrossRef]
  19. Public Service Charter of Abruzzo Airport, 2020 Edition. Available online: http://www.abruzzoairport.com/web/guest/carta-dei-servizi (accessed on 17 September 2020).
  20. D’Alonzo, L.; Leva, M.C.; Bucciarelli, E.; Mattoscio, N. Evaluating the Behavioural Impact of Risk Exposure and Quality of Services Attributes on Preferences of Airline Customers: A Choice Behaviour Experiment. In Decision Economics: Minds, Machines, and Their Society; Bucciarelli, E., Chen, S.-H., Corchado, J.M., Parra, J., Eds.; Springer-Nature: Cham, Switzerland, 2021. [Google Scholar]
  21. Eboli, L.; Mazzulla, G. An ordinal logistic regression model for analysing airport passenger satisfaction. EuroMed J. Bus. 2009, 4, 40–57. [Google Scholar] [CrossRef]
  22. Meng, M.; Rau, A.; Mahardhika, H. Public transport travel time perception: Effects of socioeconomic characteristics, trip characteristics and facility usage. Transp. Res. A 2018, 114, 24–37. [Google Scholar] [CrossRef]
  23. Heinrich, H.W.; Granniss, E. Industrial Accident Prevention, 4th ed.; McGraw-Hill: New York, NY, USA, 1959. [Google Scholar]
  24. Chappell, S. Using voluntary incident reports for human factors evaluations. In Aviation Psychology in Practice; Johnston, N., McDonald, N., Fuller, R., Eds.; Routledge: New York, NY, USA, 2017; pp. 149–172. [Google Scholar]
  25. Mandatory Occurrence Reporting—SKYbrary Aviation Safety. Available online: https://www.skybrary.aero/index.php/Mandatory_Occurrence_Reporting (accessed on 19 December 2020).
  26. Douglas, E.; Leva, M.C.; Cromie, S. The Identification of Assessment Criteria for a Safety Reporting Self-Assessment Tool. In Proceedings of the Irish Ergonomics Conference, Dublin, Ireland, 30 June 2015. [Google Scholar]
  27. Douglas, E.; Cromie, S.; Leva, M.C.; Balfe, N. Modelling the Reporting Culture within a Modern Organization. Chem. Eng. Trans. 2014, 36, 589–594. [Google Scholar] [CrossRef]
  28. Clancy, P.; Leva, M.C.; Hrymak, V.; Sherlock, M. Safety and or hazard near miss reporting in an international energy company. In Proceedings of the Irish Ergonomics Society Annual Conference, Dublin, Ireland, 9 June 2011. [Google Scholar]
  29. Kongsvik, T.; Fenstad, J.; Wendelborg, C. Between a rock and a hard place: Accident and near-miss reporting on offshore service vessels. Saf. Sci. 2012, 50, 1839–1846. [Google Scholar] [CrossRef]
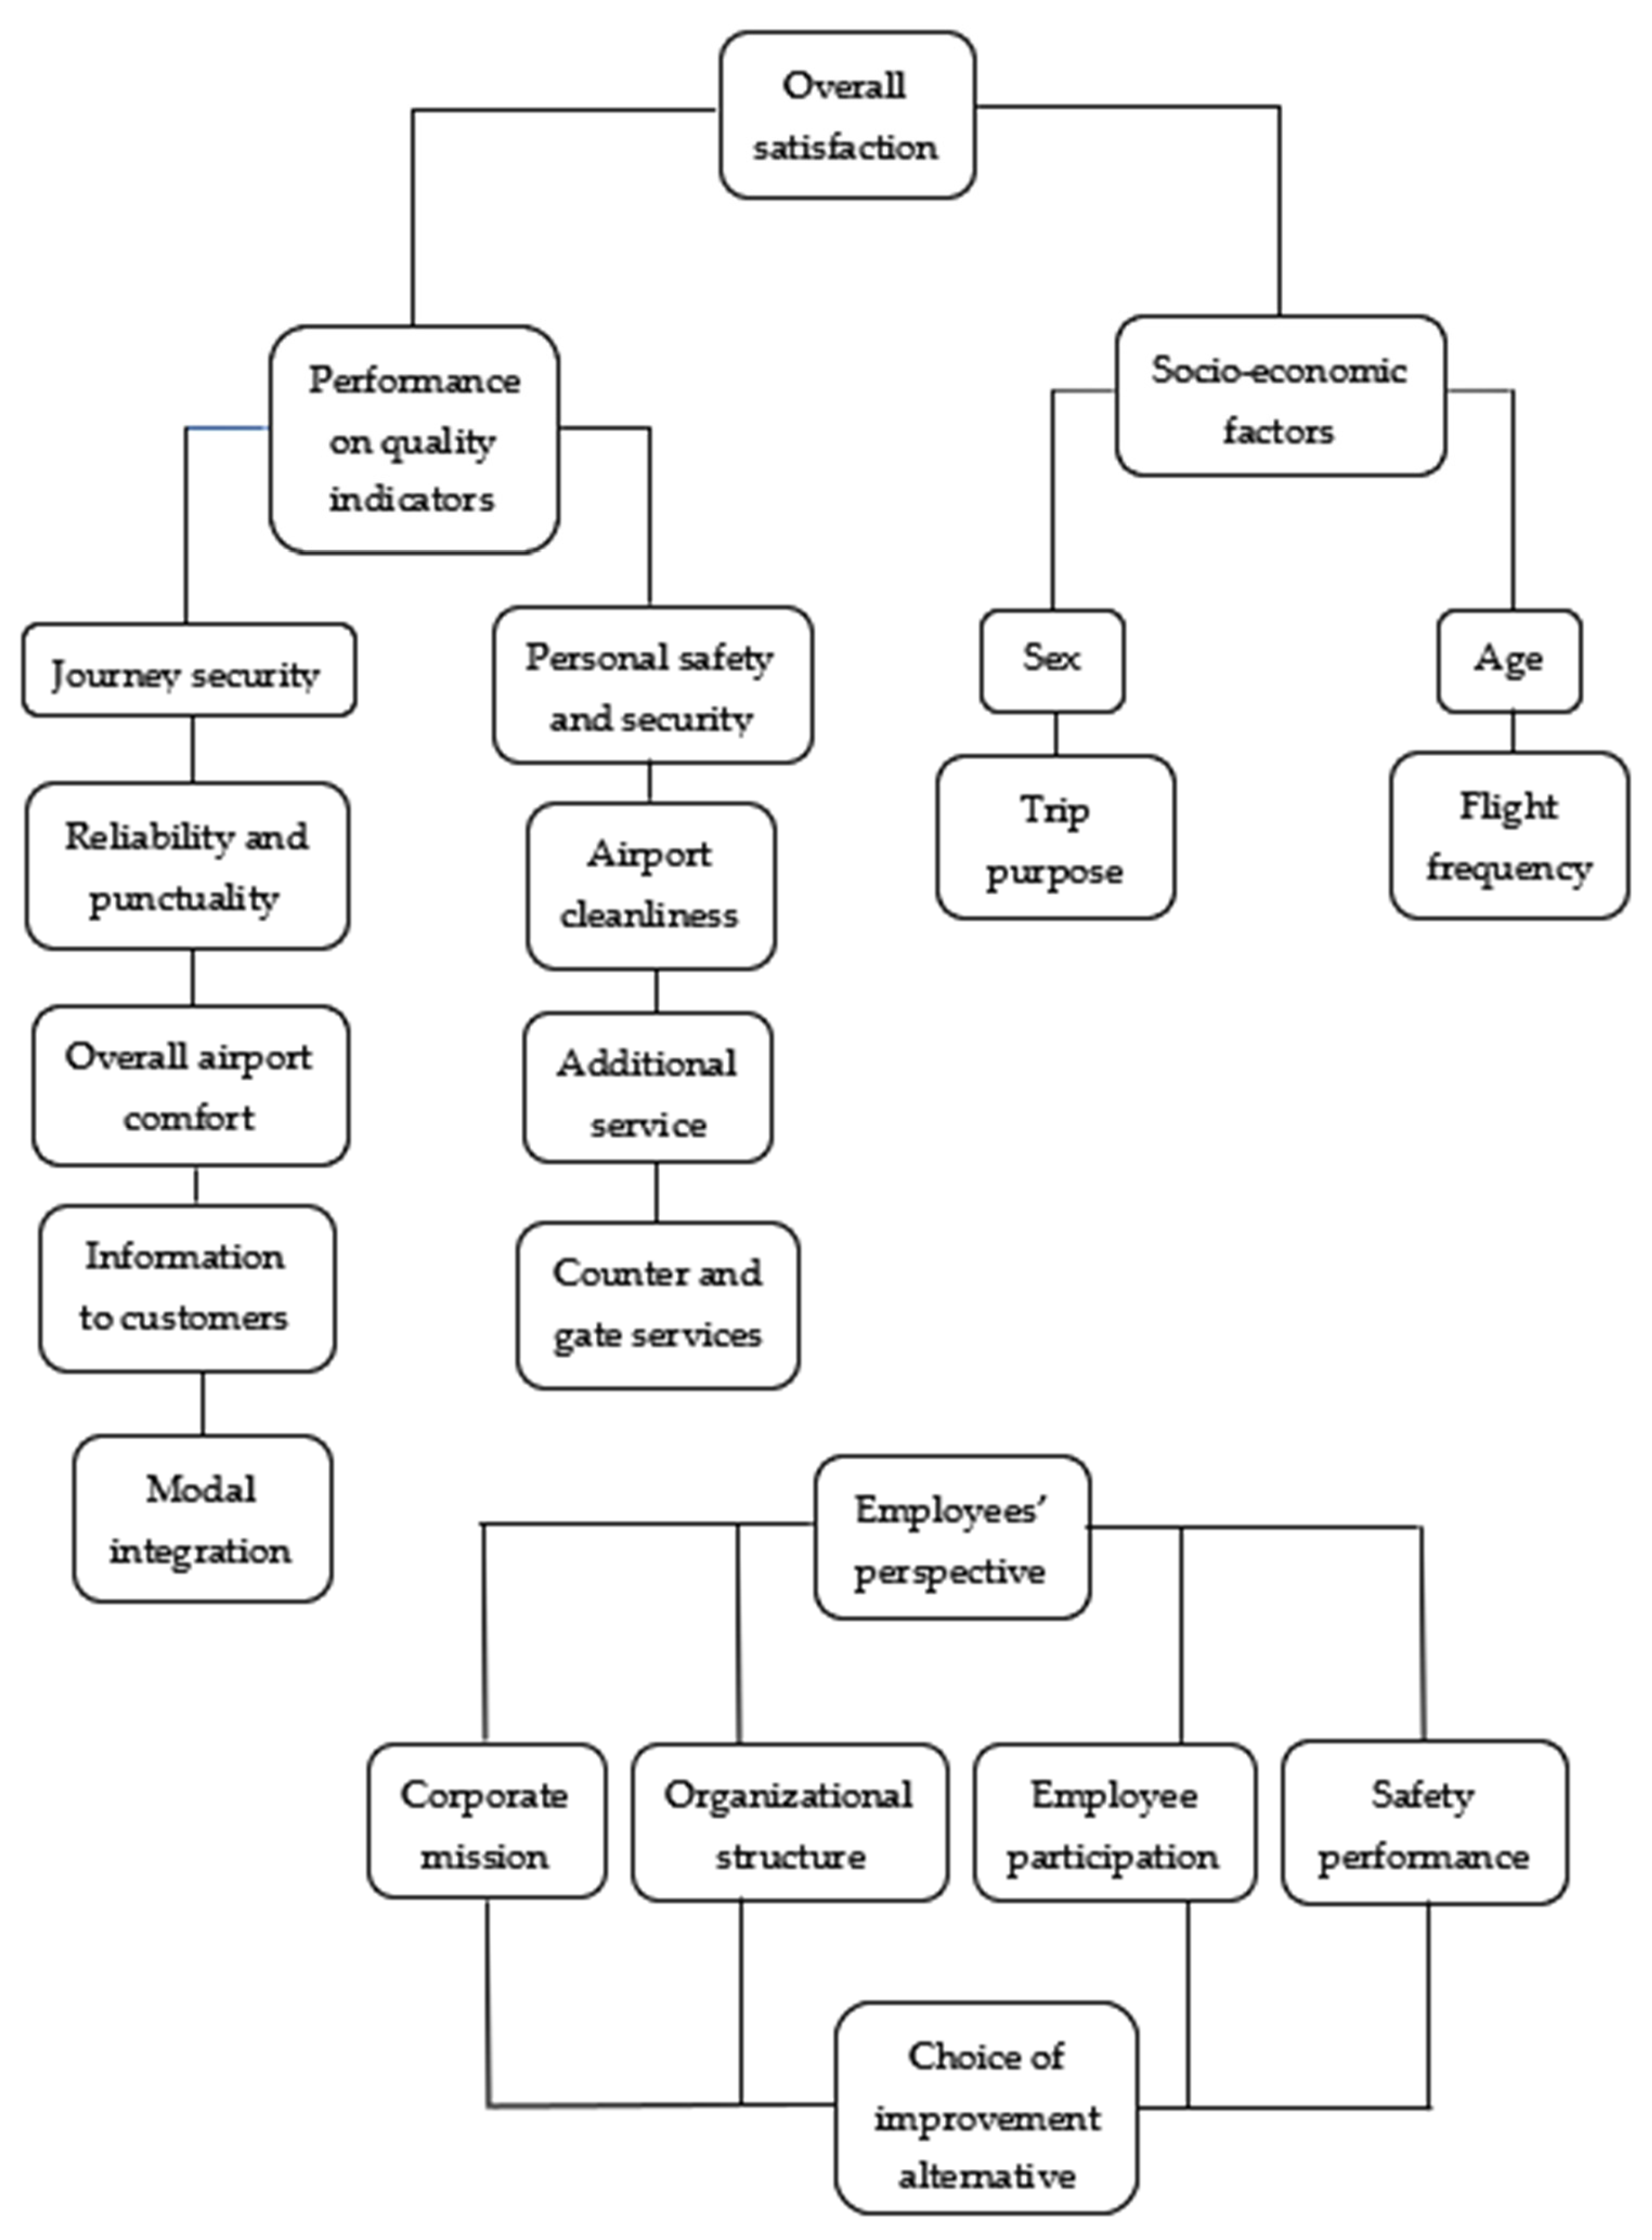
Figure 1. The structure of the field study considering the areas where both passengers and employees expressed their satisfaction and the extra areas included for employees also reported from the managers’ perspective.
Sustainability 13 05636 g001
Figure 2. (a) Relative frequency distribution of passengers’ perceptions related to “Airport security”; (b) relative frequency distribution of employees’ perceptions related to “Airport security”.
Sustainability 13 05636 g002
Figure 3. (a) Relative frequency distribution of passengers’ perceptions related to “Airport service punctuality”; (b) relative frequency distribution of employees’ perceptions related to “Airport service punctuality”.
Sustainability 13 05636 g003
Figure 4. (a) Relative frequency distribution of passengers’ perceptions related to “Terminal tidiness”; (b) relative frequency distribution of employees’ perceptions related to “Terminal tidiness”.
Sustainability 13 05636 g004
Figure 5. (a) Relative frequency distribution of passengers’ perceptions related to “Luggage trolley availability”; (b) relative frequency distribution of employees’ perceptions related to “Luggage trolley availability”.
Sustainability 13 05636 g005
Figure 6. (a) Relative frequency distribution of passengers’ perceptions related to “Air conditioning”; (b) relative frequency distribution of employees’ perceptions related to “Air conditioning”.
Sustainability 13 05636 g006
Figure 7. (a) Relative frequency distribution of passengers’ perceptions related to “Wi-fi connectivity”; (b) relative frequency distribution of employees’ perceptions related to “Wi-fi connectivity”.
Sustainability 13 05636 g007
Figure 8. (a) Relative frequency distribution of passengers’ perceptions related to “Recharge points”; (b) relative frequency distribution of employees’ perceptions related to “Recharge points”.
Sustainability 13 05636 g008
Figure 9. (a) Relative frequency distribution of passengers’ perceptions related to “Bar and restaurant service”; (b) relative frequency distribution of employees’ perceptions related to “Bar and restaurant service”.
Sustainability 13 05636 g009
Figure 10. (a) Relative frequency distribution of passengers’ perceptions related to “Vending machines”; (b) relative frequency distribution of employees’ perceptions related to “Vending machines”.
Sustainability 13 05636 g010
Figure 11. (a) Relative frequency distribution of passengers’ perceptions related to “Airport website”; (b) relative frequency distribution of employees’ perceptions related to “Airport website”.
Sustainability 13 05636 g011
Figure 12. (a) Relative frequency distribution of passengers’ perceptions related to “Information points”; (b) relative frequency distribution of employees’ perceptions related to “Information points”.
Sustainability 13 05636 g012
Figure 13. (a) Relative frequency distribution of passengers’ perceptions related to “Internal sign-posting”; (b) relative frequency distribution of employees’ perceptions related to “Internal sign-posting”.
Sustainability 13 05636 g013
Figure 14. (a) Relative frequency distribution of passengers’ perceptions related to “Staff skills”; (b) relative frequency distribution of employees’ perceptions related to “Staff skills”.
Sustainability 13 05636 g014
Figure 15. (a) Relative frequency distribution of passengers’ perceptions related to “Ticket counter”; (b) relative frequency distribution of employees’ perceptions related to “Ticket counter”.
Sustainability 13 05636 g015
Figure 16. (a) Relative frequency distribution of passengers’ perceptions related to “Check-in waiting”; (b) relative frequency distribution of employees’ perceptions related to “Check-in waiting”.
Sustainability 13 05636 g016
Figure 17. (a) Relative frequency distribution of passengers’ perceptions related to “Airport surface links”; (b) relative frequency distribution of employees’ perceptions related to “Airport surface links”.
Sustainability 13 05636 g017
Figure 18. (a) Performance regarding the overall punctuality of Ryanair flights, grouped monthly (2019); (b) performance regarding the overall punctuality of Alitalia flights, grouped monthly (2019).
Sustainability 13 05636 g018
Figure 19. Trend of mandatory and voluntary events, reported from 2013 to 2020.
Sustainability 13 05636 g019
Figure 20. Estimated results obtained from Stata for the ordinal logistic regression (OLR), modeled by the stepwise selection method.
Sustainability 13 05636 g020
Figure 21. Odds ratios obtained from Stata for the ordinal logistic regression (OLR), modeled by the stepwise selection method.
Sustainability 13 05636 g021
Figure 22. (a) Distribution of the average perception of passengers grouped by sex; (b) distribution of the average perception of passengers grouped by age.
Sustainability 13 05636 g022
Figure 23. Overview of the percentage of responses indicating satisfaction above “Discrete”, obtained from the analysis of the employees’ survey results.
Sustainability 13 05636 g023
Table 1. Triangulation between passengers’ perception, employees’ perception and performance on quality indicators.
Quality FactorIndicatorPassengers’ PerceptionEmployees’ PerceptionTarget of Metrics for 2020
Journey SecuritySecurity screening0.921.000.90
Personal safety and securityPersonal safety and security0.921.000.90
Reliability and punctualityPunctuality0.911.000.90
Airport cleanlinessToilet tidiness0.770.920.89
Terminal tidiness0.890.900.88
Overall airport comfortLuggage trolley availability0.920.810.90
Air conditioning0.910.920.90
Overall comfort0.910.910.90
Additional serviceWi-Fi0.880.700.84
Recharge points0.840.770.80
Quality and prices of shops0.890.900.89
Bar and restaurant0.900.920.90
Vending machines0.730.880.84
Information to customersWebsite0.900.920.90
Information points0.910.920.90
Internal sign-posting0.870.890.90
Staff skills0.910.960.90
Public information0.860.880.89
Counter and gate servicesTicket counter 0.901.000.90
Check-in0.911.000.91
Checkpoint0.901.000.90
Modal integrationExternal sign-posting0.910.920.90
Airport links0.890.920.89
Source: Authors’ elaboration.
Table 2. Results of the analysis of the employees’ perspective.
CategoryIndicatorEmployees’ Perception
Corporate missionClarity of strategic goals0.62
Approach to goals0.62
Business initiatives0.62
Organizational structureRoles and responsibilities0.35
Staff training0.62
Employee participationCommunication of objectives0.31
Motivation on goals0.50
Safety performance Corporate security policy0.42
Airport security0.69
Source: Authors’ elaboration.
Table 3. Results of the analysis of the managers’ perspective alternatives.
Managerial AreaChoice
Airside & OperationsRoles and responsibilities
Sales & MarketingCommunication of objectives
Financial AdministrationRoles and responsibilities
Safety & Compliance MonitoringRoles and responsibilities
Health & Safety EnvironmentRoles and responsibilities
Structural AssetCommunication of objectives
Source: Authors’ elaboration.
Publisher’s Note: MDPI stays neutral with regard to jurisdictional claims in published maps and institutional affiliations.