1. Introduction
A growing number of city inhabitants goes hand in hand with growing needs within the sectors of urban mobility and urban logistics (city logistics). These growing needs result in an increase in the number of vehicles on roads. Cities are trying hard to solve the problem of the growing number of vehicles because of their negative impact on the environment, their impact on the health of city inhabitants, and also due to the way they influence the quality of roads and public spaces in the cities. Logistics centres mainly secure the flow of a big amount of goods between suppliers and manufacturers, and between manufacturers and end-consumers. The role of the logistic centers in the retail chain is to provide an uninterrupted operation of large retail networks via last mile deliveries.
Before the COVID-19 pandemic there had already been an extreme increase in individual shipment transportation including inner-city areas, specifically prior to Christmas. During the pandemic and implementation of adopted measures (lock-down, home office, on-line education, etc.), the volume of individual shipment transport and distribution (including groceries supply, ready meals delivery, etc.) has increased by more than 100% in some cities. If the shipment distribution is operated from peri-urban logistics centres, moreover, using older vans (very often with combustion engine running while waiting for customers or delivering shipments), it has a significant ecological impact that needs to be addressed.
To reduce the number of kilometres travelled from logistics centres, which are sometimes located several tens of kilometres from inner cities, facilitating an urban logistics centre presents one step towards sustainability of the urban logistics growth.
Current research also seeks to identify an optimal logistics centre location considering the last-mile delivery [
1]. Unfortunately, the theoretical model that finds an optimal urban logistics centre location based on the matrix of distance, number, and weight of shipments is not applicable. The main reason is that an optimal location could be calculated in a historical inner-city or close to school, hospital, city park, and similar neighbourhood. Building up an urban logistics centre is not possible in such surroundings. Therefore, the following research methodology was chosen in accordance with the approved territorial plan. The authors considered those locations in the city which are designated, or suitable for, urban logistics centre development. These localities were evaluated via selected mathematical methods and optimisation criteria.
Many cities in Europe, but also in other parts of the world, have already been regulating the entry of non-ecological freight vehicles (mostly with diesel engine) into defined inner-city areas, particularly by means of low-emission zones, or city toll and similar tools. In regard to urban logistics sustainability there arises a follow-up research question: whether the suggested urban logistics centre location makes it possible to provision the inner city, or, more precisely, what city area will be provisioned by means of electric vehicles. The deployment of electric vehicles needs to be considered in terms of the distribution routes distances, the weight restrictions for vehicles entering inner-city areas, and the range of electric vehicles. The combination of the optimal city logistics centre location, the optimized vehicle route and vehicle charging solutions form the basis for the efficient operation of the sustainable city logistics system. Mathematical modelling methods facilitate the correct decision-making and planning of these aspects.
2. Literature Review
The issue of urban logistics centres development is related to seeking an effective solution for delivery to the end-customer within a so-called last mile. The technology behind our approach relies on multi-agent system techniques and complex network-based algorithms for optimising sustainable delivery routes [
2]. This paper considers the flow consolidation at the boundary of urban congested areas through horizontal collaboration among logistics platforms [
3]. A similar problem is tackled in the paper that evaluates shipments consolidation and appropriate delivery fleet selection in terms of a sustainable transport growth within last mile [
4]. Stakeholders play vital roles in the implementation of sustainable last mile logistics solutions [
5].
This paper deals with quantifying the operational practices for freight carriers who deliver light parcels to business receivers in the centre of Melbourne (Australia) [
6]. The creation of an extensive mapping of routes utilised while delivering parcels ordered via the Internet and the creation of a proposal for a model for route optimisation and an intelligent transport system are presented in following papers [
7,
8,
9]. Solutions based on systematic evaluation of urban street networks for last-mile distribution are appropriate, too [
10].
Steps to select an appropriate logistics service mode for last-mile delivery in order to optimise delivery service capacity and vehicle utilisation and to minimise costs are identified in the following paper [
11]. Using the same fleet of vehicles to provide standardised services is discussed here [
12]. One way to improve the last-mile delivery efficiency is to create a collaboration model among established courier companies and small express delivery companies in order to fulfil all customer needs [
13].
The last-mile delivery logistics also makes use of other solutions, in particular cargo cycles [
14].
Another possible solution is the integration of passenger and freight transport for first–last mile operations [
2,
15] and use of railway transport [
16]. A specially designed simulation tool serves for the application of different open fleets (from freight vehicles to cargo bicycles) in urban logistics [
17]. Simulation is also applied in a model that utilises newspaper kiosks in the Valladolid city (Spain) as parcel lockers [
18]. The problems of an optimal parcel locker location using mathematical methods are described here [
19,
20].
Another research study measures the size of area occupied by different last-mile delivery systems including autonomous delivery robots in a London case study [
21].
Research addressing the use of electric vehicles for city provisioning is a very important topic. For example, paper [
22] deals with multi-criteria analysis of selected electric vans for parcel distribution in cities.
This paper evaluates the feasibility of using electric powered vehicles in road freight transport from a carrier’s perspective, taking into account different criteria, such as technological features, financial and non-financial incentives for procurement and operation, systems of road freight transport regulation, and city logistics organisation [
23].
Prediction of development trends in electromobility in the context of road passenger and freight transport is discussed in paper [
24]. Research in the field of electrical van usage has already been addressing the frame structure development in order to improve operational safety of electric vans [
25].
An electric vehicle charging is the subject of an individual research study. The paper examines electric vehicle routing and stochastic waiting times during charging considering a limited (for the time being) number of charging stations [
26].
Eventually, the research is focused on an optimal placement of electric freight vehicle charging stations and their influence on a possible impact load on the power distribution network [
27]. Research aimed at multi-source data analysis including direct data collection to gather daily average distances travelled by petrol- or diesel-powered vehicles currently in use is important for a more extensive adoption of electric vehicles [
28].
In the near future we expect the introduction of an alternative option to electric van recharging, particularly in urban logistics centres, namely swapping the depleted battery with a fully charged one [
29].
The issue of electromobility promotion and economic factors are addressed in a research article focused on the effect of pricing policies, combining a heuristic algorithm to solve electric vehicle routing and partial recharges with total economic cost [
30].
The research presenting a model of a circular city consisting of six zones is interesting. It examines their mutual interactions in freight and passenger transport, as well as suggesting various scenarios for electric vehicles and renewable energy use with the goal to reduce emissions [
31]. The paper aims to analyse potential savings in the carbon footprint between an electric tricycle last-mile distribution against a traditional diesel-powered van [
32].
Quak et al. identify effects of individual specifics that arise in respect to replacing conventional vehicles with electric freight vehicles. Major negatives include difficult planning of distribution routes, charging times, and the need for a sufficient charging infrastructure close to warehouses [
23,
33].
An individual research paper is dedicated to utilisation of AGV vehicles for shipment delivery, whereby the COVID-19 pandemic has accelerated the research in this field significantly [
34,
35]. Another study evaluates the utilisation of UAV vehicles (drones) in the last-mile delivery considering environmental friendliness of this kind of transport [
36].
The empirical results indicate that the adoption of information technology and E-commerce contributes to operational performances positively in most cases [
37].
3. Materials and Methods
3.1. Logistics Centre Location Problems
Territorial planning of logistics centre location should take into account the macroeconomic and microeconomic environment, as well as specifics of the centre. When talking about macroeconomic conditions, a strong emphasis is placed on geographic location and market maturity, whether in terms of economic level, level of legal protection securing entrepreneurs’ interests, tax burden, or market size representing labour supply on the one hand and buying power on the other hand. Central Europe features macroeconomic benefits which attract logistics investments in this region and enable competition (even though not perfectly) with the Asian market. A great advantage of the central Europe market presents the trend of “nearshoring”, which means proximity of foreign investors market, geographical and cultural proximity of businesses located in Europe, better protection (legal, political), and lower number of natural disasters when compared with Asian territories. Costs play a big role in the decision-making process, particularly still relatively low payroll costs typical for the region of central and eastern Europe. Microeconomic environment or conditions represent, when discussing modern logistics centres, a connection to transport infrastructure (roads, railway, port, airport), adequate labour force, feasibility of work 24/7, sufficiently large properties, possibilities of further expansion to enlarge the centre, and similar factors. In today’s world of process globalisation, increasing transport volume, and increasing competition among individual production areas, the existence of urban logistics centres contributes to a higher efficiency and quality of transport services and logistics solutions. Logistics centres can provide necessary solutions in logistics, transport, and depot activities including, for instance, transportation costs control and maintaining industrial competitiveness in productivity.
In a logistics centre (LC), the following processes are carried out: transloading, storing and packing, and goods assembly and consolidation, usually in a flow mode. Inserting LC into supply chains leads to substantial reduction in the number of connections between suppliers and respective receivers (when comparing number of connections between each supplier and each receiver). It also results in decreased transportation operations volume and vehicle fleet size.
According to a price comparison site, Heureka.sk, the annual sales growth in e-commerce in Slovak Republic, reached as much as 54% (March 2019 vs. March 2020). Considering the impact on transport, e-commerce utilisation results in a decreasing demand for passenger transport; however, it leads to an increasing demand for freight transport, particularly carrier services. Predicted global trends in e-commerce from June 2018 assumed these increases between 2015 and 2021 (
Figure 1) [
38]. Nevertheless, the annual e-commerce growth in most European cities and in the USA matches the five-year growth forecast. It is therefore necessary to accelerate the research, particularly in last-mile delivery logistics, so that the above mentioned delivery transport growth would not increase negative impacts of urban logistics on urban environment and in order to keep this growth sustainable.
Placing logistics centres close to motorway networks away from big cities leads to an increased number in driving operations and makes it impossible to use electric vans, for example, for the inner-city provisioning. This approach is no longer sustainable.
Long-distance transport by vans also creates the need to build new parking spaces due to changes in EU social regulations [
39].
3.2. Urban Logistics Centre
A very important component in introducing smart-city applications, particularly in relation to the enormous growth in delivering shipments to inner-city areas, is the new sustainable system of freight transport urban logistics. We can distinguish two main domains within the urban mobility: passenger transport and goods transport. It is necessary to employ smart transport technologies together with smart transport regulation on the outskirts of cities, because it influences transport operations.
Figure 2 presents the above mentioned domains and the basic relations between them. It further shows the building blocks required for a transport technology substitution and a transport activity change. However,
Figure 2 is missing the transport technology substitution for waste, or returnable packages collection, and for road and path cleaning in the inner-city. These issues have to be addressed within the smart city. The component for regulating and controlling transport technologies used at new building sites or when repairing buildings in peri-urban areas with regulated freight road transport also plays an important role.
While examining the urban mobility we have focussed on a freight transport segment, and particularly on possibilities for establishing an urban logistics (or consolidation) centre and using electric vehicles for the inner-city provisioning. In larger cities, consolidation enables the distribution of shipments using vans, whereby the payload or cargo capacity of the vehicle is fully utilised. Consolidated deliveries contribute to a sustainable growth in van-type vehicle trips related to the e-commerce growth caused by implementation of measures taken against the spread of COVID-19.
Experience from numerous on-going European projects and partnerships should be reviewed in each city as an inspiration for local action [
40].
This consolidation centre operates as follows: instead of goods being distributed to all shops in the inner-city by individual transport companies, the goods are delivered to a shared depot (urban distribution centre). Afterwards, the final delivery of goods to the inner-city will be carried out by means of alternatively powered vehicles, e.g., electric vehicles. This way, provisioning will be more eco-friendly not only thanks to electric-powered vehicles, but also due to limiting the number of deliveries within the last mile to a necessary minimum.
An important factor in building an urban distribution centre is its location [
41]. Appropriate urban distribution centre location can be determined using different methods, in particular quantitative methods and pair-wise comparison [
42].
Figure 3 illustrates the present process of goods distribution to the inner-city where not only traffic density, but also traffic collisions and congestions (as shown in the figure) occur. On the right, there is a proposed solution for transport of goods to the inner-city by means of the urban distribution centre using electric vehicles or alternatively powered vehicles in order to prevent collision with other vehicles. The number of vehicles provisioning the inner city would decrease. This would also lead to a decrease in negative impacts on the environment caused by these vehicles. Localisation of an urban distribution warehouse should also be considered in terms of minimum order quantity [
43].
As previously mentioned, the current research seeks to identify an optimal logistics centre location considering the last-mile delivery. Unfortunately, the theoretical mathematical model that finds an optimal urban logistics centre location based on the matrix of distance, number, and weight of shipments is not applicable in most cases, because the calculated optimal location is theoretical. Therefore, it may not be possible to establish or build a new urban logistics centre for various reasons. The optimal location calculated based on the chosen optimisation criterion may be determined, for example, in the historical inner city, or close to school, hospital, etc. It is not acceptable to build an urban logistics centre with 365/7/24 operation mode in such a neighbourhood. Considering not only consultations with municipal authorities of the Slovak Republic capital (Bratislava) and the Czech Republic capital (Prague), but also outcomes of participation in expert and scientific conferences, the authors decided in favour of a different methodical procedure: in accordance with the approved territorial plan, locations in the city designated, or suitable for urban logistics centre development undergo an evaluation. These locations are then assessed on the grounds of selected mathematical methods and optimisation criteria. The most suitable location is chosen also based on its access to the existing transport infrastructure and further expansion possibility.
4. Results
4.1. Consideration of an Urban Logistics Centre Location
To verify the application of the suggested method to determine the urban logistics centre location, a city in central Europe was chosen, namely Bratislava. The capital of Slovak Republic has 450,000 inhabitants and 160,000 daily commuters. Its area is 367 km
2. The city (like the majority of cities) does not have designated properties for urban logistics centre development in its approved territorial plan. Following analysis of the valid territorial plan of Bratislava city, the authors chose four possible localities designated for application in logistics, namely for building up warehouses, with a potential to provide transport services in the inner city and with an appropriate area (over 10 ha) for urban logistics centre development (
Figure 4). It is possible to build up an urban logistics centre in the following districts: Záhorská Bystrica (A), Rača-Svätý Jur (B), Ružinov (C), and Petržalka (D). See
Figure 4 and
Table 1.
Goods supply from the urban logistics centre to retail shops would be provided by electrical vehicles or alternatively powered vehicles. The urban logistics centre facility would include filling stations for alternative fuels and recharging stations for electric vehicles. Localisation of the urban logistics centre is verified with regard to optimisation of the distance travelled to retail shops and minimum order quantity.
According to the fact that we do not have data about all distributions within the urban logistics in Bratislava, to verify the proposed solution method using specific data the authors used selected retail shops of a chosen chain store that was willing to provide its real data. This chain store has nowadays 16 retail shops in Bratislava. These are currently being provisioned several times a day from a logistics centre in Sereď, a town situated as far as 64 km from Bratislava.
At first, the distance matrices had to be constructed to reproduce the real situation into a graph for a proposed model. All the distances between each new potential location for building up an urban logistics centre and each retail shop in Bratislava as well as between other retail shops to each other were recorded in four tables and are provided in
Supplementary Materials Table S1. The vertex marked as “D” is a potential depot and the other vertices are incrementally numbered from 1 to 16.
After obtaining the distances between the feasible locations selected for building up the depots and individual retail shops, the selection of a suitable urban logistics centre was conducted using mathematical optimisation methods. To resolve this issue, the vehicle routing problem (VRP) had to be solved to find the least-cost vehicle routes so that:
Each delivery location (customer) is visited exactly once by exactly one vehicle.
The vehicle starts and ends at the depot.
Side constraints on maximum vehicle capacity and travel distance are satisfied.
Determining the optimal VRP solution is NP-hard, so the number of problems that can be solved optimally using mathematical programming or combinatorial optimization may be limited. For a smaller number of vertices, the optimal VRP solution can be found using linear programming.
We have been solving two case studies to find a suitable location for the potential depot:
The calculation operated with the following situation: the vehicle travels from D point (stands for depot), i.e., the urban logistics centre, to two retail shops, and it returns back to this logistics centre (D). Specifically, mathematical programming, i.e., linear programming (LP), the nearest neighbour method (NN), and the Clarke-Wright method (CW) were applied. While LP gives an optimal solution the other two heuristics serve just for comparison reasons to show the difference between optimal and sub-optimal solution.
The calculation follows the real situation with data provided by the company. Required amount of pallet units (PU) differs among individual days of the week and among individual retail shops, as can be seen in
Table 2. Moreover, the vehicle load is restricted by the maximal transport capacity. In this case the Clarke-Wright method (CW) was applied. This method was chosen because LP, which gives the optimal solution, cannot be used in such defined problem and the CW method is the one that gives better results in comparison with NN algorithm.
As mentioned above, three mathematical optimisation methods were used in the process.
4.1.1. First Method—Linear Programming
The first method for calculation was based on linear programming. Linear programming is an operational research discipline focused on solving decision problems dealing with process realisation intensity determination, whereby these processes are going on, or may be going on, in a given system. At the same time, it is necessary to respect all conditions influenced by the realisation of these processes and to find such a solution to accomplish the decision-making goal to its fullest extent. The term “linear programming” consists of two words which describe, quite accurately, the basis of this operational research branch. The word “programming” in this term has nothing to do with computer programming in a programming language, which is a common meaning of this word nowadays. Linear programming shares just one thing with computers: solving its tasks without computing technology is not possible. Programming is rather a synonym for planning or creating programs (scenarios) of future development. The word “linear” expresses that all relations in linear programming models are linear relations. That means all mathematical functions used in these models are linear functions. Linear programming is thus a means for planning the realisation of specific processes (activities) which ensure an optimal outcome in relation to the defined goal [
44].
First, let there be a set of all feasible routes
from the depot to customers
and back to the depot respecting the conditions on the capacity of the vehicle. The total number of routes is denoted by
and the number of customers by
. The total (round-trip) distances
of the routes
are defined. The matrix with elements
, where
, if the customer
on the route
, otherwise
, is formed. Lastly, a binary decision variable
denotes whether a route
is or is not in the optimal solution. Then, we can formulate the problem following way:
subject to
where
4.1.2. Second Method—The Nearest Neighbour
The nearest neighbour heuristic is one of the simplest and oldest constructive heuristics for solving the travelling salesman problem (TSP). This method creates a route in the following way: a vertex situated nearest to the currently visited vertex is chosen as the next vertex on the route, and so on. The procedure is based on searching for the nearest neighbours and connecting them until all vertices are searched, i.e., served. Then the route ends by returning to the depot to close the circle.
Outcomes of this method are relatively satisfactory for a smaller undirected graph. However, in the case of a larger graph, especially a directed one (digraph), it falls behind considerably. The problem of the nearest neighbour method is that this method is so called “greedy” and it incorporates an edge with the currently nearest vertex, which may lead to omitting of a better solution in a larger scope. The final connection of all places using this method may therefore result in an unfavourable solution that could be worse than the one made by human intuition, i.e., easily noticeable with human insight. Because of this fact, the solution obtained by this method often serves as an initial or intermediate input for other algorithms. However, in the first case study, where just two vertices should be served in one sub-route, the quality should not trail far behind.
The algorithm description adapted to the first case study:
Initialize all vertices as unvisited U = {v1, …, vn}, where n is number of vertices, set r = 0 (r—number of route).
Select Depot (vd) as the current (starting) visited vertex vs = vd, U = U − {vd}.
Set r = r + 1, Vcap = 0, Tr = {vd} (Tr—set of vertices in rth route).
If Vcap < 2 and U ≠ {Ø}: Find the closest unvisited vertex vi to the current vertex vs and remove it from the set of unvisited vertices U = U − {vi}, Vcap = Vcap + 1, Tr = Tr + {vi}, set vs = vi and repeat.
If Vcap = 2 and U ≠ {Ø}: Tr = Tr + {vd} and go to step 3, Else: Tr = Tr + {vd} and terminate.
(Note, in our first case study, there is an even number of other vertices, except the depot, so the situation Vcap = 1 and U = {Ø} cannot occur.)
4.1.3. Third Method—The Clarke-Wright
One of the options to improve the transport productivity is to find an optimal solution for transport routing when distributing goods from one centre to nearby places—nodes. One of the methods dealing with routing is the Clarke-Wright method. This method is a heuristic algorithm, so the result is sub-optimal but with relatively good quality. One vertex is designated as the depot (centre) and remaining vertices of the graph present pick-up points with a specific requirement. Goods are distributed from the centre to other vertices—nodes. This method can apply different constraints, such as maximal distance of sub-route, maximal spend time, or maximal transport capacity etc.
In our first case study the constraint is set by the number of vertices in sub-route and in the second case it is the capacity of vehicle. This method is a construction method, which merges two routes considering the criterion of savings value generated by this merger. An initial sub-route is created from one way from the depot to each vertex and back to the depot, so that, primarily, the number of sub-routes is equal to the number of vertices except the depot. Then the potential savings (
s) of incorporation of individual edge (
c) to the route are calculated for each edge in the graph:
for each
. The matrix
is a matrix of the shortest distances between vertices of the graph. The matrix
represents profitability of individual graph vertices connections. Subsequently, the savings values
are sorted in a decreasing order. Starting from the top, the edges are gradually incorporating into the sub-route connect vertex
with node
. This way two sub-routes are replaced with one sub-route. Before inserting of an edge into the route, the constraints are checked, and the insertion is prohibited if it violates the constraints. The algorithm searches for such circuits which maximise total savings [
45].
The savings method is fast; however, the quality of results does not reach the quality of more sophisticated approaches. There is a risk that the possibilities of connecting individual routes may fall dramatically after the first few iterations if the task has too many constraints. The number of operations required is
[
44].
4.1.4. Symmetric Problem—1st Case Study
Linear programming was used to find out the optimal solution for the first case study with symmetric requirements when transport vehicle serves exactly two retail shops in a sub-route. Hence, the optimal location of a logistics centre in Bratislava with regard to the travelled distance between localities and individual retail shops is Ružinov depot, as can be seen in
Table 3. Note that the optimal routing was the same in all four cases, but logically with different distances.
In this area, a vehicle provisioning all retail shops travels 162.6 km. It is the shortest distance when compared to all areas suitable for the logistics centre development. The distance travelled from Ružinov in order to supply individual retail shops in Bratislava has the lowest value and seems to be the most suitable location for an urban logistics centre.
4.1.5. Comparison of Distribution Routes Calculation
While the calculation provided through the linear programming is optimal and other calculations are redundant, we provide solutions achieved by two other methods in
Table 4. The reason is to compare the solution quality of these heuristic methods with the optimal one. As assumed, the result of the Clark-Wright method is closer to the optimum than the one of the nearest neighbour method. One of the unpresented intermediate results worth attention is that if the graph were undirected, NN would also find the optimal solution, but in the case of the directed graph it fell behind the CW method.
4.1.6. Asymmetric Problem—2nd Case Study
Vehicle capacity of 18 pallet units (PU) is taken into consideration for goods distribution in category up to 12 tonnes. The reason is that there are two streets in Bratislava city with a limited entrance for some vehicles. Entry to Škultéty street is permitted to vehicles up to 18 tonnes, and entry to Dunajská street is permitted to vehicles up to 12 tonnes. This is why the vehicle has to meet such a load capacity limitation.
In
Table 2, there are listed amounts of required pallet units (PU) for each retail shop and each day of the week. According to vehicle capacity limit, it is easy to calculate what distance is needed to serve all retail shops with fully loaded transports. The distances are presented in
Table 5 and these numbers also support the result from the first case study, i.e., placement of the logistics centre into the same location—Ružinov.
To calculate the distribution of residual pallet units, i.e., residual loads that cannot fill the whole capacity of the vehicle, the LP method cannot be used. To calculate this problem, we have used the CW algorithm, because it usually gives better results than NN and it is the method that is designed to input various constraints. Total number of vehicles and travelled distance for each day can be seen in
Table 6.
While the number of transports is slightly higher in the Ružinov depot, the travelled distance needed to serve all the vertices is significantly lower compared to the other potential depots. This strongly supports the decision to place the logistics centre in this location. A sample of routing on the day with the highest and lowest number of residual PUs is shown in
Table 7.
4.2. Assessment of Possibility of Using Electric Freight Vehicles for Distribution from the Urban Logistics Centre
The main goals of implementation and operation of an urban logistics centre are improved efficacy and overall distribution optimisation. In the context of future requirements to switch to low-carbon and zero-carbon transport it is necessary to consider the adoption of electric or alternatively powered vehicles. Future requirements to use electric vehicles in distribution services already have to be taken into account in present days, even when planning where to locate the urban logistics centre. This matter requires a thorough understanding of the partnership between the private and public administration, as well as between providers and customers of transport services. Adoption of electric freight vehicles involves more demanding planning of distribution routes considering their range, charging time, and need for a sufficient charging infrastructure. This implies that considerations about urban logistics centre implementation have to take into account some potential requirements and operational specifics of electric freight vehicles.
In their paper focused on decarbonisation of road freight transport, Çabukoglu, E. et al. published the results of a Swiss case study. This paper also includes stochastic partition of freight vehicle quantity based on average daily driving performance (average daily driving distance). Most of two-axle freight vehicles (which are also considered in our paper) reach average daily driving performance up to 150 km [
33].
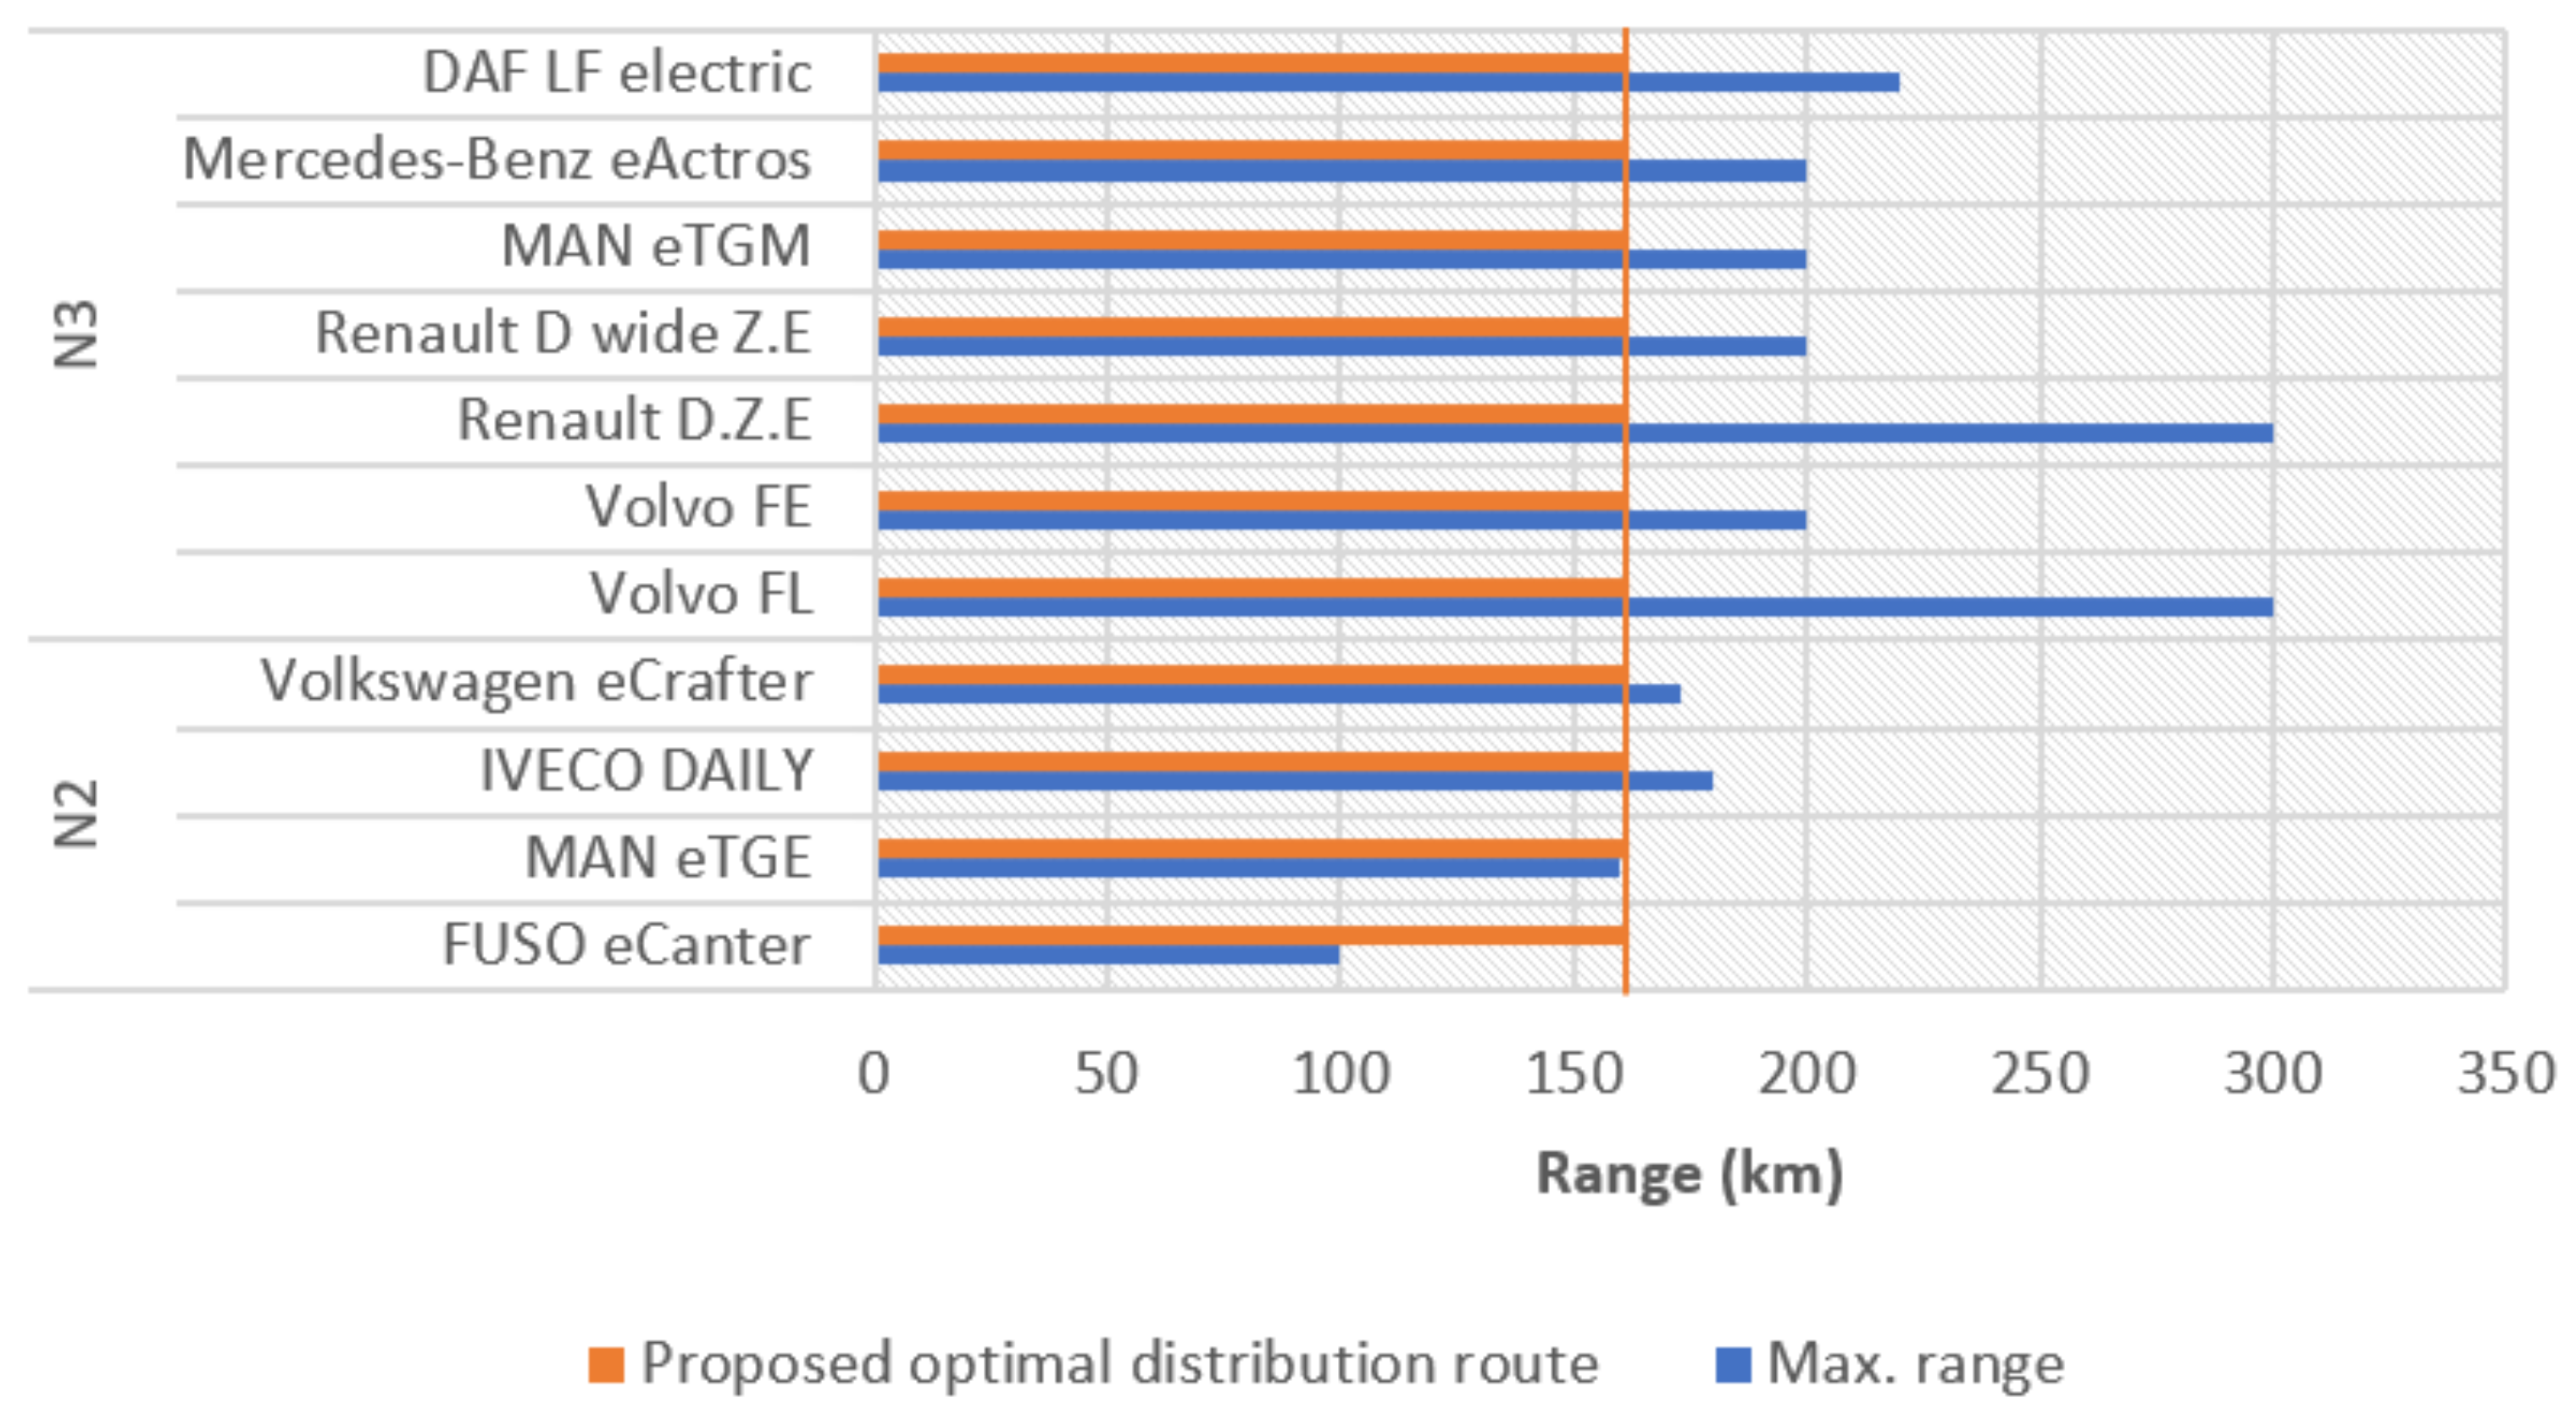
Total distances calculated in the symmetric case were close to 160 km and in the asymmetric case with distribution of the residual PUs they were lower than 150 km with only one exception on Monday. Depending on the type of individual electric freight vehicles currently available in the market, their range lies within 100–200 km interval. The range of vehicles belonging to N2 category (e.g., FUSO e-Canter, manufacturer Mitsubishi Fuso Truck and Bus Corportion, Tramagal, Portugal) tends to be at the limit of 100 km. This range, using the latest battery technology, could be improved only at the expense of the vehicle payload. Electric vehicles belonging to N3 category (e.g., Volvo FL electric, manufacturer Volvo Trucks, Sweden; MAN eTGM, manufacturer MAN Trucks & Bus, Germany) currently have a range from 100 km to potentially 300 km.
Figure 5 provides an overview of maximum vehicle range compared with the length of the proposed optimal distribution route.
We identify that the range of N2 vehicles tends to be at the limit of the distribution route length, provided that, in both cases, one vehicle would serve all the retail shops per day. However, during the loading phase, the vehicle can be continuously charged in a depot dock to extend its operational range. One of the factors influencing the range value is the maximum load of the vehicle. Influence factor of the vehicle load is also discussed by Schau et al. in the SmartCityLogistik Erfurt project [
46]. Due to this fact, electric vehicle manufacturers offer different mass variants (total mass variants display at
Figure 6. Depending on the vehicle application the range can be preferred (a higher number of batteries, a higher capacity of batteries) at the expense of the payload, or, vice-versa, a vehicle can have an improved payload at the expense of the range (fewer batteries, a reduced capacity of batteries). The vehicle selection is also influenced by real composition of shipments, particularly their weight and volume. The FUSO eCanter vehicle may be delivered either with three or with six 14 kWh batteries. It is similar with vehicles belonging to N3 category.
It is necessary to point out that the construction of assessed N2 category vehicles (apart from FUSO eCanter) follows the one of N1 category vehicles. Their overall mass is therefore lower in comparison with FUSO eCanter vehicles. Their constructional predisposition also assumes a reduced cargo space. The FUSO eCanter vehicle features a higher overall mass which assumes a higher payload in comparison with vehicles constructed on the N1 category vehicle platform. It is not possible to provide accurate payload values of individual vehicles, because they directly depend on their superstructure type (box body, with/without thermal isolation, with/without cooling system, etc.). According to manufacturers the payload of FUSO eCanter vehicles ranges from approx. 3 to 4.5 tonnes, based on their configuration. Vehicles constructed on the N1 category vehicle platform may have payload values ranging from approx. 1.5 to 2 tonnes.
There are several studies dealing with different factors influencing the range of electrical vehicles. Rastani, S. et al. analyse the impact of the ambient temperature on electrical freight vehicle range, and they propose a methodology of distribution routes planning for electric freight vehicles in respect to the ambient temperature. It may be stated that an optimal range value can be reached when the ambient temperature is around 22 °C, because it is not necessary to switch on neither heating nor air conditioning. According to research, at the ambient temperature of −21 °C, the electric energy consumption was 1.52 times higher in comparison with the vehicle operation at the ambient temperature of 22 °C. At the ambient temperature of 0 °C the electric energy consumption was 1.27 times higher [
47]. The application of electric freight vehicles of N2 category within a distribution route with the length of 160 km requires considering an appropriate location for recharging infrastructure not only nearby urban logistics centres, but also within the route itself—close to some customers/recipients. Based on the above mentioned range comparisons of N2 category vehicles (which are technically feasible for an urban distribution) we can draw the conclusion that vehicles travelling the proposed distribution route would require recharging. At present, a so-called rapid charge is available. Depending on the recharging technology applied, the batteries can be charged to 80% in as little as 45 min [
48]. However, the impact of such a rapid charging on the battery life cycle have to be taken into consideration. When selecting the charging infrastructure location, the following factors have to be taken into account:
technical (in terms of an effective vehicle range application)
logistic (place with the charging opportunity during a time-consuming unloading in order to prevent time losses due to the vehicle charging process).
The right location of the charging infrastructure requires choosing a compromise between a technically optimal location and a logistically optimal location. Reaching a consensus might be too difficult under real-world conditions. Therefore, we suggest equipping distribution routes with a charging stations network in order to tailor vehicle charging to specific circumstances. Considering the charging stations network, customer needs, and technical potential of vehicles, correct planning of electric vehicle distribution routes is essential [
49,
50]. In this connection it is necessary to point out that electric energy consumption of a fully loaded vehicle is higher in comparison with electric energy consumption of a vehicle with less cargo. The maximum load of the vehicle, as one of the factors influencing electric energy consumption of a vehicle, is discussed in the paper by Schau, V. et al. [
46]. Results published in the paper provide the conclusion that the correct planning of battery charge level based on the vehicle load, particularly within limit range distances, is of key importance for timely servicing for all customers. Another important factor influencing the electric vehicle range is continuity of traffic flow. Results of the paper by authors Bi and Tang suggest that electric vehicles may be energy effective when used in dense traffic [
50].
In freight distribution with electric vehicles, adoption of N3 category vehicles may also be taken into consideration, due to their higher potential range and possibilities to distribute a higher volume of goods in comparison with vehicles of N2 category. In such a case, however, regulations of vehicle entry to inner-city zones with mass limits are often unavoidable. Entry permitted to vehicles effectively using their weight can result in a lower number of individual goods deliveries to retail shops, and thus to a lower volume of freight transport burdening the inner-city. Municipalities should carefully consider permitting the entry into the outskirts of the city to heavier vehicles, and monitor their effective payload, so that benefits of entry permission granted to bigger and heavier vehicles outweigh their negative impacts, particularly on the road infrastructure.
To eliminate some specifics related to electric freight vehicles operation, the adoption of alternatively powered vehicles may be taken into consideration. One of options is the application of hybrid electric vehicles which use a preferred (usually electric) power drive in defined zones, and also support charging from a charging station.
5. Discussion and Conclusions
Postal services represent a good practice example in using electric vehicles for urban distribution. In recent years, multiple postal services in the EU countries have gradually been introducing the inner-city delivery carried out by electric freight vehicles with their cargo space specially customised for postal items. The provider of postal services in the Slovak Republic (the Slovak Post) also introduced vehicles powered by electricity for delivery of postal items in the inner-city. In Slovak towns, which are usually smaller, daily trips of postal delivery vehicles amount to 45–90 km. Under these conditions, electric vehicles—with operation mode characterised by low acceleration, frequent stops, and overall low-speed driving—are very effective. When making frequent accelerations, speed shifts, and stops, internal combustion engine vehicles consume an increased amount of fuel, and thus produce an increased volume of emissions. On the contrary, electric vehicles usually consume less energy at lower speeds [
50].
Postal items delivery in cities proceeds as follows: postal items are distributed to respective branches usually located near the inner-city area, and afterwards delivered directly to the recipient addresses. We can observe a sort of analogy within the system of postal items delivery and the system of distribution utilising an urban logistics (consolidation) centre. We may therefore express an assumption that as long as we can see examples of good practice in combining postal items delivery and electric vehicles application, the system of distribution utilising urban logistics centres and electric freight vehicles has the potential to work efficiently.
In case of distribution between business places situated in multiple smaller towns or in peri-urban areas—meaning that a vehicle also has to travel to rural zones, and the overall driving performance is increasing—the use of hybrid freight vehicles may be taken into account. A hybrid power drive enables significant improvement of the vehicle range, and at the same time it is possible to use it in urban zero-emission zones [
51].
In future it will be necessary to also pay attention to logistics possibilities of autonomous electric freight vehicles when provisioning the inner-city within short distances and last-mile delivery systems [
52]. This specified distribution system requires a necessary infrastructure, with the urban logistics centre being its important component.
Outcomes of the research are important in respect to enormous acceleration of e-commerce due to COVID-19 pandemic in 2019 and continuing in 2021 as well, and in respect to the interest of businesses, particularly logistics companies, in storing a higher volume of supplies near the inner-city area. Online shopping leads to a significant demand for logistics properties. The pandemic has concentrated an anticipated 5-year growth into 5 months. Such a growth generates an additional demand for logistics properties, where e-commerce requires an area three times bigger in comparison with traditional retail formats. A higher income interest from the online sale of multi-channel vendors will require additional material investments into supply chains, whereby reverse logistics requiring the administration due to an increased volume in returnables will have to be taken into account. Starting from 1 January 2022 the Slovak Republic is introducing a mandatory deposit on PET bottles and aluminium cans which would also lead to a reverse logistics growth. In reaction to the above-mentioned increased demand, the purpose of properties originally designated for retail has gradually been changing. Owners of retail properties re-evaluate their further operation as they see better monetisation options in other sectors including logistics or other properties (mainly residential properties comprising of units for more tenants). Most conversions will probably occur in case of shopping centres which have the biggest areas available, and which have been substantially impacted by e-commerce growth.
The often-used theoretical mathematical model, that finds an optimal city logistics centre location based on the matrix of distance and the number and weight of shipments, is unfortunately not applicable in most cities. Therefore, the authors have chosen an innovative research methodology, which is based on the assessment of sites in the capital of the Slovak Republic, Bratislava, according to the approved territorial plan, which are suitable for the construction of a city logistics centre. These sites are then assessed using mathematical programming methods, i.e., linear programming, the nearest neighbour method, and the Clark-Wright algorithm on a case study on real data. Due to the increase in e-commerce and thus the increase in the impact of urban logistics on the environment, the next step was to examine or propose the location of the city’s logistics centre which allows the supply of the assessed operations with electric freight vehicles.
The main results of the research prove the validity of the methodology for location selection of a potential urban logistics centre in a specific central European city (Bratislava, Slovakia) based on its territorial plan, which were further evaluated by applying mathematical methods considering their suitability for the urban logistics centre development. As data on all shipments transfers within a specific area of Bratislava city were not available, the proposed methodology was verified using real-world data of one retail chain which has 16 retail shops within the specified area. Specifically, mathematical programming (linear programming), the nearest neighbour method, and the Clarke-Wright method have been applied. The calculation operated with the following situations. The vehicle travels from D point (stands for depot), i.e., the urban logistics centre, to two retail shops and then it returns back to this logistics centre for another load of goods, which are distributed thereafter. In this case the optimal solution was provided via linear programming. In the case of various requirements and vehicle capacity limitations the solution was sub-optimal and was acquired with the use of the Clark-Wright heuristic algorithm. Both cases support the same location of the potential logistics centre. This method was suitable for goods and the provisioning system of the selected retail chain. In case of distributing small individual packages, a higher number of businesses (recipients) would have to be taken into account. In future, there is a possibility to apply other innovative solutions, e.g., multi-parcel crowdsourcing logistics [
53].
The main goals of implementation and operation of an urban logistics centre are as follows: improved efficacy, overall distribution optimisation, and significant decrease in negative impacts of urban logistics on urban environment, which is—in respect to enormous e-commerce growth—a very important goal. Future requirements to use electric vehicles in distribution services have to be taken into account in present days, even when planning where to locate the urban logistics centre. The range of evaluated N2 category vehicles tends to be at the limit of the distribution routes length for the case study discussed in this paper. One of the factors influencing the range value is also the maximum load of the vehicle. This means that the answer to the research question: “Is it possible to provision a selected city in central Europe using electric vehicles?” is “yes”. However, based on the range comparison of N2 category vehicles technically feasible for urban distribution we may state that it is necessary to consider recharging, especially during the loading and unloading phase when the charging does not consume any extra time and does not create idle time. At present, a so-called rapid charge is available and can speed up the whole charging process. The results of the research also show certain limitations for the use of N2 electric freight vehicles. Future research could also focus on optimizing vehicles routes in terms of electricity consumption, reducing road congestion and compliance with delivery time windows.
The solved territory of the capital of the Slovak Republic, Bratislava, is relatively compact and no city logistics regulation has yet been introduced that would completely prohibit the supply by vehicles, e.g., as in some historic city centres. In these cases, a combination of supplies by electric freight vehicles and cargo bicycles proves to be suitable. Alternatively, in the case of non-compact and larger cities, it is necessary to set up more urban distribution centres in order to reap the benefits of electromobility. Further research can be directed to both areas.
The right location of the charging infrastructure requires choosing a compromise between a technically optimal location (in terms of an effective vehicle range utilisation) and a logistically optimal location, that is, in a place with the charging opportunity during a time-consuming loading or unloading in order to prevent time losses due to the vehicle charging process. Considering the pace of the current development of new electric vans, electric freight vehicles, and dedicated batteries, the ranges of these vehicles prolong, and so do charging periods outside the urban logistics centre.
Electric van adoption and charging stations creation provide further possibilities for smart city solutions application including the use of autonomous vehicles for last-mile delivery. Further research in the last-mile subject matter should be directed this way. The adoption of autonomous vehicles can partially help to solve the lack of experienced drivers and improve the traffic safety in inner-city areas [
54]. Within this research it is necessary to evaluate a customer behaviour change in the retail sector and the e-commerce growth in respect to observing measures adopted against the spread of COVID-19. It is also necessary to evaluate pilot solutions for contact-less delivery in inner-city areas (which were based on autonomous vehicles for small items delivery) and drones utilisation, and to define potential priorities for the nearest period. Wrong practices in locating of the urban logistics centres may reduce the usage potential of electric freight vehicles, but also autonomous vehicles in urban logistics. We recommend that cities modify their territorial plans in order to designate areas for urban logistics centres. Most cities currently do not have such arrangements in force. Logistics companies intending to build up private urban logistics centres look for respective vacant properties in localities which do not always have a placement optimal enough to apply electric vehicles within last mile delivery more extensively and effectively.


