Article

City Logistics as an Imperative Smart City Mechanism: Scrutiny of Clustered EU27 Capitals

Faculty of Operation and Economics of Transport and Communications, University of Žilina, SK-010-26 Žilina, Slovakia
*
Author to whom correspondence should be addressed.
Sustainability 2021, 13(7), 3641; https://doi.org/10.3390/su13073641
Submission received: 6 February 2021 / Revised: 9 March 2021 / Accepted: 21 March 2021 / Published: 25 March 2021
(This article belongs to the Special Issue Smart Cities, Smart Mobilities, and Sustainable Development of Cities)

Abstract

:
In large urban agglomerations, various logistical problems arise due to high population density and deficient transport infrastructure. City logistics involves the efficient distribution of freight transport in urban areas and approaches to mitigate environmental impacts and traffic congestion. This paper aims to use a two-step cluster analytic approach to segmentation of EU27 capital cities based on their city logistics performance. To obtain primary outcomes, the log-likelihood measure in SPSS Statistics was used. The results can be used to identify the development and implementation of logistics measures in capitals across the EU. In addition to clustering, the statistical analysis evaluates the position of investigated cities concerning traffic congestions, and from an environmental point of view, the carbon dioxide produced from transport. The scrutiny delivers practical outlooks on how clustering can be undertaken and proves how the clusters can be used to plan city logistics and supply chain management. Finally, the paper deals with smart city indices from the perspective of sustainable mobility and examines its correlation with city logistics.

1. Introduction

City logistics is perceived as an application of proven methods of regulating freight traffic impacts in urban areas. However, it is necessary to consider the individuality of specific problems and the urban environment. It is not appropriate to take one specific logistical measure and apply it without adapting it to each state or city’s conditions. Great emphasis is placed on the quality and high level of services provided, so the application of optimisation in logistics processes is a necessity. City logistics is a process of optimising logistics and transport activities, in which private companies participate with the support of advanced information systems in the city concerning the transport environment and its impact on congestion, security, and energy savings [1].
Improving city logistics may address transportation methods, handling and storage of goods, inventory management, waste and returns, and home delivery services. Making this process sustainable requires efficient interfaces between long-haul transport and short-distance distribution to the final destination. It also requires efficient planning of the routes to avoid empty runs or unnecessary driving and parking. Furthermore, sustainable urban freight requires smaller, more efficient, and cleaner vehicles.
The environment in which we live is a complex system and specific actions affects other areas, meaning constant development has to follow a plan according to a logic where actions are structured and coordinated in a strategic and integrated process [2]. To adapt urban development to the local environmental issues, processes must take place within holistic strategic planning. It is a fact that the lack of connection between the elements, which define the environment, limits their progress. Smart planning takes on this role as a connection process, and the assumption is that there is a scientific approach to urbanisation, based on a holistic and rigorous plan of action that shapes the entire city, homogeneously, making it sustainable [3].
The aim of this paper is a statistical data analysis of European Union capital cities (without the UK), taking into account urban logistics, which results in the creation of five clusters and an evaluation of their logistics performance concerning the environment.

Literature Review

Cities are increasingly concerned about urban traffic congestion and its associated negative externalities. Road congestion is considered an urgent and growing challenge for sustainable mobility, transport policy, and urban governance [4]. Above and beyond the direct social cost of the time drivers are made to waste, congestion also produces and aggravates other negative externalities, including pollution, noise, and accidents. Indeed, the recent literature on urban economics and transportation and that on environmental policies have paid particular attention to the contribution of congestion to pollution and the effects on health outcomes and living conditions [5,6].
Urban freight transport plays a serious role in the promotion of sustainable and liveable cities. He and Haasis [7] pointed out that an urban freight transport strategy should be implanted in a comprehensive sustainable development strategy with a long-term perspective (approximately 20 to 30 years). Therefore, it is crucial to consider city development and sustainable urban freight planning from a long-term view. Although urban freight transport plays an essential role in meeting citizens’ needs, it significantly contributes to non-sustainable effects on the environment, economy, and society. The rapid growth of urban freight transportation due to changes in the supply chain (e.g., just-in-time, home deliveries, and e-shopping) has resulted in ever-increasing numbers of deliveries and light goods vehicles in residential areas, generating major impacts on city sustainability and liveability [8].
City logistics supports the urban economy and sustainable development, but its negative externalities also continue to deteriorate with demand growth. At present, the initiative of incorporating urban logistics planning into the scope of urban planning is gradually recognised and valued by practitioners [9]. The largest cities depend on efficient urban logistics to ensure their attractiveness, quality of life, and economic growth. Along with this, they struggle to ensure a liveable environment around its road infrastructure, where the increased occurrence of light and heavy cargo vehicles raises questions regarding safety and environmental impacts [10]. The main problems encountered in the city logistics of goods are the following: Access for delivery vehicles, mainly due to insufficient infrastructures, restricted access, or congestion; environmental: harmful emissions, noise, vibrations, and physical obstacles; Security: goods vehicles, owing to their size, manoeuvrability and loading/unloading operations on streets, frequently cause accidents; and Energy use: urban freight transport is the sector that uses the most fuel [11]. Deciding between several alternatives, where only one optimum is accepted as a result of the whole process, is one of the frequent city logistics tasks that we can encounter in practical life. Several methods are used in common practice to solve this problem, which works essentially on a similar principle—to assess multiple variant solutions of a given problem according to selected criteria and determine the final ranking of these variants [12].
Shafique et al. [13] showed the relationship between freight transport, economic prosperity, urbanization, and CO2 emissions in the cities. Bosona [14] focused on challenges and opportunities to improve sustainability because, during the past two decades, the increase of Internet infrastructure and the growth of e-commerce has contributed significantly to the increase of urban freight flow, both in freight volume and freight traffic.
City logistics is essential for large agglomerations. As customer demands evolve, city logistics is becoming more intricate and deliveries are more often just-in-time, leading to more and more lorries and vans [15]. However, this is not sustainable. For city logistics, transport technology development needs to become smarter, cleaner, quieter, smaller, and safer; almost invisible. City logistics aims to reduce the emissions associated with freight transportation [16]. Equally important is smarter transport, less traffic, flexible loading and unloading terminals, more traffic safety, better traffic flow, a stricter exemption policy, rewards for good city logistics in the form of privileges and a smart supply line to residential areas. Changes in customer demand (smaller volumes, faster delivery) and changes in the mobility policy of municipalities (including the introduction of environmental zones and time slots) bring challenges for companies in the planning and deployment of vehicles [17]. It requires solutions with clean, quiet, and space-efficient vehicles used profitably to serve city logistics demands.
To evaluate the current state of knowledge in this area, we have dealt with the following determinants. In Europe, various urban logistics systems are being introduced to transport goods in conurbations. For example, cities such as Berlin, London, and Stockholm have introduced low emission zones (LEZ). Santos, Gomez and Pires [18] identified that implementing LEZ is crucial for air quality and policy actions to reduce air pollutant emissions. Campbell and Roberts [19] researched the health consequences associated with the implementation of LEZ. Skrucaný et al. studied the quantification of the positive environmental consequences of increasing electromobility in urban areas [20].
Delivery vehicle routing problems with time windows were examined by Li et al. The authors analysed the effect of the length of time windows and compared simultaneous and separate modes of delivery [21]. Capacitated vehicle routing problems with alternative delivery, pick-up and time windows were measured by Sitek et al. [22]. Johansson and Bjorklund [23] aimed at retail stores’ demands for UCC (urban consolidation centres) services. UCCs are often conceived to improve retail stores’ services and potentially reduce costs. Zunder and Marinov verified that within the construction sector, UCCs could be utilised successfully to create efficient and forward-thinking logistics operations [24].
Carboni, Deflorio and Dalla Chiara [25] pointed out that the monitoring operations at intermodal freight terminals are useful for estimating their performance, while collecting traffic data allows them to manage and control truck flows appropriately. To meet the logistics’ complex requirements, extensive development and utilisation of intermodal transport are essential, whereby intermodal terminals are crucial [26]. A case study of the applied mathematical methods in the context of intermodal transport terminal by Lizbetin and Stopka considered the connection to railway and road infrastructure [27]. Quak de and Koster [28] described the effects of time access restrictions and vehicle weight restrictions and pointed out the impacts on the transport costs and the distribution processes (on the retailer’s side) or the environmental impacts. This restriction had a negative impact on retailers’ transport costs. Global urbanisation processes expedite a growing demand for more sustainability in cities. New logistic concepts such as cargo bike schemes can be a vital means towards this goal [29].
Cited publications in the thematic literature review outline the scope of interest for this paper, focusing on EU27 city logistics. To summarise this analysis, we examined publications focused on clustering in logistics (in general). There is only one relevant article in the citation database. Cekerol, in 2020, examined the classification of logistics-based transportation activities in OECD countries and selected non-member countries through cluster analysis [30]. It should be noted that a gap has been revealed, because so far, no author has paid attention to clustering cities according to their logistics.

2. Materials and Methods

This paper aims to create clusters of European capitals based on common attributes of city logistics. Clustering is one of the statistical methods that deals with the similarity of multidimensional objects and the classification of objects into clusters. Cluster analysis can be generally defined as a general logical procedure, formulated as a procedure by which objects are clustered into groups based on their similarity and difference [31].

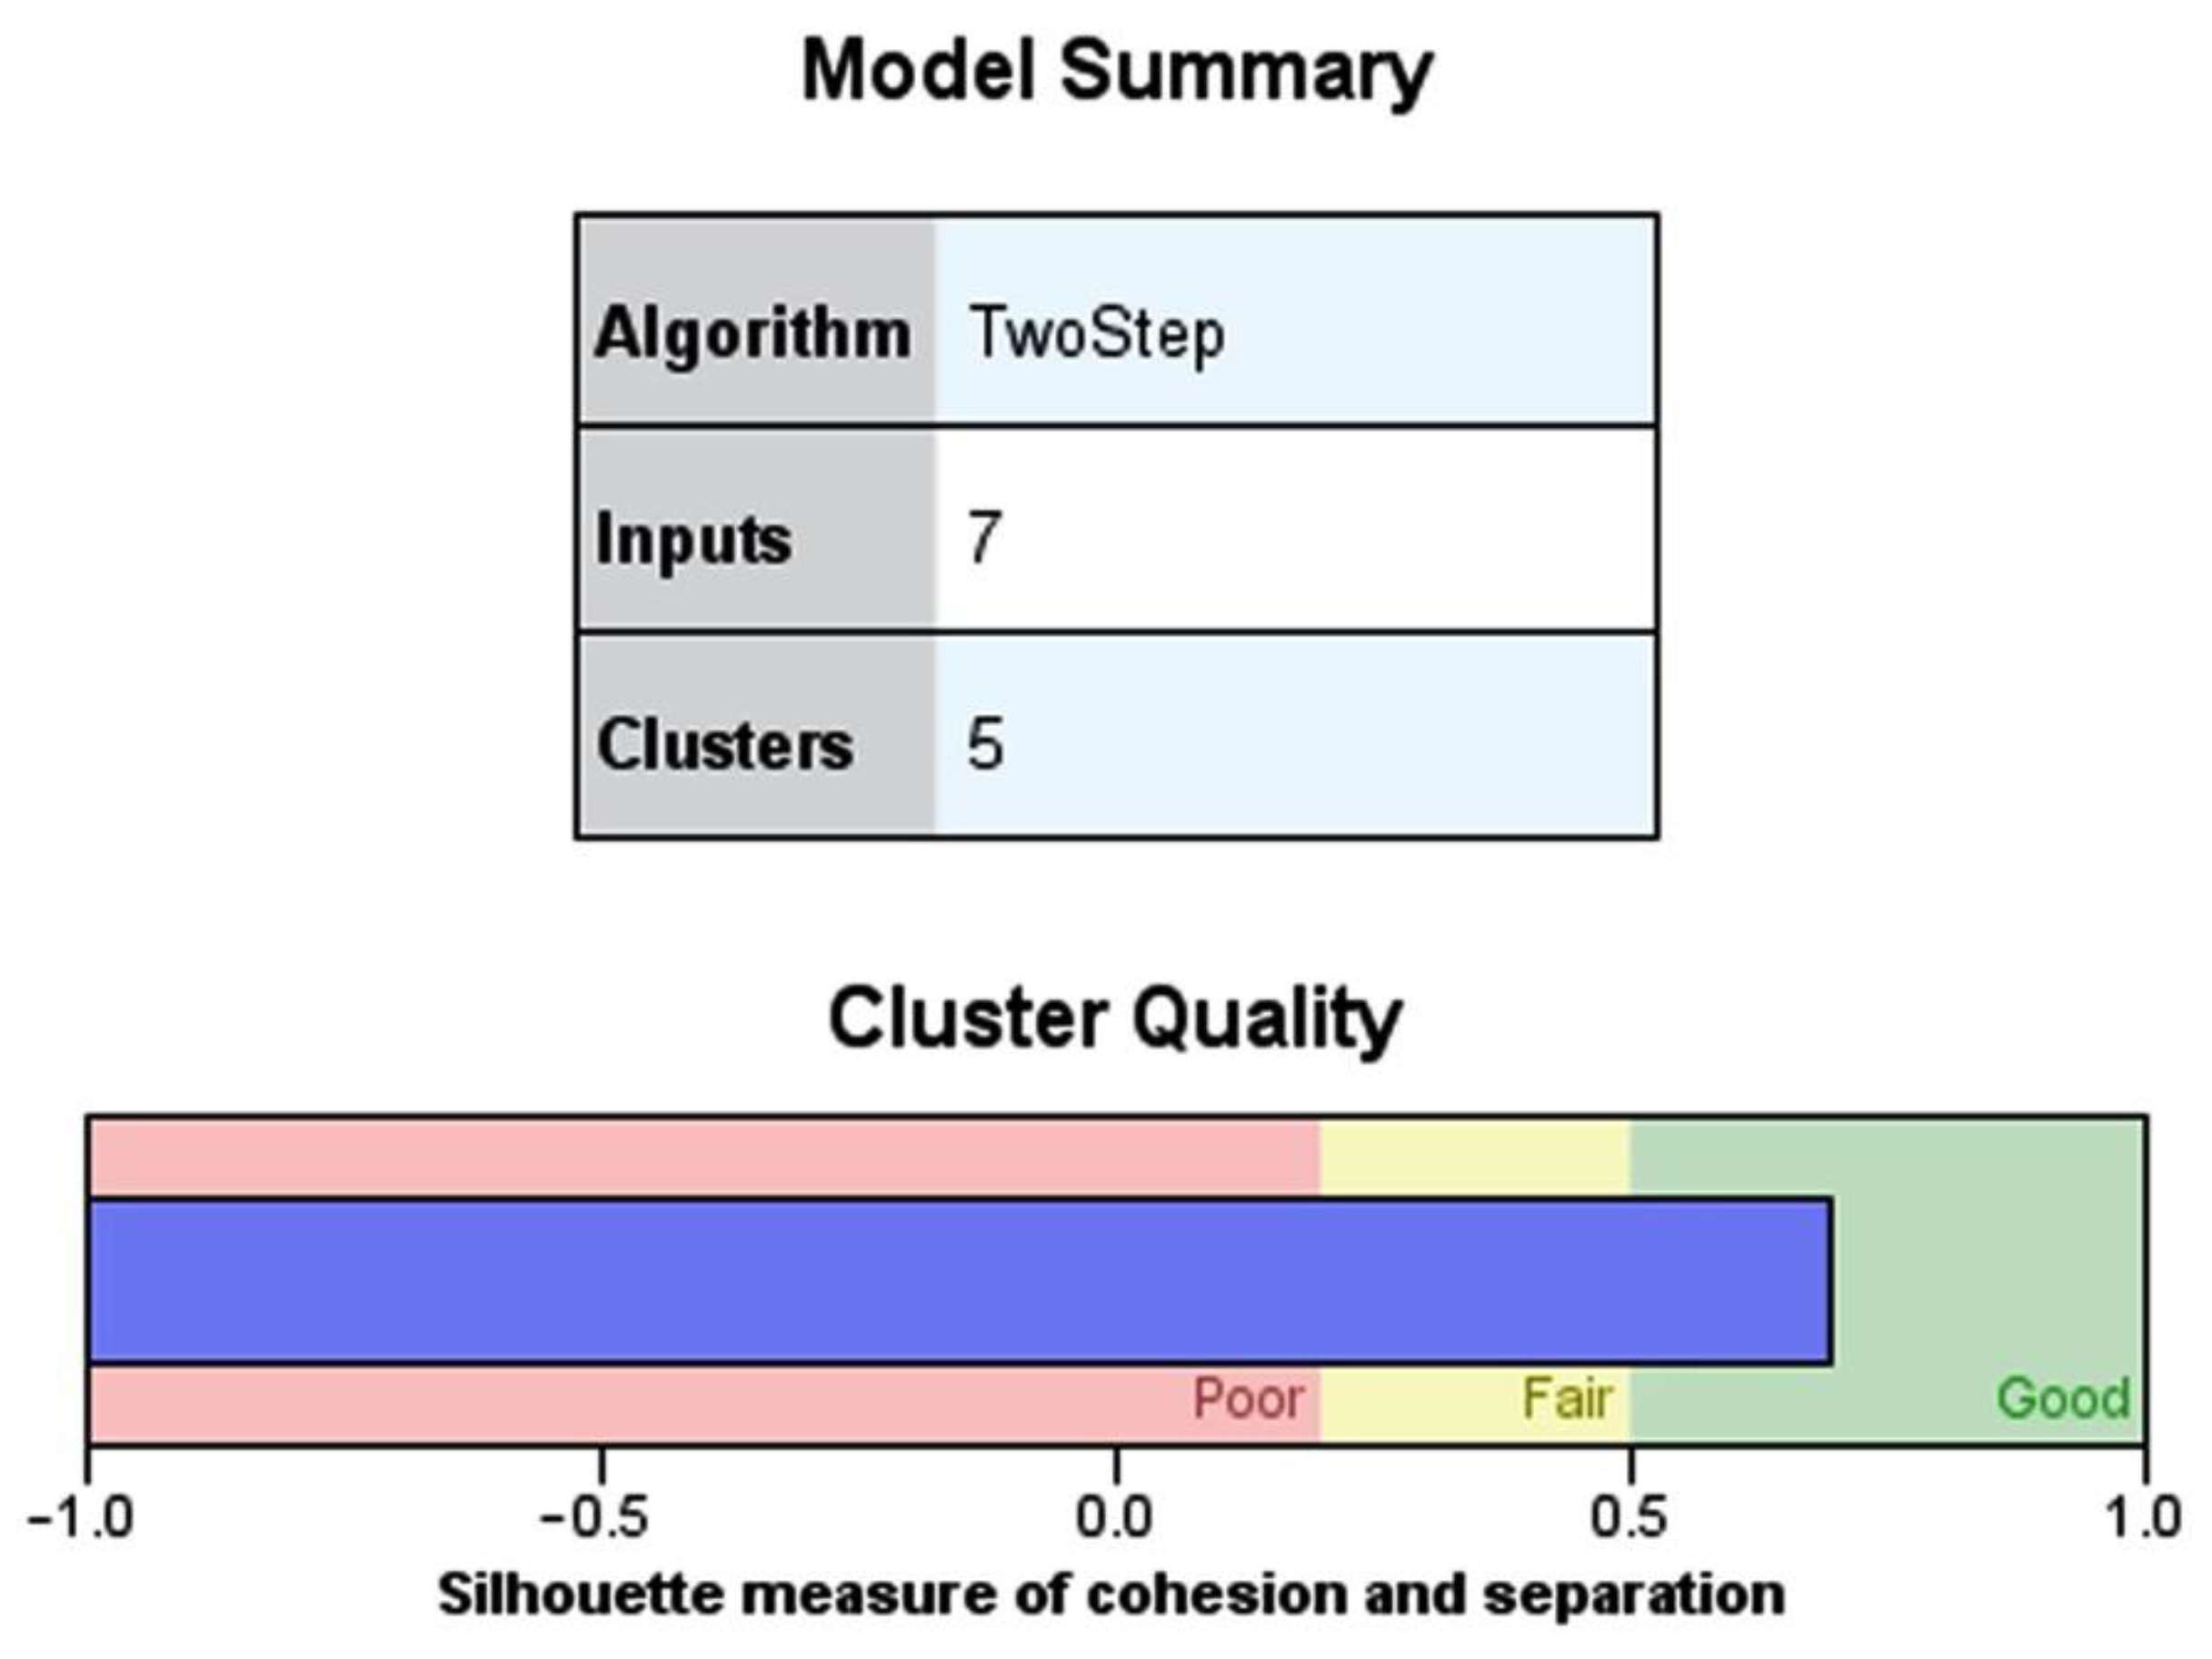
2.1. Two-Step Cluster Method

This method’s output is a certain number of clusters, while objects in one cluster have similar properties and objects in different clusters are as different as possible. There are several algorithms for assigning the investigated objects to these groups, but a two-step method was applied due to the nature of this analysis.
The input for cluster analysis is usually N objects, denoted by indices 1 ≤ i ≤ N, which have d features, denoted by indices 1 ≤ j ≤ d. The following data is used to write to the N × d matrix:
X = ( x 11 x 12 x 21 x 22 x 1 d x 2 d x N 1 x N 2 x N d )
The line d-dimensional vector xi is a vector of the i-th object features, the element xij denoting the value of the j-th feature of the i-th object [31].
Two-step cluster analysis in SPSS Statistics using the log-likelihood measurement was considered the most appropriate technique for this study. It is the only form of cluster analysis in SPSS that makes clusters based on both scale and nominal variables.
Two-step cluster is a type of analysis that groups objects based on two stages [32]. The two stages of two-step cluster are pre-clustering and hierarchical cluster.
Pre-clustering is conducted to develop subclusters from each object of the variable. The method implemented in pre-clustering is sequential clustering. The factors that affect the result of basic sequential clustering are the θ score (threshold) and maximum sub-cluster. θ is one of the factors that determines the number of sub-clusters. At the beginning, θ (threshold) is zero and transformed into the lowest log-likelihood ratio between sub-clusters. The following step is to categorize sub-clusters in the real clusters. The type of method that works for the categorization is the hierarchical cluster with agglomerative method [32]. The type of ratio in the two-step cluster analysis is different and uses the log-likelihood ratio.
The log-likelihood ratio refers to the ratio used when data consists of continuous and categorical variables [33]. The log-likelihood ratio between the ith and jth cluster is defined as:
d(i,j) = ξi + ξj − ξ〈i,j〉
With
ξ s =   N s ( k = 1 K A 1 2 log (   σ ^ k 2 +   σ ^ sk 2 ) + g = 1 K B   E ^ sk )
And
  E ^ sk = l = 1 L k N skl N s log N skl N s
In which the d(i,j) is the ratio between the ith and jth cluster; ξi: ith is the cluster variance; s: ith, jth or a combination of ith and jth is the cluster symbol; ξj: jth is the cluster variance; ξij: ith and jth is the cluster variance; KA is the number of continuous variables; KB is the number of categorical variables; Lk is the number of categories in the kth (categorical variable); NS is the number of objects in the ith, jth or combination of the ith and jth cluster; ξs is the variance in ith, jth or combination of the ith and jth cluster;   σ ^ k 2 is the indicator for the kth continuous variable;   E ^ s k is the estimated score of ith, jth or a combination of the ith and jth cluster in the kth continuous variable; Nskl is the number of objects of ith, jth or a combination of the ith and jth cluster in the kth categorical variable taken from the Ith category;   σ ^ s k 2 is the indicator of variance in the ith, jth or a combination of ith and jth of the kth continuous variable.
The qualitative data transformation before analysis was unnecessary. Thus, two-step cluster analysis was permitted to gain high accuracy. Two-step clustering involves two stages, and it is suitable for large data sets. In the first step, original cases are segmented into groups by considering cluster determinants. In the second step, the standard hierarchical clustering algorithm on the groups is used. It allows exploring a range of solutions with different numbers of clusters. A range of solutions is reduced to the best number of clusters based on Schwarz’s Bayesian information criterion (BIC). The BIC is considered one of the most useful and objective selection criteria, as it avoids the limitations of other clustering methods. Akaike’s information criterion (AIC) was also considered; however, it was not used because the resulting model had less satisfactory parameters. The centroid technique has been selected. In this approach, the geometric centre (centroid) of each cluster was computed first. The distance between the two clusters equals the distance between the two centroids.
Once the cluster solution is formed, χ2 and t-tests are performed on the nominal and scale variables to classify the importance of variables in a cluster and indicate differences amongst clusters.

2.2. Database Material
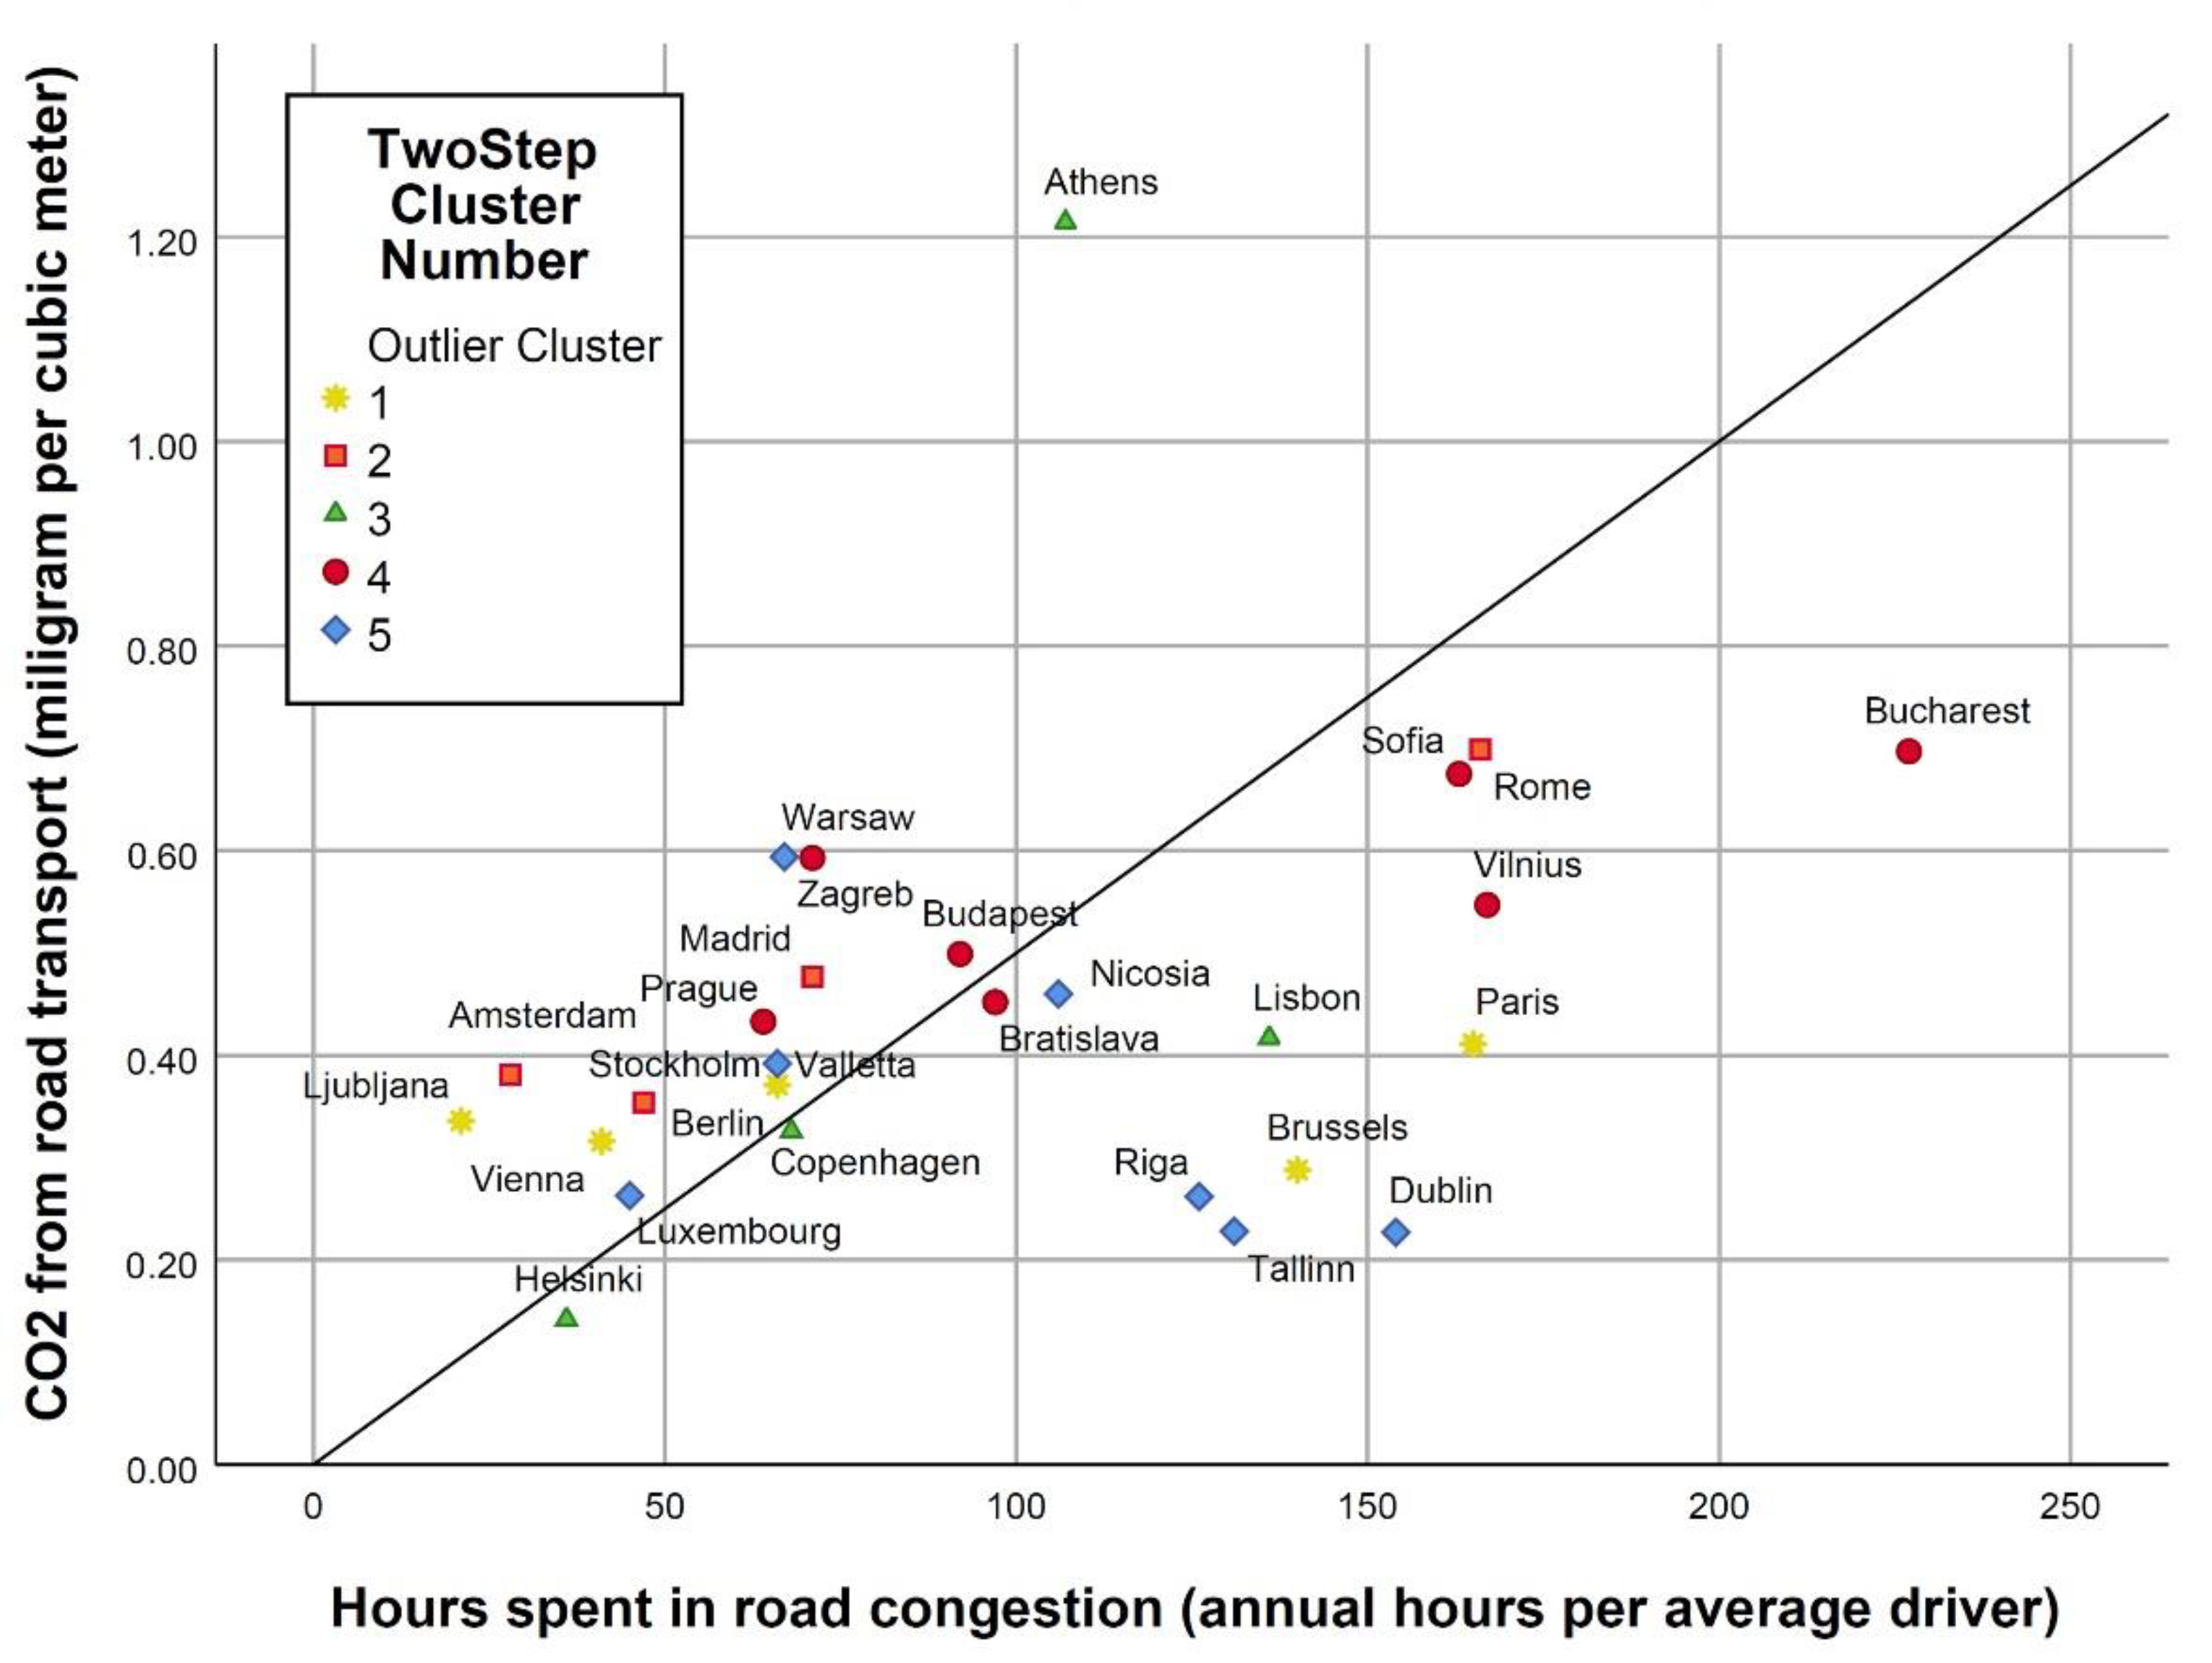
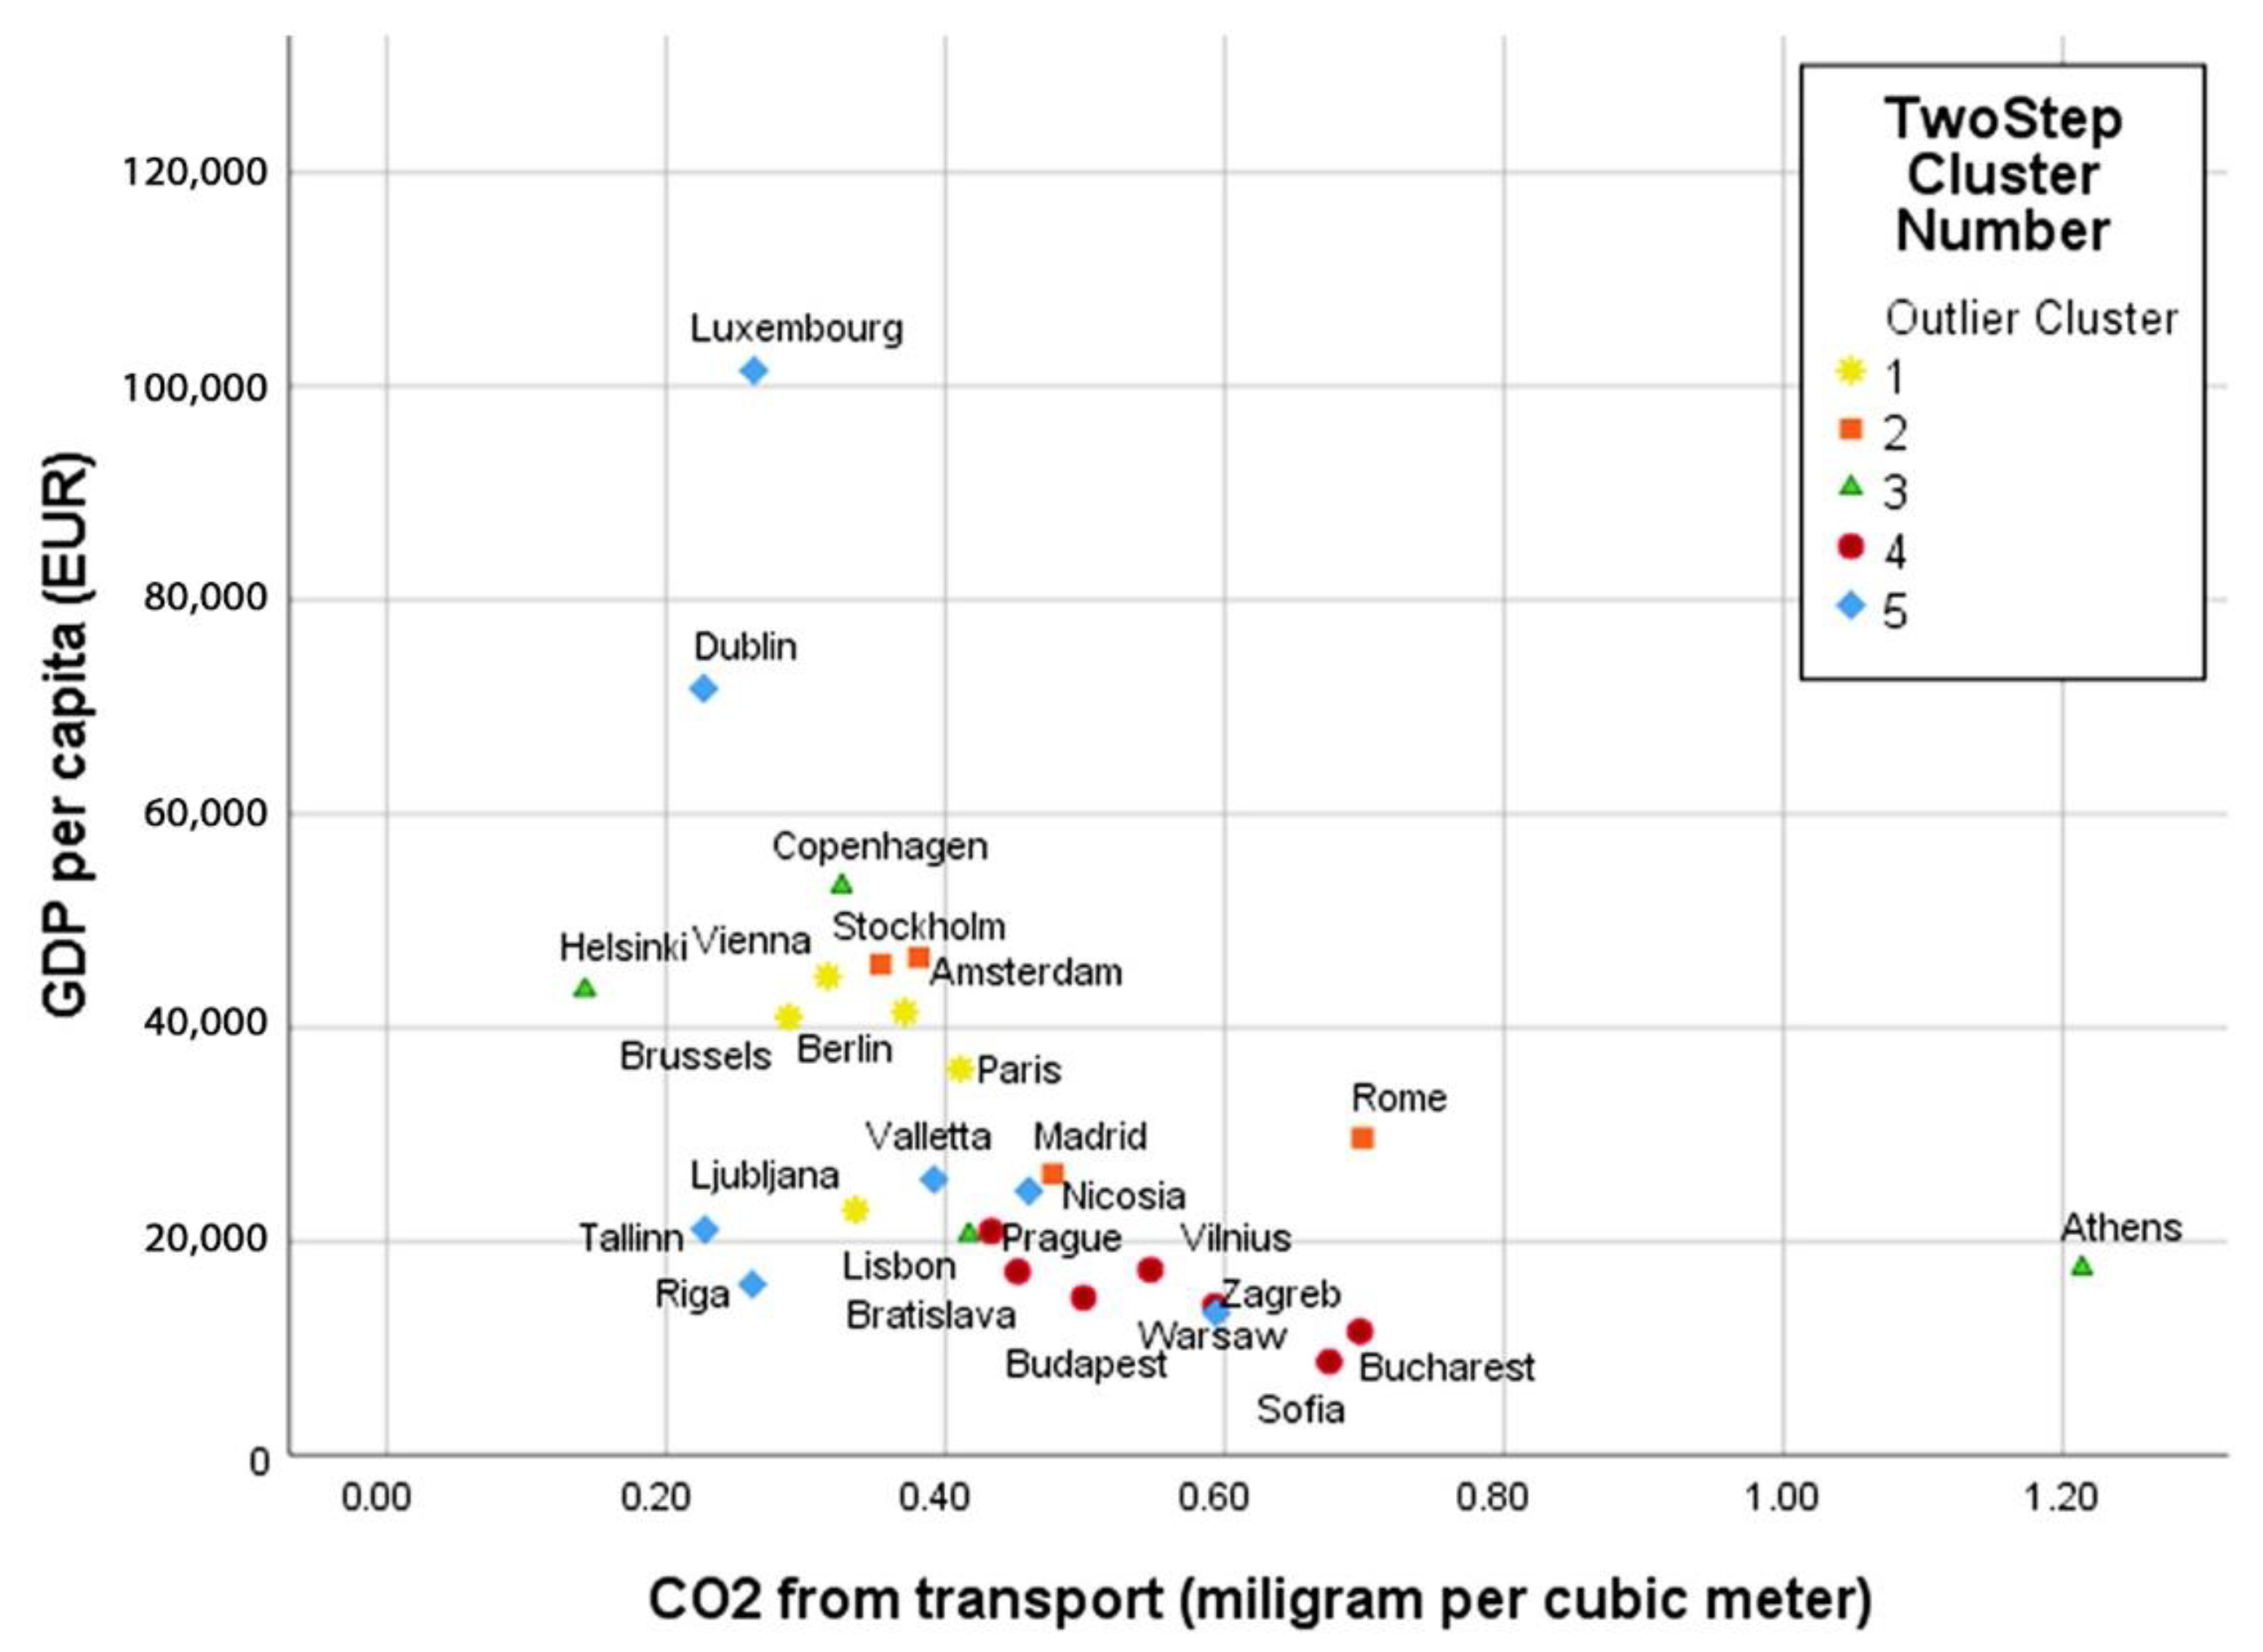
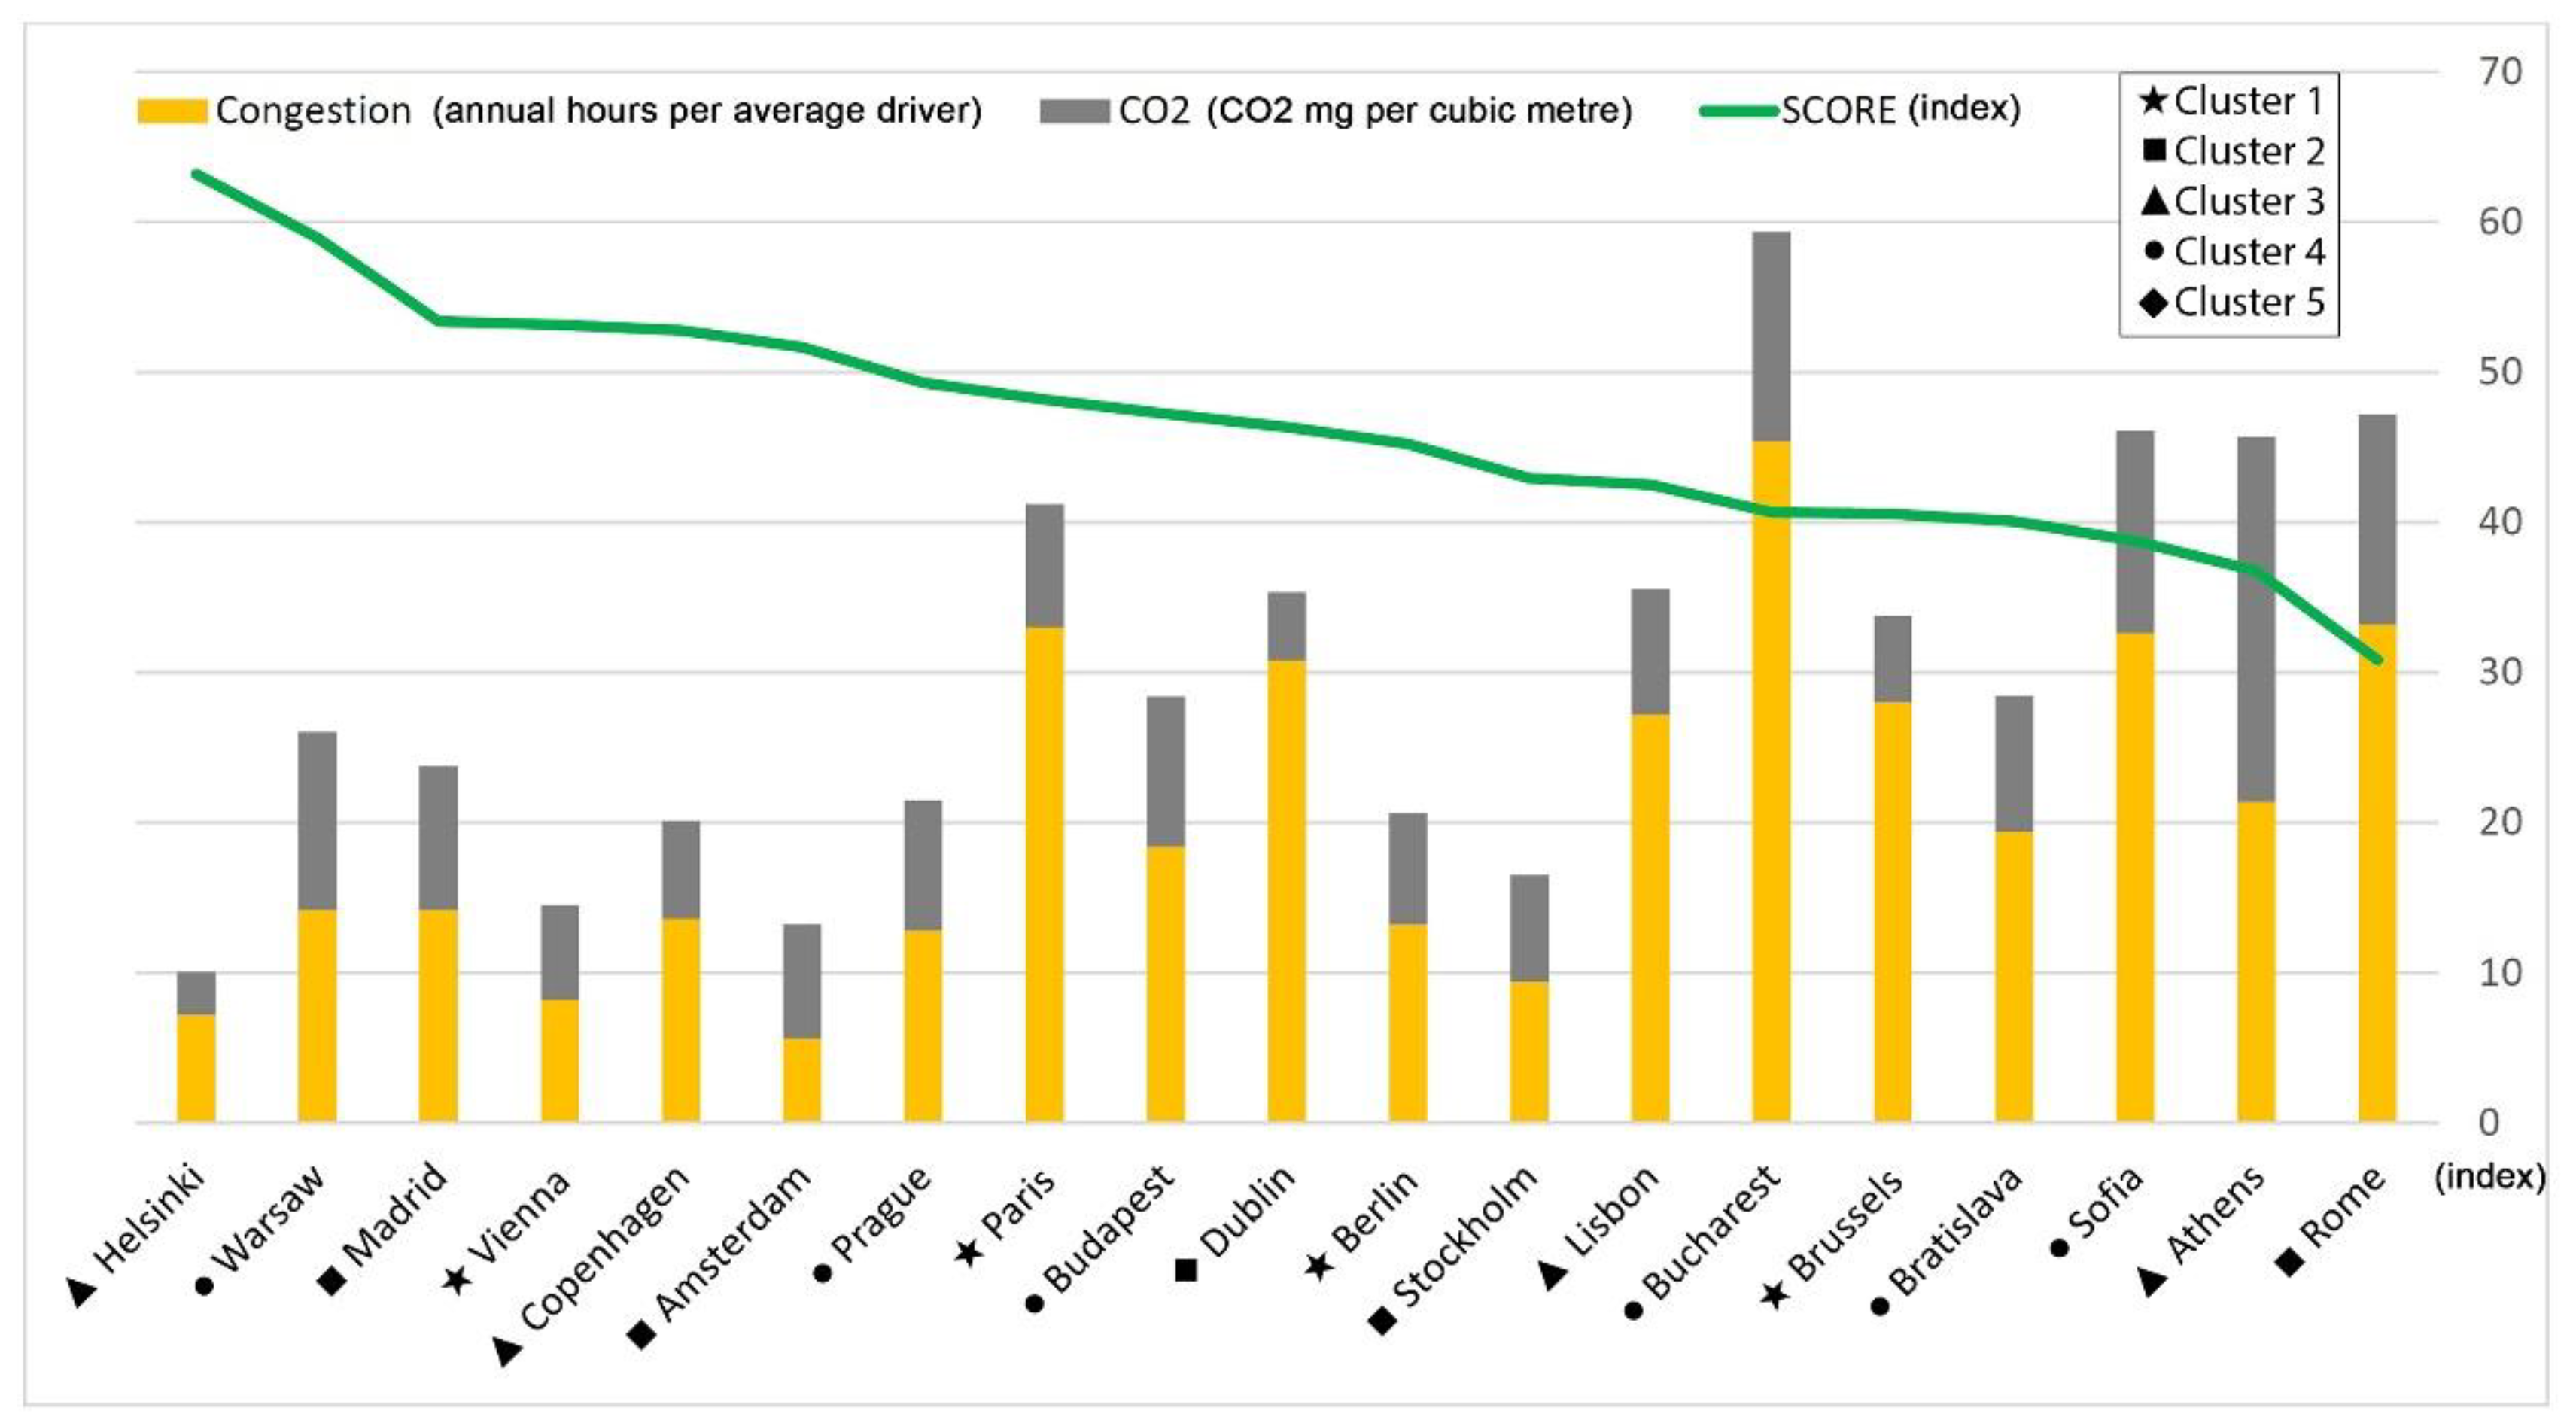
For the purposes of this study, the material was used as follows: From the EUROSTAT database [34], the population and areas of capital cities were obtained. These data were acquired to analyse population density. The investigated regulatory measures [35] (LEZ, time access restrictions, weight restrictions) were subsequently used. UCCs utilisation data were found at multiple sources [36,37]. Air quality statistics from EU27 capital cities (annual average of daily measurements for 2019) were also investigated [38]. The year 2020 was not analysed due to the outbreak of the COVID-19 pandemic, which significantly limited the population’s mobility. To determine the correlation between air quality and the size of the GDP of European countries, GDP per capita data for 2019 [39] were obtained. Information on intermodal terminals in the EU was found in the European database [40] and contained information from 2019. Data from traffic congestions were obtained from the Inrix scorecard [41]. Finally, information on cargo bikes’ utilisation in the EU has been summarised from several sources [42,43,44,45,46].

3. Results

To create clusters of the EU27 capitals concerning city logistics, the logistics determinants (variables) were analysed. Various aspects are essential for the proper functioning of logistics, such as UCCs, restrictions on vehicle entry into the city centre, and low emission zones. The increase in road traffic in city centres has a significant impact on air pollution, the growth of congestion in urban agglomerations, and the quality of life in city centres. Factors that affect the efficiency of distribution in the central urban areas include, for example, the time at the place of loading/unloading, customer requirements, regulatory measures, and traffic intensity, which vary from one EU city to another. The log-likelihood distance measures were computed where all variables were assumed to be independent. The number of clusters was specified manually according to the highest value of cluster quality depicted in Figure 1 (obtained from SPSS). The Bayesian Information Criterion computed a satisfactory quality of the two-step algorithm.
Based on the structure of cities, the following qualitative and quantitative variables were used: UCCs, intermodal terminals, modes of intermodal terminals (combination road + rail + barge or road + rail), low emission zones, time restrictions, weight and delivery by cargo bicycles. Figure 2 (obtained from SPSS) illustrates the importance of individual variables based on the BIC.
UCC works in such a way that, instead of individual goods being transported to all distribution points in the city centre, shipments are delivered to a shared warehouse, from which the final delivery of goods to the city centre will be provided by low/zero-emission vehicles or other modes of transport. It is necessary to focus on the strategic location of the UCCs for the efficient and flexible last mile delivery of goods in congested urban areas. Cities should consider the increased demand for supply in the future, and they must leave some land for the construction of logistics centres. UCC forms the gateway between long-distance transport and the last mile delivery. Ideally, long-distance transport is realised by using capacity-based transport systems, usually using rail or waterborne transport. However, there are many cases where the UCC is connected only to the road infrastructure.
The constant increase in the share of road freight transport in the transportation sector within Europe reduces mobility and slows down sustainable development. One of the alternatives to replace road transport is combined transport (i.e., environmentally acceptable rail and waterborne transport interoperable with flexible road transport). Intermodal transport is becoming one of the leading transport systems to ensure its sustainable development. In the analysed EU27 countries, there are intermodal terminals in 17 capital cities. The combination of rail and road transport is mostly used. However, waterborne transport is also represented in some intermodal terminals.
Currently, most goods are transported by road, which is flexible enough but, to a limited extent, also harms the environment, burdens roads and causes congestion. On the other hand, rail and waterborne transport are more environmentally friendly but are less responsive to market needs, either in terms of price or transport time, than road transport. The solution to this problem can be increasing the capacity of intermodal terminals. Delivery time can be defined in the logistics by time windows. It is a matter of allowing supply only outside rush traffic hours, so the city avoids collisions between trucks and other road users. The entry of vehicles into pedestrian zones is often prohibited, except delivery vehicles allowed at the specified time for distribution. These time limits are adjusted by each city based on its regulations. The problem with these time constraints is that most shipments are inflated quickly, which can cause various accidents or delays. Low emission zones are areas where vehicles must have a certain emission standard and vehicles that do not meet those standards are prohibited from entering. Some LEZs can only work with certain categories of vehicles (trucks, vans, etc.); others deal with all vehicle categories entering this zone. On the one hand, the creation of low emission zones in Europe reduces the area’s burden on exhaust emissions and improves the population’s quality of life. Within the EU, this type of regulation of road freight transport is popular, as cities predominantly use this type of regulation. Cities are interested in reducing the number of vehicles entering the city centre, which results in lower emissions and air pollution. Supply of goods to the city centre can be allowed only for a specific category of vehicles, based on the maximum total weight, the length/width or combination of limitations. It is necessary to apply restrictions due to the narrow lanes in the city centres in most cases. Each city regulates these weight and size limits based on its urban policy. Such restrictions are applied in limited traffic zones (LTZ). A spatial zone where traffic volume is regulated due to the existence of accesses controlled by the city. The influence of LTZ depends on the percentage of an urban area in which the LTZ covers [47]. Distribution of goods by cargo bicycles within the EU is nowadays the most widespread and most popular way for delivery at the city centres. The cargo bike and e-cargo bikes are commercially viable and can be more popular for small shipments and replace the city’s vehicles in low emission zones.
Five clusters obtained by two-step cluster analysis were evaluated. The absolute numbers and the corresponding percentage of objects concerning the total number of objects (size) are given. Table 1 shows that the largest clusters (4 and 5) obtain seven cities while the smallest clusters (2 and 3) only four cities. The ratio of the largest cluster to smallest cluster is 1.75. Cities in the resulting clusters have determinants with a minimum distance. The representatives of the clusters are arranged in alphabetical order. As shown in the analysis results, cluster 1 (Berlin, Brussels, Paris, Ljubljana, Vienna) represents the group of the most advanced European capital cities in terms of implementing the city of logistics measurements. In contrast, cluster 5 (Dublin, Luxembourg, Nicosia, Riga, Tallinn, Valletta, Zagreb) contains cities with shortcomings in city logistics implementation.
The resulting clusters can be characterised as follows: cluster 1 and 2 are dominated by cities with all selected indicators on their territories, such as UCC, intermodal terminals, LEZ, or cargo bikes. However, only half of the cities located in cluster 2 have an intermodal terminal. The cities belonging to cluster 3 have built UCC on their territories, have established LEZ, and only half of the cities in cluster 3 have a weight restriction for distributing goods. The cities in cluster 3 do not have any intermodal terminals in their territory and do not have any time restrictions for the distribution to the city centre. The cities in cluster 4 do not have UCCs built in their territory and have no LEZs in place, although this is one of the popular approaches for regulating distributions in city centres. The cities in cluster 4 are dominated because all cities in this cluster have weight and time restrictions for the distribution of goods and intermodal terminals. Finally, cluster 5 includes the cities with the worst evaluation of selected determinants of all capital cities. Because the cities in this cluster do not have any UCCs in place, they do not have any time or weight restrictions on the entry of vehicles into the city centre, and they also do not have any LEZs in place in their territory. Although most of the analysed cities use cargo bicycles for supply, this does not have a high impact on the overall results.
The determinant modes of intermodal terminals represent the type of transport used in the given terminal. R-R transport is most often used in terminals, where this combination represents road and rail, or the combination of R-R-B is also used, where barge is also used for road and rail.
The growth in the number of vehicles in urban agglomerations has a negative effect, in the form of adverse consequences on the environment, on congestion, but on the other hand, it positively affects economic development. The increase in the number of vehicles is most intense in densely populated areas, which have difficulties with environmental sustainability and mainly affect the negative air quality [48].
Due to the high population density in urban areas and limited infrastructure resources, urban transport faces many problems. Additionally, in dense areas, it is assumed that the level of congestion caused by traffic will increase. With the correct implementation of logistics measures or with the introduction of logistics systems, these bottlenecks may be lower, even if the city has a high population density per square km. It can be argued that a lower level of population density per square km also represents a lower level of congestion. Table 2 shows the characteristics of clusters using the above analysed determinants. It was necessary to find out how the categorical and scale variables are represented in the clusters.
Figure 3 depicts the investigated cities concerning their CO2 emissions produced by road transportation and the annual congestion for 2019 expressed in hours. The diagonal reference line determines the correlation between CO2 emissions and traffic congestion. Cities belonging to cluster 1 confirm that, even with the high population density and congestion that occurs in cities, with appropriately selected logistics measures, the city of logistics can be affected to a lesser extent. Capitals in cluster 1 try to address transport in their city centres through various measures and logistics systems and reduce the negative impact of transport on the environment and quality of life. One of city logistics goals is to ensure comprehensive transport services in the city and adjacent agglomerations, where cities try to meet the needs of urban mobility and urban logistics based on measures and various logistics systems. The cities in cluster 1 are doing well; on the contrary, Clusters 4 and 5 should try their measures better to apply the various logistics systems in their territory. The capacity of transport networks in large cities is currently insufficient; therefore, congestion occurs, which is caused by the interaction of passenger and freight transport. Cities need to have sufficient transport network capacities to cope with the ever-increasing number of vehicles moving in city centres. Due to adequate transport capacity, there will be no congestion and traffic will be smooth.
In logistics, the quality and reliability of services in the implementation of distribution is essential. Logistics must ensure that the various logistics systems follow each other smoothly and that the means of distribution to the city centre have the shortest delay time, at best no delay within these systems. The smoothness and efficiency of the distribution of goods can be increased by investing in the renewal, widening or construction of new roads, which will increase traffic capacity and thus prevent congestion.
As already mentioned, the increase in the number of vehicles in urban agglomerations is negative on the one hand (environmental impact, congestion), but has a positive effect on overall development. The performance of country economics can also be measured as the volume of GDP per capita. In 2020, there was a drop in GDP caused by COVID-19, so data was considered for 2019. The more developed the country, the higher the GDP per capita it can produce. More advanced countries have a more efficient system, such as tax collection, a higher population level, developed infrastructure, etc. The impact of GDP growth may be correlated with an increase in freight volume [49,50].
Carbon dioxide is expressed as the annual average of eight hours of daily measurements. Measuring stations are located in city centres, and the evaluated data records the level of air pollution from traffic. The EU has called for significant reductions in greenhouse gas emissions, and the transport sector, which is an important and growing source of greenhouse gases, is required to reduce greenhouse gas emissions by at least 60% by 2050. By 2030, the transport sector will aim to reduce greenhouse gas emissions by about 20% below the level of 2008, compared to 1990 [51].
Cities belonging to cluster 1, depicted in Figure 4, produced a relatively low amount of CO2 from transport (from 0.371 mg/m3 to 0.411 mg/m3). The cities from clusters 4 and 5 do not belong to the most developed countries in terms of their GDP, so investments in logistics and various measures are noticeable. Therefore, the amount of produced CO2 is higher. Cities worldwide are increasingly becoming representatives of climate change mitigation, while simultaneously aiming for other goals, such as improved accessibility and clean air [52]. As shown in Figure 4, the lowest CO2 emissions were measured in Helsinki, which belongs to cluster 3, contrasting Athens (from the same cluster) has the least satisfactory air quality. Tallinn, Dublin, Luxembourg, and Riga from cluster 2 have the lowest emissions from transport. Apart from Luxembourg, these cities are coastal, which can have a positive effect on air quality. However, examining the types and number of registered vehicles by age and emission standard should be considered.
The negative impact of traffic on urban agglomerations is relatively high. Therefore, cities (the relevant city authorities) actively participate in creating projects related to city logistics and urban transport, reducing the negative impacts resulting from the distribution of goods. The EU supports research and innovation in its framework programs [53], as shown in Figure 5, which shows the percentages of European structural and investment projects approved over the horizon (2014 to 2020).
The impact of some cities’ regulatory measures is insufficient, outdated, or does not meet the current requirements for required logistics performance. Some research projects have already been successfully solved in several cities, such as the projects CIVITAS and NOVELOG, etc. CIVITAS cities’ network is for municipalities dedicated to cleaner, better transport in Europe [47]. NOVELOG project conducts to new cooperative business models and guidance for sustainable city logistics [54].
Mohanty et al. [55] defined smart transportation as intelligent transport systems (ITS). It includes different kinds of communication and navigation technologies in vehicles, between vehicles (e.g., car-to-lorry), and between vehicles and fixed locations (e.g., lorry-to-infrastructure). Additionally, ITS covers the rail, water, and air transport systems, and even their interoperability.
Modern metropolises worldwide are becoming smart cities, utilising digital technologies and big data to deal with numerous issues, such as emphasising e-governance and service provision, constructing more robust critical infrastructure, growing the urban economics, becoming more sustainable, generating improved mobility, enhancing the higher quality of life, and increasing safety and security [56].
Nowadays, the city has become a smart city by implementing various innovations, autonomously from their general plans. Therefore, the smart city is not defined by the urban plan, but by a capability to adapt to the requirements resulting from economic, technological, and cultural development [57].
ITS work with a continual flow of big data which are analysed by algorithms. For instance, a citizen may search at a mobile application which transportation use for the shortest travel time. A traffic light can identify a bus approaching and turn green to give public transport priority over other vehicles. At its most enthusiastic, a smart city could be defined as an “innovative city that uses information and communication technologies and other means to improve quality of life, the efficiency of urban operation and services and competitiveness while ensuring the needs of present and future generations concerning economic, social, environmental as well as cultural aspects.” [58].
The smart city index (SCI) is the first global index evaluating the “smart” level of a city, which assesses urban areas based on their inhabitants’ views. It evaluates how residents perceive the scale and impact of efforts to make their cities intelligent. The smart city index was settled by a collaboration between The Institute for Management Development (IMD) in Lausanne and Singapore University of Technology and Design (SUTD).
The smart city index ranks cities based on economic and technological data, as well as by their citizens’ perceptions of how “smart” their cities are. The SCI measures inhabitants’ perceptions on issues related to infrastructure and technologies available to them in their city. The final score for each city is computed using the biennial survey [59].
Every city within the EU is unique, and it is not easy to compare them with each other. Each city solves problems related to its traffic jams, air quality, the excessive number of vehicles in city centres, and road traffic safety. The smart city’s concept involves essential transportation solutions that reflect their sustainability, feasibility deployment into full operation, and safety in transport. Concerning the cluster analysis results, it is possible to evaluate SCI respecting the smart mobility score with environmental aspects and road throughput. Figure 6 depicts the grouped graph of the smart city score (green line) by traffic congestions and CO2.
The smart city index’s original data were obtained from the Eurostat, the United Nations and the Unhabitat databases. Within the EU27, SCI data were available for 19 capitals for the year 2019.
The graph shows traffic congestion and CO2 emissions that affect neither the city logistics, urban transport, or the quality of residents’ lives. Based on the smart city score, the best rated European capitals in terms of urban mobility are Helsinki, Warsaw, Madrid, Vienna and Copenhagen. Based on the given cities’ measures, the inhabitants perceive logistics, transport and mobility in their city at a high level. Therefore, the given cities achieved the highest smart city scores of all the analysed EU27 cities. Of all the cities, Helsinki (belongs to cluster 3) has the highest smart city rating of its inhabitants; it has the lowest level of congestion and at the same time CO2 emissions.
On the other hand, Vienna is in the 4th place, but based on the cluster analysis, it belongs to cluster 1. The city of Rome is in the last place; oppositely it belongs to cluster 2. It follows that individual capital from the SCI point of view does not correlate with the evaluated clusters. It means that cities with excellent logistics measures may not be advanced in terms of smart city solutions and vice versa.

4. Discussion

This paper shows how two-step clustering can be used to identify homogenous groups of cities concerning their development of city logistics. From a theoretical perspective, the contribution points out the possibility of applying a two-step cluster algorithm to assess city logistics performance. Several essential factors limit this analysis. Firstly, qualitative (yes/no) variables were used in five of seven cases, and future research should use more quantitative variables such as the number of lorries, tonne-kilometres or share of transportation modes. Secondly, the sample is limited to metropolitan areas, meaning that any assessments in a functional urban area (FUA) would also be beneficial. Thirdly, this study was conducted at the end of 2020, and due to the COVID-19 pandemic, the period from 2018 to 2019 was analysed. The upcoming research should extend the current sample to take the city logistics index and the supplementary statistical analysis methods into account. Our further work will also consider the analysis of EU-funded projects dedicated to mitigating logistics and environmental issues in urban areas, following discussion contents to more comprehensively approach the scoped issues presented in the paper’s results.
We can conclude that today’s commercial freight transport has to cope with ever-smaller shipments on the one hand and increasing requirements of speedy and time-exact delivery on the other. In the context of growing environmental awareness and the increased efficiency of distribution systems, it is essential to look for alternative vehicles that cause fewer emissions. Furthermore, increasing traffic volumes and a lack of parking places add to urban distribution systems’ challenges. Electric vehicles offer themselves as alternative vehicle concepts (Project DisLog) [60]. The choice of e-vehicles for commercial transport is still insufficient, though, and little is known about the requirements and impacts of electric vehicles on the efficiency of urban deliveries [61]. There is a need to study the number of e-vehicles currently in use. This paper also examined the relationship between produced CO2 and GDP per capita, and whether the analysed EU cities’ clusters are related to these statistics.
It is also due to the low number of vehicles currently in use. This paper also examined the relationship between CO2 and GDP per capita, and whether it affects the investment of the analysed EU cities on the level of emissions produced from transport. Improving mobility and transport in cities requires investment in green transport infrastructure and reduced congestion caused by traffic. Urban transport directly affects citizens’ daily lives and is also a strategic sector of the European economy. Therefore, it is necessary to further assess the current state of investment in transport infrastructure development. Highly developed countries are trying to take actions that will persuade their citizens to move from cars to green means of transport. It is necessary to analyse the share of electric vehicles, respectively, eco-friendly vehicles [62] used for distribution to the total number of freight vehicles.
Figure 5 showed the percentages of funded projects between 2014 and 2020 based on particular topics. Furthermore, it would be necessary to identify a specific number of projects aimed at solving the logistics, distribution of goods, transport itself, and environmental issues within urban agglomerations. It is necessary to cross-sectionally evaluate projects in cities where they have already been implemented and focus on the benefits. Due to the increasing importance of solving the mentioned problems, it is necessary to analyse the geographical distribution of projects and trends in technological development.
It is also essential to investigate national legislation in relation to spatial planning, which affects the proper functioning of logistics and urban transport. Differences in the approval of legislative measures and the delimitation of areas designated for logistics should be considered. Similarly, examining urban transhipment warehouses and their strategic location for efficient and flexible delivery at the last mile in urban areas is required [63]. It is essential to point out the lack of these areas for securing the logistics because cities forget about the problems related to the distribution of goods and solve the general transport issues, mainly parking policies, in their cities. In the last two decades, parking has increasingly gained importance in urban planning because car ownership and use keep growing while urban space becomes alarming [64].
The paper also considered the congestion arising in urban agglomerations caused by the growing number of inhabitants living in cities and the related mobility and logistics. Night-time delivery can also help reduce congestion in cities where the aim is to limit freight transport in peak hours of cities during the day. There is a need to assess the results of night distribution based on implemented projects dealing with night-time delivery, analyse performance, driving efficiency, reliability of goods delivery, and assess emission reductions.

5. Conclusions

City logistics comprise the delivery and collection of goods in urban areas. Improving city logistics may address transportation methods, handling and storage of goods, management of inventory, waste and returns, and home delivery services. Making this process sustainable requires efficient interfaces between long-haul transport and short-distance distribution to the destination. It also requires efficient planning of the routes to avoid empty runs or unnecessary driving and parking. Furthermore, sustainable urban freight requires smaller, more efficient and cleaner vehicles. Well-planned and managed transport can be an essential factor in the success of logistics and can play a large part in meeting the set logistics goals.
On the other hand, errors and shortcomings in transport can cause the collapse of the entire logistics system and cause unnecessary costs. Well-organised transport is a factor in the success of logistics. Another critical factor for successful logistics in the city centre is the appropriate location of industrial zones and logistics centres. Therefore, cities must set aside territories in their zoning plans and land to construct industrial zones, warehousing, and logistics.

Author Contributions

Introduction—F.Š., J.G.; literature review—F.Š., D.B., J.G.; materials and methods—D.B., F.Š.; data curation—F.Š., D.B.; results—F.Š., D.B., J.G.; writing original draft—F.Š. and D.B.; visualisation—F.Š., D.B.; internal review and editing—J.G. All authors have read and agreed to the published version of the manuscript.

Funding

This research was funded by the Center of Excellence for Systems and Services of Intelligent Transport II., ITMS 26220120050 supported by the Research & Development Operational Program funded by the ERDF and also thanks to the project institutional research of the Faculty of Operation and Economics of Transport and Communications, University of Žilina no. 3/KCMD/2020 Research of selected aspects of transport services of cities and regions by passenger and freight transport.

Institutional Review Board Statement

Not applicable.

Informed Consent Statement

Not applicable.

Data Availability Statement

Used data can be found in the relevant references [34,35,36,37,38,39,40,41,42].

Conflicts of Interest

The authors declare no conflict of interest.

References

  1. Majerčák, J.; Majerčák, P. Logistika, 1st ed.; DOLIS: Bratislava, Slovakia, 2015; Volume 1, ISBN 978-80-8181-019-0. [Google Scholar]
  2. Panuccio, P. Smart Planning: From City to Territorial System. Sustainability 2019, 11, 7184. [Google Scholar] [CrossRef] [Green Version]
  3. Cugurullo, F. Exposing smart cities and eco-cities: Frankenstein urbanism and the sustainability challenges of the experimental city. Environ. Plan. A Econ. Space 2018, 50, 73–79. [Google Scholar] [CrossRef]
  4. Albalate, D.; Fageda, X. Congestion, Road Safety, and the Effectiveness of Public Policies in Urban Areas. Sustainability 2019, 11, 5092. [Google Scholar] [CrossRef] [Green Version]
  5. Currie, J.; Walker, R. Traffic Congestion and Infant Health: Evidence from E-ZPass. Am. Econ. J. Appl. Econ. 2011, 3, 65–90. [Google Scholar] [CrossRef] [Green Version]
  6. Beaudoin, J.; Farzin, Y.H.; Lin, C. Public transit investment and sustainable transportation: A review of studies of transit’s impact on traffic congestion and air quality. Res. Transp. Econ. 2015, 52, 15–22. [Google Scholar] [CrossRef]
  7. He, Z.; Haasis, H.-D. A Theoretical Research Framework of Future Sustainable Urban Freight Transport for Smart Cities. Sustainability 2020, 12, 1975. [Google Scholar] [CrossRef] [Green Version]
  8. Russo, F.; Comi, A. Investigating the Effects of City Logistics Measures on the Economy of the City. Sustainability 2020, 12, 1439. [Google Scholar] [CrossRef] [Green Version]
  9. Matusiewicz, M. Towards Sustainable Urban Logistics: Creating Sustainable Urban Freight Transport on the Example of a Limited Accessibility Zone in Gdansk. Sustainability 2019, 11, 3879. [Google Scholar] [CrossRef] [Green Version]
  10. Semanjski, I.; Gautama, S. A Collaborative Stakeholder Decision-Making Approach for Sustainable Urban Logistics. Sustainability 2019, 11, 234. [Google Scholar] [CrossRef] [Green Version]
  11. Ros-McDonnell, L.; de-la-Fuente-Aragón, M.V.; Ros-McDonnell, D.; Cardós, M. Analysis of freight distribution flows in an urban functional area. Cities 2018, 79, 159–168. [Google Scholar] [CrossRef]
  12. Hanzl, J. General Application of Multiple Criteria Decision Making Methods for Finding the Optimal Solution in City Logistics. Open Eng. 2020, 10, 147–153. [Google Scholar] [CrossRef]
  13. Shafique, M.; Azam, A.; Rafiq, M.; Luo, X. Evaluating the Relationship between Freight Transport, Economic Prosperity, Urbanization, and CO2 Emissions: Evidence from Hong Kong, Singapore, and South Korea. Sustainability 2020, 12, 10664. [Google Scholar] [CrossRef]
  14. Bosona, T. Urban Freight Last Mile Logistics—Challenges and Opportunities to Improve Sustainability: A Literature Review. Sustainability 2020, 12, 8769. [Google Scholar] [CrossRef]
  15. Wei, H.; Li, A.; Jia, N. Research on Optimization and Design of Sustainable Urban Underground Logistics Network Framework. Sustainability 2020, 12, 9147. [Google Scholar] [CrossRef]
  16. Inkinen, T.; Hämäläinen, E. Reviewing Truck Logistics: Solutions for Achieving Low Emission Road Freight Transport. Sustainability 2020, 12, 6714. [Google Scholar] [CrossRef]
  17. Sanchez-Iborra, R.; Bernal-Escobedo, L.; Santa, J. Eco-Efficient Mobility in Smart City Scenarios. Sustainability 2020, 12, 8443. [Google Scholar] [CrossRef]
  18. Santos, F.M.; Gómez-Losada, Á.; Pires, J.C. Impact of the implementation of Lisbon low emission zone on air quality. J. Hazard. Mater. 2019, 365, 632–641. [Google Scholar] [CrossRef]
  19. Campbell, T.; Roberts, N. The impacts low emission zones have on improving health and decreasing health inequalities. Asthma Epidemiol. Underst. Probl. 2019, 171. [Google Scholar] [CrossRef]
  20. Skrúcaný, T.; Kendra, M.; Stopka, O.; Milojević, S.; Figlus, T.; Csiszár, C. Impact of the Electric Mobility Implementation on the Greenhouse Gases Production in Central European Countries. Sustainability 2019, 11, 4948. [Google Scholar] [CrossRef] [Green Version]
  21. Li, W.; Li, K.; Kumar, P.N.R.; Tian, Q. Simultaneous product and service delivery vehicle routing problem with time windows and order release dates. Appl. Math. Model. 2021, 89, 669–687. [Google Scholar] [CrossRef]
  22. Sitek, P.; Wikarek, J.; Rutczyńska-Wdowiak, K.; Bocewicz, G.; Banaszak, Z. Optimization of capacitated vehicle routing problem with alternative delivery, pick-up and time windows: A modified hybrid approach. Neurocomputing 2021, 423, 670–678. [Google Scholar] [CrossRef]
  23. Johansson, H.; Björklund, M. Urban consolidation centres: Retail stores’ demands for UCC services. Int. J. Phys. Distrib. Logist. Manag. 2017, 47, 646–662. [Google Scholar] [CrossRef] [Green Version]
  24. Zunder, T.; Marinov, M. Urban freight concepts and practice: Would a traditional ucc scheme work? Transp. Probl. 2011, 6, 87–95. [Google Scholar]
  25. Carboni, A.; Deflorio, F.; Chiara, B.D. Monitoring truck’s operations at freight intermodal terminals: Traffic observation by scanning on-board devices. IET Intell. Transp. Syst. 2020, 14, 1638–1646. [Google Scholar] [CrossRef]
  26. Tadić, S.; Krstić, M.; Brnjac, N. Selection of efficient types of inland intermodal terminals. J. Transp. Geogr. 2019, 78, 170–180. [Google Scholar] [CrossRef]
  27. Ližbetin, J.; Stopka, O. Application of Specific Mathematical Methods in the Context of Revitalisation of Defunct Intermodal Transport Terminal: A Case Study. Sustainability 2020, 12, 2295. [Google Scholar] [CrossRef] [Green Version]
  28. Quak, H.; de Koster, R. The Impacts of Time Access Restrictions and Vehicle Weight Restrictions on Food Retailers and the Environment. Eur. J. Transp. Infrastruct. Res. 2006, 6, 131–150. [Google Scholar]
  29. Assmann, T.; Bobeth, S.; Fischer, E. A Conceptual Framework for Planning Transhipment Facilities for Cargo Bikes in Last Mile Logistics. In Data Analytics: Paving the Way to Sustainable Urban Mobility Advances in Intelligent Systems and Computing; Springer: Cham, Switzerland, 2018; pp. 575–582. [Google Scholar]
  30. Çekerol, G.S. Classification of Logistics-Based Transportation Activities in OECD Countries and Selected Non-Member Countries Through Cluster Analysis. In Mehmet Akif Ersoy Üniversitesi İktisadi ve İdari Bilimler Fakültesi Dergisi; Available online: https://dergipark.org.tr/tr/pub/makuiibf/issue/56236/720768 (accessed on 7 December 2020).
  31. Trebuňa, P.; Halčinová, J. Principles of Cluster Analysis. Available online: https://www.sjf.tuke.sk/umpadi/taipvpp/2010/index.files/clanky%20PDF/TREBUNA_HALCINOVA.pdf (accessed on 9 December 2020).
  32. Norusis, M.J. IBM SPSS Statistics 19 Advanced Statistical Procedures Companion; Upper Saddle River: Prentice Hall, NJ, USA, 2012. [Google Scholar]
  33. Astuti, A.B.; Fernandes AA, R.; Amaliana, L.; Yanti, I.; Isaskar, R. Two Step Cluster Analysis for Tourist Segmentation Coastal Object for Green Marketing Strategy. In IOP Conference Series: Earth and Environmental Science; Available online: https://iopscience.iop.org/article/10.1088/1755-1315/239/1/012019/pdf (accessed on 10 December 2020).
  34. EUROSTAT Population on 1 January by Age Groups and Sex—Cities and Greater Citiesv3.7.0-20201106-5867-ESTAT. Available online: https://ec.europa.eu/eurostat/web/cities/data/database (accessed on 10 December 2020).
  35. User, S. Schemes by Country. Available online: https://urbanaccessregulations.eu/countries-mainmenu-147 (accessed on 11 December 2020).
  36. Amstel, W.P. van Tag: Urban Consolidation Center. Available online: http://www.citylogistics.info/tag/urban-consolidation-center/ (accessed on 11 December 2020).
  37. The First Sustainable Urban Logistics Centre Opens in Madrid. Available online: https://www.eltis.org/discover/news/first-sustainable-urban-logistics-centre-opens-madrid (accessed on 11 December 2020).
  38. Air Quality Statistics. Available online: https://www.eea.europa.eu/data-and-maps/dashboards/air-quality-statistics (accessed on 12 December 2020).
  39. Clark, P. GDP European Countries. Available online: https://www.statista.com/statistics/685925/gdp-of-european-countries/ (accessed on 13 December 2020).
  40. Intermodal Terminals in Europe/Agora. Available online: https://www.intermodal-terminals.eu/database (accessed on 15 December 2020).
  41. Inrix Scorecard. Available online: https://inrix.com/scorecard/ (accessed on 16 December 2020).
  42. NOVELOG Cities & Regions Factsheets. Available online: http://novelog.eu/wp-content/uploads/2018/08/05287-Polis-Novelog-Brochure-06-WEB.pdf (accessed on 17 December 2020).
  43. Cargo Bikes. Available online: http://www.cyclelogistics.eu/ (accessed on 18 December 2020).
  44. Meet MOVEBYBiKE Stockholm, Our First Leasing Customer. Available online: https://www.velove.se/news/meet-movebybike-stockholm-our-first-leasing-customer (accessed on 18 December 2020).
  45. Rome Logistics Living Lab—Cargo Bike. Available online: http://www.trelab.it/2019/04/18/rome-logistics-living-lab-cargo-bike/ (accessed on 18 December 2020).
  46. Cycle Logistics—Moving Goods by Cycle. Available online: https://civitas.eu/sites/default/files/1212_epomm_enews_cyclelogistics.pdf (accessed on 19 December 2020).
  47. Living Labs. Available online: https://civitas.eu/projects (accessed on 5 January 2021).
  48. Road Freight Transport by Vehicle Characteristics. Available online: https://ec.europa.eu/eurostat/statistics-explained/index.php/Road_freight_transport_by_vehicle_characteristics#Vehicle_fleets (accessed on 15 December 2020).
  49. Zhao, Q.; Ding, H.; Liu, H.; Qin, H. The analysis of correlation between logistics and GDP. In Proceedings of the ICSSSM′05. 2005 International Conference on Services Systems and Services Management, Chongquing, China, 13–15 June 2005. [Google Scholar]
  50. Reza, M. The Relationship between Logistics and Economic Development in Indonesia: Analysis of Time Series Data. Jurnal Teknik Industri 2013, 15, 119–124. [Google Scholar] [CrossRef] [Green Version]
  51. European Commission White Paper. Roadmap to a Single European Transport Area—Towards a Competitive and Resource-Efficient Transport System; European Commission: Brussels, Belgium, 2011. [Google Scholar]
  52. Creutzig, F.; Mühlhoff, R.; Römer, J. Decarbonizing urban transport in European cities: Four cases show possibly high co-benefits. Environ. Res. Lett. 2012, 7, 044042. [Google Scholar] [CrossRef]
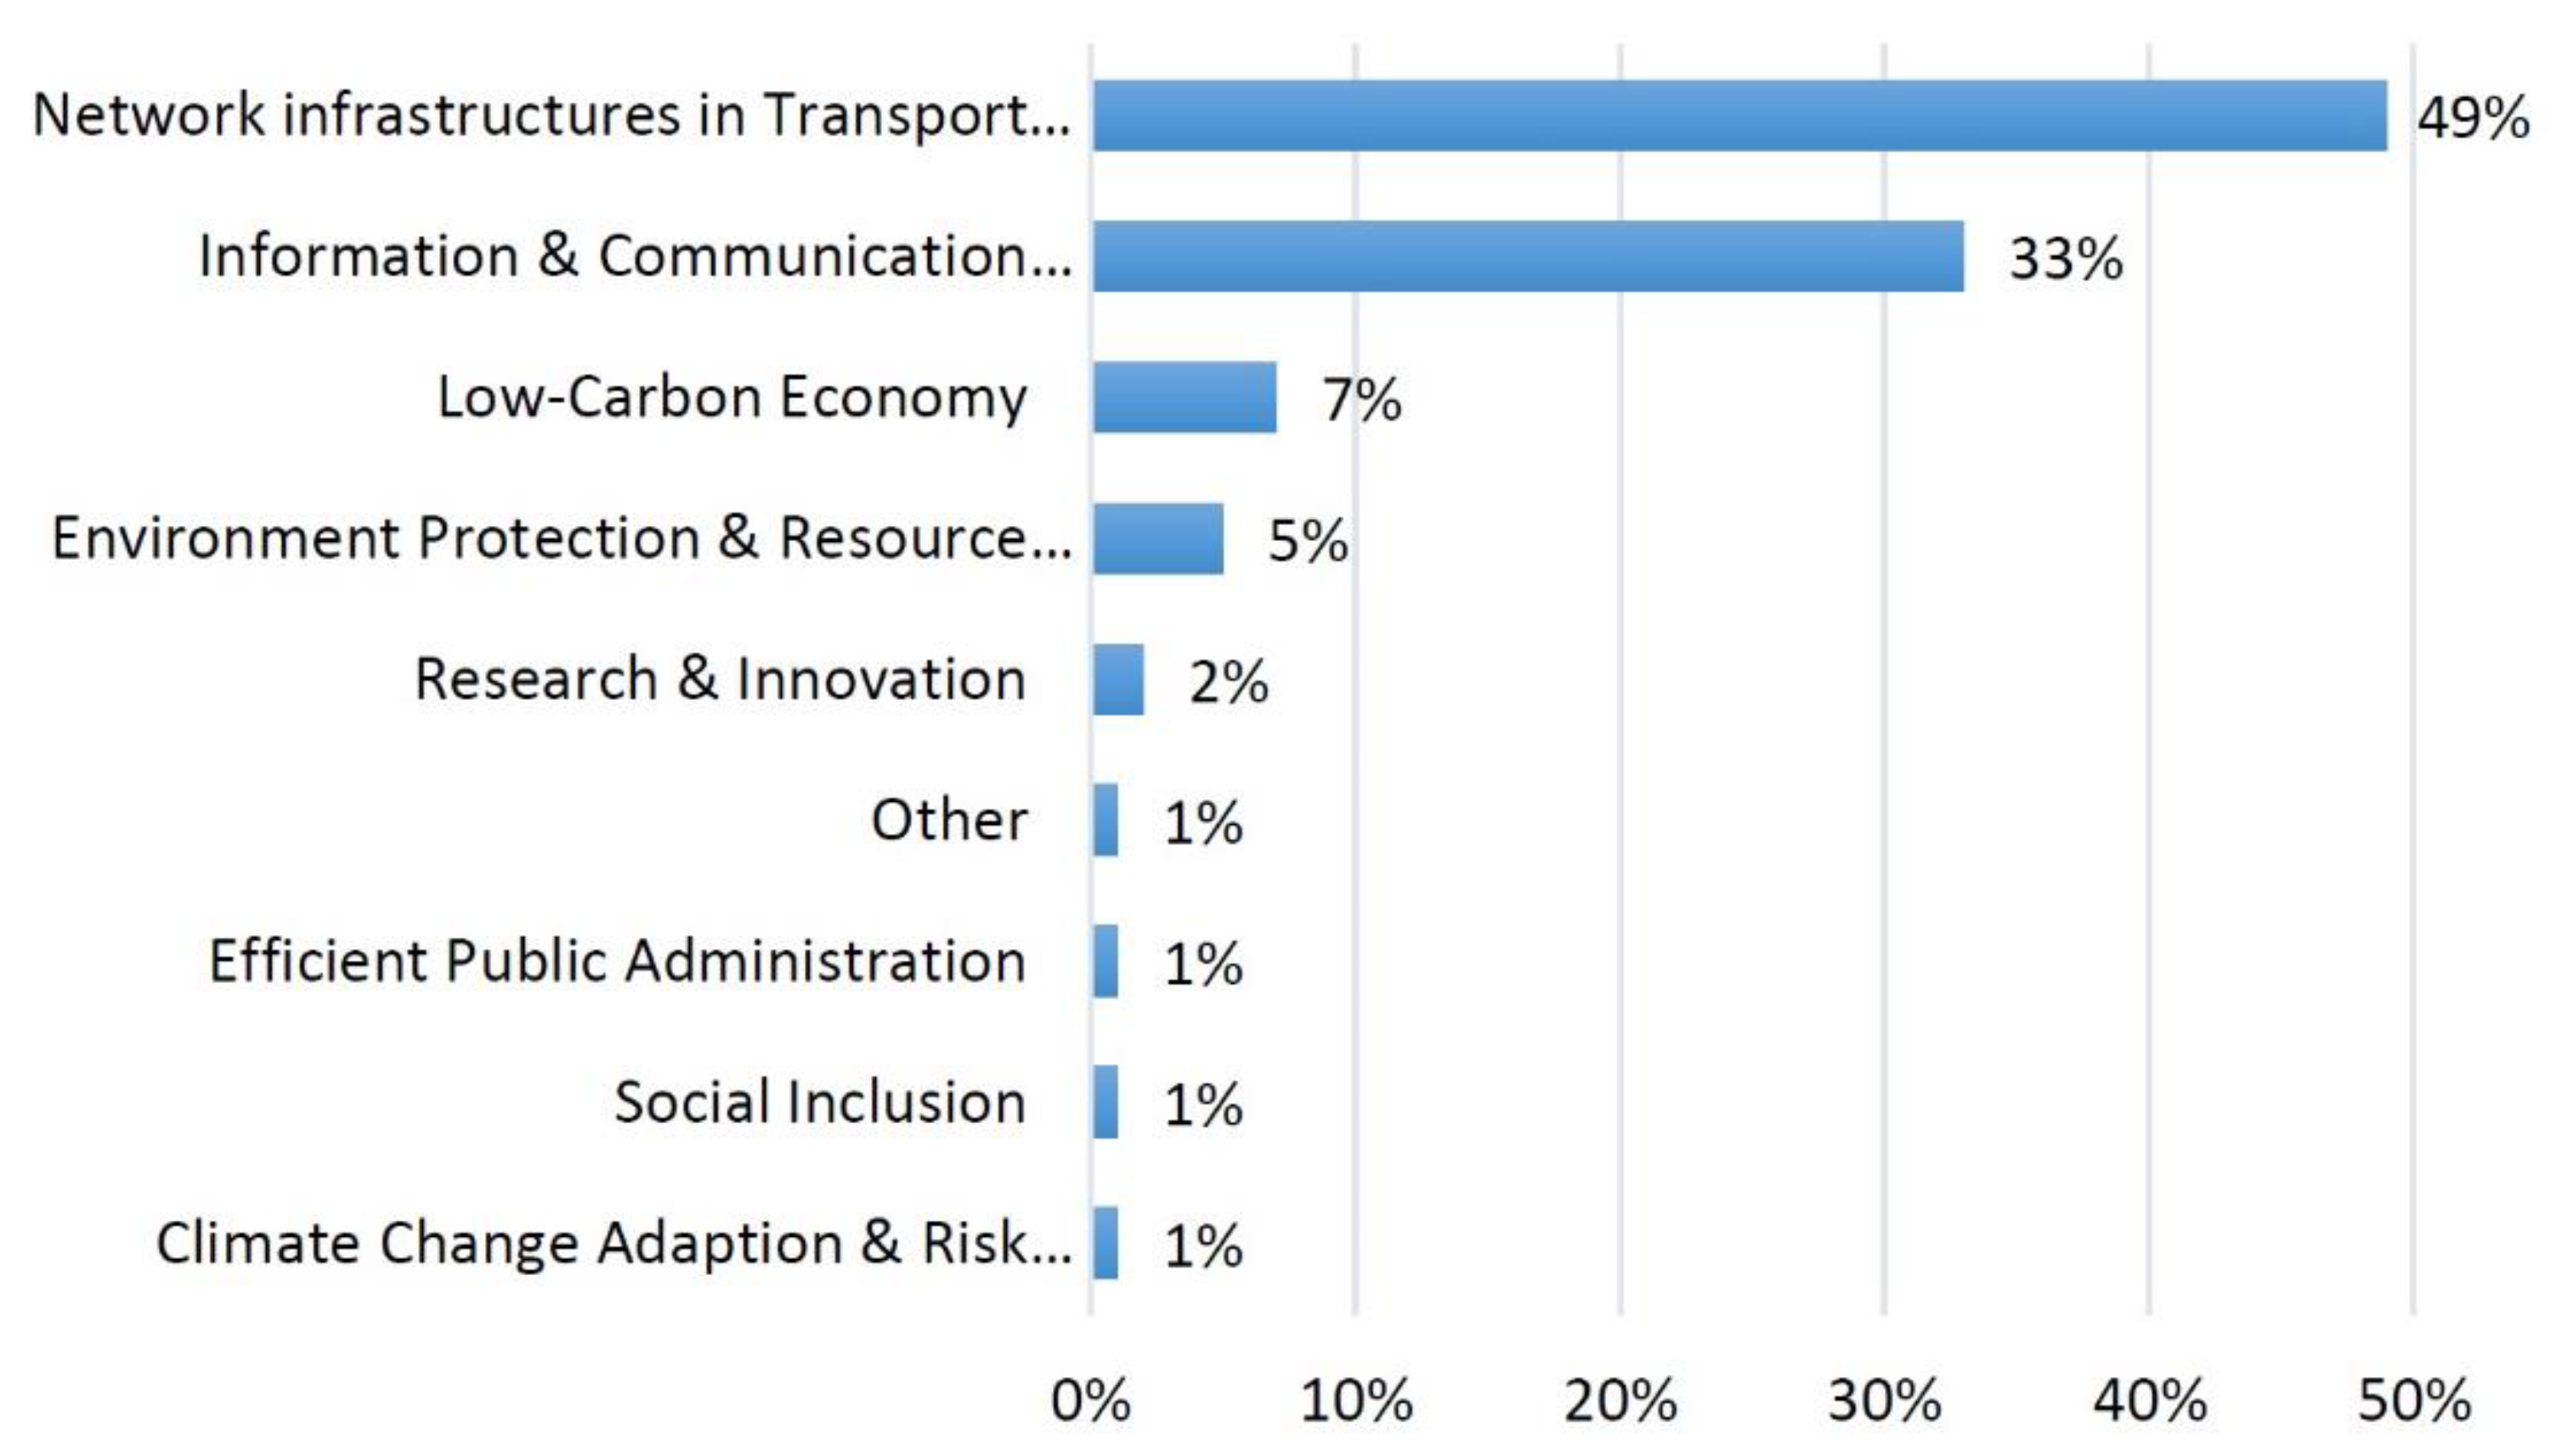
  53. ESIF 2014-2020 ERDF CF Major Projects: Data: European Structural and Investment Funds. Available online: https://cohesiondata.ec.europa.eu/2014-2020-Finances/ESIF-2014-2020-ERDF-CF-Major-Projects/sjs4-8wgj/data (accessed on 6 January 2021).
  54. Pilot Cities. Available online: http://novelog.eu/pilot-cities/ (accessed on 5 January 2021).
  55. Mohanty, S.P.; Choppali, U.; Kougianos, E. Everything you wanted to know about smart cities: The Internet of things is the backbone. IEEE Consum. Electron. Mag. 2016, 5, 60–70. [Google Scholar] [CrossRef]
  56. Kitchin, R. Getting Smarter about Smart Cities: Improving Data Privacy and Data Security; Technical Report; Data Protection Unit, Department of the Taoiseach: Dublin, Ireland, 2016. [Google Scholar]
  57. Russo, F.; Rindone, C.; Panuccio, P. European plans for the smart city: From theories and rules to logistics test case. Eur. Plan. Stud. 2016, 24, 1709–1726. [Google Scholar] [CrossRef]
  58. United Nations Human Settlements Programme. World Cities Report 2020; Nairobi, Kenya, 2021; pp. 200–202, ISBN 978-92-1-0054386. Available online: https://unhabitat.org/sites/default/files/2020/10/wcr_2020_report.pdf (accessed on 7 January 2021).
  59. Smart City Index 2020 by IMD Business School. Available online: https://www.imd.org/smart-city-observatory/smart-city-index/ (accessed on 7 January 2021).
  60. Electric Vehicles for Efficient Urban Distribution Logistics—TRIMIS—European Commission. Available online: https://trimis.ec.europa.eu/project/electric-vechicles-efficient-urban-distribution-logistics#tab-outline (accessed on 5 January 2021).
  61. Aljohani, K.; Thompson, R. A Stakeholder-Based Evaluation of the Most Suitable and Sustainable Delivery Fleet for Freight Consolidation Policies in the Inner-City Area. Sustainability 2018, 11, 124. [Google Scholar] [CrossRef] [Green Version]
  62. UNESCAP. Gender and Transport; Report Congestion Combatting No. 76; Economic and Social Commission for Asia and the Pacific Transport and Communications Bulletin for Asia and the Pacific: Bangkok, Thailand, 2013. [Google Scholar]
  63. Ko, S.Y.; Sari, R.P.; Makhmudov, M.; Ko, C.S. Collaboration Model for Service Clustering in Last-Mile Delivery. Sustainability 2020, 12, 5844. [Google Scholar] [CrossRef]
  64. Mingardo, G.; van Wee, B.; Rye, T. Urban parking policy in Europe: A conceptualisation of past and possible future trends. Transp. Res. Part A Policy Pract. 2015, 74, 268–281. [Google Scholar] [CrossRef] [Green Version]
Figure 1. Model summary.
Sustainability 13 03641 g001
Figure 2. Determinant importance (most important to least important).
Sustainability 13 03641 g002
Figure 3. Grouped scatter graph of carbon dioxide (CO2) by hours spent in road congestion.
Sustainability 13 03641 g003
Figure 4. Grouped scatter graph of GDP per capita by carbon dioxide (CO2).
Sustainability 13 03641 g004
Figure 5. Percentage of the funded EU projects based on Framework programs.
Sustainability 13 03641 g005
Figure 6. Grouped graph of smart city score by traffic congestions and CO2.
Sustainability 13 03641 g006
Table 1. Cluster distribution.
ClusterSize (n)Representatives of the Cluster% of Combined
15Berlin, Brussels, Paris, Ljubljana, Vienna18.5%
24Amsterdam, Madrid, Rome, Stockholm14.8%
34Athens, Copenhagen, Helsinki, Lisbon14.8%
47Bratislava, Bucharest, Budapest, Prague, Sofia, Vilnius, Warsaw25.9%
57Dublin, Luxembourg, Nicosia, Riga, Tallinn, Valletta, Zagreb25.9%
Combined27 100%
Table 2. Clustering Result—An Overview.
Cluster1 (n = 5)2 (n = 4)3 (n = 4)4 (n = 7)5 (n = 7)
UCC (n)54400
Intermodal Term. (median n)2.20.502.140.43
Time Access Restr. (n)4 4070
Modes of Intermodal Term. (n)5 (R-R-B)
-
-
2 (R-R)
-
-
2 (R-R-B)
5 (R-R)
-
3 (R-R)
LEZ (n)44300
Weight Restr. (n)34271
Cargo Bikes (n)54463
Publisher’s Note: MDPI stays neutral with regard to jurisdictional claims in published maps and institutional affiliations.

