Abstract
In recent years, cities universal are advocating ‘resilience’ in terms of water-related challenges. Accompanied by the development of sponge city construction, several emerging stormwater management practices are prevailing worldwide. This paper proposes a regenerative argument for sponge city construction from the urban scale towards the watershed scale by strengthening the urban water resilience and sustainability. An innovative framework is established to address urban water issues and human livability via 20 conventional and advanced indicators and the interrelations between the modules of water resilience, water resource, water treatment, water ecology, waterscape, and water management. Six representative cities from the sponge city construction pilot in South China have been selected, and the compatibility and divergence between their guidelines and the sponge watershed framework are revealed through pair analyses and parameter calculation. The diverse perspectives behind the scores have been discussed carefully, and the successful experiences of excellent cities are systematically summarized and promoted. The analyses and findings in this research have significant methodological implications for shifting the sponge city practice towards linking urban development with watershed ecological conservation. The proposed framework and strategies provide a reference for an integrated solution of watershed health and wellbeing in the next generation sponge city practice.
1. Introduction
Since 1978, up to 60% of the Chinese population packed into cities due to urban development and socio-economic growth, which generated a high urban growth rate associated with the rapid urbanization trends [1,2]. According to the spatial module of urban-rural construction land in natural ecological regionalization in china, urban, and rural development mainly concentrated in the valleys and plain basins of large river basins at low elevations [3]. The urban aggregate along the waterfront with the advantage of waterways in irrigation, transport, sanitation, production, and recreation, etc., which has profound influences on regional economic development and national strategic guidelines [4,5,6]. In a watershed unit, the central cities, urban agglomerations, and rural settlements are connected by the mainstream and tributaries, upstream and downstream, left and right banks, which composed the watershed ecosystem with the natural elements of mountain, forest, lake, river, and field [7]. The water quality, stormwater management, the provision of opportunities for recreation and amenity are essential of the ecosystem services and goods identified by urban water management [8]. According to UNEP [9], ecosystem services from the water domain significantly related ecological status to social benefits and human wellbeing [10]. The holistic watershed ecosystem structure and function model involves the abiotic variables and biologic variables, which correlated with the water resources conservation, tourism and leisure, sediment and material transport, climate regulation, aesthetic functions, natural systems maintenance, biodiversity, and other values [11].
However, the consecutive urbanization in recent decades provoked considerable challenges in cities on the issues of the degradation of aquatic ecosystems, reduction of water conservation forests, continuous deterioration of water quality, and decline in water storage capacity [12,13]. The rapid expansion of urban built-up area leads to a sharp decline in the agricultural field and water space, which degrade the ecosystem function and debase the value of ecological services [14,15]. Yao et al. [16] identified population urbanization, spatial urbanization, and living urbanization have negative spatial correlations with the value of ecological services. Wang et al. [17] suggested that the government prohibit the disorderly expansion of urban construction and restore ecological space by converting the urban renewal area and brownfield into natural landscapes. Jia et al. [18] proposed the sensitive areas that affect the watershed hydrology should be identified and preserved, including streams and buffers, floodplains, wetlands, high-permeability soils, conservation zones and so on. Accordingly, it is urgent to demonstrate integrated solutions for comprehensive water management, environmental conservation, and climate change resilience [13,19,20].
In recent years, cities universal are advocating ‘resilience’ in terms of water-related challenges. The Chinese government has taken active steps in enhancing urban water resilience. The primary approach is to promote and upgrade an ecosystem-based method for integrating urban development, water management, and climate adaptation to achieve water security and sustainability [21]. In 2014, the Ministry of Housing and Urban–Rural Development of the People’s Republic of China released the national strategy for the Sponge City construction, aiming in response to stormwater management and ecological civilization [22]. The national Assessment Standard for Sponge City Construction Effect has been published in 2018 (Table 1), which clarifies the content, requirements and evaluation methods of the sponge city construction [23]. The Sponge City implementing in China initially based on the technology of low impact development (LID), which focuses on the urban built-up area in the administrative unit with municipal facilities, building standards, urban green space, and urban water system [22,24,25,26]. According to EPA [27], the principles of LID are on-site controlling stormwater at the source, such as minimizing impervious surfaces and hydraulic disconnects, reducing runoff and phytoremediation. Bioretention cells, green roofs, porous pavements, detention/retention ponds, and constructed wetlands are all conventional practices that belong to the context of LID practices [28]. Previous studies identified that LID technologies could be executable on the basis that both the functionality and structure of large-scale watershed systems are dependable [29,30]. However, the sponge city construction in China was proposed under the condition that the original ecological system was devastated by the rapid urbanization; therefore, the LID technology applicable to a small area is arduous to cover the macro-scale issues [13,31]. The separation of natural ecological attributes and urban built-up areas affects the effectiveness of sponge city construction and management [32]. Hence, the efficacy of this new policy in strengthening urban water resilience could be highly concerned [21].

Table 1.
Assessment indicators of sponge city construction.
Andrews and Duggan [33] identified although city hazard mitigation and resilience address disaster mitigation and recovery inevitably, they are concerned to understand the fundamental usefulness of creative work at the level of strategy and systems thinking, which may involve rethinking resilience. Qiu [34] argued that urban resilience is reflected in structural resilience, process resilience and system resilience which refers to subjectivity, diversity, autonomy, appropriate redundancy, slow variable management, and identification. Building a huge “dam” or other giant facilities to reduce uncertainty is a traditional industrial civilization idea, while change the ideology is the first issue in ten steps that needed to build a resilient city [35]. As a consequence, sponge city implementation should address the holistic perspectives that coupled green infrastructure with grey infrastructure [13,36]. It covers the items of sustainable urban drainage system strengthening [37,38,39], decentralized treatment facilities promotion [40,41,42], ecological base flow supplementation [43,44,45], aquatic biodiversity increasing [46,47], and the development of urban open space and stormwater detention area integration [48,49,50]. These approaches aim to up against the challenge of evaluating, coupling and aggregating the provisioning, regulating, supporting, and cultural function of the urban ecosystem service to the intended target of sponge city [9,21].
This paper advocates a shift for sponge city construction from the urban scale towards the watershed scale through strengthening the integration of the built-up area and natural space from a holistic perspective [31,49]. Under the circumstance of urban agglomerations, the municipal water system is indispensable to sustain the water circulation in the catchment unit [51]. An innovative framework has been established to address the comprehensive water issue for ecosystem services promotion. It consists of 20 indicators distributed in the water resilience module, water resource module, water treatment module, water ecology module, waterscape module, and water management module. The proposed framework is evaluated in the case study of six pilot sponge cities, which investigated the compatibility and divergence of the strategies between sponge city and sponge watershed. The research outcomes generate references for advancing sponge city construction towards a better balance between urban development and nature conservation.
2. Materials and Methods
2.1. Research Context
The original goal of sponge city includes total runoff control, peak runoff control, pollution control, and stormwater utilization [22]. Accompanied by the development of sponge city construction, several emerging stormwater management practices are prevailing to mitigate urban water problems and support urban water management (UWM) in various terms worldwide. The essential goals of UWM are to restore the natural hydrologic systems, bring the hydrology of urban catchments closer to pre-development circumstances, and minimize environmental impact [52,53,54]. The appropriateness of UWM practices depends on specific site conditions, i.e., watershed size, space scale, and human activities, while no single standardized solution can be effective in all locations in terms of comprehensive and multiple-goal orientation [55]. The significant programs refer to sustainable urban drainage systems (SUDS) [39,56], low impact development (LID) [52,57,58], best management practices (BMP) [55,59], water sensitive urban design (WSUD) [60,61], and green infrastructure (GI) [62,63]. More details are presented in Table 2. Although divergence and contestation are conspicuous between these terminologies, the sharing philosophy underneath is transforming the linear character of the conventional UWM into a recyclable approach that helps to mitigate flooding risk, reduce non-point source pollution, recharge groundwater, and supplement environmental flows [19,28].
Although the sponge city program is gaining momentum through the strong support of the central government and the enthusiastic participation of local governments and private sectors, the obstacles and challenges cannot be overlooked [64]. First, the construction of sponge cities in China suffers from “fragmentation” problems, i.e., difficulty in coordination between different participants, indeterminate policies and systems, and conventional construction perspectives, which cannot effectively solve the complex urban water issues [65]. The current fragmentized governances and responsibilities in urban catchment management inhibit integrated strategies to urban water cycle management [66,67]. Second, as the sponge city concept introduced in a context leading by sector-based engineering and technology-oriented thinking [68], the management and assessment of sponge city construction has not yet been connected with the latest National Spatial Plan. The urban spatial pattern at the national scale from the perspective of social-economic development have made remarkable progress, while the correlation between urban spatial design and the natural ecological system has not been given enough concern [69]. Third, given the enormous costs involved, along with the requirement of substantive change to the planning and governance institution, the economic efficiency of project investments and the performance evaluation of the construction achievement are especially significant to the decision-makers and stakeholders [13,54].
Recently, the research tendency has shifted from small-scale LID/BMP designs to large-scale SUDS, GI, and WSUD implementation to mitigate the effects of urban development on natural ecosystems [13,28]. Specifically, in the urban context, SUDS design is starting to address resilience and sustainability as nature-based solutions for traditional stormwater management [38,70]. GI performs a cost-effective water recycling network, which is increasingly linked to urban water management in both immediate and long-term transitions towards sustainability [19]. Likewise, the demonstration of WSUD as an urban planning and design paradigm has evolved from its early association with stormwater management to provide a broader framework for sustainable urban water management, linking the water infrastructure with urban design, place-making, and livability [71,72]. Therefore, the trends of sponge city research have transformed from small-scale to large-scale via adopting distributed hydro-environmental models, non-point source pollution models, and geographic information system (GIS) [28,73]. It is urgent to propose an innovative approach that addresses not only urban water problems but also concerns ecological sustainability and climate risks [13].
The diagram of the research transition is demonstrated in Figure 1. Accompany with the sponge city scheme, the Ecological Civilization Strategy becomes the foundation of national policy in recent years. A life community of harmonious coexistence between human beings and nature request animals, mountains, rivers, forests, fields, lakes, and grasses in the natural ecosystem should be protected and conserved [74]. Further, the National Spatial Planning in China identified the implementation of ecology, cultivated land, and urban development three control lines, long with a system of protected areas with national parks as the mainstay, and promoting rural urbanization, to strengthen sustained development of the Chinese nation [75]. This research attempted to link the strategies between sponge city construction and the conservation of the aquatic ecosystem, which apply conventional indicators to continue and refine the shackles faced by sponge cities and create advanced indicators to strengthen the ecological service functions of the watershed ecosystem.
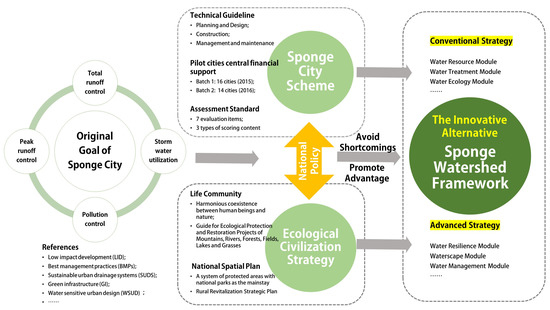
Figure 1.
The research transition from Sponge city towards Sponge Watershed.
Table 2.
Key items of diverse urban water management (UWM).
Table 2.
Key items of diverse urban water management (UWM).
| Research Tools | Objectives | Research Scales | References |
|---|---|---|---|
| Low impact development (LID) | Urban stormwater runoff management; | Site and precinct scale | [76,77] |
| Non-point source pollution control | |||
| Restore natural hydrologic processes and pre-development conditions | |||
| Best management practices (BMPs) | Infiltration-based technologies, including permeable pavement, infiltration trench, bioswale, buffer/filter strip, rain gardens and downspout disconnections. | [59,77] | |
| Retention-based technologies, including rain harvesting, green roof, bio-retention cell, constructed wetland; | |||
| Sustainable urban drainage systems (SUDS) | Peak runoff attenuation; | Multi-scale, especially urban scale and watershed scale | [38,39] |
| Combined sewer overflows reduction; | |||
| Groundwater recharging; | |||
| Green infrastructure (GI) | Stormwater management; | [78] | |
| Maximizing ecosystem services; | |||
| Watershed restoration; | |||
| Biodiversity conservation; | |||
| Water sensitive urban design (WSUD) | Reducing potable water demand; | [61,66,71,72] | |
| Minimizing wastewater generation and enhancing the standard of wastewater treatment; | |||
| Urban stormwater management and treatment; | |||
| Using stormwater in the urban landscape; | |||
| Urban environmental health improvement and pro-environmental behaviours promotion; |
2.2. Framework of Sponge Watershed
According to [UNEP [9], UN [79]], ecosystem services benefit people from nature, including provisioning food and water, regulating hydrology and climate, supporting nutrient cycles and soil formation, and gaining inspiration and aesthetics from cultural exploration. The sponge watershed is endowed with the capacities to alleviate the risks of high-intensity rainfall and extreme flooding, promote the utilization of rainwater management, purify the non-point source and runoff pollution, and enhance the hydrophilic biodiversity and waterfront landscape performance [11,80,81,82]. To optimize the performance of innovative technologies and the implementation of administrative efficiency, the research scope of sponge city should shift from the urban built environment towards a broader vision of watershed scales in terms of the health and well-being of the urban ecosystem [11,73]. Specifically, the sponge watershed should base on the natural hydrological unit, which includes the water source conservation of the upstream region, the plain water network of the midstream region, and the estuarine wetland of the downstream area. In this regard, an innovative framework could be established to address comprehensive indicators for watershed issues and urban water resilience.
The sponge watershed indicators are organized into six categories: water resilience module, water resource module, water treatment module, water ecology module, waterscape module, and water management module. The six categories and their relevant strategies listed in Table 3 attempted to optimize the regulation and support service of the watershed ecosystem and promote a sustainable environment for water resilience [83]. The research design of the framework is illustrated in Figure 2 that covers three sessions. First, the water resilience module performs as the research base of this framework. It identified the macro pattern of spatial constraint and the network connectivity and the overall indicators of total runoff control, peak runoff control, and the requirement of environmental quality promotion. Second, the technical section consists of the water resource module, water treatment module, water ecology module, and waterscape module, which grouped in pairs, and two sets of indicators correspond to each other. The water resource module and water treatment module focus on stormwater purification and utilization, reclaimed water purification and utilization, and ecological baseflow replenishment. The water ecology module and waterscape module are interrelated in ecosystem restoration and ecological corridor construction, promoting human health and wellbeing upon sharing the environmental value. Last, the water management module pays close attention to the land development for water infrastructure, the monitoring system for sponge city construction, and the POE study for environmental effectiveness and social benefit, closing the planning, construction, and maintenance loop.
Table 3.
Categories and indicators and strategies of the sponge watershed framework.
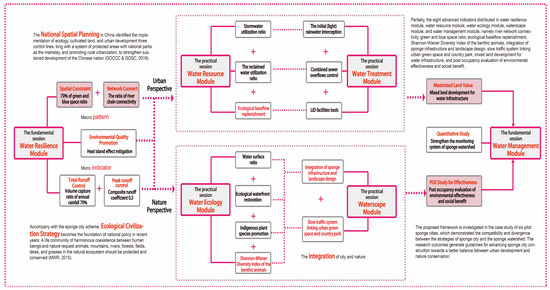
Figure 2.
The research flowchart of the Sponge Watershed.
The indicators in the sponge watershed framework are divided into two types, 12 conventional indicators accounting for 60% while 8 advanced indicators accounting for 40%. The conventional indicators continue the important indicators in the sponge city construction technical guidelines and evaluation standards and are optimized and supplemented in the feasibility strategy. On the other hand, the advanced indicators come from the latest water ecosystem restoration specifications, land and space planning, and water corridor construction, which helps establish a healthy watershed ecosystem. Particularly, the eight advanced indicators distributed in water resilience module, water resource module, water ecology module, waterscape module, and water management module, namely river network connectivity, green and blue space ratio, ecological baseflow replenishment, Shannon–Wiener Diversity Index of the benthic animals, integration of sponge infrastructure and landscape design, slow traffic system linking urban green space and country park, mixed land development for water infrastructure, and post-occupancy evaluation of environmental effectiveness and social benefit. According to the innovative framework of sponge watershed, it is legible to bridge the gap between urban and nature, microscope and macroscope, individual and integration, development and conservation in diverse dimensions and scales.
2.3. Selected Pilot Cities
In late 2014, the Ministry of Housing and Urban-Rural Development (MHURD), in conjunction with the Ministry of Finances (MOF) and Ministry of Water Resources (MWR), issued a notice on 30 pilot cities within two batches for the construction of sponge cities. These cities span across different administrative regions from east to west, north to south, and correspond to different annual total runoff control rates according to climate and rainfall distribution differences (Figure 3). The central government determines a committed subsidy of 400–600 million RMB (equal to 60–90 million USD) per year for three years to support the pilot city [129]. By the end of 2020, the three national ministries and commissions jointly organized and carried out the performance evaluation of the pilot national sponge city construction [130]. It is reported that the pilot projects in the two batches ended smoothly, among which Pingxiang and Shenzhen won the first prize, respectively, and approximately one-third of the other cities are evaluated as excellent [131,132]. The primary evaluation criteria include three significant aspects: construction effectiveness, reproducible and extendable experience, capital use and application mode [133,134]. This research focuses on evaluating construction effectiveness, including systematical coordination of the “source emission reduction, process control, and system governance” measures and implementing indicator requirements for water ecology, water environment, water resources, and water safety.
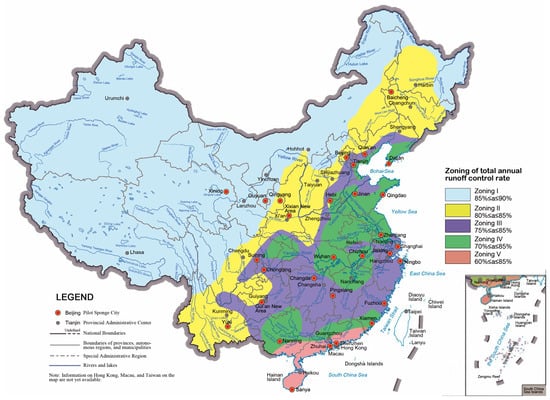
Figure 3.
Distribution of China’s sponge pilot cities and the zoning of total annual runoff control rate (adopted from MHURD [130]).
According to the statistics of mean annual precipitation and the daily extreme precipitation in China [135,136], the regional distribution of precipitation changes is separated by the China north-south dividing boundary 35° N [137], where a continuous decline in North China, Central China, southern Northeast China, and a significant increase in the areas south of the Yangtze River Basin [138]. Six pilot cities are selected in this research, namely Shanghai, Chongqing, Wuhan, Nanning, Ningbo, and Shenzhen, are in a humid area in south China, where the annual rainfall in these cities is between 1000 and 2000 mm (Figure 4). The study cases cover the first and second pilot batches, including municipalities, provincial capitals, and sub-provincial cities, sharing the issue to transform old urban areas with high urban density. The research cities are distributed in diverse landforms, i.e., Chongqing is full of mountains and hills; around the one-half area of Ningbo, Nanning, and Shenzhen are surrounded by hills; and plains dominate Shanghai and Wuhan (Figure 5). Although it is challenging to solve all the differentiation problems with a set of sponge city standards, the selected pilot cities have made generous contributions in sponge city construction and accomplished precious experience for the future implementation of sponge city in China [16,125,139,140,141,142].
In line with the corresponding regional characteristics and urban development goals, each pilot city has issued local sponge city planning and design guidelines and construction technical standards to implement the sponge city pilot construction performance evaluation requirements under the national regulations. These local guidelines and standards represent diverse perspectives on region and innovation, with similar goals to build a sustainable and healthy water circulation system, including alleviating urban waterlogging, reducing runoff pollution load, improving the level of rainwater resources, reducing the cost of rainstorm waterlogging control, and improving the urban landscape, etc. [143,144,145,146,147,148]. All the selected guidelines are based on the most updated versions retrieved from the official website. The selected pilot cities and their references are listed in Table 4.

Figure 4.
Distribution of selected research cities and the map of mean annual precipitation of China (adopted from OSGeo [149]).
Figure 4.
Distribution of selected research cities and the map of mean annual precipitation of China (adopted from OSGeo [149]).


Figure 5.
Landform characteristics of selected research cities.
Figure 5.
Landform characteristics of selected research cities.

Table 4.
Reference of the selected pilot cities.
Table 4.
Reference of the selected pilot cities.
| Selected Pilot Cities | Mean Annual Rainfall (MM) | Landform | Pilot Batch | Local Guidelines Reference | Evaluation Outcome |
|---|---|---|---|---|---|
| Shanghai | 1089 | Plains | Second | Technical Guidelines for Shanghai Sponge City Construction (Trial) [150]; Technical Specification for Construction of Sponge City [147]; | Pass |
| Chongqing | 1184 | Mountains | First | Chongqing Sponge City Planning and Design Guidelines (Trial) [85]; Measures for the Administration of Construction of Sponge City in Chongqing (Trial) [143] | Pass |
| Wuhan | 1242 | Plains | First | Wuhan City Sponge City Planning and Design Guidelines (Trial) [148]; Implementation Plan for the Pilot Work of Sponge City Construction in Wuhan [151]; | Pass |
| Nanning | 1392 | Hills | First | Guidelines for Planning and Design of Sponge City in Nanning City [144]; Interim Measures for the Planning and Construction Management of Sponge City in Nanning City [152]; | Excellent |
| Ningbo | 1517 | Mountains | Second | Ningbo urban planning & design guideline for sponge city [145]; | Excellent |
| Shenzhen | 1830 | Hills | Second | Special Planning and Implementation Plan for Shenzhen Sponge City Construction [153,154] Key Points and Review Rules of Shenzhen Sponge City Planning [146]; | Excellent |
3. Results
3.1. The strategy of Sponge Watershed
3.1.1. Water Resilience Module
The water resilience module comprises five indicators: green and blue space ratio, river network connectivity, volume capture ratio of annual rainfall, composite runoff coefficient, and heat island mitigation. It helps address the disasters and challenges of climate change and extreme weather under conditions of uncertainty [59]. The sponge watershed system should respect the local landscape and balance urban development and nature conservation [58]. Specifically, reserving the existing rivers, lakes, wetlands, pit ponds and ditches and maintain the natural hydrological characteristics before urban development as much as possible in urban renewal [54,82]. For the new town development, the green and blue space ratio of the whole watershed should be no less than 70% to warrant the safety and health of the watershed ecosystem services [49,84].
The connection of river networks and water bodies in the built environment is an essential foundation for regional flood prevention, water supply, and aquatic ecological security [155]. With the help of urban water hydraulic facilities, the water bodies and the ecosystem are interconnected in the urban context, which optimized allocation and regulation of water resources [88]. River network connectivity is a significant factor for supporting the functional integrity of the river ecosystem, which affects the sponge storage capacity of the river basin through structural characteristics and transmission [86,87,156]. According to the calculation formula of the degree of river network integration, the ratio of the actual number of sides of the river network to the maximum number of sides it may exist represents, which calculated in Equation (A1) in Appendix B [157]. Based on [Ma [88], Xia, et al. [158], Yang [159]], the ratio of the actual number of river chains to the maximum number of river chains in the river basin reflects the status of river network connectivity that should be no less than 0.3.
It is well known that the volume capture ratio of annual rainfall serves as the primary control indicator of the evaluation standard for sponge city construction effects [25,52,89]. This item needs to consider the characteristics of the underlying surface of the basin, rainfall conditions, and complex processes such as rainwater infiltration and stagnation, and it needs to be calculated with the help of model tools. According to MHURD [22], the total annual runoff control rate refers to the percentage of the total annual rainfall controlled (not discharged) in the site through natural and artificial enhancement of infiltration, storage, evaporation, etc., which calculated in Equation (A2) in Appendix B [22,23]. In 2015, the national sponge city construction pilot city declaration required that the total annual runoff control rate of the pilot cities should not be less than 70% [25]. According to the practical evaluation, the total annual runoff control rate in Ningbo, Shenzhen, and Fuzhou with annual rainfall exceeding 1500 mm are greater than 72% [126,141,160]. Therefore, this study proposes that the average volume capture ratio of annual rainfall is not less than 70% as one of the control indicators for constructing sponge cities south of the Yangzi River region.
Consequently, the composite runoff coefficient has become a key factor in calculating the total annual runoff control rate, reflecting the influence of physical geographic elements in the basin on the relationship between precipitation and runoff [91,161]. It is used to calculate infiltration control indicators, determine the total annual runoff control rate, and formulate low impact, which become the prerequisite and basis for the development scale (LID) plan and the comprehensive optimization management decision of stormwater [92,162]. This indicator corresponds to the ratio of rainfall converted into the runoff obtained by a weighted average of the rainfall-runoff coefficient of the underground surface in the basin, which calculated in Equation (A3) in Appendix B [92]. Shanghai stipulates strict control of composite runoff coefficient in newly built areas, i.e., the design value shall be used for review not higher than 0.5, and the compensation strategies are requested If the review exceeds 0.5 [150]. Ningbo demands that the comprehensive runoff coefficient of the main concentrated land should not be greater than 0.6, and the requirements in the old town could be appropriately relaxed based on the actual situation [145]. Shenzhen proposes that certain runoff control measures should be taken in newly built or renovated areas, i.e., the control runoff coefficient of commercial areas, residential areas, schools, industrial areas, squares, parking lots, and parks do not exceed 0.5 [99]. Thus, this study recommends that the composite runoff coefficient of the sponge city implementation should not be greater than 0.5.
Meanwhile, sponge city construction is considered an effective solution to mitigate the Urban Heat Island (UHI) effect by the co-benefits approach [163]. The effectiveness of urban parks, water bodies, and LID facilities increase the urban vegetation coverage, water surface ratio, and urban ventilation corridors, which moderates the heat island effect and affecting the microclimate process accordingly [93]. It is requested that the UHI data should be monitored, and the temperature monitoring data before and after the sponge city construction should cover the average daily temperatures from June to September for at least the recent 5 years and 1 year, respectively [164]. Benefit from the national policy of sponge city construction, the Heat Island Intensity Index (average daily temperature difference between the central city and the suburbs) should decrease compared with the historical period in the summer season [23,94].
3.1.2. Water Resource Module
The water resource module consists of three indicators: stormwater utilization ratio, reclaimed water utilization ratio, and ecological baseflow replenishment. The water resource module establishes an innovative perspective of water resources planning and allocation. Dealing with the dual pressure of the current scarcity of water resources and the massive demand in the future, the water resources innovation will adapt the water allocation from “demand-based supply” towards “demand-constrained supply” [31]. Therefore, alternative water resources are required to deal with the balance of water supply and demand in socio-economic development. According to sponge city guidelines, the stormwater utilization ratio and the reclaimed water utilization ratio are essential components of water resources indicators [13,165]. Stormwater harvest and utilization could sustain sources for the ecological water supply of rivers and lakes, plants irrigation, car washing, and groundwater replenishment [80,96]. In particular, the ratio of rainwater utilization amount to the average annual rainfall should be no less than 5% [97,150].
On the other hand, reclaimed water use has contributed to alleviating water shortage in high-density megacities [166,167]. Instead of pumping into the surrounding water bodies after corresponding treatment, it could be reused for the urban municipal water all year round and discharge directly into the selected river corridors for ecological water supplement in the dry seasons [168]. According to the Shenzhen case, in 2020/2030, the ratio of the amount of wastewater reuse and total sewage treatment should be no less than 30%/60% [99].
Further, there is a transition from the traditional perspective that concerns water use for production and domestic only towards the new concept that integrated production, domestic and ecological water use [169]. Ecological baseflow is of great significance for improving water quality and protecting ecology, which could characterize the utilization of water resources in river basins [44,170]. This study is based on the ecological water demand theory of the Tennant method [101,102] and takes the annual average runoff of 10% as the mandatory indicator. It is requested that the ecological base flow of southern rivers generally adopts not less than 90% guarantee rate of the driest monthly average flow and 10% of the multi-year average natural runoff, whichever is greater [74]. Thus, ecological water compensation will be adequately replenished into the local water system through the components of the watershed ecosystem [171].
3.1.3. Water Treatment Module
The water treatment module covers three indicators: the initial (light) rainwater interception, LID facilities tools, and combined sewer overflow control. From the perspective of water treatment module, non-point source pollution control and point source pollution control are the main tasks. Given the ever-increasing urbanization and city expansion, non-point source pollutants, i.e., traffic emissions, landfill leachate, and chemical fertilizer, etc., are discharged into rivers and lakes with the urban runoff, which leads to severe water degradation and environmental crisis [12,169,171]. Due to the randomness and complexity of the watershed runoff issues, the goal of non-point source pollution control is also generally achieved by total runoff control [22]. Provisions on calculating the effective volume of rainwater retention tanks used for diversion drainage systems to control runoff pollution, the initial (light) rainwater interception standard should be no less than 7 mm per session [103,104]. Through the strategies of bioretention cells, grass swales, green roof, and permeable pavements, the non-point source pollution control ratio should reach 40–70% of the new projects and the retrofitting [23,52,108].
As innovative urban drainage green infrastructure, grass swales and filter strips (GS&FS) bring close attention to the strategies of stormwater management, which conveys and treats either shallow flow (swales) or sheet flow (filter strips) runoff during heavy rains [108,172]. GS&FS brings significant benefits in moderating the pressure on urban rainwater pipeline networks and removing the surface runoff pollutant through vegetative and soil filtering, evapotranspiration, and infiltration [27]. Specifically, the increasing implementation of filter strips in integrated stormwater management systems helps lower runoff velocities by enhanced flow resistance. Hence, the watershed time of concentration slightly reduces both runoff volumes and watershed imperviousness and contributes to groundwater recharge [173,174]. On the other hand, stormwater that exceeds the control capacity of the LID system could be quickly discharged through the grass swales and filter strips connected to the river network for relieving the urban waterlogging phenomenon [27,77]. Notably, Singapore launched the Active, Beautiful, Clean Waters (ABC Waters) program in 2006, which integrated the natural system and engineering strategies that detain and treat rainwater runoff to ensure urban surface drainage health and sustainability [95,107]. Each building, sidewalks and roads in Singapore are connected to the primary drainage system through the grass swales and filter strips, which forming an urban rainwater collection and drainage network throughout the island and preventing waterlogging and flooding even with heavy storms [19,175].
Traditional overflow pollution control in combined drainage system request adding retention tanks or increasing interception multiple. However, an alternative solution is to request the stock of current sewage water while dealing with the future population’s incremental pollution sustainably [41]. An innovative model block-water-clean (BWC) system is established that transformed the concept of comprehensive utilization of urban sewage treatment from the emphasis on concentration to the perspective of relatively dispersed at the block scale [31]. BWC system comprises the features of stormwater management, sewage treatment, water quality and quantity monitoring, and operating warning, which help to promote the reuse of greywater, relieve waterlogging, acquire real-time data and remote control in low-cost operating. In the future, facing the severe limitation of sewage treatment capacity and sewage pipe network coverage, as well as the irregular facilities utilization and unbalanced resource distribution, the new module of water treatment proposes integrated strategies, including self-digestion in central areas, efficient transformation, balancing resources, and distributed processing in the block drainage system [176].
3.1.4. Water Ecology Module
The water ecology module involves four indicators: water surface ratio, ecological waterfront restoration, indigenous plant species promotion, and Shannon–Wiener Diversity Index of the benthic animals. The water ecology module aims to optimize the distribution, process, and services of the urban aquatic ecosystem. Previous studies identified that as an essential carrier, the water surface contributes considerably to service functions and great significance for improving the purposes of flood prevention and drainage, landscape recreation, and microclimate regulation [113,177,178]. However, the area of urban water surface has been reduced dramatically due to the rapid urbanization and expansion. According to MHURD [112], the water surface ratio of the watersheds should not be lower than the proportion of water areas before urban development. Notably, the proposed water surface ratio in the plain valley area should achieve 8% to 10% [86,88]. In this research, the water area rate of the watersheds should not be lower than the proportion of water areas before the urban development [74].
In the context of a watershed, the river corridors consist of river channels, plant communities, floodplains and tributaries, etc., which have advanced ecological functions in the process of material flow, energy flow, and information flow [11,82]. The restoration and protection of ecological shorelines and riverbank are essential to the watershed ecosystem. It is demonstrated that the concrete bank has destroyed the aquatic and amphibian habitats and deteriorated the ecological and natural landscapes of the river corridor [114]. Riverbank protection should consider both flood control and environmental protection requirements. The implementation of ecological bank materials and structures with water permeability and porosity is conducive to water infiltration, plant growth, and fish spawning [74,115]. Therefore, in addition to the productive coastline and necessary flood control dikes in the urban planning area, more than 50% of the urban water bodies shall be restored to the ecological waterfront area and conserve their ecological functions accordingly [23,154].
Meanwhile, the indicator of biodiversity in the river corridors reflects the habitat status and the performance of aquatic ecosystem service [118,179]. After the rapid development of urbanization and construction, it is essential to monitor the quantitative change of the riparian plant communities in terms of assessing and predicting the performance of agricultural and land management policies and practices [180]. The native plant species growing along the riparian areas are essential to maintain the stability of local ecosystems and provide better adaptation to climate change [181,182,183]. It also performs as the consequence of habitat restoration and a prerequisite of aquatic ecosystem service [184]. Compared with the exotic plants with a single plantation structure and restricted species diversities, the native species are abundant in variety and deliver multiple benefits that should upgrade and predominant in the watershed [93,116,183]. Further, a wide variety of benthic animals live in the lakes and streams, which become a typical indicator species for the health assessment of water bodies [117,118,185]. According to (Wilhm [186], Wang, et al. [187]), the Shannon–Wiener Diversity Index (H’) of the benthic animals should upgrade with the improvement of water quality in the light of the construction of sponge cities. The calculation is presented in Equation (A4) in Appendix B. It is identified that the H’ index of 2.0 or above can be considered a healthy benthic habitat [188,189].
3.1.5. Waterscape Module
The waterscape module selected two indicators: integration of sponge infrastructure and landscape design, slow traffic system linking urban green space and country park. The prominent goal of the waterscape module is to create a comprehensive green infrastructure with multi-functions that links the urban water system from the mountain to the seaside, coordinates sensitive areas and habitats with human settlements, establishes a continuous recreation network, encourages slow traffic, as well as protects cultural heritage [7,190,191]. Urban green space, playing fields, country parks, woodlands, allotments, and private gardens constitute the main body of urban green infrastructure, which contribute precious values in stormwater management, ecosystem conservation, watershed restoration, and biodiversity promotion [62,192,193]. These benefits shape a robust collaboration among the water system, green space, and the stakeholders of urban development [19,63]. In the context of a healthy built environment, the experience of a place with a remarkable presence of water could elicit a higher therapeutic response and a greater preference compared with landscapes without water elements [194,195].
The waterfront is perceived to be more accessible to the public, and the connectivity for human and nature should be enhanced [5]. According to [Gong [50], CABE [119], Hartig and Kahn [196]], all the water corridors should connect with urban open spaces, forming a blue-green integrated network system. Moreover, the slow traffic system, including pedestrian walkway and cycling lanes, should extend along with the waterfront interface in the regional scale, urban scale, and space scale [121,122]. The slow traffic system should connect urban green space and country park by linking the waterfront interface and sponge infrastructure. Therefore, integrating the urban water infrastructure, i.e., stormwater detention pond, rainwater garden, etc., into the planning and design of urban green open spaces is a proposed approach for space sharing and environmental education [31,123].
3.1.6. Water Management Module
The water management module encompasses three indicators: mixed land development for water infrastructure, strengthen the monitoring system of sponge watershed, and post-occupancy evaluation of environmental effectiveness and social benefit. Depending on the original local water system, the management of sponge watershed demonstrates an innovative planning strategy for the sponge city construction, which aims to optimize the regulation and support service of the watershed ecosystem and promote the environmental quality from the urban scale towards watershed scale. The green and blue open space should be integrated with the water infrastructures in the central city [197]. Due to the land resource being limited and the continuous urbanization is expansive, it is significant to optimize the land use efficiency and promote vertical development [198].
After five years of sponge city construction, it is significant to identify monitoring methods and hydrological models used to assess the performance and effectiveness. A regular maintenance program should be initiated to monitor the operations of the completed facilities according to local climate conditions [164]. With the help of the SWMM rainwater management model and ArcGIS geographic information system, a refined rainwater runoff model of watershed surface runoff and non-point source pollution is constructed for sponge watershed monitoring [125]. This approach provides reference and demonstration for the future planning and construction of sponge city [126].
Further, the post-occupancy evaluation (POE) of its environmental effectiveness and social benefit is also critical after completing the sponge city project. The POE covers water ecological restoration effect evaluation, water environment remediation effect evaluation, water safety guarantees effect evaluation and water resource utilization effect evaluation, etc. [145]. In addition, the social benefit evaluation can analyze the number of flood-prone points before and after the construction of the sponge city, the leakage rate of the water supply pipe network, the utilization rate of sewage regeneration, the utilization rate of rainwater resources, the price of residential and commercial land, etc. [99,148,150]. Suppose the evaluation result does not meet the planning control indicators of the completed project, it is necessary to propose an effective improvement plan and provide reference experience for future sponge city practice. Moreover, it is necessary to integrate sponge city construction (SPC) with smart cities by setting up an SPC smart management and control platform that online coordinate monitoring, operation, and maintenance [164].
3.2. Sponge Watershed Indicator and Pilot City Evaluation
3.2.1. Overall Evaluation
The relationship between the sponge city guidelines of the pilot cities and the innovative framework of sponge watershed strategies is analyzed and presented in Table 5 and Figure 6. This chapter summarizes some key findings of the interrelations. For each sponge watershed indicator, the evaluation is divided into three levels: deep involved, partial involved, and uninvolved. Deep involvement includes the watershed sponge indicator in the guideline and satisfies the quantitative or qualitative requirements mentioned in the strategy. For partial involvement, if the guideline refers to a certain indicator, it is not required to meet the detailed requirements in the strategy. If the guidelines do not include certain indicators and strategic requirements at all, it is deemed uninvolved. It is noticed that Shanghai, Chongqing, and Wuhan shared a similar performance in reviewing the sponge watershed framework. All three cities fulfil 45% to 50% of deep involved, 25% to 30% of partial involved and 20% to 30% of uninvolved. In contrast, Nanning and Ningbo showed better outcomes that both cities accomplish 50% to 55% of deep involved, 35% of partial involved and 10% to 15% of uninvolved. Specifically, Shenzhen got the highest score that 80% of deep involved and 20% of partial involved. This evaluation is consistent with the performance evaluation results of the pilot sponge city construction [131,132,134].
Table 5.
The inclusion of sponge watershed indicators in the guidelines of the selected pilot sponge cities.
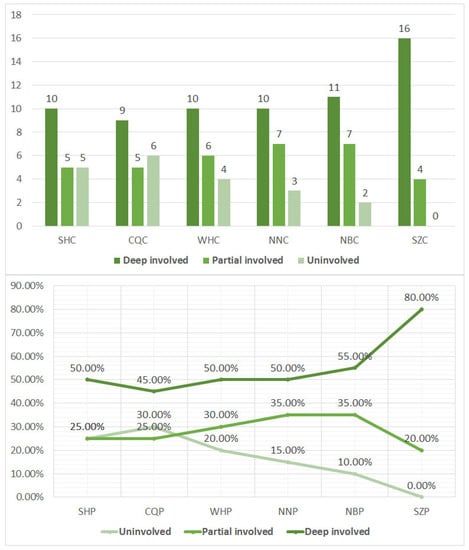
Figure 6.
Sponge watershed indicator in the selected pilot cities.
3.2.2. Breakdown Evaluation
The cross-comparison of the three levels and two types of features are demonstrated in Figure 7. From the perspective of deep involvement, the conventional indicators are much higher than the advanced indicators in all the selected pilot cities. For instance, Shanghai satisfied 40% of the conventional indicators while only 10% fulfilled the requirement of advanced indicators; Shenzhen achieved 60% of the conventional indicators, while only 20% fulfilled the requirement of advanced indicators. From the perspective of partial involvement, the conventional indicators are close to the advanced indicators in most selected pilot cities, ranging from 10% to 20%. Shenzhen is special, reaching 20% of advanced indicators in partial involvement, while all the conventional indicators are deep involvement. From the perspective of uninvolved, the conventional indicators are equal to the advanced indicators in all the selected pilot cities, ranging from 0 to 15%. In sum, Shenzhen fulfils 100% of strategies in the advanced indicators of the sponge watershed, among which 50% are deeply involved. The second-tier members are Wuhan and Ningbo, which fulfil 87.5% of the advanced indicators. Specifically, Wuhan achieved 50% of deep involvement while Ningbo achieved 37.5%. The third level belongs to Nanning, Chongqing, and Shanghai, which fulfils 75%, 62.5%, and 62.50%, respectively. Particularly, Nanning and Chongqing achieved 37.5% of deep involvement while Shanghai fulfilled 25% only.
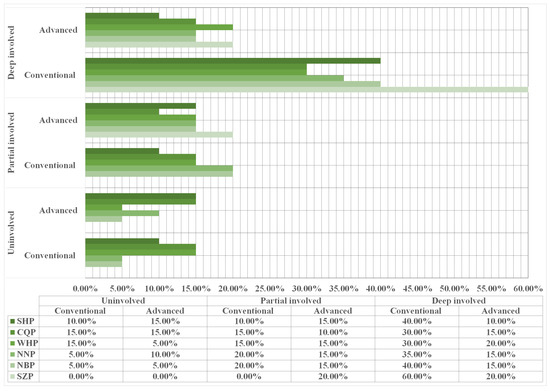
Figure 7.
Breakdown of conventional and advanced sponge watershed indicators in the selected pilot cites.
To obtain more accurate data evaluation, this study assigns parameter values to conventional indicators and advanced indicators. Simultaneously, parameter assignment is also performed on the difference in the degree of indicator participation. The assignment principle is confirmed by the Delphi method [199], and the specific assignment weights are shown in Table 6. According to the parameter calculation, the conventional indicator scores, advanced indicator scores, and overall scores of each city have been clearly presented in Figure 8. The data shows that in the conventional indicator statistics, Shenzhen got the highest score of 12, while Chongqing and Wuhan got the lowest score of 7.8; in the advanced indicator statistics, Shenzhen got the highest score of 9.6, while Shanghai got the lowest score of 5.7; in the total score statistics, Shenzhen got the highest score of 21.6, while Chongqing got the lowest score of 14.1.
Table 6.
The assignment weight of the Control Parameter.
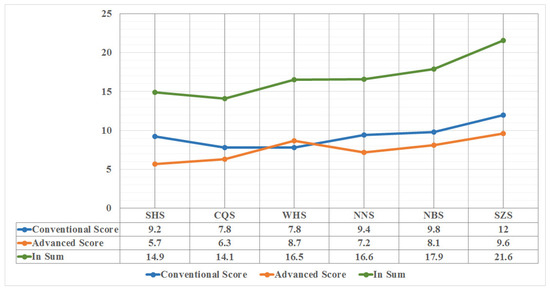
Figure 8.
Score summary of pilot cites.
Table 7 and Figure 9 show that each pilot city’s performance scores in the six modules are evaluated and standardized item by item. It demonstrated that Shenzhen received the highest score, which achieved an all-around lead in the six modules of water resilience, water resources, water treatment, water ecology, water space, and water management. To a certain extent reflects its influence on sponge city construction of comprehensive investment in technology, management, and capital. Ningbo ranks second in the total score, and except for water ecology, other indicators perform well. Nanning and Wuhan rank third and fourth in similar total scores and have the same water management and water ecology modules scores. The difference is that Wuhan takes the lead in the water resources and waterscape modules, but Nanning wins in the water treatment and water management modules. Shanghai and Chongqing ranked fifth and sixth, and each section scored differently. Shanghai leads Chongqing in water resources, water treatment, water ecology, and waterscape modules, but Chongqing performs better in water resilience and water management modules.
Table 7.
The score distribution of the six modules.
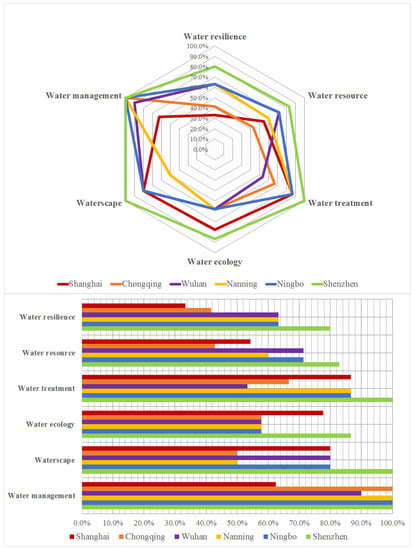
Figure 9.
The score distribution of six modules.
In Figure 10, the six cities are divided into three groups for comparative analysis. The first set of comparative cases are Shanghai and Wuhan. Both cities belong to the topography of the river plains, distributed in the middle and lower reaches of the Yangtze River. Obviously, Wuhan has better performance in water resilience, water resource and water management, while Shanghai got higher scores in water treatment and water ecology. The second set of comparative cases name Chongqing and Ningbo. Both cities have similar latitudes, and mountains and hills dominate the terrain. However, Ningbo performs better in water resilience, water resource, water treatment and waterscape. The Third set of comparative cases come from Nanning and Shenzhen. Nanning and Shenzhen are in the Pearl River Basin in South China, and their geographical forms are dominated by hills and have similar climatic conditions. Specifically, Shenzhen wins in water resilience, water resource, water treatment, water ecology, and waterscape.
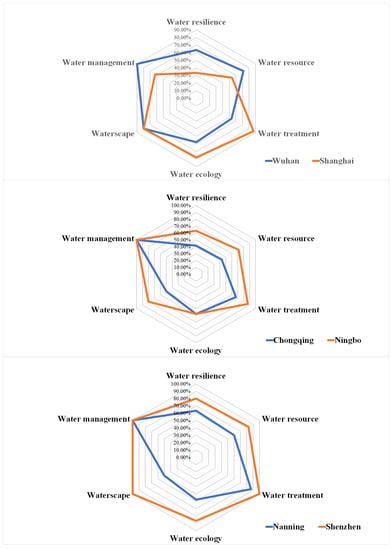
Figure 10.
Comparative analysis of selected pilot cities.
4. Discussion
4.1. The Comparison of Pilot Cities among Six Modules
According to the overall data statistics in the third chapter, it is noticed that the three higher-ranking cities (Shenzhen, Ningbo, and Nanning) have higher mean annual precipitation, which has advantages in rainwater utilization and ecological water replenishment. Furthermore, their outstanding leverages are concentrated in the modules of water resilience and water management [126,141,142]. Simultaneously, most of the cities with higher rankings are in hilly areas, while the lower rankings are mainly located in the plain river network (Shanghai and Wuhan) and the high mountain area (Chongqing). Due to the terrain factors that contribute to urban waterlogging, it is difficult to ease the logged water in the lowlands and plains [200]. On the other hand, the landform of mountain terrain in Chongqing increases the difficulty of runoff flow, velocity control and water quality control [201].
Further, the six cities are divided into three groups for comparative analysis based on topography, rainfall, ranking, and location to analyze the elaborate indicators. In the first group, Wuhan and Shanghai had average ratings and only passed the assessment in the first and second batch of pilot cities, respectively. It is worth noting that Wuhan originally scored very low in the conventional indicators. Still, through advanced indicators to catch up, the final total score and the third-place Nanning is comparable. On the contrary, Shanghai is originally scored much higher in conventional indicators than Wuhan. However, due to the lowest score in advanced indicators, Shanghai is overtaken by Wuhan and eventually became the second-to-last. By reviewing the sponge cities’ construction process in the two cities, seeing that Shanghai undoubtedly has more advantages in overall investment and has achieved remarkable results in water treatment and water ecology modules [140,202]. Nevertheless, Wuhan has leapt to a higher place with its advantages in river network connection, blue-green space, ecological base flow, and comprehensive sponge facilities, reflecting the effect on water resilience, water resource, and water management modules [203].
In the second group, Ningbo won an excellent grade in the second batch of pilot cities, while Chongqing only passed in the first batch of pilot cities evaluation. The mountain area of Ningbo is accounting for 51.38% of the land area, while the water area is accounting for 6.39% of the land area. Due to the expansive water area, Ningbo has more storage space for waterlogging regulation. Through the “grey-green” infrastructure combination, the urban ecological space relates to the sponge facility system, which performs well in water resilience, water resources, water treatment, and water landscape modules [98]. Chongqing is in the parallel ridge-valley zone between mountains and hills and valleys in the eastern part of the Sichuan Basin. The mountains (central and low mountains) and hills account for 94% of the city area. Chongqing’s challenges in building a sponge city include landform conditions aggravating runoff control, rainfall conditions intensifying the difficulty of absorbing and using runoff flows on the spot, and soil conditions increasing its feasibility of constructing LID facilities [201]. Fortunately, 78% of the urban area of Chongqing is the natural ecological area of mountains, water, forests, and fields, which provides sufficient space for the construction of the sponge watershed. Therefore, Chongqing’s planning strategy is to build a three-dimensional mountain sponge system that absorbs rainwater from high to low by building three-dimensional greening of buildings, mountain public sponge systems, and living water sponge systems [139].
In the third group, Shenzhen ranked first in the second batch of pilot cities, while Nanning was awarded an excellent grade in the first batch of pilot cities evaluation. Regardless of the project construction effectiveness, the experience evaluation that can be promoted and replicated, and the use of funds and operation mode, Shenzhen has achieved outstanding results and has great advantages [75]. Among the conventional indicators, Shenzhen is the only one to strictly implement the elements of ecological shoreline restoration ratio and heat island effect mitigation; in the advanced indicators, Shenzhen emphasizes the optimization of ecological green corridors, combined with urban water system planning and openings along rivers within the city [146]. Nanning came to the fore in the first batch of 16 sponge city pilots and achieved excellence, closely related to the urban natural ecological spatial pattern construction strategy. The construction of sponge city in Nanning first sorts out the relationship between the city’s mountains, water system, vegetation, countryside, and the spatial combination of lakes and ponds and urban buildings, forming an ecological pattern of important lakes rivers connected to the water network [204].
4.2. The Transition from Sponge City towards Sponge Watersheds
Over the years, researchers have drawn close attention to the national strategy of sponge city. Yu, Li, Yuan, Fu, Qiao, and Wang [53] interpret the origin, process, content and methodologies of the sponge city conception, which attempt to provide an integrated solution to the significant water predicament in urban and rural China. Qiu [205] introduces the primary connotation, implements the approach, and makes a prospect for strengthening the new technology of sponge city construction. Zhang, Wang, Hu, and He [51] identified that the urban water system is essential in constructing the sponge city and an overall program on the watershed and city scale. Xie et al. [206] demonstrated the core issue of sponge city should correspond with comprehensive urban development, including urban planning, flood control, water resources protection, water pollution prevention, water ecological restoration, and multi-professional collaboration. Chan, Griffiths, Higgitt, Xu, Zhu, Tang, Xu, and Thorne [12] suggested that the next stage for the Sponge City concept is its overall application within a broader, National Planning policy. Yan [207] studied the connection between the sponge city construction and the river basin comprehensive planning, which demonstrated that the two should further enhance correlation and increase planning coverage according to different scales. Therefore, the transition from sponge city towards sponge watershed is an imperative and urgent demand where ecological space could engage, inform, and influence human behaviour to benefit the natural environment and the improvement of the social fabric.
First, The awareness of the sponge watershed highlights the evidence that urban green and blue spaces are as significant as social and technical infrastructures in terms of urban livability, sustainability, and resilience [63]. As aforementioned, water resilience depends on the macro pattern of spatial constraint and the network connectivity. It is identified that delineate the ecological red line, the water system blue line, and the urban park green line to ensure that the proportion of non-construction land (green and blue space) in the watershed is not less than 70% [49]. Meanwhile, the connection of river networks and water bodies in the built environment is an essential foundation for regional flood prevention, water supply and aquatic ecological security [74,155]. For the rivers covered by culverts during urban construction, the fragmented water bodies shall be restored to their natural forms as much as possible to maintain the connectivity of the water systems [31].
Second, the traditional ideology used to address water problems relying on sector-based, technology-driven engineering solutions, especially the grey infrastructure and hard engineering-based management approaches, should be transformed [12]. This study demonstrated that those sponge pilot cities guided by the sponge watershed system perform much better than the sponge pilot cities that rely on traditional management division and technology or engineering. The sponge watershed initiative helps to flourish the essential, transformative change of water management in China and other countries from the traditional sector-based, engineering-oriented paradigm to a nature-based, holistic approach [54]. Specifically, the water ecology module and waterscape module are interrelated in ecosystem restoration and ecological corridor construction, promoting human health and wellbeing upon sharing the environmental value. The concept of water sensitivity provides a vision to identify that in urban areas, it is vital to link ecological corridors with urban design, place-making, and livability, rest largely on the ability of the urban design industry to provide engaging and informative landscape design solutions within the public realm [72]. In the sponge watershed, planning and design integrate both the engineering and ecological professions associated with protecting urban water resources and transform this process for facilitating the interaction between the urban built form and the urban water cycle. The implementation of sponge city construction could largely depend on the capability of the urban design industry to provide fascinating and educational waterscape design solutions within the public realm [66].
Last, the watershed sponge project should pay close attention to the land development for water infrastructure, the monitoring system for sponge city construction, and the POE study for environmental effectiveness and social benefit, closing the loop of planning, construction, and maintenance. It is significant to integrate the urban water infrastructure into urban green open spaces’ planning and design to promote multi-functional and compound utilization of urban water systems. Meanwhile, with the help of the SWMM rainwater management model and ArcGIS geographic information system, a refined rainwater runoff model of watershed surface runoff and non-point source pollution is constructed for sponge watershed monitoring. Further, post-occupancy evaluation (POE) of environmental effectiveness and social benefit is required to evaluate the water environment quality, green space rate, landscape degree, and other factors before and after constructing the sponge city and the economic benefit evaluation.
5. Conclusions and Implication
This paper argues for shifting sponge city construction from the urban scale to watershed scale to demonstrate integrated solutions for strengthening urban water resilience and sustainability. An innovative framework is established to address urban water issues and human livability via 20 conventional and advanced indicators and the interrelations between the water resilience module, water resource module, water treatment module, water ecology module, waterscape module, and water management module. It attempts to bridge the gap between urban and nature, microscope and macroscope, individual and integration, development and conservation in diverse dimensions and scales. Six representative cities from the sponge city construction pilot in South China have been selected, namely, Shanghai, Chongqing, Wuhan, Nanning, and Ningbo. The compatibility and divergence between their guidelines and the sponge watershed framework are revealed through pair analyses, and parameter calculation with the conventional indicator scores, advanced indicator scores, and overall scores of each city have been clearly presented. The results demonstrated that Shenzhen, Ningbo, and Nanning achieved higher scores in the overall evaluation, while Wuhan, Shanghai, and Chongqing received lower scores, respectively. Unlike the consistency of scores in other cities, Wuhan performs much better in the scores of advanced indicators than the scores of conventional indicators. Specifically, Wuhan has leapt to a higher place with its advantages in river network connection, blue-green space, ecological base flow, and comprehensive sponge facilities. Shanghai is originally scored much higher in conventional indicators but dropped after the calculation of advanced indicators. The diverse perspectives behind the scores have been discussed carefully, and the successful experiences of excellent cities are systematically summarized and promoted. First, the awareness of the sponge watershed highlights the evidence that urban green and blue spaces are as significant as social and technical infrastructures in terms of urban livability, sustainability, and resilience. Second, it is demonstrated that cities that follow the perspective of watershed ecosystem perform much better than the pilot cities still dependent on the traditional technocratic thinking and focuses on technological or engineering. Third, the watershed sponge project should pay close attention to the land development for water infrastructure, the monitoring system for sponge city construction, and the POE study for environmental effectiveness and social benefit.
Accompanied by the development of sponge city construction, several emerging stormwater management practices are prevailing to mitigate urban water issues and supporting urban water management in various terms worldwide, i.e., LID, BMPs, SUDS, GI, WSUD, etc. Although divergence and contestation are conspicuous between these terminologies, the sharing philosophy underneath is transforming the linear character of the conventional UWM into a recyclable approach that helps to mitigate flooding risk, reduce non-point source pollution, recharge groundwater, and supplement environmental flows. Recently, the research tendency has shifted from small-scale LID/BMP designs to large-scale SUDS, GI and WSUD implementation to mitigate the effects of urban development on natural ecosystems. The analyses and findings in this research have significant methodological implications for shifting the sponge city practice towards linking urban development with watershed ecological conservation. In response to this trend, sponge city practice should transfer from micro-sites to macro-watersheds, from engineering thinking to ecological consciousness, from focusing on construction to strengthening management and post-evaluation and address the holistic perspectives that coupled green infrastructure with grey infrastructure.
The previous researcher argues building a huge “dam” or other giant facilities to reduce uncertainty is a traditional industrial civilization idea, while change the mind-setting is the first issue to build the urban resilience. The idea of sponge watershed adopts a holistic aquatic ecosystem symbiosis with the central cities, urban agglomerations, and rural settlements, which correlated with water resources conservation, tourism and leisure, sediment and material transport, climate regulation, aesthetic functions, natural systems maintenance, biodiversity, and other values. The intention of this study contributes to reinforce the watershed ability of flood control, optimize the water resource efficiency, maximize the capacity of water pollution treatment, strengthen the water ecological services, promote the multi-functions of the waterscape, and minimize the negative influence of the urban sprawl. Planners and designers who employ the innovative framework of sponge watershed help strengthen the connectivity between human activity and the urban water system, which is recognized as having a powerful influence on the consciousness of individuals and recognition of their role and responsibility in the protection and enhancement of our natural water resources. Cooperative collaboration between the urban design professions can achieve a “smarter” and more sustainable waterscape where urban landscapes engage, inform, and influence human behaviour for the benefit of the natural environment.
In sum, the framework of the sponge watershed links (Appendix A) the water infrastructure with urban design, place-making, and livability. The water resilience module provides a sustainable basis through ecological and technical approaches in the context of urban agglomeration; the water resource module and water treatment module deal with the livelihood issues of urban development; water ecology module and the waterscape module correlated grey infrastructure with green infrastructure, which helps to optimize the quality of urban development and minimize the intervention on the watershed ecosystem; water management module closes the loop of planning, construction, and maintenance. The analyses and findings in this research have significant methodological implications for shifting the sponge city practice towards linking urban development with watershed ecological conservation. The proposed framework and strategies provide a reference for an integrated solution of watershed health and wellbeing in the next generation sponge city practice.
Author Contributions
Conceptualization, J.W.; methodology, F.X.; data collection, R.J., Q.L. and X.S.; formal analysis, F.X.; investigation, X.S.; resources, W.Z.; writing—original draft preparation, J.W., R.J., Y.H. and Q.L.; writing—review and editing, F.X.; visualization, Q.L.; supervision, W.Z.; project administration, J.W.; funding acquisition, Y.H. All authors have read and agreed to the published version of the manuscript.
Funding
This research was funded by Shenzhen Science and Technology Project “Research of Urban drainage System Construction Based on Sponge City Concept”, grant number JSGG20170824102728529.
Institutional Review Board Statement
Not applicable
Informed Consent Statement
Not applicable.
Data Availability Statement
Not applicable.
Acknowledgments
The authors gratefully acknowledge the research funding sources from Shenzhen Science and Technology Project (Ref No. JSGG20170824102728529) for the research project Urban drainage System Construction Based on Sponge City Concept. Many thanks are due to colleagues from Shenzhen Water Planning & Design Institute Co., Ltd. for their generous assistance and unreservedly support throughout the research process. The authors also like to thank the other participants who provided helpful feedback to support the Sponge Watershed research.
Conflicts of Interest
The authors declare no conflict of interest.
Appendix A. Terminologies
- Sponge city: An approach of ecological urban design and national policy launched in China in 2014. It aims to tackle the urban water issues in waterlogging prevention, water quality improvement, ecological infrastructure conservation, etc.
- Sponge watershed: An innovative concept which shifts the sponge city practice from urban scale to watershed scale. Based on the natural hydrological unit’s ecological services, it attempts to bridge the gap between urban and nature, microscope and macroscope, individual and integration, and development and conservation in diverse dimensions and scales.
Appendix B. Equations
- Equation (A1) [157]:where γ represents the ratio, L means the number of sides of the river network, V is the number of vertices of the river network, and N is the number of nodes of the river network (V > 3, V ϵ N).
- Equation (A2) [22,23]:where α is the volume capture ratio of annual rainfall (%); φ is the Composite runoff coefficient.
- Equation (A3) [92]:where φca and φcb are the average rainfall and runoff coefficient of the underlying surface of a and b, respectively; Fa and Fb are the areas of the underlying surface of a and b, respectively; k is the runoff adjustment coefficient.
- Equation (A4) [186,187]:where H′ = the species diversity index; Pi the ratio of the number of individuals of the No.i species to the total number of individuals.
References
- United Nations. World Urbanization Prospects: The 2018 Revision; United Nations, Department of Economic and Social Affairs, Population Division: New York, NY, USA, 2019; p. 103. ISBN 978-92-1-004314-4. [Google Scholar]
- Gao, B.; Huang, Q.; He, C.; Ma, Q. Dynamics of Urbanization Levels in China from 1992 to 2012: Perspective from DMSP/OLS Nighttime Light Data. Remote Sens. 2015, 7, 1721–1735. [Google Scholar] [CrossRef]
- Guo, W.; Wei-Zhong, S.; Wei-Xiao, C.; Shuang, C.; Gui-Shan, Y. Analysis on spatial pattern of urban-rural construction land in natural ecological regionalization in china. Resour. Environ. Yangtza Basin 2017, 26, 1011–1021. [Google Scholar]
- Mostafa, L.A. Urban and Social Impacts of Waterfronts Development, Case Study: Jeddah Corniche. Procedia Environ. Sci. 2017, 37, 205–221. [Google Scholar] [CrossRef]
- Chang, T.C.; Huang, S. Reclaiming the City:Waterfront Development in Singapore. Urban. Stud. 2011, 48, 2085–2100. [Google Scholar] [CrossRef]
- Liao, C.-q.; Zheng, L. Distribution and its changes of population and urbanization in urban agglomeration in the middle reaches of Yangtze River. Resour. Environ. Yangtza Basin 2017, 26, 963–972. [Google Scholar]
- Zhu, D.; Wang, X.; Zhang, J. Approaches for Water Ecosystem Protection and Restoration. China Water Resour. 2015, 22, 9–13. [Google Scholar]
- Lundy, L.; Wade, R. Integrating sciences to sustain urban ecosystem services. Prog. Phys. Geogr. 2011, 35, 653–669. [Google Scholar] [CrossRef]
- UNEP. Millennium Ecosystem Assessment Ecosystems and Human Well-being: A Framework for Assessment; UNEP: Washington, DC, USA, 2003; ISBN 1-55963-402-2. [Google Scholar]
- Everard, M. Why does ‘good ecological status’ matter? Water Environ. J. 2012, 26, 165–174. [Google Scholar] [CrossRef]
- Dong, Z.-r. Framework of Research on Fluvial Ecosystem. J. Hydraul. Eng. 2009, 40, 129–137. [Google Scholar]
- Chan, F.K.S.; Griffiths, J.A.; Higgitt, D.; Xu, S.; Zhu, F.; Tang, Y.-T.; Xu, Y.; Thorne, C.R. “Sponge City” in China—A breakthrough of planning and flood risk management in the urban context. Land Use Policy 2018, 76, 772–778. [Google Scholar] [CrossRef]
- Nguyen, T.T.; Ngo, H.H.; Guo, W.; Wang, X.C.; Ren, N.; Li, G.; Ding, J.; Liang, H. Implementation of a specific urban water management—Sponge City. Sci. Total Environ. 2019, 652, 147–162. [Google Scholar] [CrossRef] [PubMed]
- Yu, K. Key Technologies for Construction of Water Ecological Infrastructures. China Water Resour. 2015, 22, 1–4. [Google Scholar]
- Liu, G.; Zhang, L.; Zhang, Q. Spatial and Temporal Dynamics of Land Use and Its Influence on Ecosystem Service Value in Yangtze River Delta. Acta Ecol. Sin. 2014, 34, 3311–3319. [Google Scholar]
- Yao, X.; Zeng, J.; Li, W. Spatial Correlation Characteristics of Urbanization and Land Ecosystem Service Value in Wuhan Urban Agglomeration. Trans. Chin. Soc. Agric. Eng. 2015, 31, 249–256. [Google Scholar]
- Wang, L.; Xiao, Y.; Jiang, L.; Rao, E.; Ouyang, Z.; Zheng, H. The Influence of Urbanization on Ecosystem Services in the Hohhot-Baotouordos Region. Acta Ecol. Sin. 2016, 36, 6031–6039. [Google Scholar]
- Jia, H.; Yao, H.; Tang, Y.; Yu, S.L.; Field, R.; Tafuri, A.N. LID-BMPs planning for urban runoff control and the case study in China. J. Environ. Manag. 2015, 149, 65–76. [Google Scholar] [CrossRef]
- Liu, L.; Jensen, M.B. Green infrastructure for sustainable urban water management: Practices of five forerunner cities. Cities 2018, 74, 126–133. [Google Scholar] [CrossRef]
- Leinberger, C.B. Green urbanism: Urbanism in the Age of Climate Change. Issues Sci. Technol. 2011, 27, 89–92. [Google Scholar]
- Ma, Y.; Jiang, Y.; Swallow, S. China’s sponge city development for urban water resilience and sustainability: A policy discussion. Sci. Total Environ. 2020, 729, 139078. [Google Scholar] [CrossRef]
- MHURD. Technical Guideline for Sponge City Construction-Low Impact Development Rainwater System Construction (Trial); MHURD: Beijing, China, 2014; p. 84.
- MHURD. Assessment Standard for Sponge City Construction Effect. In PRC National Standard; China Construction Industry Press: Beijing, China, 2018; Volume GB/T 51345–2018, p. 39. [Google Scholar]
- Qiao, X.-J.; Liao, K.-H.; Randrup, T.B. Sustainable stormwater management: A qualitative case study of the Sponge Cities initiative in China. Sustain. Cities Soc. 2020, 53, 101963. [Google Scholar] [CrossRef]
- Ren, X.X.; Tang, W.Z. Application of capture ratio of total annual runoff volume in spongy city. China Water Wasterwater 2015, 31, 105–109. [Google Scholar]
- Wang, W.L.; Li, J.Q.; Che, W.; Zhao, Y. Explanation of Sponge City Development Technical Guide: Planning Index for Urban Total Runoff Volume Capture. China Water Wasterwater 2015, 31, 18–23. [Google Scholar]
- EPA. The Use of Best Management Practices (BMPs) in Urban Watersheds; U.S. Environmental Protection Agency: Washington, DC, USA, 2004; p. 271.
- Zhang, K.; Chui, T.F.M. A comprehensive review of spatial allocation of LID-BMP-GI practices: Strategies and optimization tools. Sci. Total Environ. 2018, 621, 915–929. [Google Scholar] [CrossRef] [PubMed]
- Trinh, D.H.; Chui, T.F.M. Assessing the hydrologic restoration of an urbanized area via an integrated distributed hydrological model. Hydrol. Earth Syst. Sci. 2013, 17, 4789–4801. [Google Scholar] [CrossRef]
- Li, Q.; Ren, C.; Wan, L. Quantitative Study in Sponge City Planning and Design: A Case Study of the City Proper of Jinan. Mod. Urban. Res. 2018, 2, 24–31. [Google Scholar]
- Zhu, W.; Wang, J.; Xue, F.; Chen, S. Integrated Solutions for Urban. Water Issues; Phoenix Science Press: Nanjing, China, 2018. [Google Scholar]
- He, J.; Li, H. On the Construction of Sponge City in Dianchi Basin. J. Kunming Univ. 2017, 39, 85–90. [Google Scholar]
- Andrews, S.; Duggan, P. Towards ‘strategy as performance’ in hazard mitigation: Reflections on Performing City Resilience in New Orleans. Res. Drama Educ. J. Appl. Theatre Perform. 2021, 26, 187–201. [Google Scholar] [CrossRef]
- Qiu, B. Methods and Principles of Designing Resilient City Based On Complex Adaptive System Theory. Urban. Dev. Stud. 2018, 25, 1–3. [Google Scholar]
- Qiu, B. Ten Steps towards Resilient Cities. China Anc. City 2021, 35, 1–8. [Google Scholar]
- Wang, H. Collaborative Strategies to Alleviate China’s Water Resource Problems. Landsc. Archit. Front. 2017, 1, 40–47. [Google Scholar] [CrossRef]
- Hamel, P.; Daly, E.; Fletcher, T.D. Source-control stormwater management for mitigating the impacts of urbanisation on baseflow: A review. J. Hydrol. 2013, 485, 201–211. [Google Scholar] [CrossRef]
- Wang, M.; Sweetapple, C.; Fu, G.; Farmani, R.; Butler, D. A framework to support decision making in the selection of sustainable drainage system design alternatives. J. Environ. Manag. 2017, 201, 145–152. [Google Scholar] [CrossRef] [PubMed]
- Tedoldi, D.; Chebbo, G.; Pierlot, D.; Kovacs, Y.; Gromaire, M.-C. Impact of runoff infiltration on contaminant accumulation and transport in the soil/filter media of Sustainable Urban Drainage Systems: A literature review. Sci. Total Environ. 2016, 569–570, 904–926. [Google Scholar] [CrossRef]
- Giustolisi, O.; Laucelli, D.; Mastrorilli, M. Integrated Management of Urban Water Systems to Reuse Waste Waters; WIT Press: Southampton, UK, 2001; Volume 49. [Google Scholar]
- Shah, R.V. Decentralized water treatment—Citizens tracking results and impact. Water Pract. Technol. 2015, 10, 438–444. [Google Scholar] [CrossRef]
- Arora, A.S.; Reddy, A.S. Conceptualizing a decentralized stormwater treatment system for an urbanized city with improper stormwater drainage facilities. Int. J. Environ. Sci. Technol. 2015, 12, 2891–2900. [Google Scholar] [CrossRef]
- Zhou, Y.; Zhou, X.; Zhang, X.H. Approaches to Improve Ecological Base Flow in Baoji Reach of Wei River. J. Hydroelectr. Eng. 2012, 31, 56–62. [Google Scholar]
- Cheng, B.; Li, H.; Yue, S.; Huang, K. A conceptual decision-making for the ecological base flow of rivers considering the economic value of ecosystem services of rivers in water shortage area of Northwest China. J. Hydrol. 2019, 578, 124126. [Google Scholar] [CrossRef]
- Hsu, N.-S.; Chiang, C.-H.; Cheng, W.-M.; Wei, C.-C. Study on the Trade-Off between Ecological Base Flow and Optimized Water Supply. Water Resour. Manag. 2012, 26, 3095–3112. [Google Scholar] [CrossRef]
- Davies, B.R.; Biggs, J.; Williams, P.J.; Lee, J.T.; Thompson, S. A comparison of the catchment sizes of rivers, streams, ponds, ditches and lakes: Implications for protecting aquatic biodiversity in an agricultural landscape. Hydrobiologia 2008, 597, 7–17. [Google Scholar] [CrossRef]
- Nakano, S.-i.; Yahara, T.; Nakashizuka, T. Aquatic Biodiversity Conservation and Ecosystem Services; Springer: Singapore, 2016; p. 125. [Google Scholar]
- USGBC. LEED V4 Reference Guide for Building Design and Construction; U.S. Green Building Council: Washington, DC, USA, 2013. [Google Scholar]
- Li, Y.; Xue, F.; Jing, R.; Wang, Y.; Wang, J. Study on Water-City Pattern Strategies of Shenshan Special Cooperation Zone, China with Sponge City Construction at the Watershed Scale. Landsc. Archit. Front. 2019, 7, 104–113. [Google Scholar] [CrossRef]
- Gong, C. The Study of Urban Public Open Space System Planning Based on the Green Infrastructure; Southeast University: Nanjing, China, 2018. [Google Scholar]
- Zhang, J.; Wang, Y.; Hu, Q.; He, R. Discussion and views on some issues of the sponage city construction in China. Adv. Water Sci. 2016, 27, 793–799. [Google Scholar]
- Eckart, K.; McPhee, Z.; Bolisetti, T. Performance and implementation of low impact development—A review. Sci. Total Environ. 2017, 607–608, 413–432. [Google Scholar] [CrossRef] [PubMed]
- Yu, K.; Li, D.; Yuan, H.; Fu, W.; Qiao, Q.; Wang, S. “Sponge City”: Theory and Practice. City Plan. Rev. 2015, 39, 26–36. [Google Scholar]
- Jiang, Y.; Zevenbergen, C.; Ma, Y. Urban pluvial flooding and stormwater management: A contemporary review of China’s challenges and “sponge cities” strategy. Environ. Sci. Policy 2018, 80, 132–143. [Google Scholar] [CrossRef]
- Lee, J.G.; Selvakumar, A.; Alvi, K.; Riverson, J.; Zhen, J.X.; Shoemaker, L.; Lai, F. A watershed-scale design optimization model for stormwater best management practices. Environ. Model. Softw. 2012, 37, 6–18. [Google Scholar] [CrossRef]
- Wang, S.; Wang, H. Extending the Rational Method for assessing and developing sustainable urban drainage systems. Water Res. 2018, 144, 112–125. [Google Scholar] [CrossRef]
- Eckart, K.; McPhee, Z.; Bolisetti, T. Multiobjective optimization of low impact development stormwater controls. J. Hydrol. 2018, 562, 564–576. [Google Scholar] [CrossRef]
- Matlock, M.D.; Morgan, R.A. Ecological Engineering Design: Restoring and Conserving Ecosystem Services; John Wiley & Sons, Inc.: Toronto, ON, Canada, 2011. [Google Scholar]
- Rakib, Z.; Barber, M.; Mahler, R. Climate Change Impacts on Urban Stormwater Best Management Practices. Int. J. Sustain. Dev. Plan. 2017, 12, 155–164. [Google Scholar] [CrossRef]
- Brown, R.R.; Keath, N.; Wong, T.H.F. Urban water management in cities: Historical, current and future regimes. Water Sci. Technol. 2009, 59, 847–855. [Google Scholar] [CrossRef]
- Hoyer, J. Water Sensitive Urban Design: Principles and Inspiration for Sustainable Stormwater Management in the City of the Future; Jovis: Berlin, Germany, 2011. [Google Scholar]
- Calfapietra, C.; Cherubini, L. Green Infrastructure: Nature-Based Solutions for sustainable and resilient cities. Urban For. Urban Green. 2019, 37, 1–2. [Google Scholar] [CrossRef]
- Pauleit, S.; Andersson, E.; Anton, B.; Buijs, A.; Haase, D.; Hansen, R.; Kowarik, I.; Stahl Olafsson, A.; Van der Jagt, S. Urban green infrastructure—Connecting people and nature for sustainable cities. Urban For. Urban. Green. 2019, 40, 1–3. [Google Scholar] [CrossRef]
- Li, H.; Ding, L.; Ren, M.; Li, C.; Wang, H. Sponge City Construction in China: A Survey of the Challenges and Opportunities. Water 2017, 9, 594. [Google Scholar] [CrossRef]
- Ding, J.; Leng, X.; Chen, J.; Li, S. Governance of fragmented phenomenon of sponge city construction. J. Econ. Water Resour. 2020, 38, 33–40. [Google Scholar]
- Wong, T.H.F. An Overview of Water Sensitive Urban Design Practices in Australia. Water Pract. Technol. 2006, 1, 1–8. [Google Scholar] [CrossRef]
- Roy, A.H.; Wenger, S.J.; Fletcher, T.D.; Walsh, C.J.; Ladson, A.R.; Shuster, W.D.; Thurston, H.W.; Brown, R.R. Impediments and Solutions to Sustainable, Watershed-Scale Urban Stormwater Management: Lessons from Australia and the United States. Environ. Manag. 2008, 42, 344–359. [Google Scholar] [CrossRef]
- Jiang, Y. China’s water security: Current status, emerging challenges and future prospects. Environ. Sci. Policy 2015, 54, 106–125. [Google Scholar] [CrossRef]
- Peng, J.; Zhao, H.; Liu, Y. Urban ecological corridors construction: A review. Acta Ecologica Sinica 2017, 37, 23–30. [Google Scholar] [CrossRef]
- Butler, D.; Farmani, R.; Fu, G.; Ward, S.; Diao, K.; Astaraie-Imani, M. A New Approach to Urban Water Management: Safe and Sure. Procedia Eng. 2014, 89, 347–354. [Google Scholar] [CrossRef]
- Hoban, A. Chapter 2—Water Sensitive Urban Design Approaches and Their Description. In Approaches to Water Sensitive Urban Design; Sharma, A.K., Gardner, T., Begbie, D., Eds.; Woodhead Publishing: Swaston, UK, 2019; pp. 25–47. [Google Scholar]
- Ashley, R.; Lundy, L.; Ward, S.; Shaffer, P.; Walker, A.; Morgan, C.; Saul, A.; Wong, T.; Moore, S. Water-sensitive urban design: Opportunities for the UK. Proc. Inst. Civ. Eng. Munic. Eng. 2013, 166, 65–76. [Google Scholar] [CrossRef]
- Maragno, D.; Gaglio, M.; Robbi, M.; Appiotti, F.; Fano, E.A.; Gissi, E. Fine-scale analysis of urban flooding reduction from green infrastructure: An ecosystem services approach for the management of water flows. Ecol. Model. 2018, 386, 1–10. [Google Scholar] [CrossRef]
- MWR. Guidelines for Aquatic Ecological Protection and Restoration Planning. In Water Conservancy Industry Standard of the People’s Republic of China; China Water Conservancy and Hydropower Press: Beijing, China, 2015; Volume SL 709–2015, p. 56. [Google Scholar]
- GOCCC; GOSC. Notice by the General Office of the CPC Central Committee and the General Office of the State Council on the Topic of Issuing Guiding Opinions Regarding Coordinating the Delimitation and Implementation of Three Control Lines in National Spatial Planning; Xinhua News Agency: Beijing, China, 2019; p. 4. [Google Scholar]
- Mao, X.; Jia, H.; Yu, S.L. Assessing the ecological benefits of aggregate LID-BMPs through modelling. Ecol. Model. 2017, 353, 139–149. [Google Scholar] [CrossRef]
- Hager, J.; Hu, G.; Hewage, K.; Sadiq, R. Performance of low-impact development best management practices: A critical review. Environ. Rev. 2019, 27, 17–42. [Google Scholar] [CrossRef]
- Boyd, J.; Banzhaf, S. What are ecosystem services? The need for standardized environmental accounting units. Ecol. Econ. 2007, 63, 616–626. [Google Scholar] [CrossRef]
- UN. The Millennium Development Goals, Millennium Summit, New York, 2000; UN: New York, NY, USA, 2000; p. 1. [Google Scholar]
- Zhang, S.; Li, Y.; Ma, M.; Song, T.; Song, R. Storm Water Management and Flood Control in Sponge City Construction of Beijing. Water 2018, 10, 1040. [Google Scholar] [CrossRef]
- Liang, X. Integrated Economic and Financial Analysis of China’s Sponge City Program for Water-resilient Urban Development. Sustainability 2018, 10, 669. [Google Scholar] [CrossRef]
- Dong, Z. Eco-Hydraulic Engineering; China Water & Power Press: Beijing, China, 2019. [Google Scholar]
- Xue, F.; Wang, J.; Huang, Y.; Jing, R.; Lu, Q. From sponge city to sponge watershed: Addressing comprehensive water issues through an innovative framework. IOP Conf. Ser. Earth Environ. Sci. 2020, 569, 012083. [Google Scholar] [CrossRef]
- Kuang, W.; Yang, T.; Yan, F. Regional urban land-cover characteristics and ecological regulation during the construction of Xiong’an New District, Hebei Province, China. Acta Geogr. Sin. 2017, 72, 947–959. [Google Scholar]
- CMPB. Chongqing Sponge City Planning and Design Guidelines (Trial). In Chongqing Urban and Rural Construction Committee; Chongqing Municipal Planning Bureau: Chongqing, China, 2016; p. 78. [Google Scholar]
- Wang, L. Study of River System Structure, River-Lake Connectivity and Function in the Core Regions of Taihu Lake Basin; Nanjing University: Nanjing, China, 2013. [Google Scholar]
- Meng, H.-F.; Xu, Y.-P.; Xu, G.-L.; Zhang, X.-Q. Study on rivers connectivity evaluation in plain river network area. Resour. Environ. Yangtza Basin 2014, 23, 626–631. [Google Scholar]
- Ma, S. Study on River Network Pattern and Connectivity of Hangzhou-Jiaxing-Huzhou Plain Region Based on River Health Science; Nanjing University: Nanjing, China, 2013. [Google Scholar]
- Xu, Y.-S.; Shen, S.-L.; Lai, Y.; Zhou, A.-N. Design of sponge city: Lessons learnt from an ancient drainage system in Ganzhou, China. J. Hydrol. 2018, 563, 900–908. [Google Scholar] [CrossRef]
- Zhang, J.; Fu, S.; Ai, B. A Method for Rapid Estimation of Runoff Coefficient Based on Spectral Features of High Resolution Image—A Case Study in Sponge City Demonstration Area. Bull. Surv. Mapp. 2017, 6, 82–86. [Google Scholar]
- Lallam, F.; Megnounif, A.; Ghenim, A.N. Estimating the runoff coefficient using the analytic hierarchy process. J. Water Land Dev. 2018, 38, 67. [Google Scholar] [CrossRef]
- Li, J.; Yang, Y.; Mao, Y. Calculation method of composite runoff coefficient for sponge city design of building and subdistrict. Chin. J. Environ. Eng. 2020, 14, 2876–2881. [Google Scholar]
- Wang, X.; Sun, S.; Yang, P.; Zou, X.; Yi, Q.; Peng, B.; Xu, J. Evaluation on ecological effects under the sponge city construction at the Chuanzi River catchment in the Changde city, China. Acta Geogr. Sin. 2019, 74, 2123–2135. [Google Scholar]
- Zhu, L.; You, Y.; Cheng, P.; Liu, Y. Study on the effect of sponge constrction mode on the alleviation of urban heat island. Water Wastewater Eng. 2018, 44, 65–69. [Google Scholar]
- Lim, H.S.; Lu, X.X. Sustainable urban stormwater management in the tropics: An evaluation of Singapore’s ABC Waters Program. J. Hydrol. 2016, 538, 842–862. [Google Scholar] [CrossRef]
- Dong, G.; Weng, B.; Qin, T.; Denghua, Y.; Wang, H.; Gong, B.; Bi, W.; Xing, Z. The Impact of the Construction of Sponge Cities on the Surface Runoff in Watersheds, China. Adv. Meteorol. 2018, 2018, 9. [Google Scholar] [CrossRef]
- Lv, Y.; Mo, Z.; Zhang, C.; Jing, D. Study on the Method of Sponge City Special Planning for Watershed Scale: A Case Study on Shanghai Lingang Pilot Area. Urban Rural Plan. 2019, 2, 18–24. [Google Scholar]
- Xia, Y.; Cao, L.; Zhang, T.; Hu, N.; Shang, X. Sponge city planning concept and construction strategies: Hangzhou bay new city, Ningbo. Planners 2016, 32, 35–40. [Google Scholar]
- PNRBSM. Shenzhen Urban Planning Standards and Guidelines (2018 Revison); Shenzhen Municipal People’s Government: Shenzhen, China, 2018; p. 141.
- Zhao, H.; Huang, R. Preliminary exploration of Ecological water demand calculation method of rivers and lakes in small watershed. Water Resour. Dev. Res. 2020, 20, 67–71. [Google Scholar]
- Xu, Z.; Wu, W.; Yu, S. Ecological baseflow: Progress and challenge. J. Hydroelectr. Eng. 2016, 35, 1–11. [Google Scholar]
- Tennant, D.L. Instream Flow Regimens for Fish, Wildlife, Recreation and Related Environmental Resources. Fisheries 1976, 1, 6–10. [Google Scholar] [CrossRef]
- Wang, J.; Wang, F. Practice of Initial (Light) Rainfall Interception in Shenzhen City. China Water Wasterwater 2016, 32, 116–118. [Google Scholar]
- MHURD. Technical Code for Urban Stormwater Detention and Retention Engineering. In PRC National Standard; China Planning Press: Beijing, China, 2017; Volume GB 51174—2017, p. 77. [Google Scholar]
- MHURD. Code for Design of Outdoor Wastewater Engineering (2016 Edition). In PRC National Standard; China Planning Press: Beijing, China, 2016; Volume GB 50014—2006, p. 98. [Google Scholar]
- Andrés-Valeri, V.C.; Castro-Fresno, D.; Sañudo-Fontaneda, L.A.; Rodriguez-Hernandez, J. Comparative analysis of the outflow water quality of two sustainable linear drainage systems. Water Sci. Technol. A J. Int. Assoc. Water Pollut. Res. 2014, 70, 1341–1347. [Google Scholar] [CrossRef]
- Yau, W.K.; Radhakrishnan, M.; Liong, S.-Y.; Zevenbergen, C.; Pathirana, A. Effectiveness of ABC Waters Design Features for Runoff Quantity Control in Urban Singapore. Water 2017, 9, 577. [Google Scholar] [CrossRef]
- Gavrić, S.; Leonhardt, G.; Marsalek, J.; Viklander, M. Processes improving urban stormwater quality in grass swales and filter strips: A review of research findings. Sci. Total Environ. 2019, 669, 431–447. [Google Scholar] [CrossRef]
- Zheng, Y. Small, Dispersed Urban Sewage Treatment. Urban Insight 2015, 2, 42–51. [Google Scholar]
- Zhao, Z.; Che, W.; Zhao, Y.; Zhang, W. Summary comparison of combined sewer overflow control between China and the United States. Water Wastewater Eng. 2018, 44, 128–134. [Google Scholar]
- Mu, J. Analysis of pollution reduction effect of reservior on drainage of pumping station dranage system. Water Wastewater Eng. 2020, 46, 197–199. [Google Scholar]
- MHURD. Code for Plan of Urban Water System. In PRC National Standard; China Planning Press: Beijing, China, 2016; Volume GB 50513–2009, p. 51. [Google Scholar]
- Gao, C.; Liu, J.; Cui, H.; Wang, Z.; He, S. Optimized water surface ratio and pervious surface proportion in urbanized riverside areas. Environ. Earth Sci. 2014, 72, 569–576. [Google Scholar] [CrossRef]
- Tang, V.; Fu, D.; Singh, R.; Rene, E.; Binh, T.; Sharma, A. Evaluating the effectiveness of ecological restoration of hard bank rivers: A case study from Shedu river port, China. Water Supply Res. Technol. Aqua 2018, 67, 824–833. [Google Scholar] [CrossRef]
- Palmer, M.A.; Hondula, K.L.; Koch, B.J. Ecological Restoration of Streams and Rivers: Shifting Strategies and Shifting Goals. Annu. Rev. Ecol. Evol. Syst. 2014, 45, 247–269. [Google Scholar] [CrossRef]
- Chen, Y.-T.; Chen, Y.-W.; Lin, S.-S.; Gao, Y.-R.; Luo, L.; Yu, F.-Q. Screening and Application Analysis of Indigenous Plants Suitable for Rain Garden in Guangdong Province. Subtrop. Plant. Sci. 2017, 46, 274–280. [Google Scholar]
- Økland, J.; Økland, K.A. The effects of acid deposition on benthic animals in lakes and streams. Experientia 1986, 42, 471–486. [Google Scholar] [CrossRef]
- Wang, W.-j.; Huang, Y.; Chen, K. Aquatic ecosystem monitor and assessment in Long-gang River. China Rural Water Hydropower 2014, 6, 54–56. [Google Scholar]
- CABE. Open Space Strategies: Best Practice Guidance; Greater London Authority: London, UK, 2009; p. 68. ISBN 978-1-84633-022-3.
- Frumkin, H. Healthy Places: Exploring the Evidence. Am. J. Public Health 2003, 93, 1451–1456. [Google Scholar] [CrossRef]
- Zhuo, H.D.; Wu, J.Y. Planning of Slow Traffic System Combining Greenway from Bottom-Up Perspective: A Case Study of Ersha Island (Guangzhou). Adv. Mater. Res. 2014, 971–973, 2208–2212. [Google Scholar] [CrossRef]
- Saunders, W.S.; Yu, K. Designed Ecologies: The Landscape Architecture of Kongjian Yu; Birkhäuser: Basel, Switzerland, 2012. [Google Scholar]
- Mikovits, C.; Rauch, W.; Kleidorfer, M. Importance of scenario analysis in urban development for urban water infrastructure planning and management. Comput. Environ. Urban. Syst. 2018, 68, 9–16. [Google Scholar] [CrossRef]
- Yao, H.-M.; Lu, Y.-N.; Wang, S. An optimizing simulation study of sponge city construction in nanning based on swmm. Environ. Eng. 2019, 37, 102–109. [Google Scholar]
- Peng, S.; Hu, A.; Shi, J.; Li, C.; Liu, K.; Wu, J.; Li, M.; Lu, M. Reflection on the sponge city monitoring and evaluation in Shenzhen. J. Shenzhen Univ. Sci. Eng. 2021, 38, 1–9. [Google Scholar]
- Wu, Y.; Kong, L.; Ren, X.; Huang, H.; Zhang, M.; Ge, Y.; Tang, W. Exploration on a planning and implementation method of reaching the sponge city performance standard at catchment level: Taking a catchment in national pilot area of Shenzhen as an example. J. Shenzhen Univ. Sci. Eng. 2021, 38, 10–19. [Google Scholar]
- Liang, X.; Liang, Y.; Chen, C.; Meine Pieter van, D. Implementing Water Policies in China: A Policy Cycle Analysis of the Sponge City Program Using Two Case Studies. Sustainability 2020, 12, 5261. [Google Scholar] [CrossRef]
- Fan, X.; Matsumoto, T. GIS-Based Social Cost–Benefit Analysis on Integrated Urban Water Management in China: A Case Study of Sponge City in Harbin. Sustainability 2019, 11, 5527. [Google Scholar] [CrossRef]
- MOF; MHURD; MWR. The Notice on Carrying out Sponge City Construction Pilot with Central Financial Support; Finance, M.O., Ed.; Ministry of Finance Office: Beijing, China, 2014; p. 2.
- MHURD. Assessment Standard for Sponge City Construction Effect; Ministry of Housing and Urban-Rural Development: Beijing, China, 2018; Volume 343, p. 23, GB/T51345-2018.
- Wu, Y.; Qin, H. Why is China Building a “Sponge City”? Available online: http://politics.people.com.cn/n1/2019/1020/c429373-31409450.html (accessed on 13 March 2021).
- SSZD. Shenzhen Sponge City Pilot Performance Evaluation No. 1 in the Country. Available online: http://sz.people.com.cn/n2/2020/0716/c202846-34161181.html (accessed on 15 March 2021).
- MHURD. Notice on Carrying out the Annual Performance Evaluation Work of the Pilot Program of Sponge City Construction Supported by the Central Government; Ministry of Housing and Urban-Rural Development: Beijing, China, 2017; p. 9.
- MHURD. Notice on the Performance Evaluation of the Pilot Project for the Construction of Sponge Cities Supported by the Central Government; Ministry of Housing and Urban-Rural Development: Beijing, China, 2019; p. 11.
- Shi, P. Atlas of Natural Disaster Risk of China, 1st ed.; Science Press: Beijing, China, 2011; p. 244. [Google Scholar]
- Liu, K.; Nie, G.; Zhang, S. Study on the Spatiotemporal Evolution of Temperature and Precipitation in China from 1951 to 2018. Adv. Earth Sci. 2020, 35, 1113–1126. [Google Scholar]
- Zhao, H. Temporal and Spatial Variations and Transition of Precipitation in China during 1960–2010. Trop. Geogr. 2013, 33, 414–419. [Google Scholar]
- Wang, Y.; Cao, M.; Tao, B.; Li, K. The characteristics of spatio-temporal pattems in precipitation in China under the background of global climate change. Geogr. Res. 2006, 25, 1031–1040. [Google Scholar]
- Wu, J.; Xiong, K.; Luo, X. The Strategy of Establishing Mountainous Sponge City System, Chongqing. Planners 2019, 35, 65–71. [Google Scholar]
- Shi, P.; Guo, Y.; Liu, L. Exploration and Practice of Sponge City Construction Planning in Pudong New Area of Shanghai. China Water Wasterwater 2020, 36, 35–40. [Google Scholar]
- Wang, Z.-F. Research on Urban Water Logging Prophylaxis and Treatment in Ningbo; Zhejiang A&F University: Lin’an, China, 2019. [Google Scholar]
- Wang, J.; Zhao, X.; Xue, X.; Sun, F.; Yun, H. Research on Coordination and Unity among Sponge City Planning Engineering Systems: Take Nanning as an example. Water Wastewater Eng. 2019, 45, 72–76. [Google Scholar]
- CMFB. Measures for the Administration of Construction of Sponge City in Chongqing (Trial); Chongqing Municipal Finance Bureau: Chongqing, China, 2018; p. 4.
- CUPDI. Guidelines for Planning and Design of Sponge City in Nanning City; People’s Government of Nanning Municipality: Nanning, China, 2015; p. 69.
- NHURDC. Ningbo Urban Planning & Design Guideline for Sponge City. In Local Rules for Engineering Construction in Ningbo City; Ningbo Housing and Urban-Rural Development Committee: Ningbo, China, 2017; Volume DX-13, p. 72. [Google Scholar]
- PNRBSM. Key Points and Review Rules of Shenzhen Sponge City Planning; Planning and Natural Resources Bureau of Shenzhen Municipality: Shenzhen, China, 2016; p. 95.
- SMEDI. Technical Specification for Construction of Sponge City; Tongji University Press: Shanghai, China, 2019; Volume DG/TJ08-2298-2019, p. 47. [Google Scholar]
- WCPRI. Wuhan City Sponge City Planning and Design Guidelines (Trial); Wuhan City Water Authority: Wuhan, China; Wuhan Land Resource and Planning Bureau: Wuhan, China; Wuhan Urban and Rural Construction Committee: Wuhan, China; Wuhan Garden and Forestry Bureau: Wuhan, China, 2015; p. 60. [Google Scholar]
- OSGeo Mean Annual Precipitation of China. Available online: https://www.osgeo.cn/map/m0402 (accessed on 18 March 2021).
- SMEDI. Technical Guidelines for Shanghai Sponge City Construction (Trial); Shanghai Municipal Engineering Design Institute (Group) Co., Ltd.: Shanghai, China, 2016; p. 74. [Google Scholar]
- WURCC. Implementation Plan for the Pilot Work of Sponge City Construction in Wuhan; The Government of Wuhan: Wuhan, China, 2016; Volume 31, p. 9.
- NMG. Interim Measures for the Planning and Construction Management of Sponge City in Nanning City; Nanning Municipal Government: Nanning, China, 2018; p. 2.
- UPDIS. Special Planning and Implementation Plan for Shenzhen Sponge City Construction; Planning and Natural Resources Bureau of Shenzhen Municipality: Shenzhen, China, 2016; p. 56.
- UPDIS. Special Planning and Implementation Plan for Shenzhen Sponge City Construction; Planning and Natural Resources Bureau of Shenzhen Municipality: Shenzhen, China, 2019; p. 60.
- Liu, F. Research on Planning Strategies of “Water city” in the North Region in the Perspective of Ecological Infrastructure—A Case Study of the Concept Planning of Xinan; Engineering Chongqing University: Chongqing, China, 2015. [Google Scholar]
- Shao, X.; Fang, Y.; Jawitz, J.W.; Yan, J.; Cui, B. River network connectivity and fish diversity. Sci. Total Environ. 2019, 689, 21–30. [Google Scholar] [CrossRef]
- Xu, J. Mathematical Methods in Contemporary Geography, 3rd ed.; Higher Education Press: Beijing, China, 2017. [Google Scholar]
- Xia, J.; Chen, Y.; Zhou, Z.; Zhang, Q.; Peng, S.; Wang, J.; Yu, G. Review of mechanism and quantifying methods of river system connectivity. Adv. Water Sci. 2017, 28, 780–787. [Google Scholar]
- Yang, D. The Study on Sponge Effect of River Network in Built Environment; Southeast University: Nanjing, China, 2017. [Google Scholar]
- GOPGF. Interim Measures for the Planning and Construction Management of Sponge City Construction Projects in Fuzhou City; GOPGF: Fuzhou, China, 2017; p. 9. [Google Scholar]
- Li, J.; Mu, C.; Deng, C.; Ma, M. Hydrologic-environmental effects of sponge city under different spatial scales. J. Water Reuse Desalination 2020, 10, 45–56. [Google Scholar] [CrossRef]
- MOHURD. Code for Design of Outdoor Wastewater Engineering; MOHURD: Beijing, China, 2016; Volume GB 50014-2006, p. 98.
- He, B.-J.; Zhu, J.; Zhao, D.-X.; Gou, Z.-H.; Qi, J.-D.; Wang, J. Co-benefits approach: Opportunities for implementing sponge city and urban heat island mitigation. Land Use Policy 2019, 86, 147–157. [Google Scholar] [CrossRef]
- Yin, D.; Chen, Y.; Jia, H.; Wang, Q.; Chen, Z.; Xu, C.; Li, Q.; Wang, W.; Yang, Y.; Fu, G.; et al. Sponge city practice in China: A review of construction, assessment, operational and maintenance. J. Clean. Prod. 2021, 280, 124963. [Google Scholar] [CrossRef]
- Zhang, C.; He, M.; Zhang, Y. Urban Sustainable Development Based on the Framework of Sponge City: 71 Case Studies in China. Sustainability 2019, 11, 1544. [Google Scholar] [CrossRef]
- Ding, N.; Hu, A.-b.; Ren, X.-x.; Yang, C. Discussion on Issues of Reclaimed Water Utilization Planning in Shenzhen City. China Water Wastewater 2014, 30, 30–33. [Google Scholar]
- Li, X.; Sha, J.H.; Yan, J.J.; Zhang, G.F. The Environmental and Economic Impact of Reclaimed Water Utilization in Beijng-Based on the Dynamic Optimal Simulation Method. Adv. Mater. Res. 2015, 1073–1076, 579–583. [Google Scholar] [CrossRef]
- Zhang, J.K.; Jiang, Y.; Zou, L. The Project Design of Seasonal Reclaimed Water Utilization System for Liaobin Water Town. Adv. Mater. Res. 2011, 243–249, 4766–4770. [Google Scholar] [CrossRef]
- Li, J. Research on Rational Utilization of Urban Water Resources Based on Sponge City Theory-Making Comparison between China and Singapore. Iop Conf. Ser. Earth Environ. Sci. 2019, 237, 032056. [Google Scholar] [CrossRef]
- Chen, A.; Sui, X.; Liao, W.; Chen, K. Review study on instream ecological base flow in China. J. China Inst. Water Resour. Hydropower Res. 2016, 14, 401–411. [Google Scholar]
- Liu, H.; Jia, Y.; Niu, C. “Sponge city” concept helps solve China’s urban water problems. Environ. Earth Sci. 2017, 76, 1–5. [Google Scholar] [CrossRef]
- Yue, L.; Yuan, F.; Wu, H. Application of Linear Drainage Ditch in Sponge City Construction. Munic. Eng. Technol. 2019, 37, 126–128. [Google Scholar]
- Schueler, T.R. Controlling Urban Runoff: A Practical Manual for Planning and Designing Urban BMPs; Metropolitan Washington Council of Governments: Washington, DC, USA, 1987. [Google Scholar]
- Wu, F.-C.; Shen, H.W.; Chou, Y.-J. Variation of Roughness Coefficients for Unsubmerged and Submerged Vegetation. J. Hydraul. Eng. 1999, 125, 934–942. [Google Scholar] [CrossRef]
- PUB. Active, Beautiful, Clean Waters Design Guidelines, 4th ed.; In Public Utilities Board: Singapore, 2018; p. 108.
- Jorsaraei, A.; Gougol, M.; Van Lier, J.B. A cost effective method for decentralized sewage treatment. Process. Saf. Environ. Prot. 2014, 92, 815–821. [Google Scholar] [CrossRef]
- Li, C.; Peng, C.; Bu, J.; Wang, X.; Cai, Y.; Li, H. Advance in Methods and Applications of Rational Water Surface Ratio. J. North. China Univ. Water Resour. Electr. Power (Nat. Sci. Ed.) 2019, 40, 39–45. [Google Scholar]
- Han, H.-L.; Jing, Y.-X.; Yang, D.-J.; Xiao, L.; Li, G.-L.; Zhan, C.-G.; Wang, A.-l.; Sun, R.-Y. Microclimate regulation and airborne bacteria purification services of reservoir ecosystem: A case study of Merlin Reservoir and Xili Reservoir in Shenzhen. Acta Ecol. Sin. 2008, 28, 3553–3562. [Google Scholar]
- Mao, X.; Huang, L.; Huang, Y.; Liu, X. Assessment on impacts of Guanlan River comprehensive treatment in Shenzhen City to river health. Water Resour. Prot. 2015, 31, 80–85. [Google Scholar]
- Hooke, J.; Chen, H. Evidence of increase in woody vegetation in a river corridor, Northwest England, 1984–2007. J. Maps 2016, 12, 484–491. [Google Scholar] [CrossRef]
- Oldfield, E.E.; Felson, A.J.; Auyeung, D.S.N.; Crowther, T.W.; Sonti, N.F.; Harada, Y.; Maynard, D.S.; Sokol, N.W.; Ashton, M.S.; Warren, R.J.; et al. Growing the urban forest: Tree performance in response to biotic and abiotic land management. Restor. Ecol. 2015, 23, 707–718. [Google Scholar] [CrossRef]
- Beck, J.J.; Hernández, D.L.; Pasari, J.R.; Zavaleta, E.S. Grazing maintains native plant diversity and promotes community stability in an annual grassland. Ecol. Appl. 2015, 25, 1259–1270. [Google Scholar] [CrossRef] [PubMed]
- Krawczyk, R. Small-scale spatial analysis of river corridor plants distribution in the San River valley (SE Poland). Biodivers. Res. Conserv. 2014, 34, 53–64. [Google Scholar] [CrossRef]
- Schirmer, M.; Luster, J.; Linde, N.; Perona, P.; Mitchell, E.A.D.; Barry, D.A.; Hollender, J.; Cirpka, O.A.; Schneider, P.; Vogt, T.; et al. Morphological, hydrological, biogeochemical and ecological changes and challenges in river restoration—the Thur River case study. Hydrol. Earth Syst. Sci. 2014, 18, 2449–2462. [Google Scholar] [CrossRef]
- Degefu, F.; Lakew, A.; Tigabu, Y.; Teshome, K. The water quality degradation of upper Awash River, Ethiopia. Ethiop. J. Environ. Stud. Manag. 2013, 6, 58. [Google Scholar] [CrossRef]
- Wilhm, J.L. Use of Biomass Units in Shannon’s Formula. Ecology 1968, 49, 153–156. [Google Scholar] [CrossRef]
- Wang, J.; Jiao, Y.; Ren, Y.; Xue, Y.; Ji, Y.; Xu, B. Comparative study on two computing methods for estimating Shannon-Wiener diversity index. J. Fish. China 2015, 39, 1257–1263. [Google Scholar]
- Luo, X.; Sun, K.; Yang, J.; Song, W.; Cui, W. A comparison of the applicability of the Shannon-Wiener index, AMBI and M-AMBI indices for assessing benthic habitat health in the Huanghe (Yellow River) Estuary and adjacent areas. Acta Oceanol. Sin. 2016, 35, 50–58. [Google Scholar] [CrossRef]
- Kartikasari, D.; Retnaningdyah, C.; Arisoesilaningsih, E. Application of water quality and ecology indices of benthic macroinvertebrate to evaluate water quality of tertiary irrigation in malang district. J. Trop. Life Sci. 2013, 3, 193–201. [Google Scholar] [CrossRef]
- White, M.; Smith, A.; Humphryes, K.; Pahl, S.; Snelling, D.; Depledge, M. Blue space: The importance of water for preference, affect, and restorativeness ratings of natural and built scenes. J. Environ. Psychol. 2010, 30, 482–493. [Google Scholar] [CrossRef]
- Germundsson, T.; Howard, P.; Olwig, K.R. Introduction: Reassessing Landscape Drivers and the Globalist Environmental Agenda. Landsc. Res. 2011, 36, 395–399. [Google Scholar] [CrossRef]
- Mell, I.C.; Henneberry, J.; Hehl-Lange, S.; Keskin, B. Promoting urban greening: Valuing the development of green infrastructure investments in the urban core of Manchester, UK. Urban. For. Urban. Green. 2013, 12, 296–306. [Google Scholar] [CrossRef]
- Liu, W.; Chen, W.; Feng, Q.; Peng, C.; Kang, P. Cost-Benefit Analysis of Green Infrastructures on Community Stormwater Reduction and Utilization: A Case of Beijing, China. Environ. Manag. 2016, 58, 1015–1026. [Google Scholar] [CrossRef]
- Browning, W.; Ryan, C.; Clancy, J. 14 Patterns of Biophilic Design; Terrapin Bright Green LLC: New York, NY, USA, 2014; p. 62. [Google Scholar]
- Xue, F.; Lau, S.S.; Gou, Z.; Song, Y.; Jiang, B. Incorporating biophilia into green building rating tools for promoting health and wellbeing. Environ. Impact Assess. Rev. 2019, 76, 98–112. [Google Scholar] [CrossRef]
- Hartig, T.; Kahn, P.H. Living in cities, naturally. Science 2016, 352, 938–940. [Google Scholar] [CrossRef]
- Bai, Y.; Ping, W.-C.V.; Shen, L.D.; Chen, X. Sustainable Transportation Systems—Plan, Design, Build, Manage, and Maintain; American Society of Civil Engineers (ASCE): Reston, VA, USA, 2012. [Google Scholar]
- Guo, Q.; Dai, W.-Y.; Su, M.-L.; Jiang, H.-W. Construction Land Expansion and Its Impact on Ecological Land Use in Rapid Urbanization Area-A Case Study in Jinjiang City of Fujian Province. J. Fujian Teach. Univ. Nat. Sci. 2015, 31, 91–98. [Google Scholar]
- Okoli, C.; Pawlowski, S.D. The Delphi method as a research tool: An example, design considerations and applications. Inf. Manag. 2004, 42, 15–29. [Google Scholar] [CrossRef]
- Duohui, Z. Analysis on Problems of Sponge Cities in China. In 2019 International Conference on Management Science and Industrial Economy (MSIE 2019), 2020; Atlantis Press: Beijing, China, 2020; pp. 33–37. [Google Scholar]
- Liu, J.-L.; Zhang, J.-L. Analysis of LID Design Strategy for Sponge City Construction in Urban Green Space of Chongqing. Landsc. Archit. 2016, 3, 35–44. [Google Scholar]
- Zhang, C.; Lv, Y.-P.; Deng, J.; Chen, T. Study on system and technologies for systematic and full-field promotion of sponge city construction in Shanghai. Environ. Eng. 2020, 38, 5–9. [Google Scholar]
- Zhang, J. Practice and thoughts on flood prevention and waterlogging alleviation management in Wuhan, Hubei province. China Flood Drought Manag. 2019, 29, 37–39. [Google Scholar]
- Zhang, W.; Wang, J.; Che, H.; Wang, C.; Zhang, C.; Shi, L.; Fan, J. Experience of sponge city master plan: A case study of Nanning city. City Plan. Rev. 2016, 40, 44–52. [Google Scholar]
- Qiu, B. The Connotation, Approach and Prospects of Sponge City (LID). Water Wastewater Eng. 2015, 41, 1–7. [Google Scholar]
- Xie, X.; Qin, S.; Gou, Z.; Yi, M. Engaging professionals in urban stormwater management: The case of China’s Sponge City. Build. Res. Inf. 2020, 48, 719–730. [Google Scholar] [CrossRef]
- Yan, F. Research on the connection between sponge city construction and basin comprehensive planning. Environ. Eng. 2020, 38, 21–25. [Google Scholar]


Publisher’s Note: MDPI stays neutral with regard to jurisdictional claims in published maps and institutional affiliations. |
© 2021 by the authors. Licensee MDPI, Basel, Switzerland. This article is an open access article distributed under the terms and conditions of the Creative Commons Attribution (CC BY) license (https://creativecommons.org/licenses/by/4.0/).