Understanding the Tourists’ Spatio-Temporal Behavior Using Open GPS Trajectory Data: A Case Study of Yuanmingyuan Park (Beijing, China)


Abstract
1. Introduction
2. Literature Review
2.1. Intra-Destination Tourism Flow
2.2. Intra-Attraction Tourist Behavior
3. Data and Methods
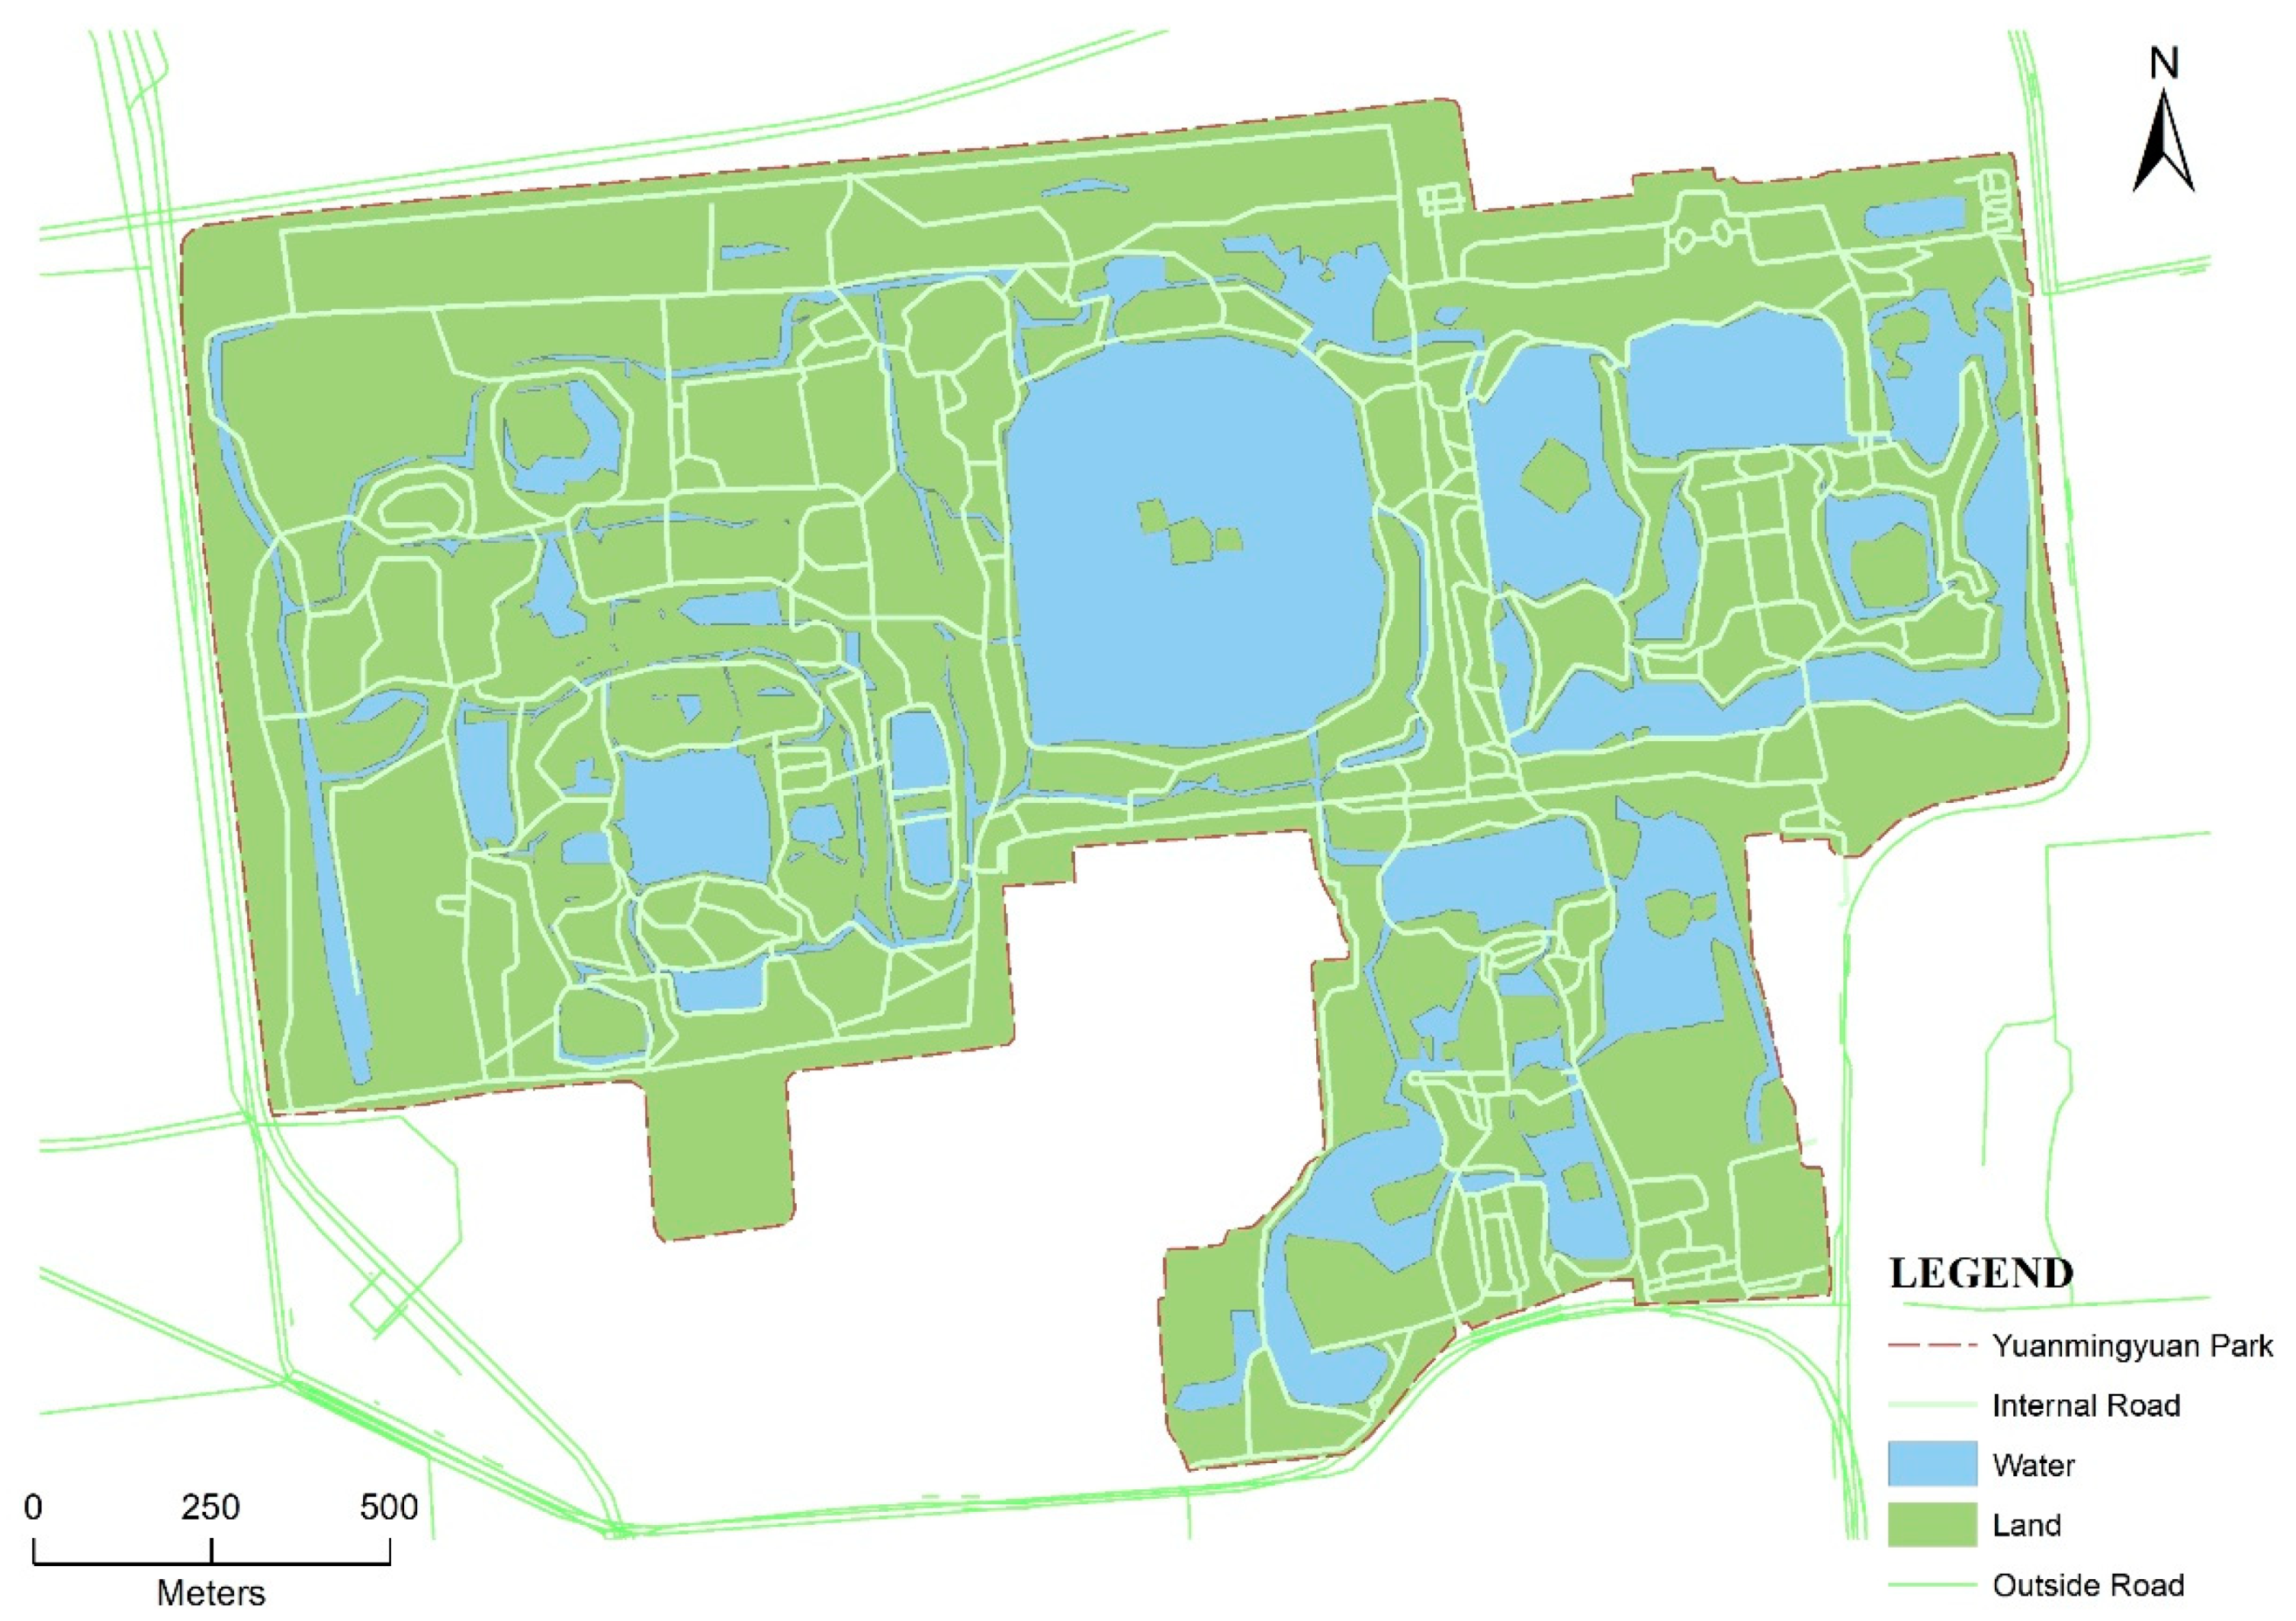
3.1. Study Area
3.2. Data
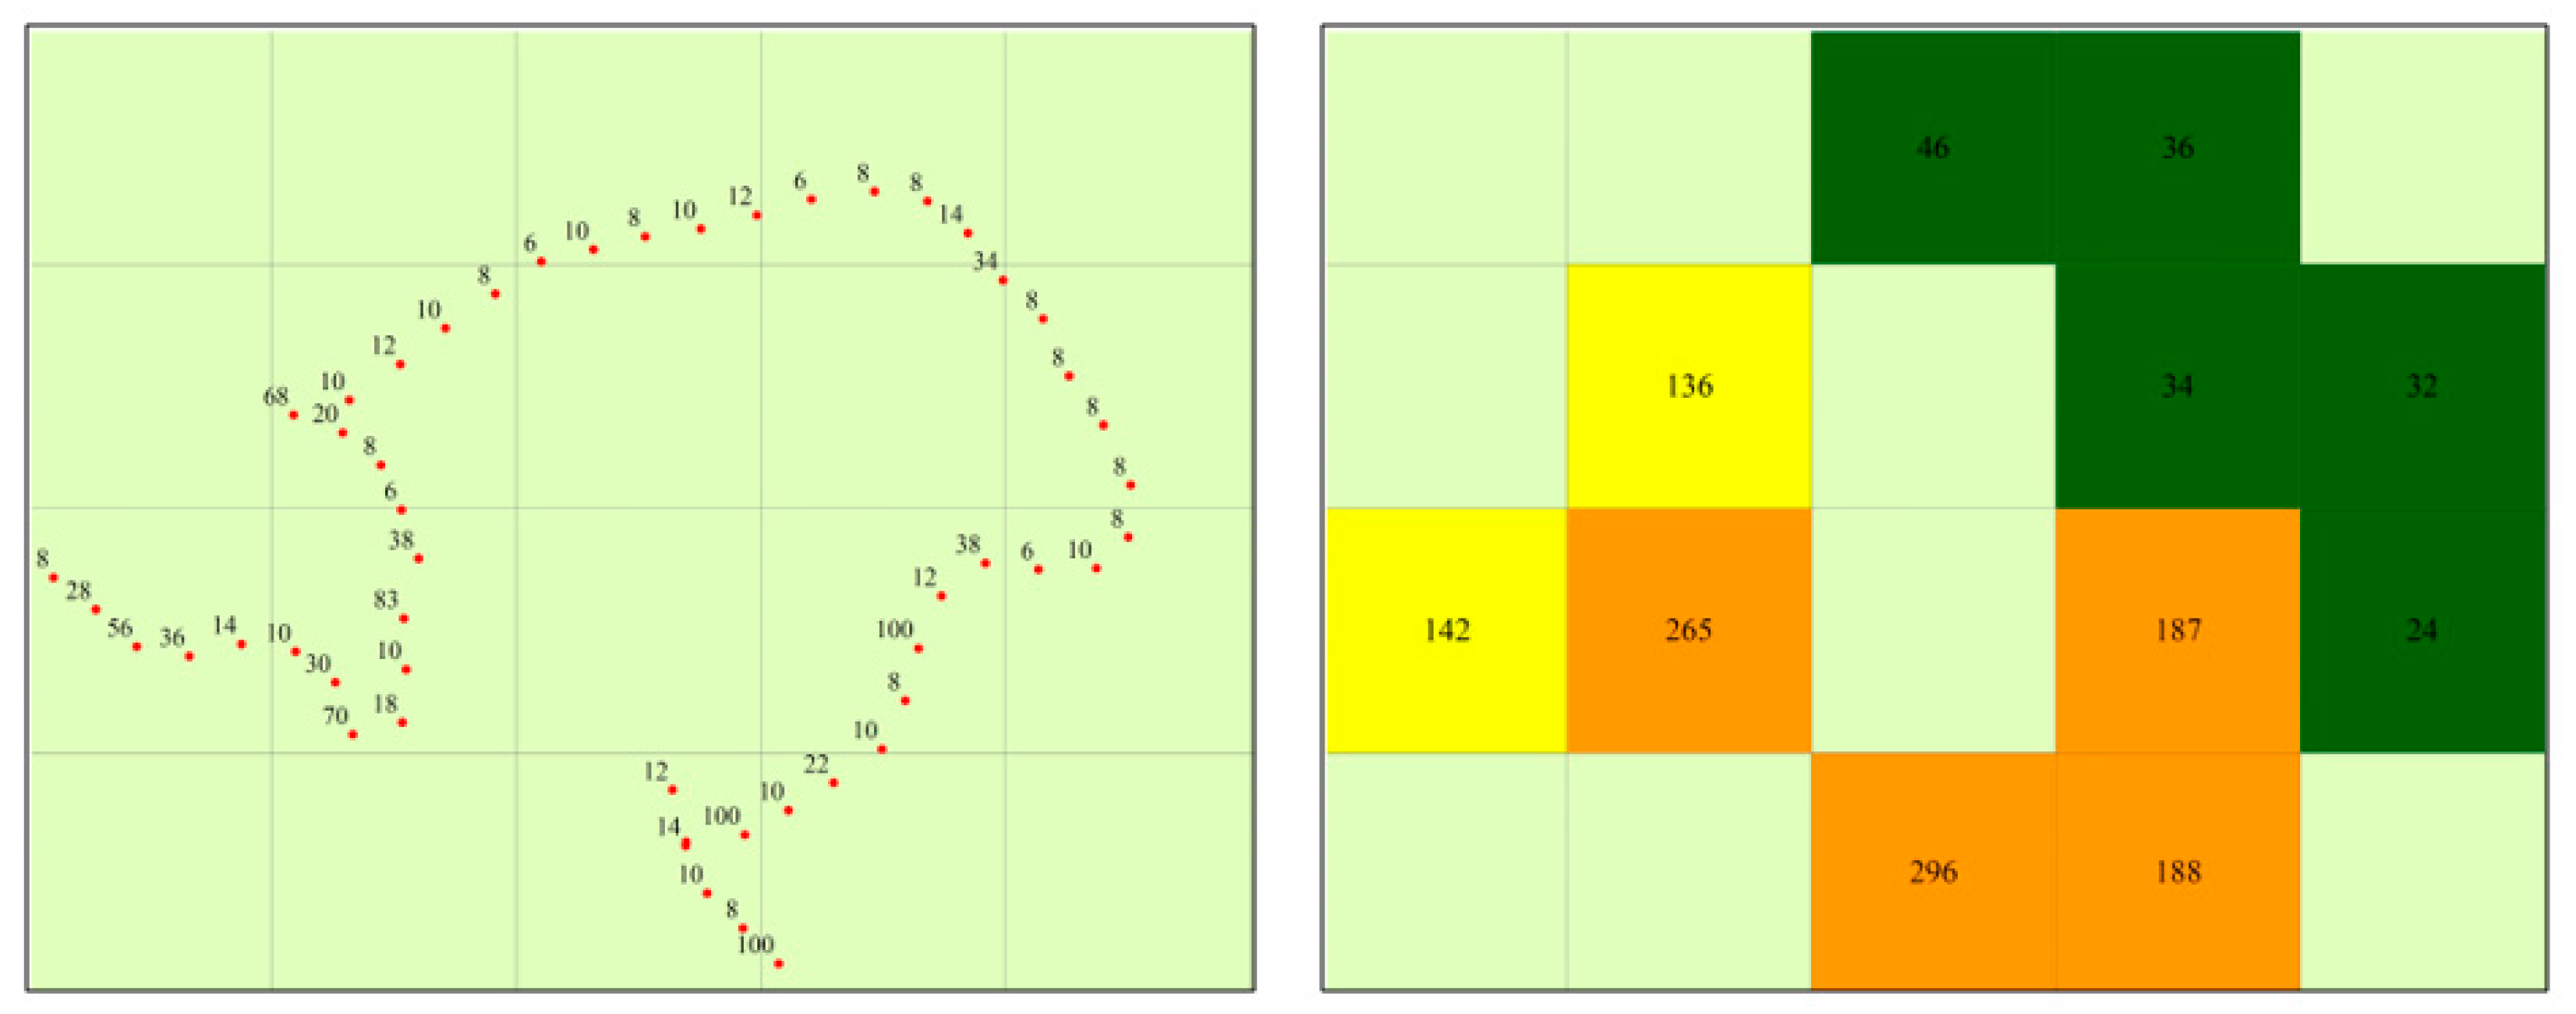
3.3. Data Analysis
4. Analysis and Findings
4.1. Spatio-Temporal Behavior Characteristics and Interrelationships
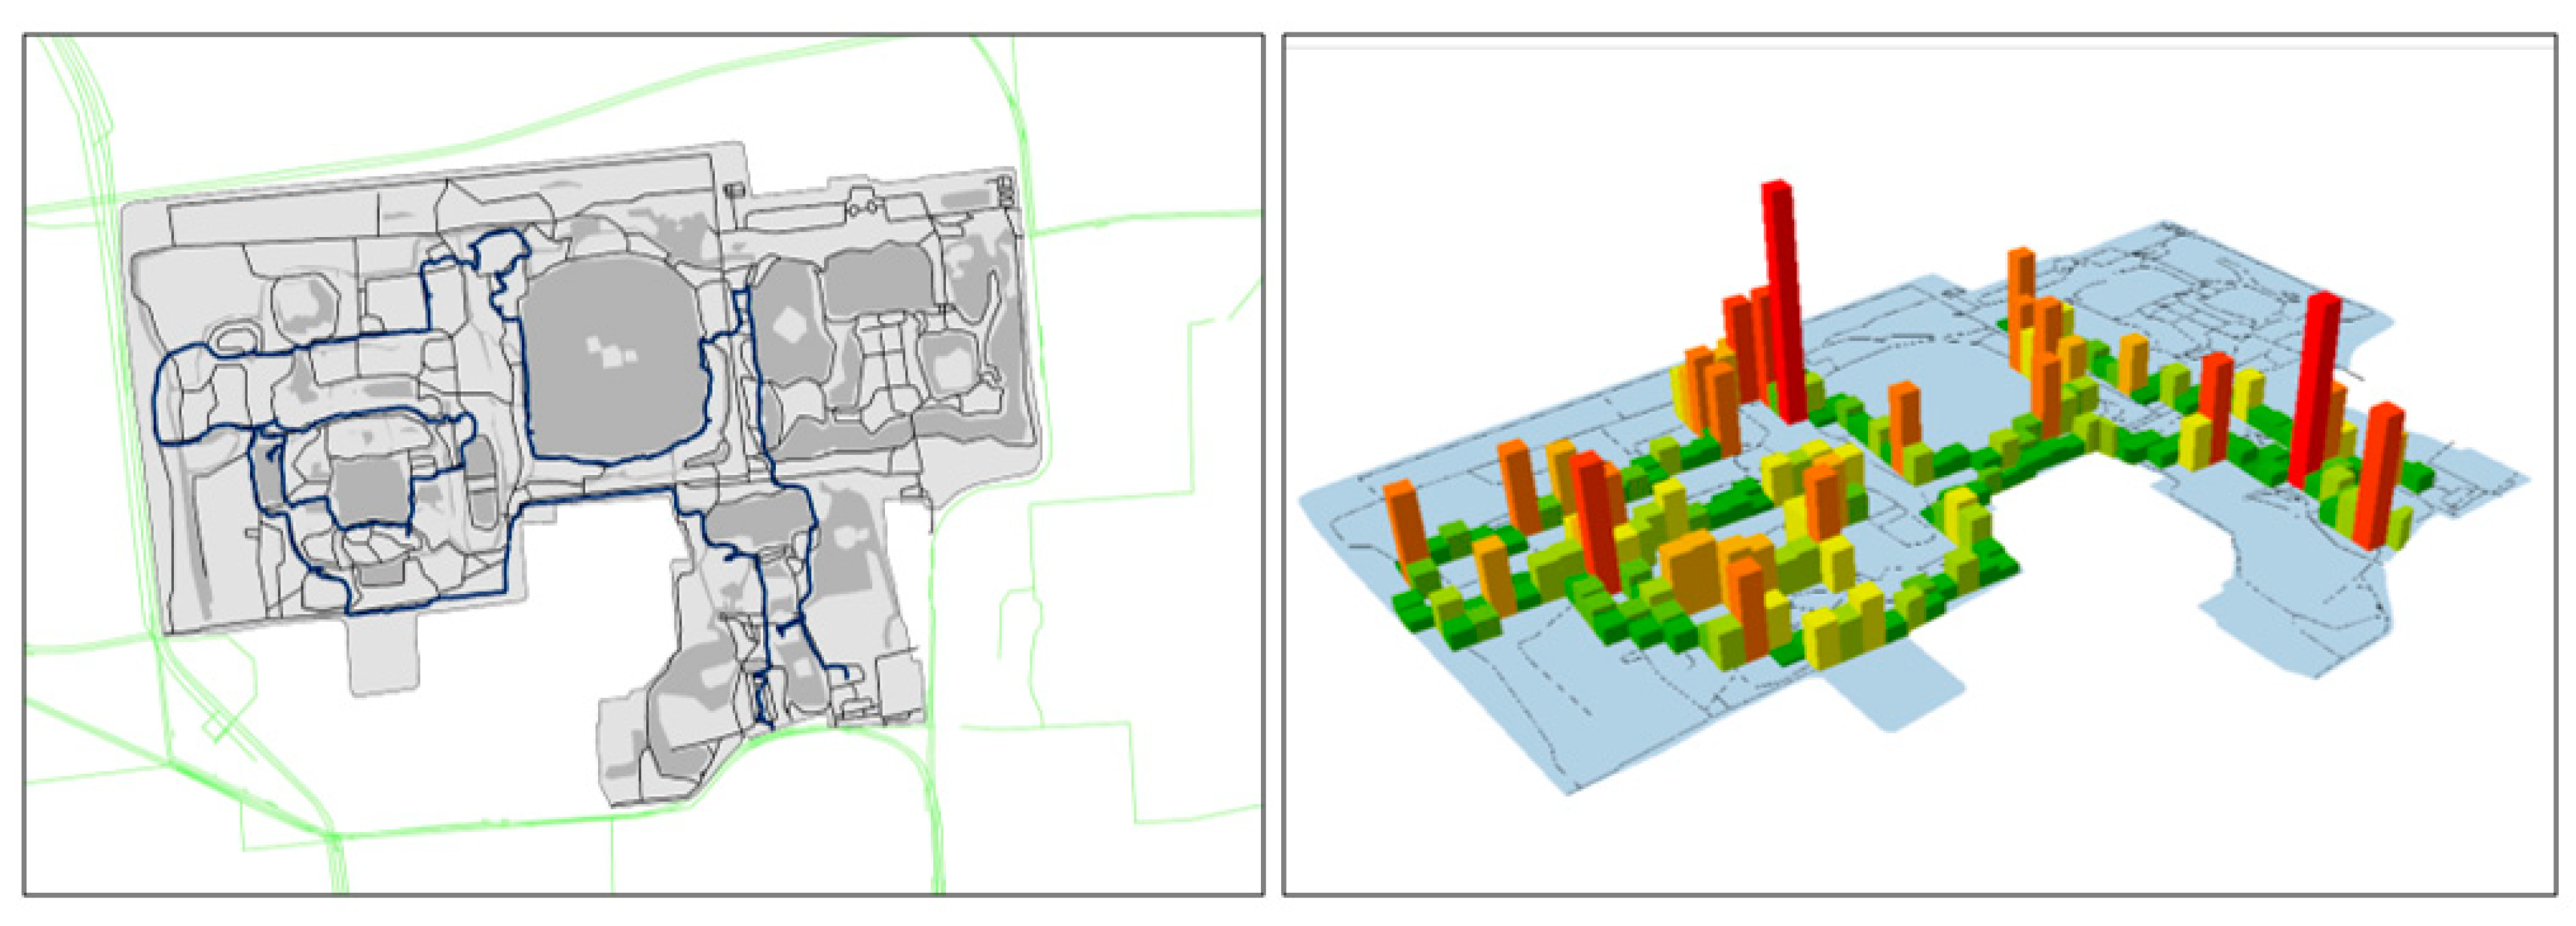
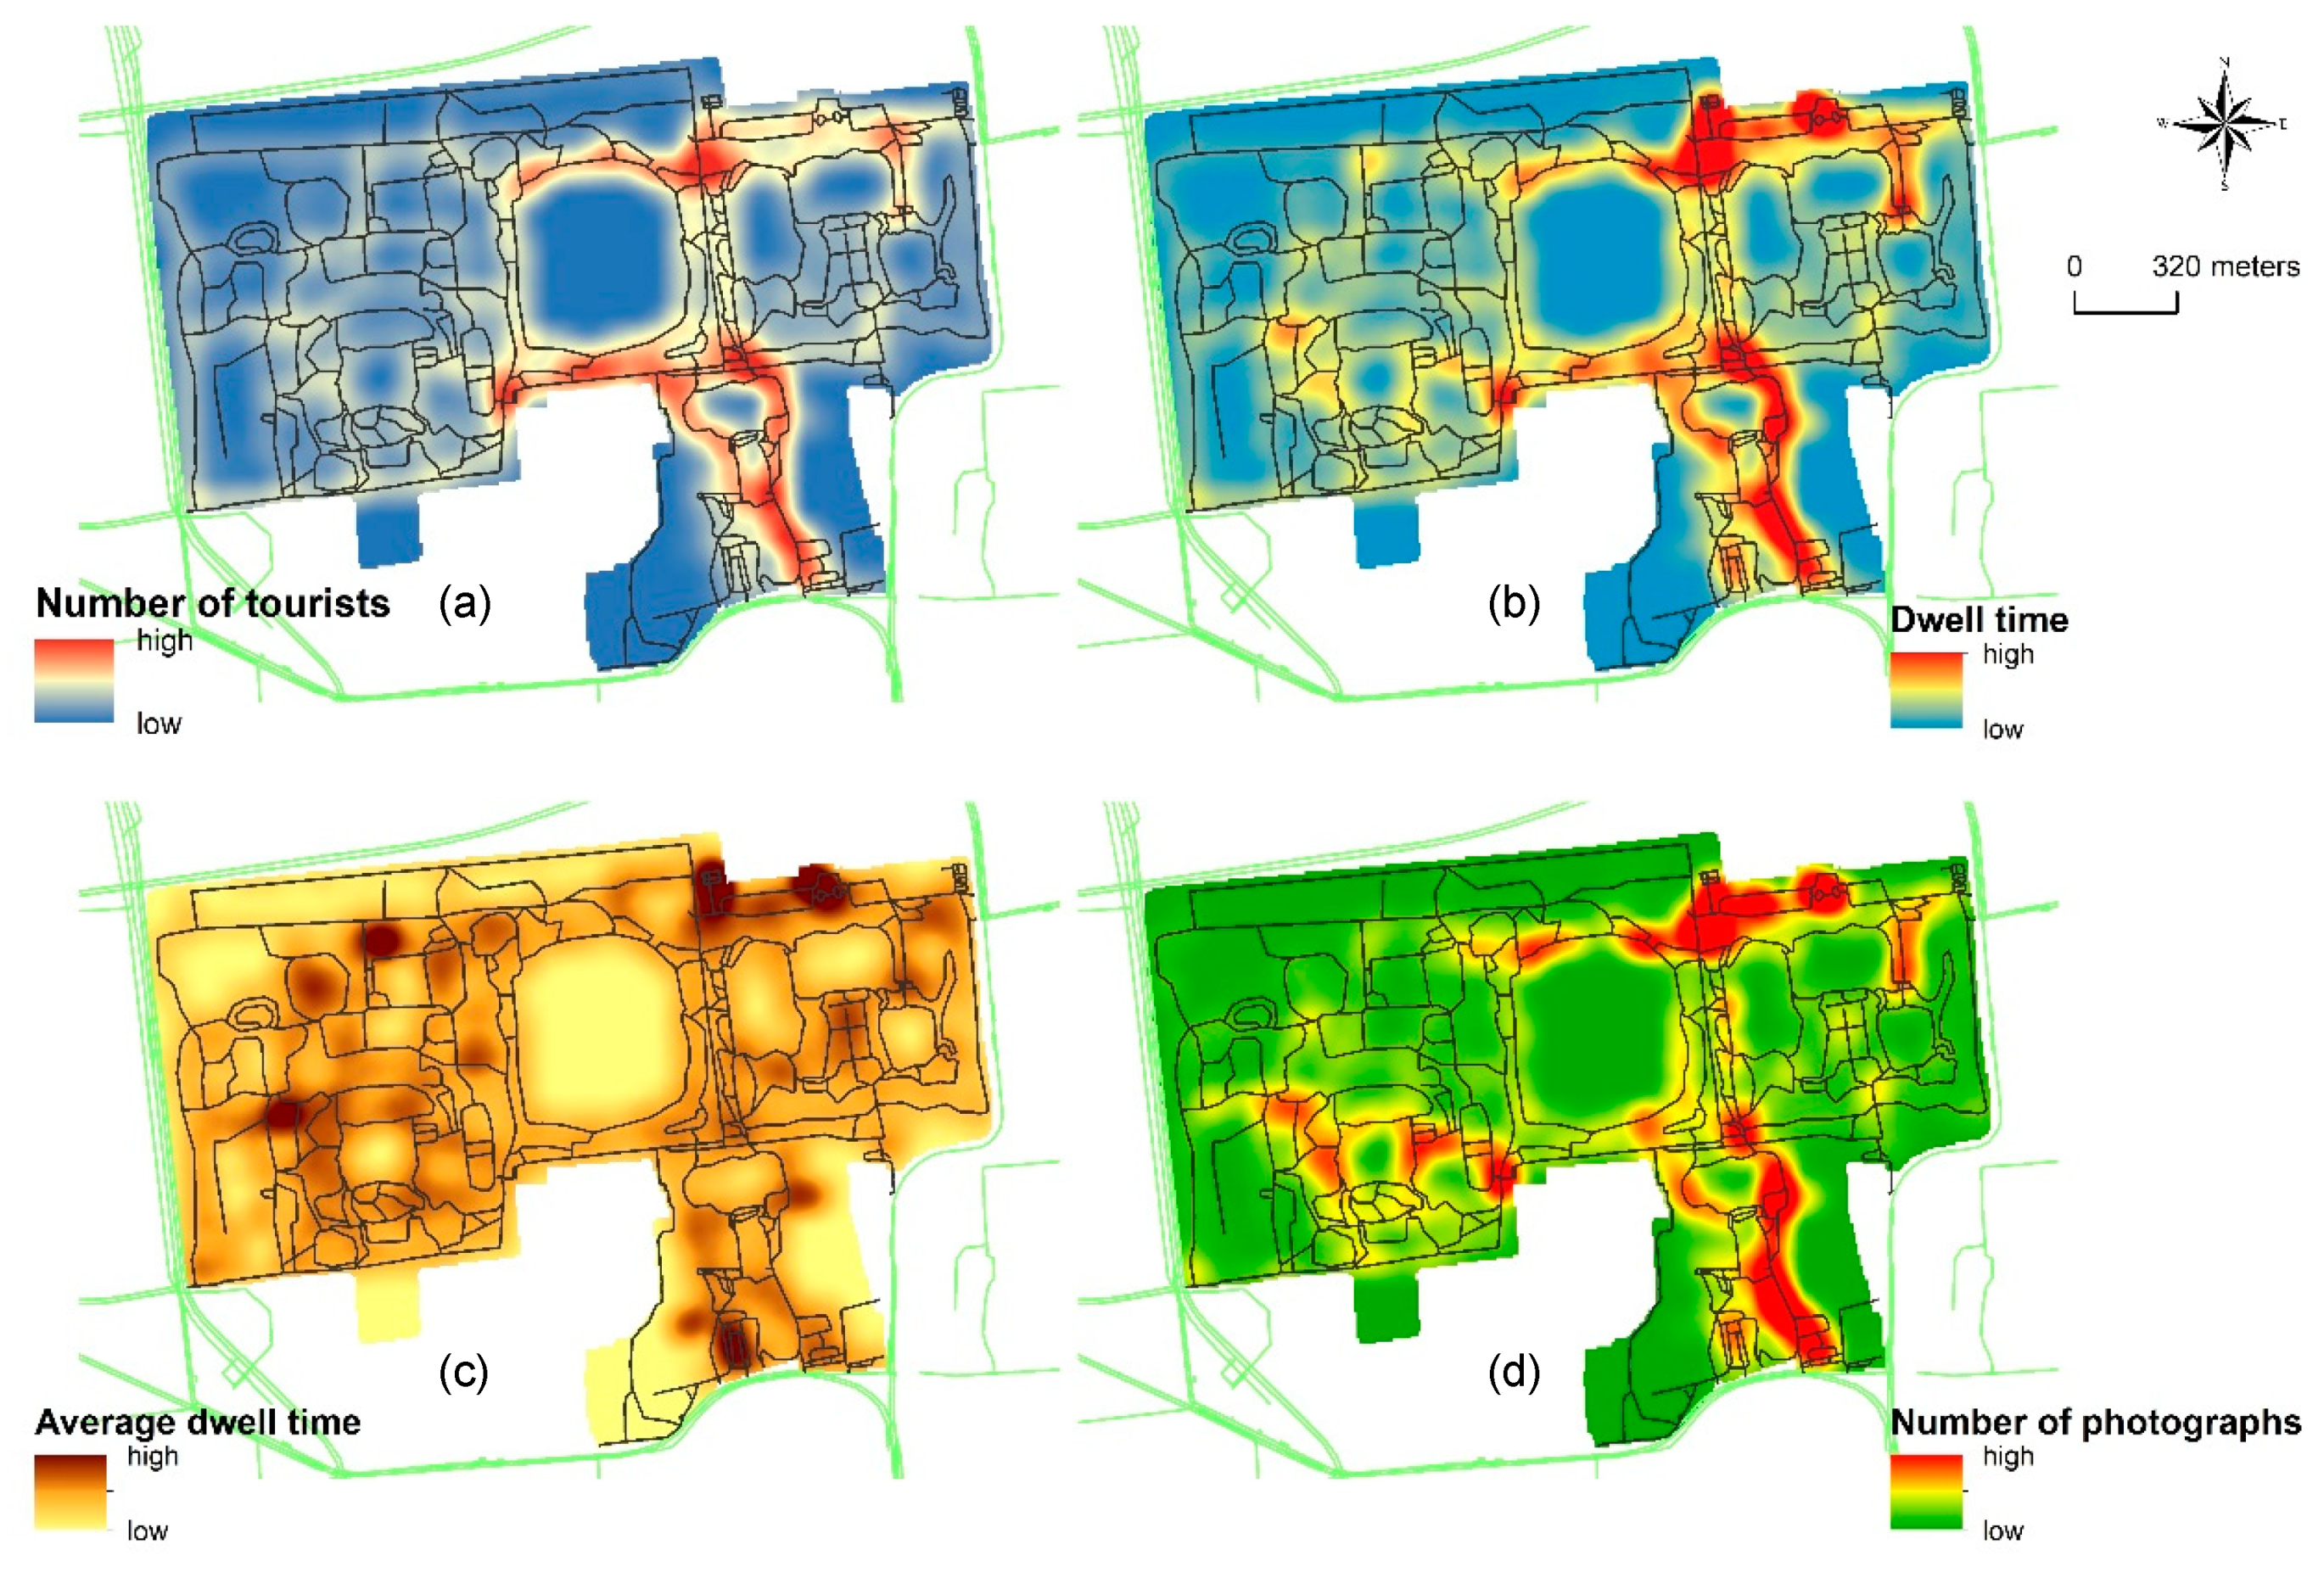
4.1.1. Tourist Visit Path
4.1.2. Tourist Dwell Time
4.1.3. Tourist Average Dwell Time
4.1.4. Number of Geo-Tagged Photographs
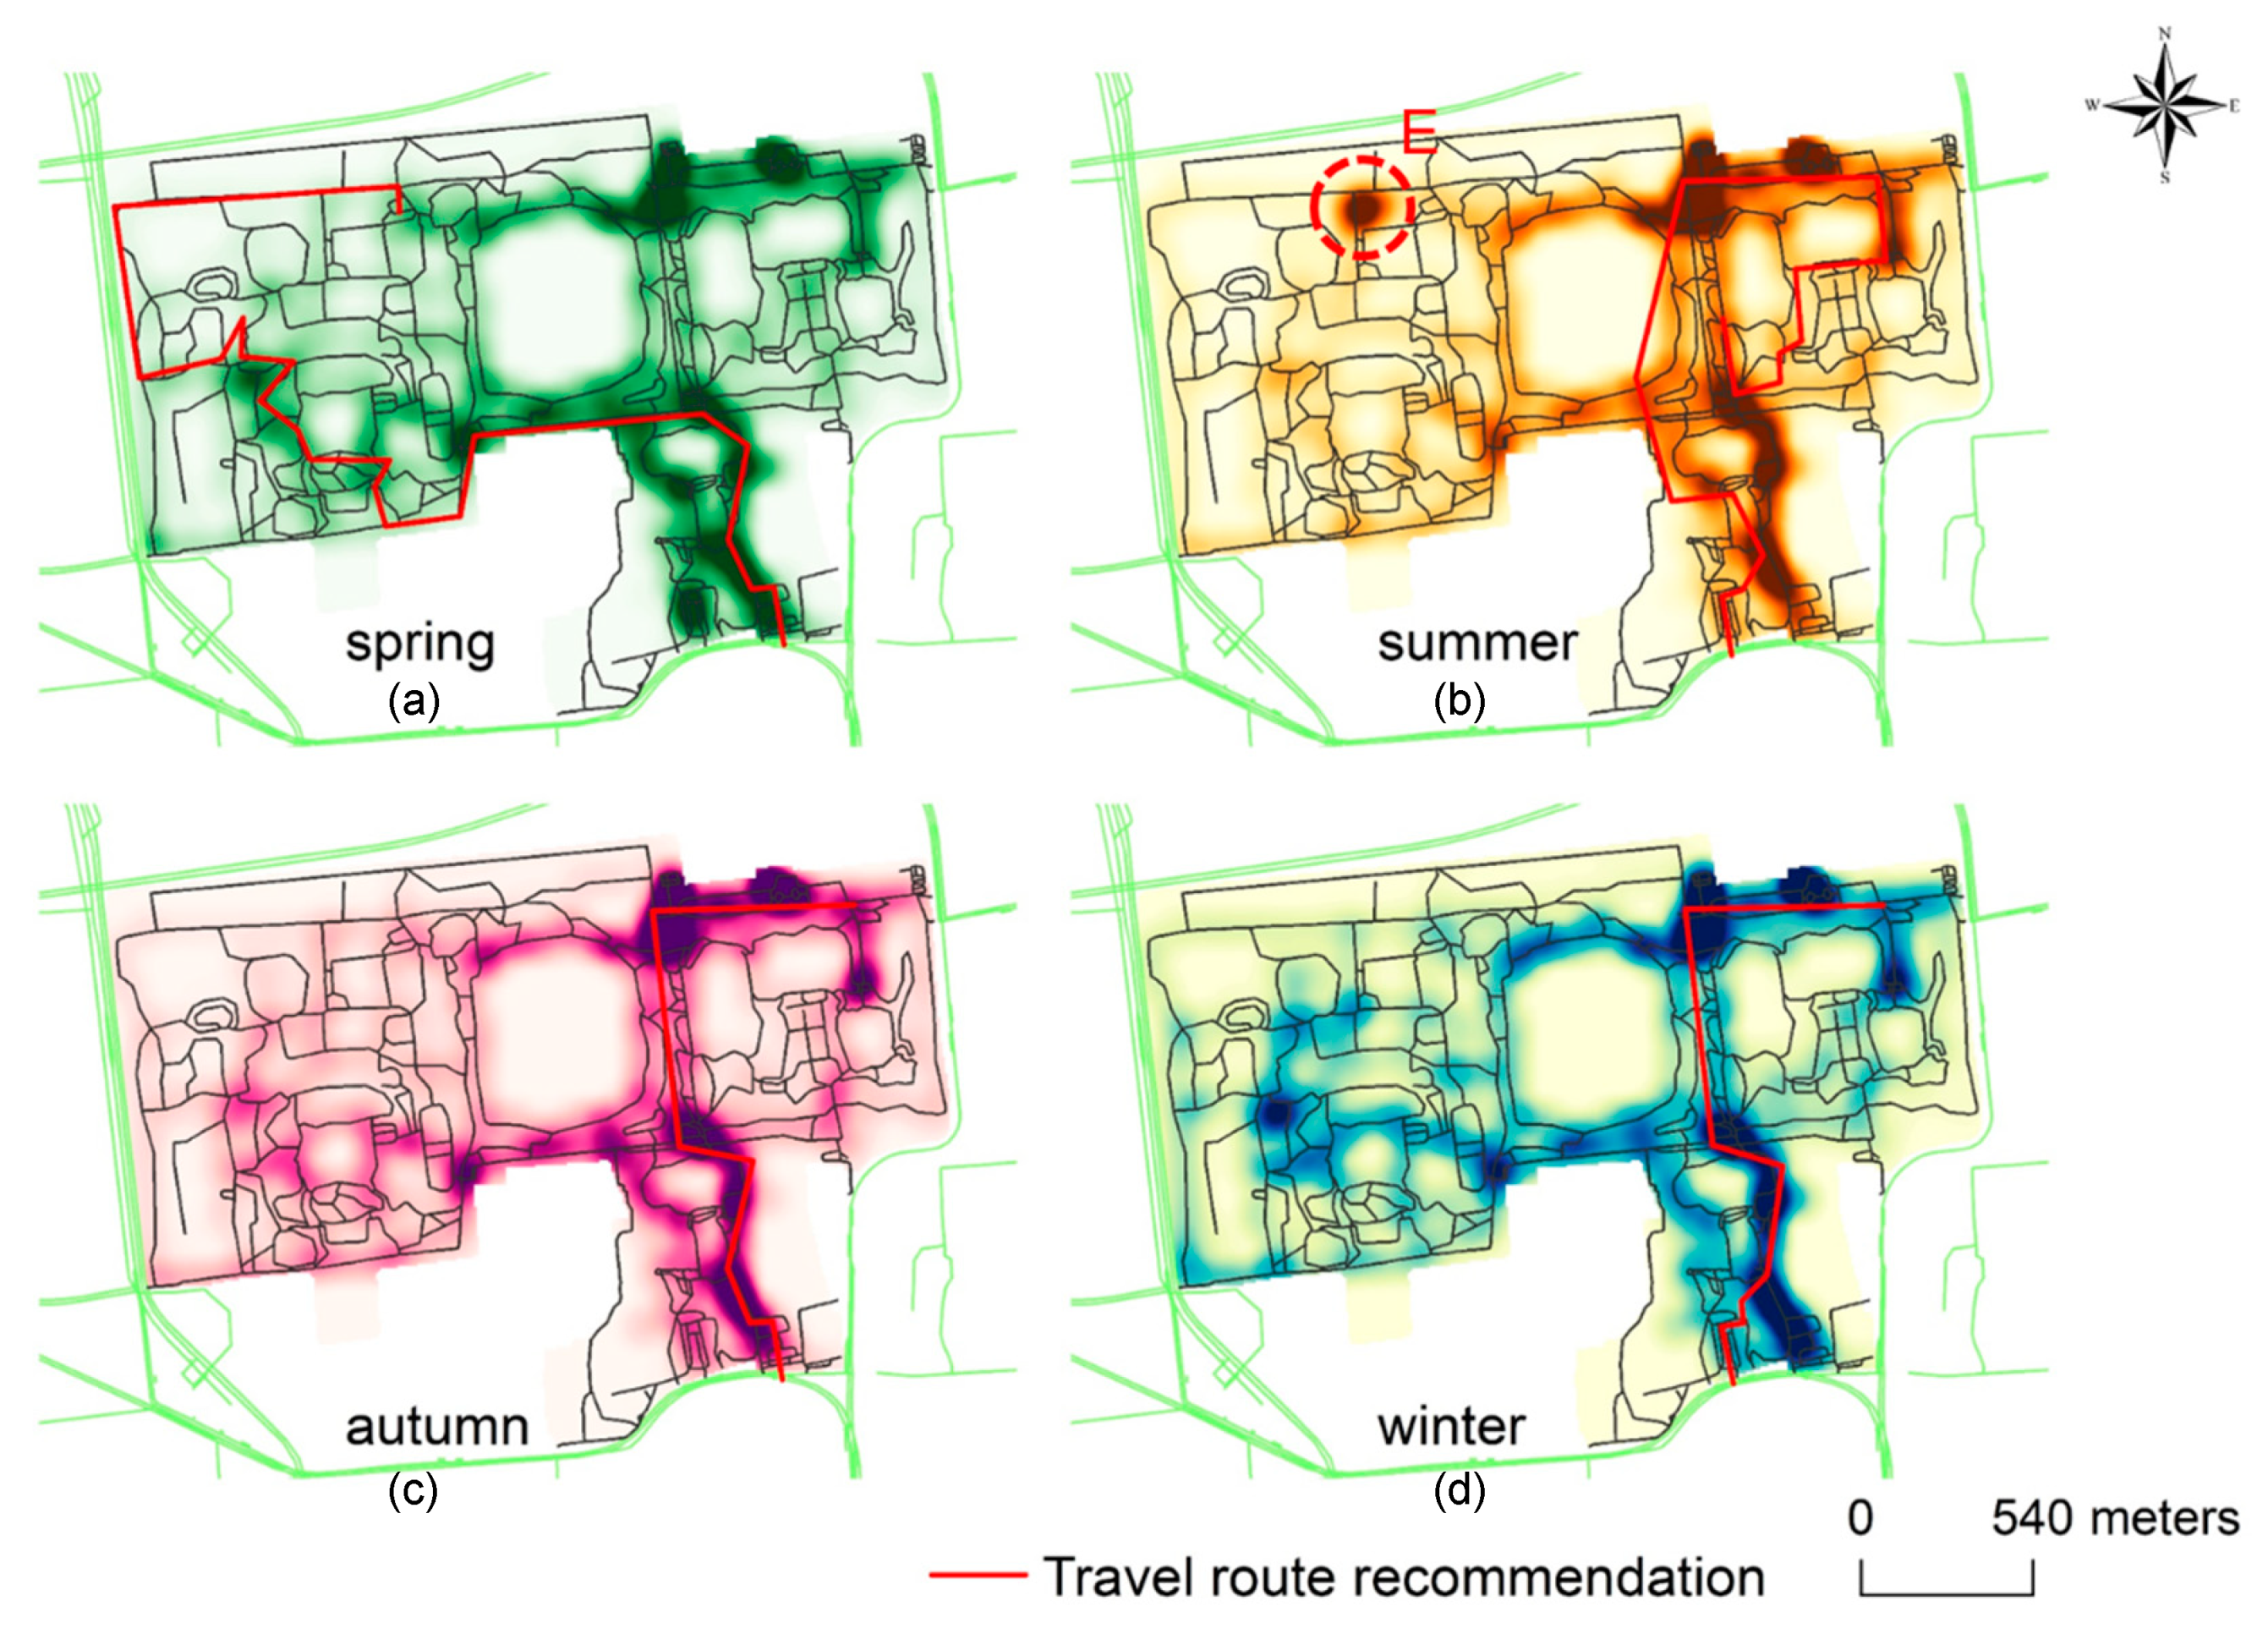
4.2. Tourists Behave Differently in Different Seasons
5. Conclusions and Future Research
5.1. Conclusions
5.2. Future Research
Author Contributions
Funding
Conflicts of Interest
References
- Edwards, D.; Griffin, T. Understanding tourists’ spatial behaviour: GPS tracking as an aid to sustainable destination management. J. Sustain. Tour. 2013, 21, 580–595. [Google Scholar] [CrossRef]
- Li, Y.; Xie, J.; Gao, X.; Law, A. A Method of selecting potential development regions based on GPS and social network models—from the perspective of tourist behavior. Asia Pac. J. Tour. Res. 2018, 1–17. [Google Scholar] [CrossRef]
- East, D.; Osborne, P.; Kemp, S.; Woodfine, T. Combining GPS & survey data improves understanding of visitor behaviour. Tour. Manag. 2017, 61, 307–320. [Google Scholar] [CrossRef]
- Huang, X.; Li, M.; Zhang, J.; Zhang, L.; Zhang, H.; Yan, S. Tourists’ spatial-temporal behavior patterns in theme parks: A case study of Ocean Park Hong Kong. J. Destin. Mark. Manag. 2020, 15, 100411. [Google Scholar] [CrossRef]
- Xiao-Ting, H.; Bi-Hu, W. Intra-attraction tourist spatial-temporal behaviour patterns. Tour. Geogr. 2012, 14, 625–645. [Google Scholar] [CrossRef]
- Hungenberg, E.; Gray, D.; Gould, J.; Stotlar, D. An examination of motives underlying active sport tourist behavior: A market segmentation approach. J. Sport Tour. 2016, 20, 81–101. [Google Scholar] [CrossRef]
- Johns, N.; Gyimóthy, S. Market segmentation and the prediction of tourist behavior: The case of Bornholm, Denmark. J. Travel Res. 2002, 40, 316–327. [Google Scholar] [CrossRef]
- Shi, B.; Zhao, J.; Chen, P. Exploring urban tourism crowding in Shanghai via crowdsourcing geospatial data. Curr. Issues Tour. 2017, 20, 1186–1209. [Google Scholar] [CrossRef]
- Shoval, N.; Isaacson, M. Tracking tourists in the digital age. Ann. Tour. Res. 2007, 34, 141–159. [Google Scholar] [CrossRef]
- De Cantis, S.; Ferrante, M.; Kahani, A.; Shoval, N. Cruise passengers’ behavior at the destination: Investigation using GPS technology. Tour. Manag. 2016, 52, 133–150. [Google Scholar] [CrossRef]
- Galí, N.; Aulet, S. Tourists’ space-time behavior in heritage places: Comparing guided and nonguided visitors. Int. J. Tour. Res. 2019, 21, 388–399. [Google Scholar] [CrossRef]
- Grinberger, A.Y.; Shoval, N.; McKercher, B. Typologies of tourists’ time–space consumption: A new approach using GPS data and GIS tools. Tour. Geogr. 2014, 16, 105–123. [Google Scholar] [CrossRef]
- McKercher, B.; Shoval, N.; Ng, E.; Birenboim, A. First and Repeat Visitor Behaviour: GPS Tracking and GIS Analysis in Hong Kong. Tour. Geogr. 2012, 14, 147–161. [Google Scholar] [CrossRef]
- Zheng, W.; Zhou, R.; Zhang, Z.; Zhong, Y.; Wang, S.; Wei, Z.; Ji, H. Understanding the tourist mobility using GPS: How similar are the tourists? Tour. Manag. 2019, 71, 54–66. [Google Scholar] [CrossRef]
- Sugimoto, K.; Ota, K.; Suzuki, S. Visitor Mobility and Spatial Structure in a Local Urban Tourism Destination: GPS Tracking and Network analysis. Sustainability 2019, 11, 919. [Google Scholar] [CrossRef]
- Li, J.; Xu, L.; Tang, L.; Wang, S.; Li, L. Big data in tourism research: A literature review. Tour. Manag. 2018, 68, 301–323. [Google Scholar] [CrossRef]
- Pantano, E.; Priporas, C.; Stylos, N. ‘You will like it!’ using open data to predict tourists’ response to a tourist attraction. Tour. Manag. 2017, 60, 430–438. [Google Scholar] [CrossRef]
- Lyu, F.; Zhang, L. Using multi-source big data to understand the factors affecting urban park use in Wuhan. Urban Forest. Urban Green. 2019, 43, 126367. [Google Scholar] [CrossRef]
- Liu, Y.; Teichert, T.; Rossi, M.; Li, H.; Hu, F. Big data for big insights: Investigating language-specific drivers of hotel satisfaction with 412,784 user-generated reviews. Tour. Manag. 2017, 59, 554–563. [Google Scholar] [CrossRef]
- Khan, M.S.; Woo, M.; Nam, K.; Chathoth, P.K. Smart city and smart tourism: A case of Dubai. Sustainability 2017, 9, 2279. [Google Scholar] [CrossRef]
- Zhang, K.; Chen, Y.; Li, C. Discovering the tourists’ behaviors and perceptions in a tourism destination by analyzing photos’ visual content with a computer deep learning model: The case of Beijing. Tour. Manag. 2019, 75, 595–608. [Google Scholar] [CrossRef]
- Luo, J.M.; Vu, H.Q.; Li, G.; Law, R. Tourist behavior analysis in gaming destinations based on venue check-in data. J. Travel Tour. Mark. 2018, 36, 107–118. [Google Scholar] [CrossRef]
- Mou, N.; Zheng, Y.; Makkonen, T.; Yang, T.; Tang, J.J.; Song, Y. Tourists’ digital footprint: The spatial patterns of tourist flows in Qingdao, China. Tour. Manag. 2020, 81, 104151. [Google Scholar] [CrossRef]
- Zhang, S.; Zhou, W. Recreational visits to urban parks and factors affecting park visits: Evidence from geotagged social media data. Landsc. Urban. Plan. 2018, 180, 27–35. [Google Scholar] [CrossRef]
- Yang, X.; Pan, B.; Evans, J.A.; Lv, B. Forecasting Chinese tourist volume with search engine data. Tour. Manag. 2015, 46, 386–397. [Google Scholar] [CrossRef]
- Peterson, B.A.; Perry, E.E.; Brownlee, M.T.J.; Sharp, R. The transient nature of concentrated use at a national park: A spatiotemporal investigation into visitor behavior. J. Outdoor Recreat. Tour. 2020, 31, 100310. [Google Scholar] [CrossRef]
- Beeco, J.A.; Hallo, J.C. GPS tracking of visitor use: Factors influencing visitor spatial behavior on a complex trail system. J. Park Recreat. Adm. 2014, 32, 43–61. [Google Scholar]
- Miah, S.J.; Vu, H.Q.; Gammack, J.; McGrath, M. A big data analytics method for tourist behaviour analysis. Inf. Manag. Amster. 2017, 54, 771–785. [Google Scholar] [CrossRef]
- Prebensen, N.K.; Foss, L. Coping and co-reating in tourist experiences. Int. J. Tour. Res. 2011, 13, 54–67. [Google Scholar] [CrossRef]
- Moss, A.; Francis, D.; Esson, M. The relationship between viewing area size and visitor behavior in an immersive Asian elephant exhibit. Visit. Stud. 2008, 11, 26–40. [Google Scholar] [CrossRef]
- Urry, J. The tourist gaze “revisited”. Am. Behav. Sci. 1992, 36, 172–186. [Google Scholar] [CrossRef]
- Shih, H. Network characteristics of drive tourism destinations: An application of network analysis in tourism. Tour. Manag. 2006, 27, 1029–1039. [Google Scholar] [CrossRef]
- Aranburu, I.; Plaza, B.; Esteban, M. Sustainable cultural tourism in urban destinations: Does space matter? Sustainability 2016, 8, 699. [Google Scholar] [CrossRef]
- Lew, A.; McKercher, B. Modeling tourist movements: A local destination analysis. Ann. Tour. Res. 2006, 33, 403–423. [Google Scholar] [CrossRef]
- Leung, X.Y.; Wang, F.; Wu, B.; Bai, B.; Stahura, K.A.; Xie, Z. A social network analysis of overseas tourist movement patterns in Beijing: The impact of the Olympic Games. Int. J. Tour. Res. 2012, 14, 469–484. [Google Scholar] [CrossRef]
- Liu, B.; Huang, S.S.; Fu, H. An application of network analysis on tourist attractions: The case of Xinjiang, China. Tour. Manag. 2017, 58, 132–141. [Google Scholar] [CrossRef]
- Mou, N.; Yuan, R.; Yang, T.; Zhang, H.; Tang, J.J.; Makkonen, T. Exploring spatio-temporal changes of city inbound tourism flow: The case of Shanghai, China. Tour. Manag. 2020, 76, 103955. [Google Scholar] [CrossRef]
- Li, Y.; Yang, L.; Shen, H.; Wu, Z. Modeling intra-destination travel behavior of tourists through spatio-temporal analysis. J. Destin. Mark. Manag. 2019, 11, 260–269. [Google Scholar] [CrossRef]
- Chrysanthi, A.; Earl, G.P.; Pagi, H. Visitor movement and tracking techniques. A visitor-sourced methodology for the interpretation of archaeological sites. Int. J. Herit. Digit. Era 2012, 1, 33–37. [Google Scholar] [CrossRef]
- Ferrante, M.; De Cantis, S.; Shoval, N. A general framework for collecting and analysing the tracking data of cruise passengers at the destination. Curr. Issues Tour. 2018, 21, 1426–1451. [Google Scholar] [CrossRef]
- McKercher, B.; Shoval, N.; Park, E.; Kahani, A. The [Limited] Impact of Weather on Tourist Behavior in an Urban Destination. J. Travel Res. 2014, 54, 442–455. [Google Scholar] [CrossRef]
- Birenboim, A.; Anton-Clavé, S.; Russo, A.P.; Shoval, N. Temporal Activity Patterns of Theme Park Visitors. Tour. Geogr. 2013, 15, 601–619. [Google Scholar] [CrossRef]
- Ingrid, Z.; Malin, Z. Emotions in motion: Tourist experiences in time and space. Curr. Issues Tour. 2012, 15. [Google Scholar] [CrossRef]
- XU, X.; Hu, J. Study on Spatiotemporal Behavior of Urban Park Tourists Based on GPS Data: A Case Study of Wuhan East Lake Scenic Area. Econ. Geogr. 2020, 40, 224–232. (In Chinese) [Google Scholar]


| Number | n | Longitude | Latitude | Dwell time | Distance/m | Time | Timestamp |
|---|---|---|---|---|---|---|---|
| 1 | 12 | 116.3064 | 39.99998 | 9 | 11 | 31 January 2018 13:51:18 | 1517377878 |
| 1 | 13 | 116.3065 | 40.00004 | 8 | 11 | 31 January 2018 13:51:26 | 1517377886 |
| 1 | 14 | 116.3064 | 39.99998 | 34 | 11 | 31 January 2018 13:52:00 | 1517377920 |
| 1 | 15 | 116.3063 | 39.99996 | 6 | 11 | 31 January 2018 13:52:06 | 1517377926 |
| 1 | 16 | 116.3062 | 39.99999 | 9 | 11 | 31 January 2018 13:52:15 | 1517377935 |
| 1 | 17 | 116.3061 | 40.00006 | 8 | 10 | 31 January 2018 13:52:23 | 1517377943 |
| 1 | 18 | 116.306 | 40.0001 | 8 | 11 | 31 January 2018 13:52:31 | 1517377951 |
| 1 | 19 | 116.3058 | 40.0001 | 7 | 12 | 31 January 2018 13:52:38 | 1517377958 |
| 1 | 20 | 116.3057 | 40.00011 | 8 | 11 | 31 January 2018 13:52:46 | 1517377966 |
| 1 | 21 | 116.3056 | 40.0001 | 8 | 12 | 31 January 2018 13:52:54 | 1517377974 |
| Spring n = 288 | Summer n = 250 | Autumn n = 251 | Winter n = 117 | Test Score | |
| length | 7056 | 6412 | 6286 | 6552 | F = 3.399 p = 0.017 |
| Time | 7822.233 | 7653.928 | 7512.072 | 7507.154 | F = 0.326 p = 0.807 |
| Speed | 59.08 | 57.00 | 56.05 | 56.75 | F = 0.708 p = 0.548 |
Publisher’s Note: MDPI stays neutral with regard to jurisdictional claims in published maps and institutional affiliations. |
© 2020 by the authors. Licensee MDPI, Basel, Switzerland. This article is an open access article distributed under the terms and conditions of the Creative Commons Attribution (CC BY) license (http://creativecommons.org/licenses/by/4.0/).
Share and Cite
Yao, Q.; Shi, Y.; Li, H.; Wen, J.; Xi, J.; Wang, Q. Understanding the Tourists’ Spatio-Temporal Behavior Using Open GPS Trajectory Data: A Case Study of Yuanmingyuan Park (Beijing, China). Sustainability 2021, 13, 94. https://doi.org/10.3390/su13010094
Yao Q, Shi Y, Li H, Wen J, Xi J, Wang Q. Understanding the Tourists’ Spatio-Temporal Behavior Using Open GPS Trajectory Data: A Case Study of Yuanmingyuan Park (Beijing, China). Sustainability. 2021; 13(1):94. https://doi.org/10.3390/su13010094
Chicago/Turabian StyleYao, Qian, Yong Shi, Hai Li, Jiahong Wen, Jianchao Xi, and Qingwei Wang. 2021. "Understanding the Tourists’ Spatio-Temporal Behavior Using Open GPS Trajectory Data: A Case Study of Yuanmingyuan Park (Beijing, China)" Sustainability 13, no. 1: 94. https://doi.org/10.3390/su13010094
APA StyleYao, Q., Shi, Y., Li, H., Wen, J., Xi, J., & Wang, Q. (2021). Understanding the Tourists’ Spatio-Temporal Behavior Using Open GPS Trajectory Data: A Case Study of Yuanmingyuan Park (Beijing, China). Sustainability, 13(1), 94. https://doi.org/10.3390/su13010094