Article

Localizing the Water-Energy Nexus: The Relationship between Solar Thermal Power Plants and Future Developments in Local Water Demand

1
Wuppertal Institute for Climate, Environment and Energy, 42103 Wuppertal, Germany
2
Mena Renewables and Sustainability (MENARES), 20003 Casablanca, Morocco
3
Polydisciplinary Faculty of Ouarzazate, Ibn Zohr University, 80000 Agadir, Morocco
*
Author to whom correspondence should be addressed.
Sustainability 2021, 13(1), 108; https://doi.org/10.3390/su13010108
Submission received: 29 October 2020 / Revised: 17 December 2020 / Accepted: 18 December 2020 / Published: 24 December 2020
(This article belongs to the Section Energy Sustainability)

Abstract

:
Water availability plays an important role in the expansion planning of utility-scale solar power plants, especially in the arid regions of the Middle East and North Africa. Although these power plants usually account for only a small fraction of local water demand, competition for water resources between communities, farmers, companies, and power suppliers is already emerging and is likely to intensify in future. Despite this, to date there has been a lack of comprehensive studies analyzing interdependencies and potential conflicts between energy and water at local level. This study addresses this research gap and examines the linkages between water resources and energy technologies at local level based on a case study conducted in Ouarzazate, Morocco, where one of the largest solar power complexes in the world was recently completed. To better understand the challenges faced by the region in light of increased water demand and diminishing water supply, a mixed-method research design was applied to integrate the knowledge of local stakeholders through a series of workshops. In a first step, regional socio-economic water demand scenarios were developed and, in a second step, water saving measures to avoid critical development pathways were systematically evaluated using a participatory multi-criteria evaluation approach. The results are a set of water demand scenarios for the region and a preferential ranking of water saving measures that could be drawn upon to support decision-making relating to energy and water development in the region.

1. Introduction

Water is becoming an increasingly scarce resource. This can affect the development of all sectors, including the energy sector, while at the same time the energy sector and other sectors can also contribute to intensifying water stress in certain regions [1]. These types of complex interdependencies, trade-offs, and synergies are commonly referred to as the water-energy nexus. In electricity generation, thermal power plants using fossil fuels are particularly water-intensive, but renewable power plants also require water to a certain extent [2,3]. In particular, thermal technologies like Concentrating Solar Power (CSP) can require significant amounts of water, depending on the cooling technology applied [4,5]. This leads to the dichotomy that in arid regions, which are also generally those regions with the highest solar energy potential, water can potentially become a limiting factor for the expansion of solar technology.
This paper therefore analyses how existing local water demand and new water demand for solar power at the local level in the MENA region are linked today and in the future, and what measures might be considered to conserve water. Particularly in arid areas in the Middle East and North Africa (MENA), water availability plays an important role in the expansion planning of utility-scale solar power plants [6,7]. Although power plants might account for only a very small fraction of the local water demand, competition for water with other sectors is expected to increase when the water resources are not sufficient to meet the local demand [8]. This can cause conflicts between different users (such as municipalities, farmers, tourism, businesses, and energy providers), which is already evident today, In addition to already scarce water resources, many MENA countries are experiencing increasing water demand due to economic development and high population growth. This situation is further exacerbated by the negative impacts of climate change—such as reduced precipitation and high temperatures—especially in areas already classified as arid [9,10].
Though the water-energy nexus is increasingly being addressed, there is a lack of comprehensive studies that analyze the interdependencies and potential conflicts between energy and water at the local level [11,12]. The focus of discussions and applications of the water-energy nexus has mainly been at national or global level, examining macro level driving forces, material flows, and major infrastructure developments. This approach has neglected the fact that the major challenges faced within the nexus must be addressed at the local level [13]. Water, energy, and food are of great importance for securing local livelihoods [12] especially in rural areas in developing and emerging countries. Only by translating the global level debate into local practice can development challenges be met.
This is also true for research into the MENA region, where there are only a limited number of applications of the water-energy nexus concept [14] and those that do exist mainly focus on national or meta level analysis. Siddiqi and Anadon [15], for example, quantified the water requirements of the energy sector and the energy requirements of the water sector at national level for 20 MENA countries. Al-Saidi et al. [16] provide water vulnerability profiles at country level considering the links to the energy sector, while Hoff et al. [14] compare five water-energy-food nexus case studies from the MENA region at the meta level. Other studies focus on country level analysis: for example, Rambo et al. [17] analyze the nexus in Saudi Arabia; Al-Saidi et al. [16] summarize nexus facts for Egypt; Al-Masri et al. [17] explore water-energy nexus policies and governance aspects in Jordan; and Terrapon-Pfaff et al. [18] focus on water-related challenges for the Iranian power sector. However, evidence from practical applications of the water-energy nexus concept at local level are limited—despite the fact that, according to Hoff et al. [14], the operationalization of the nexus approach could be particularly beneficial in the MENA region in light of the challenge the countries face with regard to energy, land, and water aspects.
To address this research gap, the present study applies an innovative participatory approach to examine the linkages between water resources and energy technologies at local level for a case study conducted in Ouarzazate, Morocco. This is a region severely affected by a declining water supply; it is also the location of the recent construction of one of the world’s largest solar power plant complexes, NOORo. The study is therewith among the first to apply the nexus concept at local level in the MENA region that includes not only the resource layer but also the political, social, and economic layers. Furthermore, the applied multi-method research design advances the water-energy nexus research by integrating local knowledge and spatio–temporal dynamics. In this regard the detailed objectives of this study are as follows: (a) to identify the key factors influencing local water demand; (b) to develop socio-economic scenarios in collaboration with local stakeholders to determine potential future water demand; and (c) to identify and evaluate water saving measures in the energy sector and other sectors against a set of sustainability criteria, integrating the preferences of local stakeholders. The results are a set of measures to mitigate critical developments outlined in the scenarios that reach a high level of consensus among the stakeholders.
The paper is structured as follows: Section 2 outlines the case study details, followed in Section 3 by a detailed description of the research approach and the methods applied. The analysis and results are presented in Section 4. Finally, in Section 5, the results are discussed and concluding remarks are presented.

2. Case Study

The case study region, the Middle Drâa Valley, is located in the Ouarzazate and Zagora provinces in South-Eastern Morocco. This is one of the driest areas in Morocco and the catchment of the Drâa river is among the driest catchments worldwide. The average rainfall in the region is around 200 mm/year in the north and 30 mm/year in the south [19], compared to an average rainfall of 346 mm/year in Morocco [20]. Accordingly, the water availability, with around 360 m3 per head and year, is far below the internationally specified critical limit of 1000 m3 per head and year. Moreover, simulations show that the water supply in the area could be further reduced due to the negative effects of climate change. Specifically, it is expected that the already sporadic and variable levels of precipitation will be further reduced and the temperature will rise [21]. This would severely affect water availability from the main water source, the El Mansour Eddahbi reservoir. The reservoir is the supply line for local agriculture in the Middle Drâa Valley, the primary livelihood sector in the provinces of Ouarzazate and Zagora. The main crops grown in the region are cereals, date palms, alfalfa, henna, olives, and other arboreal species, with increasing numbers of watermelons in recent years [22,23]. As well as the agricultural and residential sectors, the newly completed solar power complex NOORo also sources its water from the El Mansour Eddahbi reservoir. The arid environment and high solar radiation provide ideal conditions for one of the largest solar complexes worldwide, which has a total capacity of around 580 MWp. The complex, which was completed in 2019, consists of four power plants, three CSP blocks (of which two are parabolic trough systems (NOORo I & II) and one is a solar tower (NOORo III)) and a solar photovoltaic plant (NOORo IV). The development of the Ouarzazate solar complex is part of the Moroccan solar plan, which aims to expand the national solar capacity to 2000 MWp by 2020 [24]. CSP technologies can require significant amounts of water, depending on the cooling technology applied. While NOORo II and III were designed to use dry cooling technologies needing only small volumes of water, NOORo I uses a wet cooling system with significant water requirements. However, the solar power plant’s water demand is currently marginal, drawing only about 0.8% of the reservoir’s water compared to the 96% used for agriculture, 2.2% for the residential sector in Ouarzazate, and 0.9% for the tourism sector (own calculations based on [19,25,26,27]. However, with the capacity of the reservoir declining and in light of the expected negative effects of climate change on the water supply, the power plant’s water demand could become critical. On one hand, the power plant could be negatively affected by water shortages in drought years, while, on the other hand, competition for water resources between municipalities, farmers, businesses, and power suppliers could emerge.

3. Research Approach and Methods

To achieve the research objectives described in Section 1, a participatory assessment approach in combination with multiple systems analysis methods was chosen, as described in this section.

3.1. Research Approach

Various approaches and methods from different disciplines are used in the field of water-energy and food nexus research, most of which are quantitative [28]. In line with the demand for more local and community level nexus analysis, there has also been a call for more diversified, qualitative, and participatory research designs. In their review of nexus approaches and methods, Albrecht et al. [28] (2018) recommend, for example, applying participatory approaches and mixed methods that combine quantitative and qualitative methods in order to account for both the physical and social dimension of the nexus. Likewise, de Strasser et al. [29] describe participation in the nexus analysis as a key pillar and Mohtar and Lawford [30] call for the wider engagement of stakeholders to strengthen the nexus practice.
Besides the fact that when working at the local and community-level those affected by and affecting the water-energy nexus should be involved in the discussions and analysis of their environment and their future, stakeholder engagement also unearths wider sources of knowledge and, consequently, the potential for better research results [28]. Taking the perceptions and assessments of local stakeholders into account can, for example, support a broader and deeper understanding of the decision-making context [31]. As well as these methodological advantages for research design and output, participatory approaches can also help to provide stakeholders with a better understanding of the complexity of the water-energy nexus and to clarify their priorities and expectations, resulting in better decision-making based on negotiation and stakeholder buy-in [32].
In this study, in order to involve local stakeholders two workshops were conducted in the case study region of the Middle Drâa Valley in April and December 2018. Up to 30 stakeholders, representing local farmers, civil society groups, and local and regional administrations, were invited to both workshops. Participants included representatives from the high commission for water and forests, province council, electricity supplier, hydrological agency, meteorological service, provincial delegation of energy and mines, agricultural associations from the different oases, and the agricultural chamber, as well as from local NGOs, representatives of youth and women groups.
The objective of the first workshop was to develop socio-economic water demand scenarios for the Middle Drâa Valley in collaboration with the local stakeholders. In the second workshop, the aim was to discuss water conservation measures to avoid critical water demand developments and evaluate the measures against selected criteria. Figure 1 gives an overview of the applied methods and the participation of stakeholders in the different steps. Both the methods and participatory elements are described in more detail in Section 3.2.

3.2. Methods

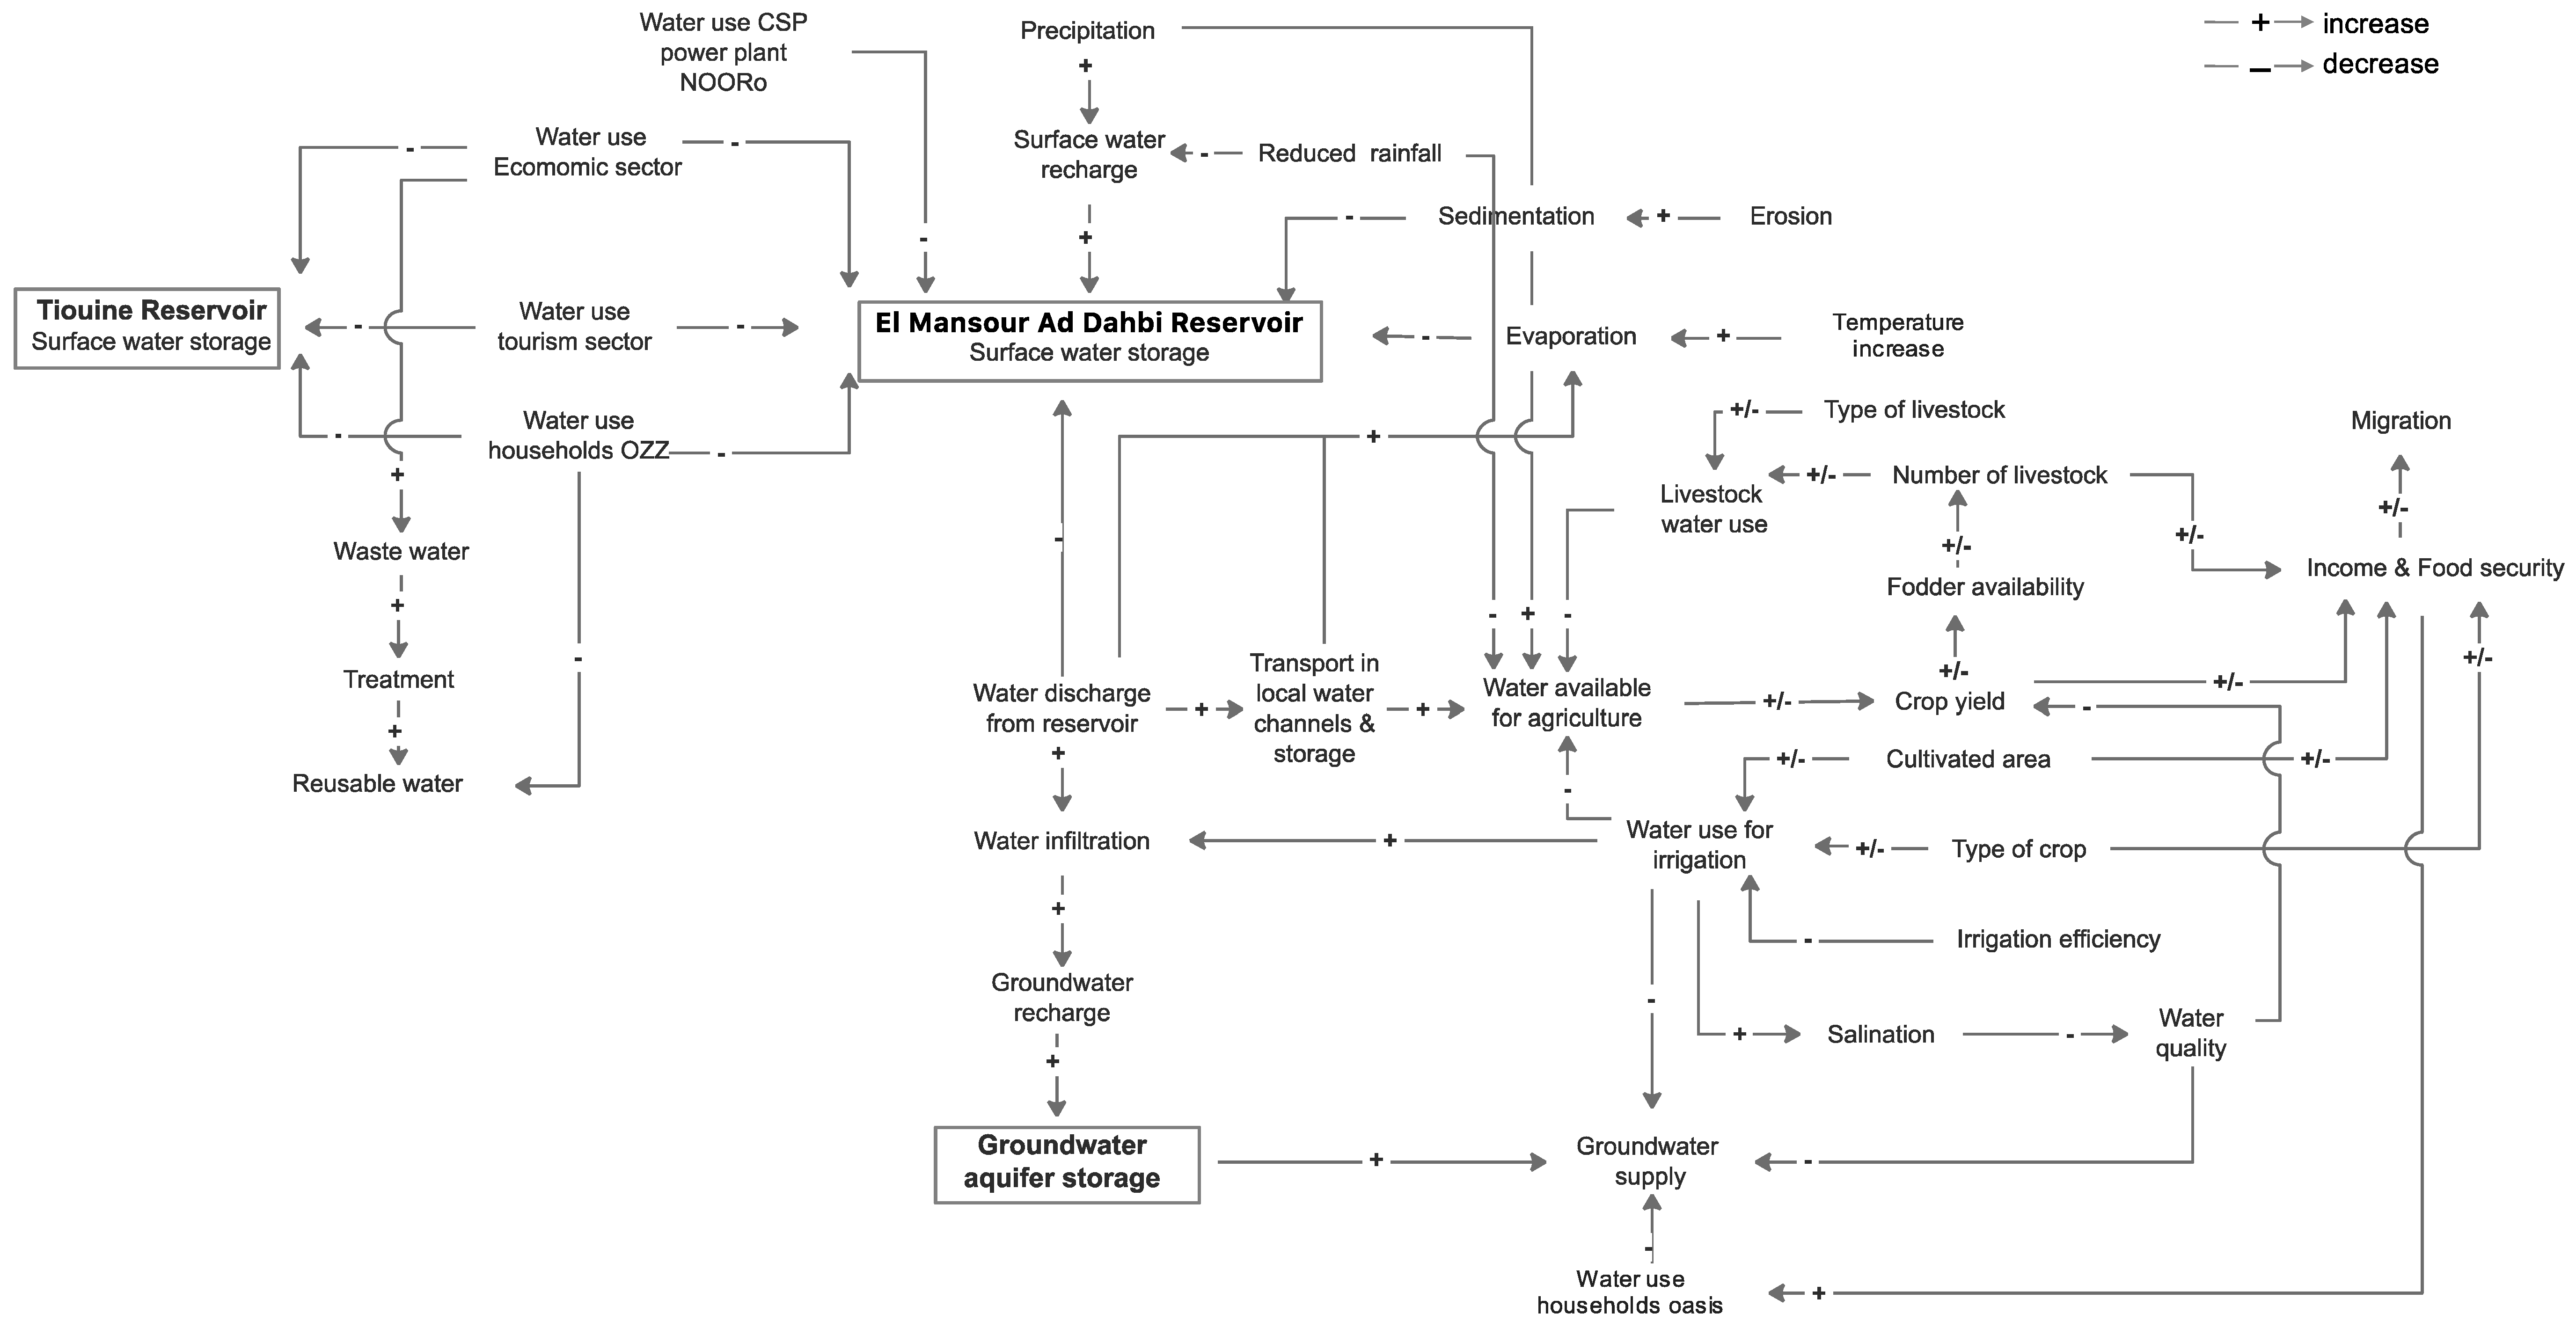
3.2.1. System Mapping

Complex interlinkages exist between the water, energy, and agricultural systems in the Middle Drâa Valley case study region. To explore and understand these complex interlinkages, a system thinking approach was applied in the form of system mapping. Developing a system map allows for the integration of different system elements in an analytical manner by mapping key elements of the subsystems and visualizing their interdependencies [33]. Furthermore, a system map allows the whole picture to be seen and for key factors that are likely to influence the future development of the local water demand to be identified [34,35]. The system mapping in this case is based on a detailed literature review, followed by a mapping exercise by the research team and validation by local stakeholders at the first workshop. The system mapping exercise consisted of five steps: (1) identifying factors, processes, and functions; (2) discussing individual system elements; (3) establishing links between the system elements; (4) discussing these links; and (5) validating the draft system map created in the system mapping exercise against information from the literature review. The links between different elements are defined as having an increasing or decreasing influence on the relevant variables. The system map developed here is the starting point for the following scenario development process.

3.2.2. Participatory Scenario Development

Participatory scenario development describes an approach that explores potential future developments in conjunction with stakeholders [36]. Applying participatory approaches allows the views of stakeholders and the specific local context to be taken into account, which improves the quality and relevance of scenarios [37]. Furthermore, the involvement of stakeholders can be empowering and increases the acceptance of results [38,39]. However, to date only a limited number of scenario studies have involved stakeholders to a meaningful extent [40]. Accordingly, several authors have called for the wider engagement of stakeholders; the people whose futures are under discussion should also contribute to the scenario development process [37,40,41]. Therefore, in this study we involved stakeholders in several steps of the qualitative scenario development process.
The qualitative scenario development process comprises different consecutive steps. It starts with the definition of the scenario field, followed by the identification of key factors, the analysis of these factors, and finally the drafting and elaboration of the scenario storylines [42]. Based on the system mapping in our study, the scenario field and a first list of key factors were identified. Key factors are those that have an influence on the future (ibid) and, in this specific case, those that have an influence on the development of water demand in the Middle Draâ Valley region. In a first step, the key factors were prioritized based on their impact on the development of water demand and the uncertainty of these developments. The factors with a high impact and a high uncertainty are the relevant ones for the scenario designs [37]. After the identification of the six most relevant factors, at least two variations of the future characteristics of these key factors were determined. These variations represent the conceivable different developments of these factors in the period up to 2030 (and potentially 2050). In the next step, the possible variations of the key factors were arranged in consistent clusters, forming the basic structure of the draft scenario storylines [42]. This stakeholder workshop process resulted in three scenario storylines for socio-economic development in the region that would impact on future water demand.

3.2.3. Water Demand and Supply Modelling

Following the workshop, the qualitative scenario storylines developed by the local stakeholders were underpinned and fleshed out with details and data to quantify the water demand associated with the socio-economic developments described. Water Evaluation and Planning System (WEAP) software was then used by the authors as an allocation tool to model future water supply and demand based on the developed socio-economic scenarios. WEAP’s integrated approach allows for the simulation of water demand-side patterns (such as water use, efficiencies, and consumption for energy generation) and the supply-side for a specific region under certain assumptions (such as climate change). In this study, water supply is modelled under the Representative Concentration Pathway 8.5 (RCP 8.5) climate scenario, which is a high emission business-as-usual scenario. Based on the results, in the next step water conservation measures with the potential to help avoid critical scenario developments were discussed and evaluated with the local stakeholders.

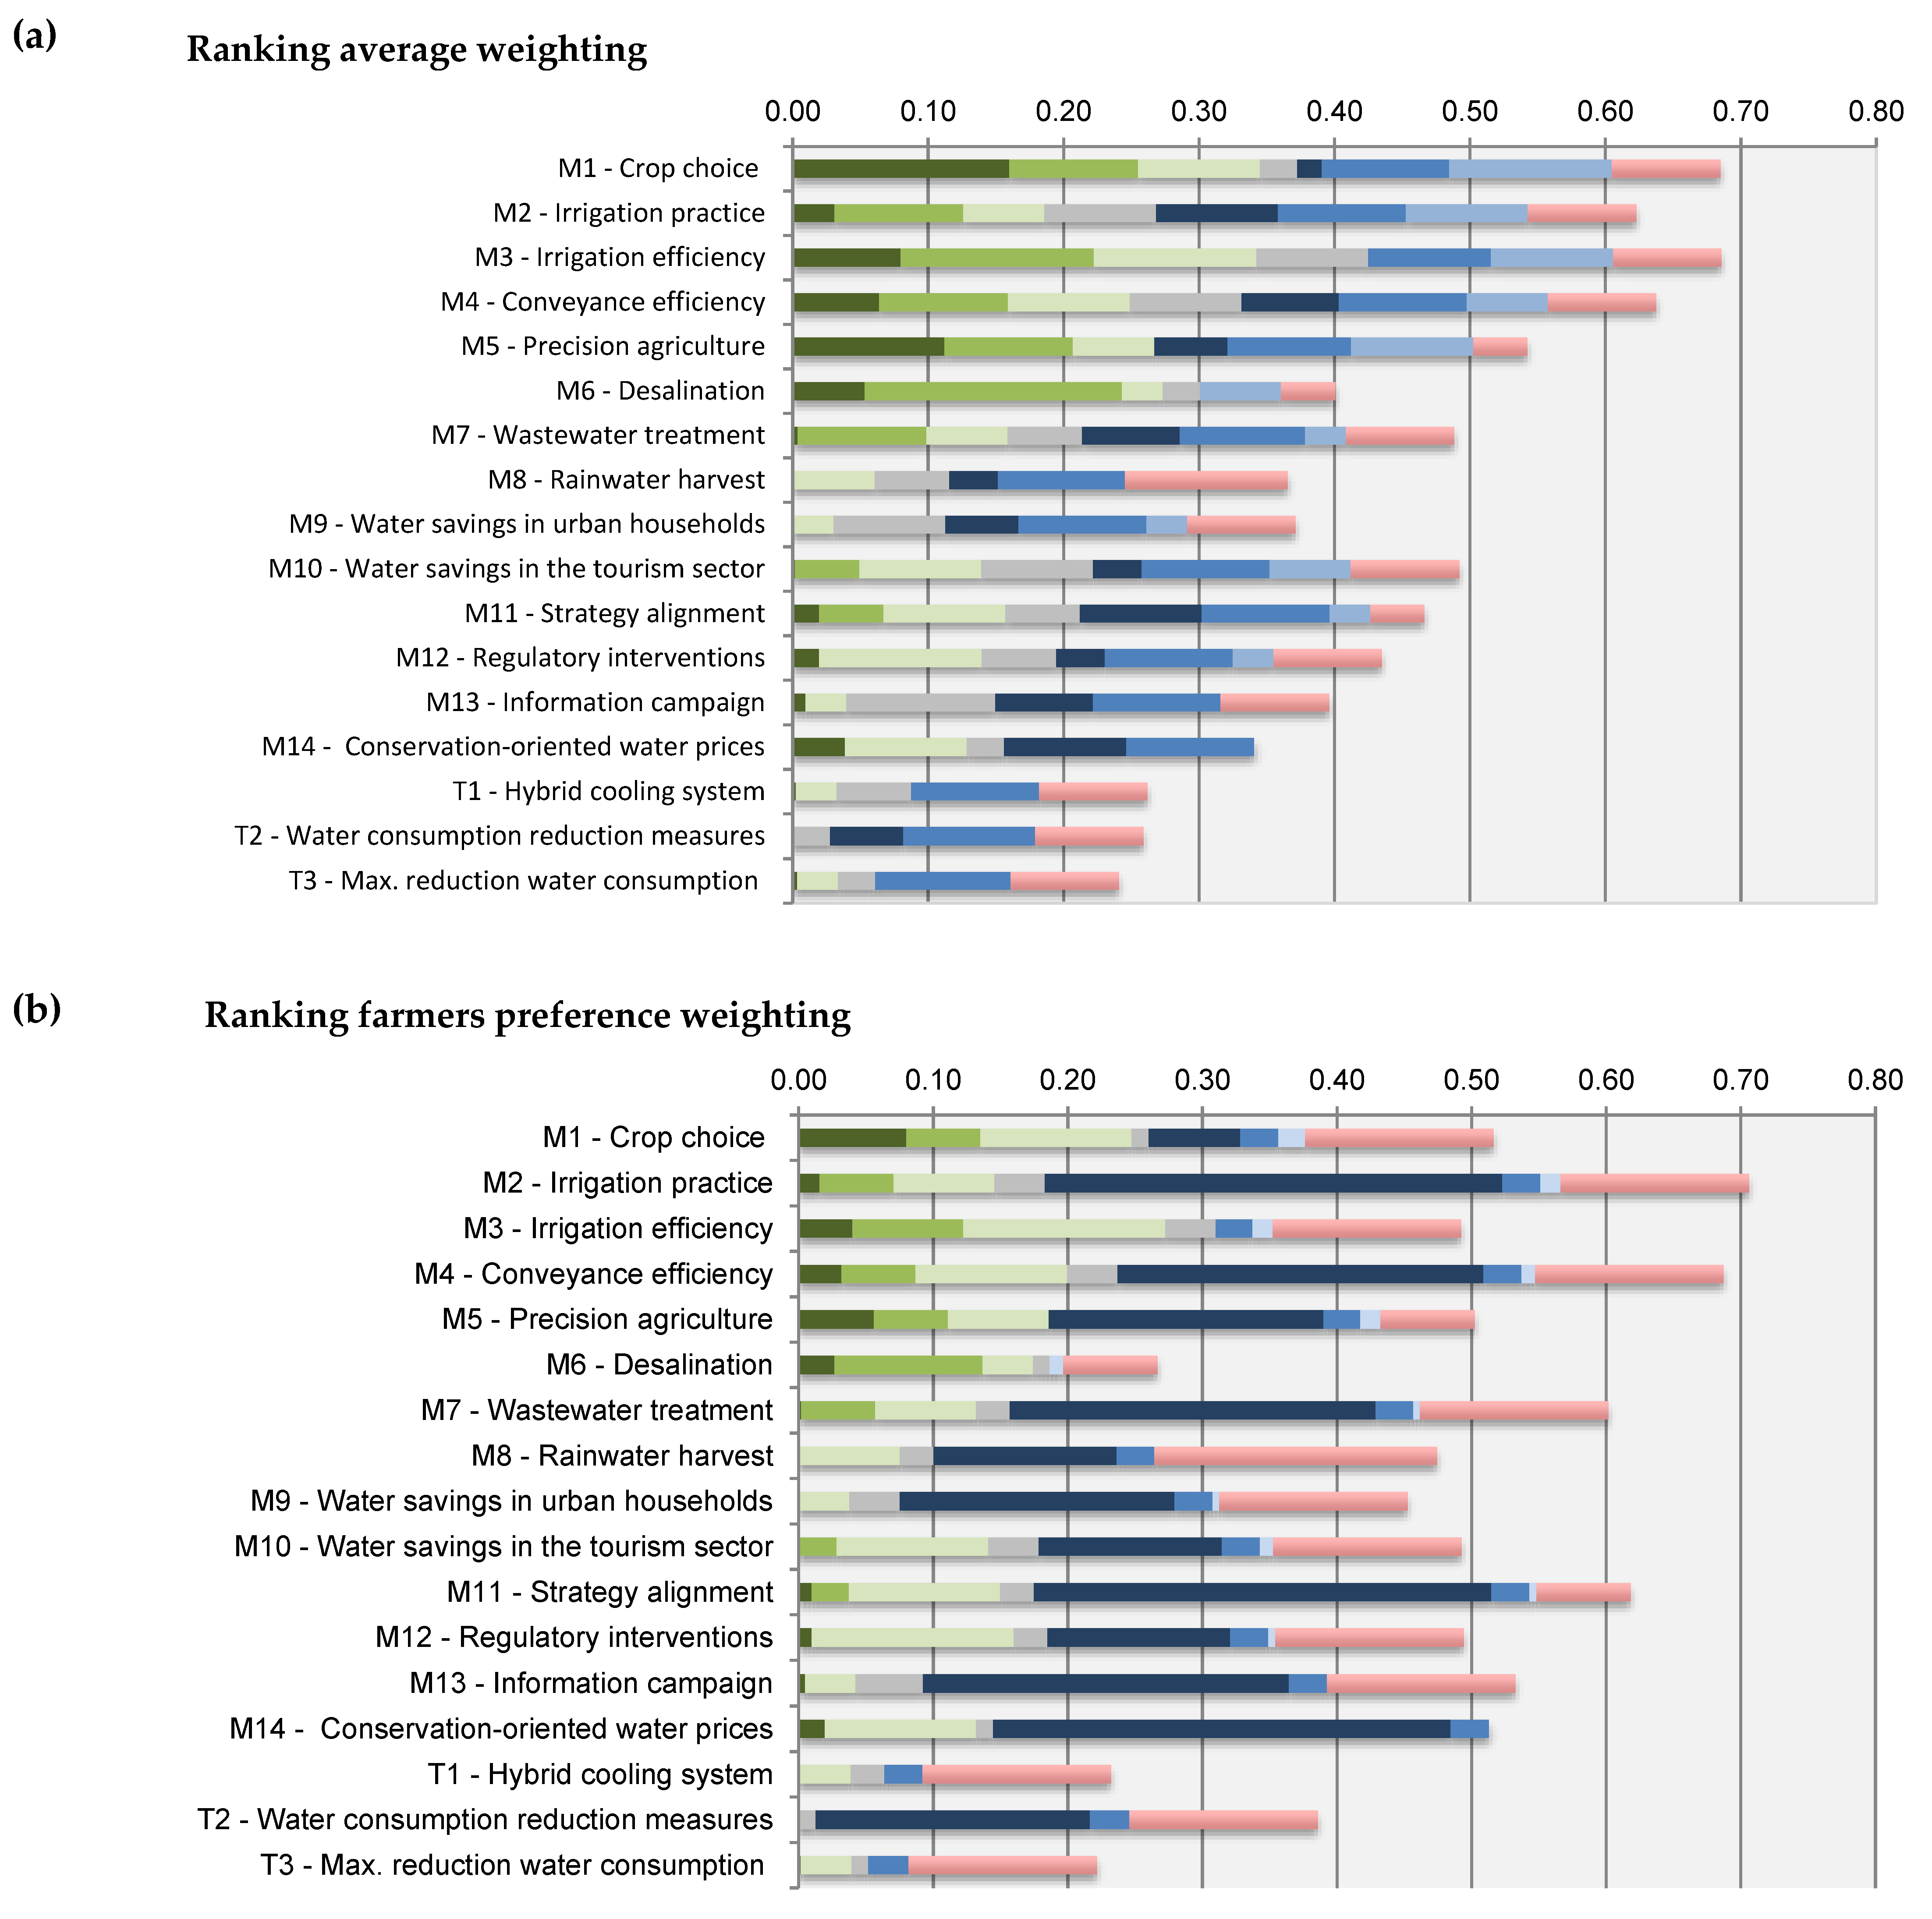
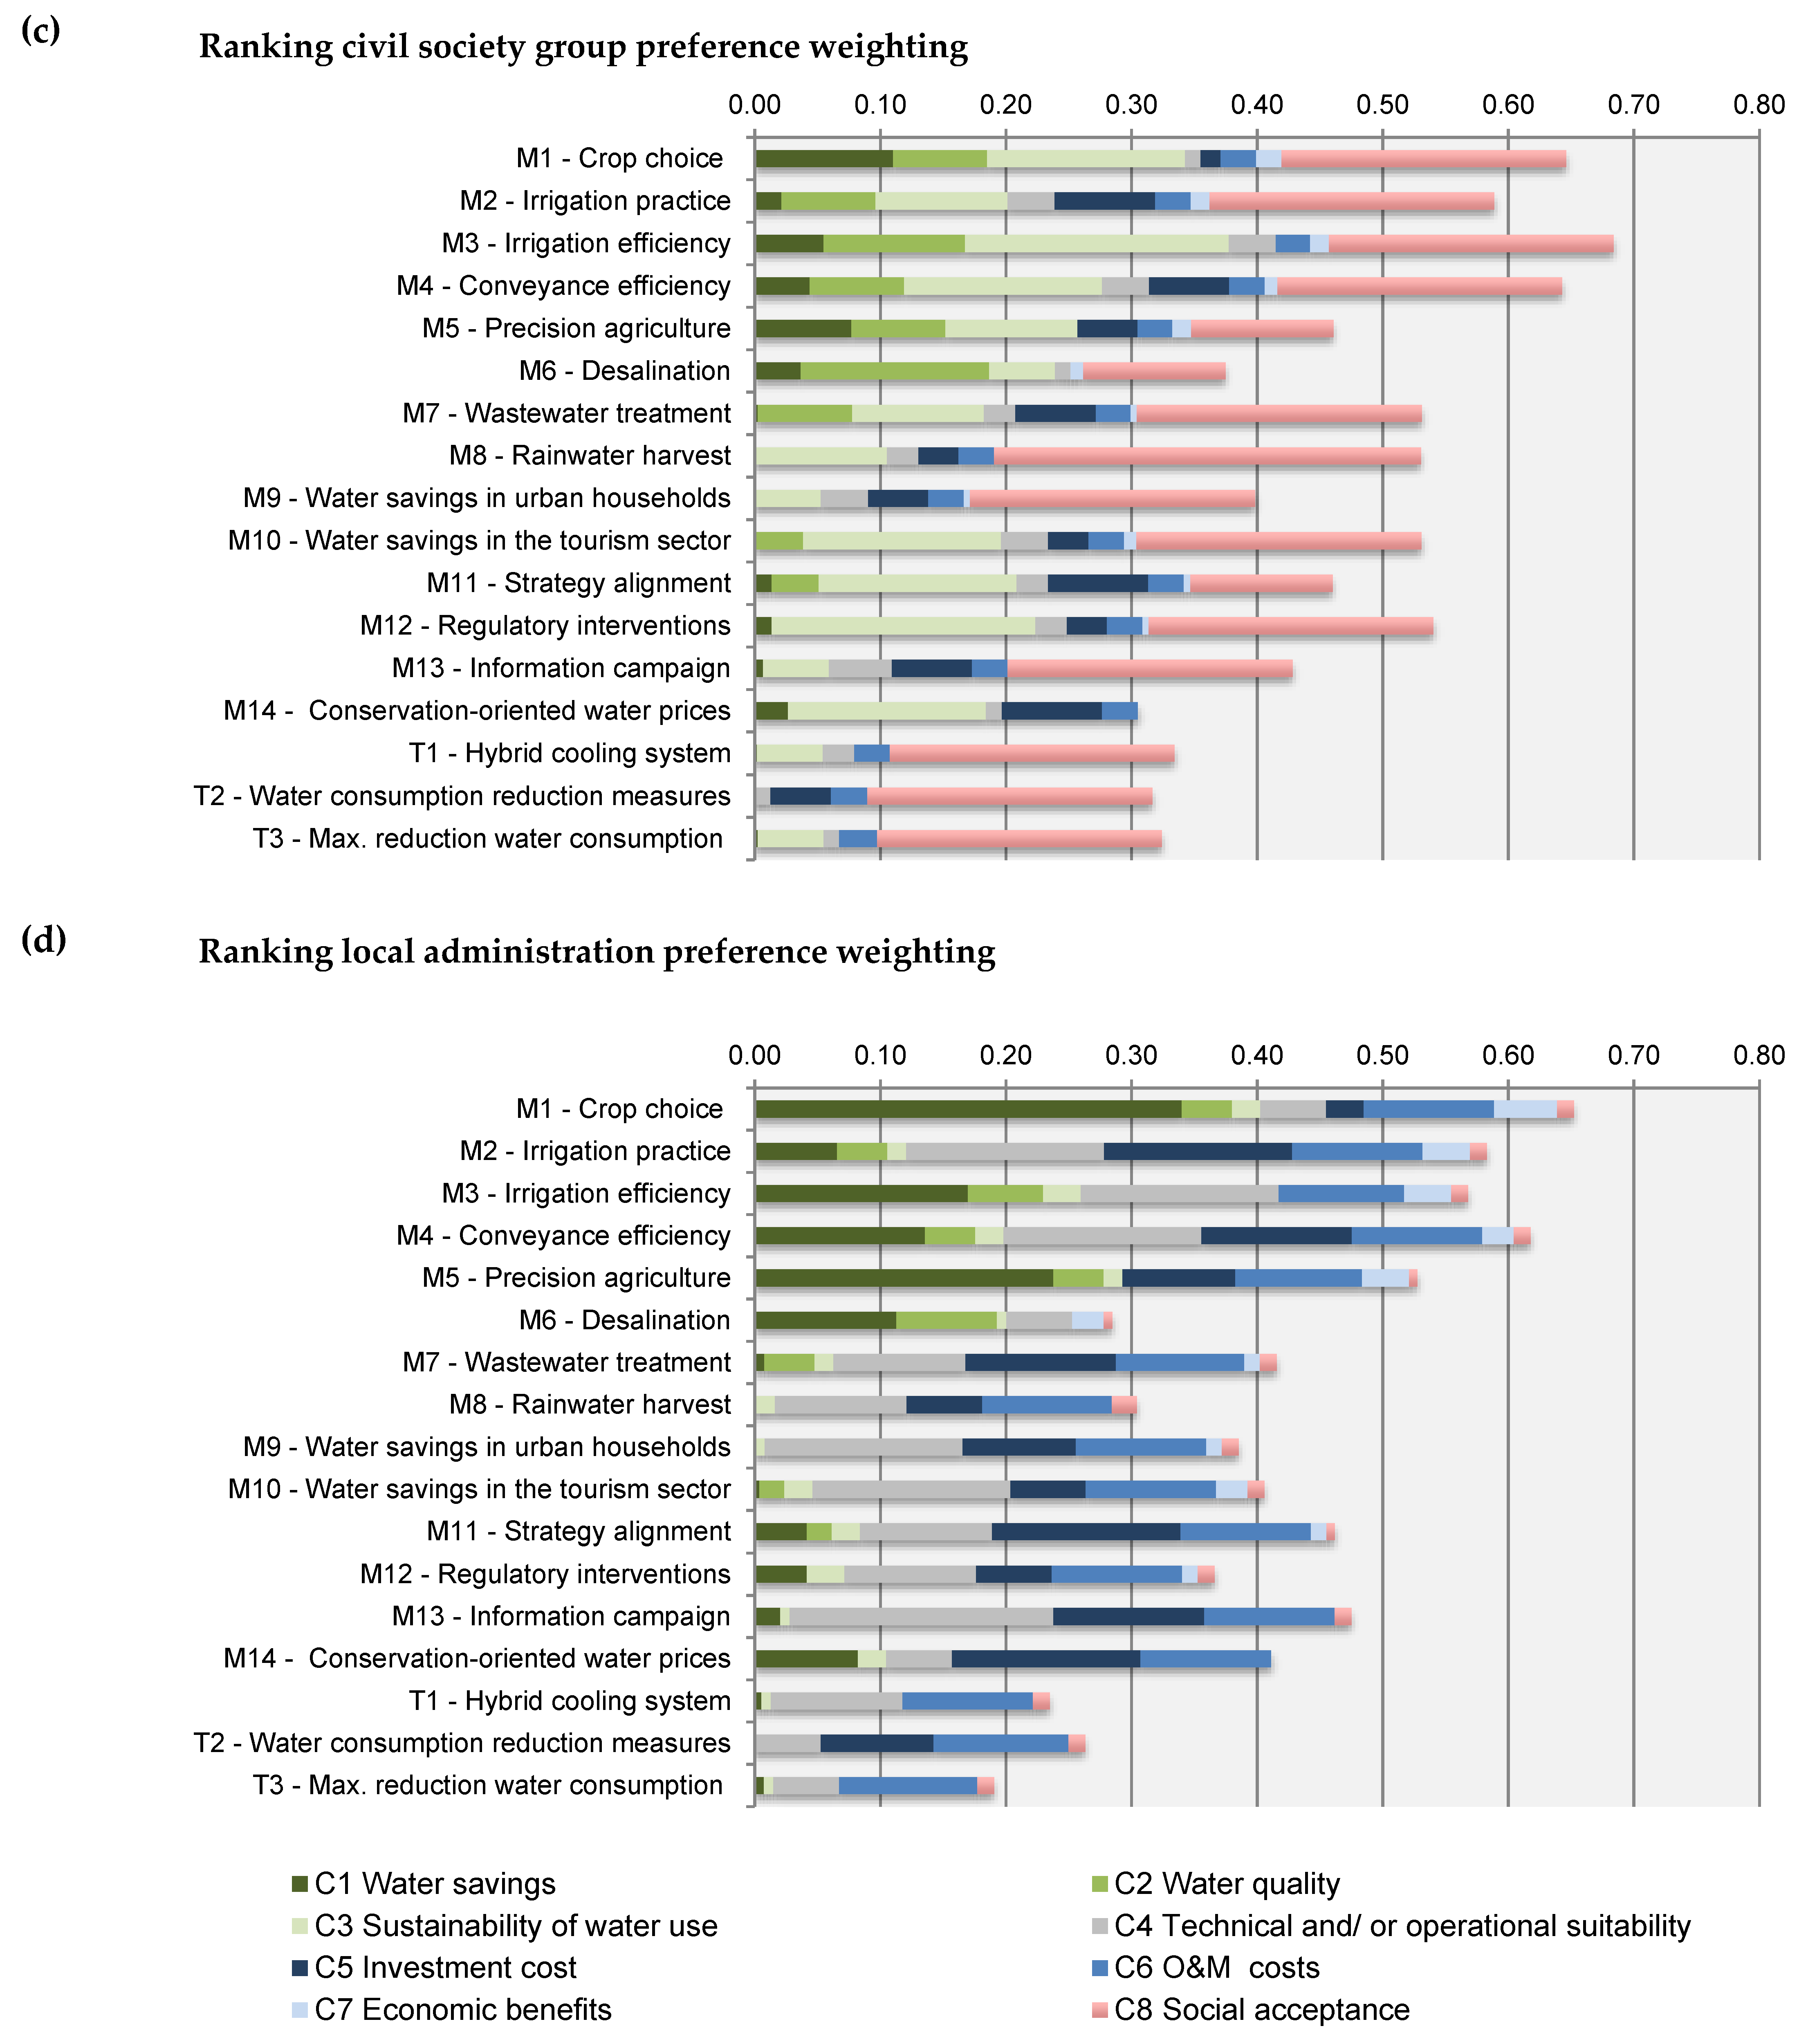
3.2.4. Participatory Multi-Criteria Analysis (MCA)

Strategic decisions on water conservation measures affect multiple actors and require the consideration of a range of technical, environmental, social, and economic issues. In order to incorporate these diverse dimensions and the stakeholders’ interests and perspectives, in this study a participatory multi-criteria analysis approach (MCA) was applied. The approach is based on the quantitative principles of multi-criteria decision analysis in combination with participatory elements, which are integrated in the overall structure of the MCA process. MCA methods have been widely applied in renewable energy planning and provide an analytical framework that helps to structure the decision-making process and enhance transparency [43,44,45].

Defining Evaluation Criteria and Stakeholder Preferences

Following a value-based thinking approach, in a first step the criteria for evaluating water conservation measures were discussed and weighted with the local stakeholders during the second workshop. The original set of criteria was based on a literature review and reflection on system mapping and the key factors identified in the scenario development process. During the discussion, this set of criteria was supplemented by suggestions from local stakeholders to reflect the objectives and values of local stakeholders. The final criteria set comprises social, economic, environmental, and technical decision dimensions (Table 1).
After the validation of the criteria set, four weighting sets were established, representing the different priorities and preferences of the three stakeholder groups, as well as an average weighting across all stakeholder groups. The weightings determine the relative importance of the criteria [46]. To determine the weightings, a combination of ranking and rating approaches [46,47] were applied in the workshop. This approach was chosen because these are the simplest and most intuitive weighting methods, which took into consideration the fact that the local stakeholders were not familiar with the MCA method.

Identifying Water Conservation Measures

In the next step, the set of measures to address water challenges in the Middle Drâa Valley (Table 2) were discussed with the stakeholders to validate their suitability and feasibility in the local context. Following the discussion, the water conservation measures were evaluated by the local stakeholders against the context-specific criteria aspects—such as social acceptance, compatibility with traditional practices, and cultural barriers.

Evaluation of Water Conservation Measures

After the workshop, the decision matrix was established. To identify the preferred water conservation measures based on the decision matrix, the MCA calculation was made using a simple additive weighting (SAW) approach [48]. The SAW approach uses addition and multiplication to obtain a total value for each alternative: in this case the water conservation measures. The alternative with the highest value is considered the best alternative (ibid). This procedure was followed by a sensitivity analysis to ensure robustness of the results. The results rank the water saving measures according to stakeholder preferences.

4. Analysis and Results

4.1. Systems Analysis

In order to identify the key factors that influence future water demand and supply in the Middle Drâa Valley, the complex interlinkages between the surface and groundwater systems and the energy, agricultural, economic, and residential sectors were mapped (Figure 2). As illustrated in the system map, water in the Middle Drâa Valley is mainly drawn from the El Mansour Eddahbi reservoir. The new solar power plant NOORo also draws its water from this reservoir. The town of Ouarzazate additionally receives drinking water from the Tiouine reservoir, which was completed in 2013. Wastewater from the residential sector in the city of Ouarzazate is currently partially treated by a newly built treatment plant. The treated wastewater is used to irrigate trees planted in a green belt around the city to combat desertification [49].
The El Mansour reservoir is mainly fed by the river Dadès, which springs from the high Atlas Mountains. However, the storage capacity of the reservoir is constantly reducing due to sedimentation (from 560 million m3 in 1972 to about 390 million m3 today) [50]. At the same time, a decrease in precipitation reduces the recharge of surface water and rising temperatures increase evaporation rates, thereby reducing the amount of available water [37]. The river Drâa, which supplies the downstream oases, flows from the El Mansour Eddahbi reservoir. The water downstream is nearly all used by the agricultural sector. Water used in households and businesses in the downstream oases towns and villages is sourced from six groundwater aquifers. Infiltration from the riverbed and rainfall recharge these groundwater aquifers. However, the increasing use of groundwater for irrigation has already led to the exhaustion of groundwater sources and an increase in soil salination [51].
Given the complex inter-relationships between the agricultural sector and the water supply and demand (as shown in the system map) and with the agricultural sector as the main consumer of water, the most important links influencing future water demand can also be assigned to this sector. Other key factors shown in the system map that influence future water demand are linked to social and economic development in the urban and rural areas. Further aspects not explicitly shown in the system map, but which can influence the different elements of the system and, consequently, future water supply and demand structures, include changes in the political framework conditions and potential infrastructure development like the construction of access roads or further dams. These critical links and their potential development trajectories are examined in more detail in the following section.

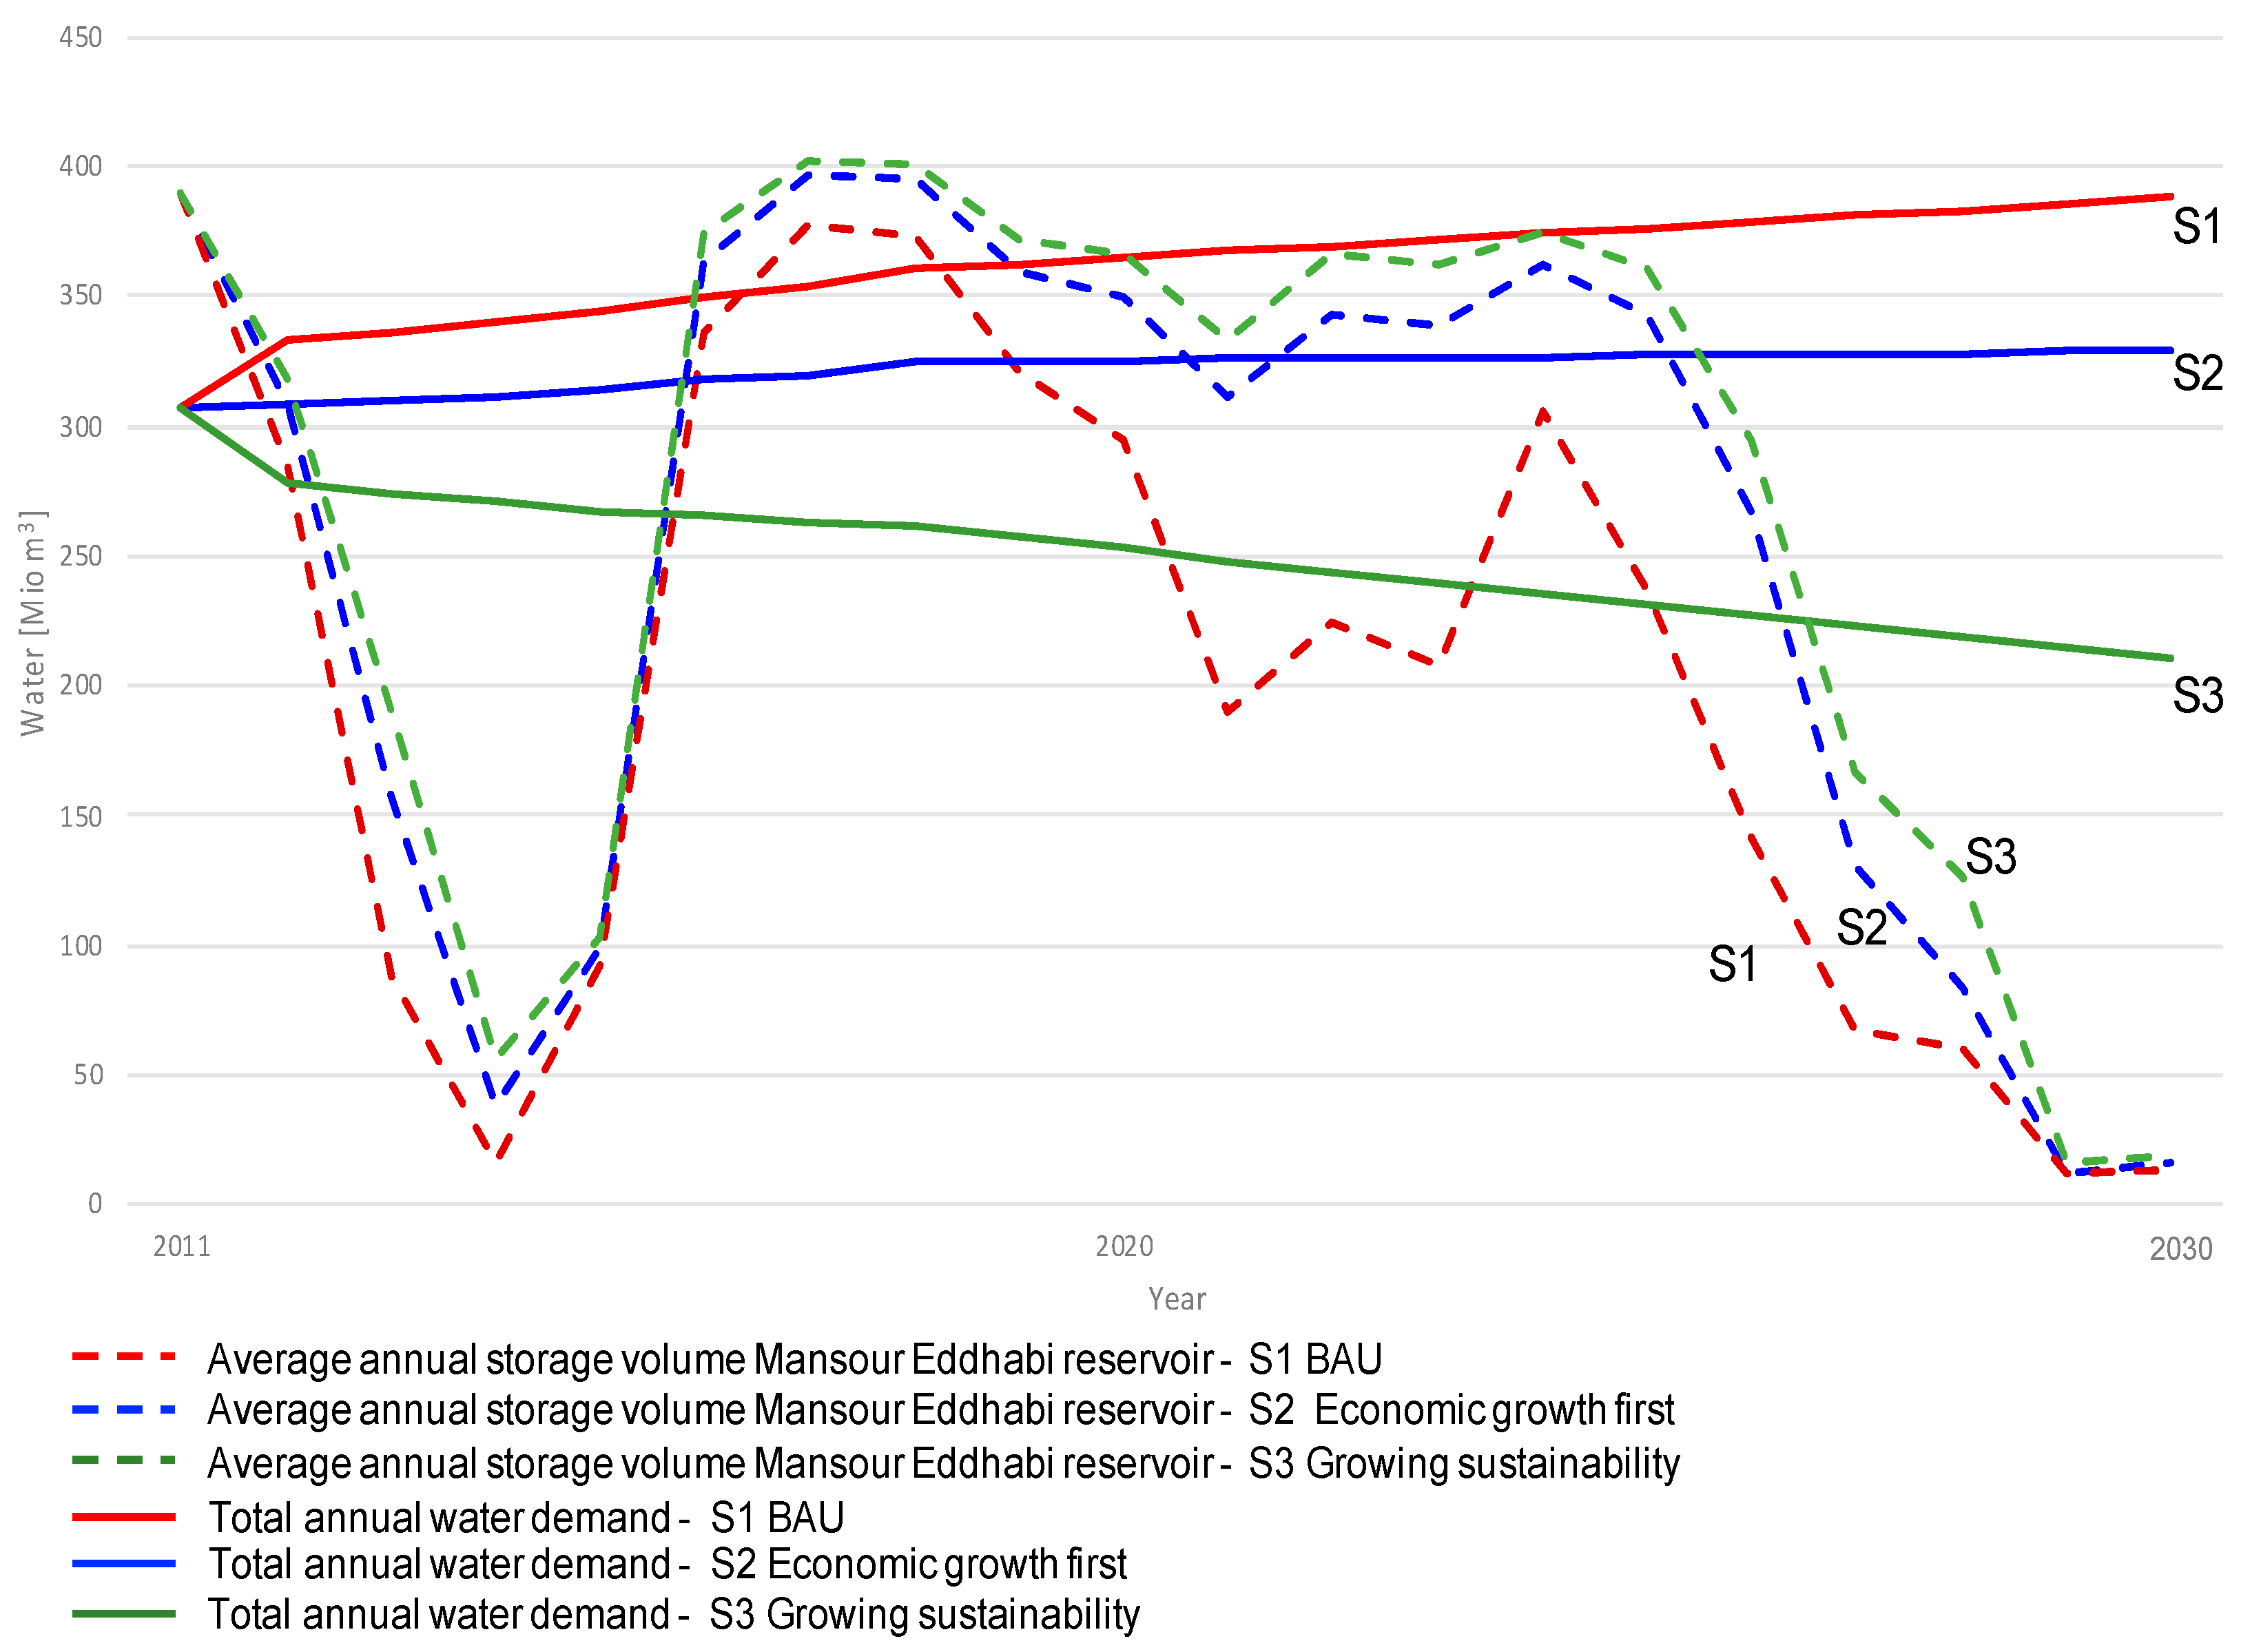
4.2. Socio-Economic Water Demand Scenarios in the Middle Drâa Valley

As described in Section 2, the catchment area of the river Drâa is one of the driest catchment areas worldwide and the water supply is expected to further diminish due to the negative effects of climate change [21]. In order to determine whether, and if, the reduced water availability will lead to increased water shortages also depends on water demand. The water demand in the base year 2011 is estimated to be about 306 million m3 per year. How this figure will develop in the future is uncertain and strongly depends on developments in the agricultural, residential, tourism, and energy sectors. While information is available on the water demand of the energy sector (i.e., the power plant NOORo), developments up to 2030 in the other relevant sectors are considered uncertain. The scenarios developed in conjunction with local stakeholders in this study aim to bridge this gap.
The critical factors influencing future water demand, derived from the system map and prioritized together with the local stakeholders, include for the agricultural development: extent of cultivated area, choice of crop type, share of irrigation with groundwater, irrigation efficiency, livestock numbers, and water quality. Key social development factors that can potentially influence water demand are population development in both oases and urban areas and lifestyle changes. Lifestyle changes due to economic development could result in both water and electricity use increases especially as the current per capita water use in the region is very low (see Section 2). Likewise, developments in the local tourism and industry sectors could affect the water demand. Equally, expansion in the transport infrastructure, which would improve the connectivity of the region with the coastal markets, could lead to an increase in water-intensive export crop production. Similarly, regulations, subsidies, or other types of support programs could influence future water demand in either direction. Of these different factors, cultivated area, choice of crop types, irrigation with groundwater, water quality, population development, and tourism sector development were identified by the local stakeholders as the most relevant for water demand up to 2030. By linking the potential development trajectories of these factors, three scenario narratives were drafted during the first workshop: one business-as-usual scenario (S1: BAU) and two more extreme but possible scenarios, describing on the one hand an economic development scenario associated with the overexploitation of water resources (S2: Economic growth first) and, on the other hand, a development in the direction of sustainability (S3: Growing sustainability). The drafted scenario storylines were further developed into three consistent narratives underpinned with quantitative details and data points (Appendix B) to quantify the future water demand and water supply implications associated with the three scenario narratives.
The water demand of these socio-economic scenarios in combination with the water demand of the solar power plant NOORo was modelled using WEAP software (modelling parameters are detailed in Appendix B). The results of the modelling are illustrated in Figure 3.
In terms of water supply, the simulation shows a general negative trend due to changes in precipitation patterns, discharge reduction, and sedimentation levels in the Mansour Eddahbi reservoir, which are in line with the assumptions made on climate change in the RCP 8.5 scenario. For the first half of the first model decade the Mansour Eddahbi reservoir storage level is low due to a simulated drought. Following two unusually wet years, the storage volume refills and the peak enables the reservoirs to recover. However, in the second modelled decade the storage levels cannot be maintained and the simulated sequence of two dry to very dry years results in very low reservoir storage levels.
In terms of water demand, Figure 3 shows a steady increase up to 2030 for the scenarios S1—“BAU” and S2—“Economic growth first”. While the increase in S1 is moderate (an increase of about 7% compared to the base year 2011), S2 shows a significant increase in water demand (an increase of about 27% between 2011 and 2030). In contrast, S3—“Growing sustainability” indicates a decrease in water demand (of about 31% by 2030). Comparing the developments of S2 and S3, the difference in annual water demand in 2030 amounts to up to 177 m3, which corresponds to 58% of water demand in the base year 2011.
In considering the water demand in the scenarios in relation to the development of water availability in the main water source, the Mansour Eddahbi reservoir, it is clear that none of the scenarios show water demand being met in drought years. However, in the case of S3—“Growing sustainability”, water demand can be met in most of the modelled years, while for S2—“Economic growth first”, water demand cannot be met in most of the modelled years. For S1—“BAU”, water demand can be met in most modelled years but the frequency of years with insufficient water availability increases at the end of the period modelled. The results show that even a transition towards sustainability, as illustrated in S3, cannot prevent water shortages in drought years—but it still offers the possibility of meeting the socio-economic water needs and NOORo power plant demand in most years. The pure economic development scenario S2 proves to be unsustainable after just a few years, as water resources are rapidly exhausted. Although these scenarios and their quantification are based on a number of assumptions and are, therefore, subject to a range of uncertainties, the overall direction of the water demand developments is clear. Despite the apparent long-term inevitability of water scarcity in the region, measures should be taken to counteract the critical scenario developments at least partially.

4.3. Multi-Criteria Assessment of Water Conservation Measures

The objectives of implementing water saving measures are primarily to combat water scarcity and water stress and to protect surface and groundwater bodies in order to increase water security and enable sustainable agriculture and rural development. To reach these objectives, as many water saving measures as possible must be implemented to mitigate—at least partially—the expected negative developments described by the scenarios. However, implementing these measures requires different stakeholders to become active, either, for example, by changing their habits, making investments, designing regulations, or building capacity. Not all water saving measures are equally effective and feasible and different stakeholders might differ in their preferences for certain measures. Therefore, to decide where to begin the process towards greater resilience against water scarcity, the most viable and preferred water saving measures for different stakeholder groups should be determined. To this end, the different water saving measures (Table 2) were evaluated against the set of criteria (Table 1), applying different weighting sets representing the attitudes of different stakeholder groups (Table 3). This resulted in rankings of the different water saving measures.
The preferences of the three stakeholder groups established during the second workshop in the form of criteria weightings show significant variations (Table 3. The group of farmers highlighted investment costs (C5) as the most important criterion to evaluate water saving measures, followed by social acceptance (C8). In terms of environmental criteria, water savings (C1) were less important to the farmers than the sustainability of water use (C3) and water quality (C2). Economic benefit (C7) was the criterion assigned the lowest weighting by this group. Unlike the farmers, the stakeholders from local administration considered water savings (C1) as the most important criterion, followed by technical and operational suitability (C4) and investment (C5), as well as operational costs (C6). Sustainability of water use (C3) and social acceptance (C8) were only marginally relevant to the administrative stakeholders. In contrast, for the civil society representatives, social acceptance (C8) was the most important criterion. They also assigned high weightings to the environmental criteria: sustainability of water use (C3), water quality (C2), and water savings (C1). They perceived the economic criteria, including costs and other economic benefits, as less important. In addition to these three sets of preference weightings reflecting the stakeholders’ different priorities, an average weighting across all stakeholder groups was established and incorporated into the multi-criteria assessment (MCA).
The results of the MCA calculations for this average weighting of preferences (Figure 4) show that the preferred options are water conservation measure M1, which describes a change of cropping patterns towards less water-intensive crops (e.g., arboriculture), and the efficiency measure M3, which aims to save water by improving irrigation efficiency. Taking a closer look at the criteria scores, both alternatives perform particularly well in the environmental criteria categories, including contribution to water savings, water quality, and sustainability of water use. However, neither option ranks highly in terms of investment costs. Occupying third and fourth place, M4 (describing a change in irrigation patterns from daytime to night-time) and M2 (focusing on improving conveyance efficiency by changing from the current open earth channels networks to lined channels or pipes) perform better. All these measures are directed at the agricultural sector, which is not surprising as this sector uses the largest share of the available water resources. In contrast, the technical alternatives for saving water in the NOORo solar power plant (T1—T3) are the least preferred alternatives as in comparison to other alternatives these measures do not make a large contribution to water savings and water quality in total, while being at the same time very costly in terms of investment costs. Likewise, the alternatives M8 (harvest of rainwater for irrigation or domestic purposes) and M9 (water savings in urban households) received lower scores, mainly because these alternatives produced much lower water savings and water quality improvements than the other alternatives.
Whether and how the rankings of the water saving measures change when the three different weighting sets for the respective stakeholder groups (farmers, civil society organizations, and representatives of local administration) are applied is shown in Figure 4b–d. When looking at these rankings, it becomes evident that the water saving measures M1 to M4 are among the preferred alternatives for both the civil society group and the administrative stakeholder group. In the farmer group preferences, the ranking differs in terms of M1 (change of cropping patterns) and M3 (improved irrigation efficiency), which do not rank highly. However, M2 (irrigation practices) and M4 (conveyance efficiency) are in the forefront positions like for the other weighting sets. Applying the farmers’ preference weights, the other two water saving measures that also rank highly are M7 (wastewater treatment) and M11 (benefits of aligning the national water and agricultural strategies to achieve water savings). These alternatives score particularly well for the criterion of investment costs—the most important criterion for the farmers group. The application of the different preference weights emphasizes the fact that the recommendation for the alternatives M2 and M4 is consistent even with different preferences, as they are ranked within the top four in all cases.
To check the robustness of these results, a sensitivity analysis was conducted setting C1 (water savings) as the most important criterion (50%) and setting the other criteria at equal importance (7.14%). The result shows that measures M1 to M4 are again at the top of the rankings. Only M2 does not perform as well as the other alternatives, but it still ranks in fifth place after M5 (the implementation of precision agriculture on a large-scale). The multi-criteria evaluation thus provides robust recommendations for water saving measures, and the similar ranking results of the three stakeholder groups, despite their different preferences, offers a solid basis for opening the discussion on ways to implement water saving measures.
In terms of the implementation of the alternatives ranked highest across preference weightings, it should be noted that the water saving measure that would save the most water, M1 (change of crop choice), implies major changes in agricultural practices and its implementation would require a longer time period. Measures that could be implemented more quickly, but also require significant funds, are improvement of irrigation efficiency (M3) and conveyance efficiency (M4). Improving irrigation efficiency by expanding the implementation of more efficient drip irrigation systems is already part of the Moroccan agricultural strategy (Plan Vert). However, according to statements from some local stakeholders, small farmers find it challenging to apply for the support program. In comparison, M2 (changing irrigation practices from daytime to night-time) could, in theory, be implemented more quickly without major costs. However, this measure would require changes in traditional workflows, which might not be easily adopted by the local communities. It should also be noted that there are barriers to the wide-scale introduction of all the preferred measures—and that even the implementation of these measures would still only be a starting point. To increase resilience against the expected negative developments described by the scenarios, even those water saving measures at the bottom of the rankings would have to be considered—and their implementation might be even more challenging.

5. Discussion and Conclusions

The study shows that water supply and demand developments prove to be the most critical components in the analyzed nexus setting, with water ultimately becoming the limiting factor for all other sectors. This is in line with the findings of Hoff et al. [14], who showed that in case studies across the MENA region water scarcity was the dominant component of the nexus. Similarly, Siddiqi and Anadon’s findings [15] at national level show that the share of water used by power systems in the MENA region is low compared to other uses and energy is, therefore, generally not the determining factor. Yet, the power plant itself could be affected by water shortages, as shown by the simulation of Ersoy et al. [50] for potential solar power plants in the region of southern Morocco. The scenarios developed in the present study in conjunction with the local stakeholders show that the extent and frequency of these effects also depend on social and economic developments and the associated water demand in other sectors. Comparable to Johannsen et al. [51], who analyzed water demand under different land use scenarios, the results of this study show that even with major changes towards sustainable water use in the Middle Drâa Valley, the energy and agricultural sectors—and consequently local livelihoods—are likely to be negatively affected by the diminishing water supply.
With regards to the methodological challenges of operationalizing the water-energy-food (WEF) nexus at local level, the participatory approach and the application of both quantitative and qualitative methods allowed for comprehensive analysis, taking into account both the resource and human dimensions of the nexus as called for by Albrecht et al. [28]. However, while the study delivers valuable insights, the research is subject to some limitations. These limitations include the availability of data to quantify and model the water demand scenarios and the water supply. The quantitative results must, therefore, be interpreted with caution—for example, the years when droughts may occur or when water demand cannot be met are potential developments but not predictions. Despite these uncertainties, the overall trend shown in the results is clear: in the long term the demand from the different sectors is unlikely to be met by currently available water supply sources. This indicates that, in addition to the uncertainties with regard to the quantitative results, another critical point is that even in the most ambitious socio-economic water demand reduction scenario, severe water shortages cannot be prevented. This raises the question of whether more radical scenarios should have been chosen. More radical scenarios could, for example, include abandoning agriculture in the Middle Drâa Valley. However, the scenarios in this study were developed in conjunction with local stakeholders and such radical pathways were not anticipated by them in the near future: agriculture is the main source of livelihood in the region and such extreme scenarios would imply significant migration movements. Furthermore, such radical scenarios could have severe ecological and socio-cultural implications for the oases that are beyond the boundaries of this study, but further research should be conducted to investigate the impacts of such radical changes, especially as this type of development cannot be ruled out.
A further aspect that could raise questions is the ranking of measures, as ultimately all measures would have to be implemented to (at least partly) mitigate the expected negative developments of water supply and demand described by the scenarios. However, the implementation of all the measures simultaneously would be unrealistic for a number of reasons including available investment capital, local community acceptance, and required behavioral changes. Furthermore, the implementation of the measures would require the coordination and support of different stakeholder groups. This could be enhanced by the applied participatory multi-criteria-assessment approach, which was underlined by the feedback from local stakeholders who stated that the exchange between stakeholders from different sectors was a new experience for them and contributed to a better understanding of the multi-layered topic and the different positions. The knowledge about possible futures that emerges from this discourse could, therefore, potentially support decision-making actions. In order to pave the way for the preferred water saving measures to be implemented in a next step, further research and discussions with the local stakeholders on governance strategies will be conducted. This further research is in line with the call of Hoff et al. [14] that nexus analysis should go beyond mere identification of technical solutions—it should also provide accompanying institutional and policy-relevant recommendations.
While the focus of this study relied on the water-energy nexus in the Middle Drâa Valley in Morocco, the applied participatory approach to analyze the nexus at local level starting with system mapping, followed by scenario development and analysis and the identification and evaluation of strategies or measures to avoid critical situations or trade-offs, is not site-specific and could potentially be applied to other regions and other energy technologies with site-specific and technology-specific amendments.

Author Contributions

Conceptualization, J.T.-P. and P.V.; formal analysis, J.T.-P. and S.R.E.; investigation, J.T.-P., S.R.E., T.F., S.A., E.M.J. and H.Z.; methodology, J.T.-P. and T.F.; software, S.R.E.; supervision, P.V.; writing—original draft, J.T.-P. and S.R.E.; writing—review and editing, S.R.E., T.F., S.A., E.M.J., H.Z. and P.V. All authors have read and agreed to the published version of the manuscript.

Funding

The authors gratefully acknowledge the financial support of the German Federal Ministry of Education and Research (BMBF) (grant No. 02WGR1430E).

Conflicts of Interest

The authors declare no conflict of interest.

Appendix A. Scenario Details

S1 Business-as-usual scenario (BAU): S1 assumes that there will be no significant changes to current water use patterns in the agricultural sector and no major changes in water use technologies. People’s priorities remain the same and no major policy changes occur. For the agricultural sector, this scenario expects the cultivated area to remain constant as water scarcity limits its expansion. In terms of crop cultivation, cash crop farming (e.g., watermelons and vegetables) for export increases moderately but most farmers continue to cultivate traditional crops. The overall water productivity in the agricultural sector remains low, with average irrigation efficiency remaining constant. The use of groundwater for irrigation and the number of groundwater pumps increase moderately and livestock farming follows the current trend and continues to decrease, which contributes to lowering livelihood security levels in the absence of alternative income generating activities. Also following the current trend, water quality levels (which are already low) are predicted to continue deteriorating up to 2030. With regards to demographics and social development, it is assumed that migration from the region continues due to the lack of employment and economic opportunities in the region. In the rural areas this leads to a declining population, while population in the urban areas continues to increase slightly. Lifestyles and associated water demand do not change significantly in the next decade. In the tourism sector, the number of tourists stagnates, while water use per tourist remains high. In terms of regulations, rural development programs, and subsidy schemes, the current situation continues with the existence of supportive policies and programs—but these are inaccessible to most of the population due to issues such as lack of funding, questions of land rights, and limited technical know-how.
S2 Economic growth first scenario: S2 foresees an increasing use of the limited water resources to foster rural development. The increase in cash crop production and the implementation of modern farming technologies promise short-term economic benefits but result in the overexploitation of water resources. In the agricultural sector, the irrigated area is extended until water scarcity limits further expansion of the cultivated area. In terms of crop types, a significant increase in cash crops for export (watermelons, vegetables, and fruit) is expected. Overall water productivity increases in the agricultural sector as irrigation efficiency increases through the significant extension of drip irrigation systems. To meet the growing water demand for irrigation, the number of groundwater pumps grows significantly, which leads to the overexploitation of groundwater resources. Livestock farming, on the other hand, decreases with more farmers earning their income from cash crops instead of from traditional livestock farming. In terms of water quality, the high groundwater use leads to declining groundwater levels, which contributes to increasing salinity of water for irrigation, water for drinking, and the soil. This further reduces the quality of the drinking water (which is already low) in many areas of the Middle Drâa Valley. The increased salinity also adversely affects the agricultural sector, leading to even higher water demand for irrigation to leach salts past the plant root zone, which ultimately results in decreasing yields. However, with employment and economic opportunities created in the region, migration from the area reduces whilst urban areas continue to grow. In the oases, the current trend is reversed and they experience low but steady growth. With an increase in farm income due to the cultivation of cash crops and multiplier effects for the service sector, lifestyles slowly change, leading to an increase in water consumption per capita. In the tourism sector, water use per tourist remains high, while the number of tourists in the urban centers and oases increases and reverts back to previous levels. Economic development in the agricultural and tourism sectors is supported by corresponding policies and support programs.
S3 Growing sustainability: S3 simulates development within the sustainable limits of the available water resources by applying various water conservation and efficiency measures. The basis for such sustainable development is the strong commitment of the local population to avert the looming water crisis. In the agricultural sector, the cultivated area remains the same and there is a shift towards crops that use less water (such as arboriculture or dry land crops). At the same time, the sector’s water productivity increases significantly through the wide-scale application of drip irrigation technology, which results in higher irrigation efficiency levels compared to today. Groundwater extraction for irrigation is limited to sustainable levels. Livestock remains an integrated part of farming, with animals being used for the provision of fertilizer in the form of manure, for weed control, and as a means of food security for small-scale farmers. However, the numbers of animals are limited to a sustainable level, implying that no more than 15% of biomass production should be used for fodder. With reduced groundwater use and lower evaporation levels due to conveyance efficiency measures, the salinity levels reduce and the water quality slowly improves. Furthermore, wastewater treatment in the urban centers is expanded. Migration from the region is reduced due to improved employment and economic opportunities, urban areas continue to grow, and the oases display slow but steady growth. Water consumption is decoupled from lifestyle changes and remains stable, while water saving measures enhance the quality and availability of water for household consumption. Sustainability becomes an important lifestyle component. This is also visible in the tourism sector, where the number of tourists grows only slightly but the share of sustainable tourism increases. More environmentally aware tourists visit the region and the solar power plant NOORo. Additionally, water saving measures are also implemented in the conventional hotel industry. Policies, programs and awareness campaigns accompany and support the transition to drip irrigation, the cultivation of less water-intensive crops, water re-use, and water saving measures in all sectors.
Table A1. Scenario characteristics.
S1—Business as UsualS2—Economic Growth FirstS3—Growing Sustainability
Agricultural development
Cultivated areaCultivated area remains the same
Water scarcity limits expansion of cultivated area
Irrigated area is extended until water scarcity limits the expansion of cultivated areaCultivated area remains the same
Choice of crop typesCash crop farming for export increases moderately
Water productivity remains low
Increase of cash crop farming for export (watermelons, vegetables, fruit) until water resources are exhausted
Water productivity increases
Shift to crops that use less water like arboriculture/dry land crops
Water productivity increases significantly
Irrigation with groundwaterModerate increase of groundwater use for irrigation and number of groundwater pumpsExploitation of groundwater resources
Use of groundwater for irrigation and number of groundwater pumps increases significantly
Groundwater use limited to sustainable levels
Irrigation efficiencyIrrigation efficiency remains constantIrrigation efficiency increases (extension of drip irrigation)Drip irrigation is significantly extended and increases the irrigation efficiency levels
Livestock numbersLivestock farming continues to decrease, lowering livelihood security levels in the absence of alternative income generating activitiesLivestock farming decreases with more farmers earning their income from cash cropsLivestock remains an integrated part of farming (integrated livestock/agricultural production systems), animals provide fertilizer in form of manure, weed control, and security to small-scale farmers
Numbers of animals is limited to a sustainable level (e.g., fodder production is limited to a certain share of biomass production)
Water qualityAlready low water quality levels continue to deteriorateHigh groundwater use leads to declining groundwater levels, which contributes to increased salinity of:
Irrigation water, which adversely affects agriculture (decreased yields, higher irrigation water demand to leach salts past the plant root zone)
Drinking water, further reducing its (already low) quality
Water quality slowly improves, as salinity levels decrease due to reduced groundwater use and evaporation
Wastewater treatment in the urban centers is maximized
Demographic and social development
Population development (oases/towns)Migration from the region continues due to lack of employment and economic opportunities in the region
Urban areas: continue to grow
Oases: population decline
Migration from the region is reduced due to employment and economic opportunities in the region
Urban areas: continue to grow
Oases: steady growth at lower level
Migration from the region is reduced due to employment and economic opportunities in the region
Urban areas: continue to grow
Oases: steady growth at lower level
Lifestyle developmentsNo significant change in people’s lifestyles and associated water demandCultivation of cash crops leads to an increase in farm incomes and multiplier effects for the service sector
Higher incomes lead to lifestyle changes which increases water consumption per capita
Water consumption is decoupled from lifestyle changes and remains stable
Water saving measures enhance quality and availability of water for household consumption
Sustainability becomes important lifestyle component
Economic development
Tourism sectorVery limited change in the number of tourists
Water use per tourist remains high
Number of tourists in the urban centres and oases increases significantly, reaching former heights
Water use per tourist remains high
Tourist numbers increase slightly
Share of sustainable tourism increases, more environmental-sensitive tourists come to the region to visit the solar power plant NOORo
Higher expenditure per tourist
Water saving measures are also implemented in the conventional hotel industry
Regulations
Regulations, rural development programmes, subsidy schemesSupportive policies and programs exist but are not accessible by the majority due to lack of funding, land right questions, and lack of technical know-howSupportive policies and programs for cash crop production and tourism developmentPolicies, programs, and awareness campaigns to support transition to drip irrigation, cultivation of less water-intensive crops, water re-use, and water saving measures in all sectors

Appendix B. WEAP Model Parameters

The WEAP model consists of eight demand sites: Ouarzazate city, the solar complex NOORo, and six oases: Mezguita, Tinzouline, Ternata, Fezouata, Ktaoua, and Mhamid El Ghizlane. These oases are rural husbandry and agricultural sites and there are seven defined crop types in each oasis that require irrigation water. The model includes the following water supply sites: Tiouine dam, Mansour Eddhabi dam, and six aquifers. The primary irrigation source is the Mansour Eddhabi dam. Drinking water for households in Ouarzazate comes from the Mansour Eddhabi and Tiouine dam, whereas the oases are supplied by groundwater. Table A2 gives an overview of the relevant model parameters.
Table A2. Model parameters.
S1—Business as UsualS2—Economic Growth FirstS3—Growing Sustainability
Agricultural development
Cultivated areaCultivated area: remains the sameCultivated area: 2% increaseCultivated area: remains the same
Share of crop typeswheat: 55%wheat: 30%wheat: 60%
barley: 8%barley: 5%barley: 10%
alfalfa: 14%alfalfa: 9%alfalfa: 10%
henna: 1%henna: 1%henna: 1%
vegetables: 1%vegetables: 10%vegetables: 10%
melons: 5%melons: 20%melons: 2%
dates: 16%dates: 25%dates: 7%
Irrigation efficiencyIrrigation efficiency: remains constant at 65%Irrigation efficiency: increases to 85%Irrigation efficiency: increases to 95%
Livestock farmingLivestock farming: 0.25% decreaseLivestock farming: 2.5% decrease Livestock farming: 0.5% decrease
Demographic and social development
Population development (oases/towns)Urban areas: 2.25% increase
Rural areas: 0.45% decrease
Urban areas: 3% increase
Rural areas: 1% increase
Urban areas: 3% increase
Rural areas: 1% increase
Water use (oases/towns) Urban areas: 18.2 m3/head
Rural areas: 7.3 m3/head
Urban areas: 25.5 m3/head
Rural areas: 11 m3/head
Urban areas: 18.2 m3/head
Rural areas: 11 m3/head
Reservoirs
Sedimentation rateSedimentation rate: 0.7% decreaseSedimentation rate: 1.5% decreaseSedimentation rate: 0.5% decrease
  • Climate data
Daily climate data from 1980–2018 for Zagora has been taken from NASA’s Merra 2 Re-Analysis [52] (GMAO, 2019). All scenarios are based on the climate change scenario RCP 8.5. Compared to the base year 2010, the assumption is that the temperature will increase by 0.9 °C and precipitation will decrease by 8% by 2030 [53] (Christensen et al., 2013). The data for long-term mean precipitation were calculated for 2030 and then interpolated using WEAP. By applying the Water-Year-Method embedded in WEAP software [54] (Sieber, 2015), a statistical analysis of precipitation data was carried out to identify the sequence of dry and wet years.
  • Hydrologic Parameterization
The baseline is historical data from 1984–2011 on river discharge, groundwater resources, reservoir inflow, reservoir evaporation, reservoir volume, and dam capacity [55,56]. It is assumed that the discharge will be reduced by 10% by 2030 as a consequence of climate change [57]. The reference evapotranspiration (ETo) has been taken from FAO’s Wapor [58]. By using the Blaney-Criddle-Method [59], the future increase in evapotranspiration (ETo) was set at 3% in 2030 compared to the base year.
  • Households
Data on population development is shown in Table A2. The future population has been extrapolated in a linear manner. Households have top priority in terms of the water supply.
  • Agricultural Area and Irrigation Requirements
Seven crops are defined for each oasis: wheat, barley, alfalfa, henna, vegetables, melons, and dates [51]. By identifying the crop factor and crop stages, the monthly water demand for each oasis is determined. The agricultural size and crop parameters are summarized in Table A2. Transmission links are set from the river Wadi Drâa to the oases and from the groundwater nodes to the households in the oases. Flow requirements reflect the order in which the oases receive irrigation water. Mhamid El Ghizlane as the last oasis has top priority; Mezguita as the first oasis has last priority. Agricultural nodes have second priority in terms of the water supply.
  • Energy Production
NOORo is linked to the Mansour Eddhabi dam that supplies the power plant annually with 3780 m3/MW [60,61]. Energy production has third priority in terms of the water supply.

References

  1. Rodriguez, D.; Delgado, A.; DeLaquil, P.; Sohns, A. Thirsty Energy, Water Papers; World Bank: Washington, DC, USA, 2013; Available online: http://documents.worldbank.org/curated/en/835051468168842442/Thirsty-energy (accessed on 15 July 2020).
  2. OECD/IEA. Water-Energy Nexus. World Energy Outlook 2016 Excerpt; International Energy Agency: Paris, France, 2016. [Google Scholar]
  3. Macknick, J.; NewmarkSamuel, R.L.; Heath, G.A.; Hallett, K.C. Operational water consumption and withdrawal factors for electricity generating technologies: A review of existing literature. Environ. Res. Lett. 2012, 7, 045802. [Google Scholar] [CrossRef]
  4. Poullikkas, A.; Kourtis, G.; Hadjipaschalis, I. An overview of CSP cooling systems. In Proceedings of the 3rd International Conference on Renewable Energy Sources and Energy Efficiency, Nicosia, Cyprus, 19–20 May 2011. [Google Scholar]
  5. Qin, Y.; Mueller, N.D.; Siebert, S.; Jackson, R.B.; AghaKouchak, A.; Zimmerman, J.B.; Tong, D.; Hong, C.; Davis, S.J. Flexibility and intensity of global water use. Nat. Sustain. 2019, 2, 515–523. [Google Scholar] [CrossRef]
  6. MESIA. Solar Outlook Report 2020; Middle East Solar Industry Association: Dubai, UAE, 2020. [Google Scholar]
  7. DLR. Institute of Solar Research in the EU-Funded Project WASCOP: Soiling Prediction Model, Tests of Mirror Coatings and Innovative Cleaning Methods for Solar Mirrors; German Aerospace Center: Cologne, Germany, 2016; Available online: https://www.dlr.de/sf/en/desktopdefault.aspx/tabid-10436/20174_read-47350/ (accessed on 15 July 2020).
  8. Hightower, M.; Pierce, S.A. The energy challenge. Nature 2008, 452, 285–286. [Google Scholar] [CrossRef] [PubMed]
  9. World Bank. Climate Change in the Middle East & North Africa. 2018. Available online: http://www.worldbank.org/en/programs/menaclimate-change (accessed on 19 December 2019).
  10. Waha, K.; Krummenauer, L.; Adams, S.; Aich, V.; Baarsch, F.; Coumou, D.; Fader, M.; Hoff, H.; Jobbins, G.; Marcus, R.; et al. Climate change impacts in the Middle East and Northern Africa (MENA) region and their implications for vulnerable population groups. Reg. Environ. Chang. 2017, 17, 1623–1638. [Google Scholar] [CrossRef]
  11. Leck, H.; Conway, D.; Bradshaw, M.; Rees, J. Tracing the water–energy–food nexus: Description, theory and practice. Geogr. Compass 2015, 9, 445–460. [Google Scholar] [CrossRef] [Green Version]
  12. Biggs, E.M.; Bruce, E.; Boruff, B.; Duncan, J.M.; Horsley, J.; Pauli, N.; Haworth, B. Sustainable development and the water–energy–food nexus: A perspective on livelihoods. Environ. Sci. Policy 2015, 54, 389–397. [Google Scholar] [CrossRef] [Green Version]
  13. Terrapon-Pfaff, J.C.; Ortiz, W.; Dienst, C.; Gröne, M.-C. Energising the WEF nexus to enhance sustainable development at local level. J. Environ. Manag. 2018, 223, 409–416. [Google Scholar] [CrossRef]
  14. Hoff, H.; Alrahaife, S.A.; El Hajj, R.; Lohr, K.; Mengoub, F.E.; Farajalla, N.; Fritzsche, K.; Jobbins, G.; Özerol, G.; Schultz, R.; et al. A Nexus Approach for the MENA Region—From Concept to Knowledge to Action. Front. Environ. Sci. 2019, 7, 48. [Google Scholar] [CrossRef]
  15. Siddiqi, A.; Anadón, L.D. The water-energy nexus in Middle East and North Africa. Energy Policy 2011, 39, 4529–4540. [Google Scholar] [CrossRef]
  16. Al-Saidi, M.; Schellenberg, T.; Roach, E. Water, Energy and Food Nexus in Egypt-Nexus Country Profile; Nexus Research Focus; TH Köln University of Applied Sciences: Köln, Germany, 2016. [Google Scholar]
  17. Al-Masri, R.A.; Chenoweth, J.; Murphy, R.J. Exploring the Status Quo of Water-Energy Nexus Policies and Governance in Jordan. Environ. Sci. Policy 2019, 100, 192–204. [Google Scholar] [CrossRef] [Green Version]
  18. Terrapon-Pfaff, J.; Fink, T.; Lechtenböhmer, S. The Water-Energy Nexus in Iran: Water-Related Challenges for the Power Sector; Friedrich-Ebert-Stiftung: Bonn, Germany, 2018; Available online: http://library.fes.de/pdf-files/iez/15108.pdf (accessed on 15 July 2020).
  19. Busche, H. Modeling Hydrological Processes in a Semi-Arid Mountainous Catchment at the Regional Scale. Ph.D. Thesis, Universitäts-und Landesbibliothek Bonn, Bonn, Germany, 2013. [Google Scholar]
  20. World Bank. Average Precipitation in Depth (mm per Year). World Bank Open Data. 2014. Available online: https://data.worldbank.org/indicator/AG.LND.PRCP.MM?locations=MA (accessed on 6 February 2020).
  21. Diekkrüger, B.; Busche, H. Impact of global change on hydrology and soil degradation-scenario analysis for the semi-arid Drâa catchment (South Morocco). In River Basins and Change; Janos, J.B., Jan, L., Nachtnebel, H.-P., Eds.; GWSP IPO: Bonn, Germany, 2012. [Google Scholar]
  22. ORMVA. Productions Agricole; Office Régional de Mise en Valeur Agricole: Ouarazazate, Morocco, 2018.
  23. GoM/DGCL. La Région de Drâa-Tafilalet. Monographie Generale. Royaume du Maroc. Ministère de l’Intérieur. Direction Générale des Collectivités Locales. 2015. Available online: http://www.fcs.ma/wp-content/uploads/2016/12/MONOGRAPHIE-DE-LA-REGION-DE-DRAA-TAFILALET-FR.pdf (accessed on 20 December 2019).
  24. MASEN. Projects Map 2018. 2018. Available online: http://www.masen.ma/en/projets/ (accessed on 3 November 2020).
  25. Heidecke, C. Economic Analysis of Water Use and Management in the Middle Drâa Valley in Morocco. Ph.D. Thesis, Universitäts-und Landesbibliothek, Bonn, Germany, 2009. [Google Scholar]
  26. Wuppertal Institute, Germanwatch. Social CSP–Energy and Development: Exploring the Local Livelihood Dimension of the NOORO I CSP Project in Southern Morocco; Final Report to the German Federal Ministry for Economic Cooperation and Development (BMZ); Wuppertal Institute for Climate, Environment and Energy: Wuppertal, Germany; Germanwatch: Bonn, Germany, 2015; Available online: www.wupperinst.org/en/projects/details/wi/p/s/pd/449/ (accessed on 15 July 2020).
  27. Karmaoui, A.; Ifaadassan, I.; Babqiqi, A.; Messouli, M.; Khebiza, M. Analysis of the Water Supply-demand Relationship in the Middle Draa Valley, Morocco, under Climate Change and Socio-economic Scenarios. J. Sci. Res. Rep. 2016, 9, 1–10. [Google Scholar] [CrossRef]
  28. Albrecht, T.R.; Crootof, A.; Scott, C.J. The Water-Energy-Food Nexus: A systematic review of methods for nexus assessment. Environ. Res. Lett. 2018, 13, 043002. [Google Scholar] [CrossRef]
  29. De Strasser, L.; Lipponen, A.; Howells, M.; Stec, S.; Bréthaut, C. A Methodology to Assess the Water Energy Food Ecosystems Nexus in Transboundary River Basins. Water 2016, 8, 59. [Google Scholar] [CrossRef]
  30. Mohtar, R.H.; Lawford, R. Present and future of the water-energy-food nexus and the role of the community of practice. J. Environ. Stud. Sci. 2016, 6, 192–199. [Google Scholar] [CrossRef]
  31. Hoolohan, C.; Larkin, A.; McLachlan, C.; Falconer, R.; Soutar, I.; Suckling, J.; Scott, M. Engaging stakeholders in research to address water-energy-food (WEF) nexus challenges. Sustain. Sci. 2018, 13, 1415–1426. [Google Scholar] [CrossRef] [Green Version]
  32. Bielicki, J.M.; Beetstra, M.A.; Kast, J.B.; Wang, Y.; Tang, S. Stakeholder Perspectives on Sustainability in the Food-Energy-Water Nexus. Front. Environ. Sci. 2019, 7, 7. [Google Scholar] [CrossRef] [Green Version]
  33. Pittock, J.; Dumaresq, D.; Bassi, A.M. Modeling the Hydropower–Food Nexus in Large River Basins: A Mekong Case Study. Water 2016, 8, 425. [Google Scholar] [CrossRef] [Green Version]
  34. GoC. Horizons Foresight Method: System Mapping. Government of Canada. 2016. Available online: https://horizons.gc.ca/en/our-work/learning-materials/foresight-training-manual-module-4-system-mapping/ (accessed on 15 July 2020).
  35. Zhang, W.; Gowdy, J.; Bassi, A.M.; Santamaria, M.; DeClerck, F.; Adegboyega, A.; Andersson, G.K.S.; Augustyn, A.M.; Bawden, R.; Bell, A.; et al. Systems thinking: An approach for understanding ‘eco-agri-food systems’. In TEEB for Agriculture & Food; Scientific and Economic Foundations: Geneva, Switzerland, 2018. [Google Scholar]
  36. World Bank. Participatory Scenario Development Approaches for Identifying Pro-Poor Adaptation Options: Capacity Development Manual; Discussion Paper 19; World Bank: Washington, DC, USA, 2010. [Google Scholar]
  37. McBride, M.F.; Lambert, K.F.; Huff, E.S.; Theoharides, K.A.; Field, P.; Thompson, J.R. Increasing the effectiveness of participatory scenario development through codesign. Ecol. Soc. 2017, 22, 16. [Google Scholar] [CrossRef] [Green Version]
  38. Kok, K.; Biggs, R.O.; Zurek, M. Methods for Developing Multiscale Participatory Scenarios: Insights from Southern Africa and Europe. Ecol. Soc. 2007, 12, 8. [Google Scholar] [CrossRef] [Green Version]
  39. Walz, A.; Lardelli, C.; Behrendt, H.; Grêt-Regamey, A.; Lundström, C.; Kytzia, S.; Bebi, P. Participatory scenario analysis for integrated regional modelling. Landsc. Urban Plan. 2007, 81, 114–131. [Google Scholar] [CrossRef]
  40. Reed, M.; Kenter, J.; Bonn, A.; Broad, K.; Burt, T.; Fazey, I.; Fraser, E.; Hubacek, K.; Nainggolan, D.; Quinn, C.; et al. Participatory scenario development for environmental management: A methodological framework illustrated with experience from the UK uplands. J. Environ. Manag. 2013, 128, 345–362. [Google Scholar] [CrossRef] [PubMed] [Green Version]
  41. Volkery, A.; Ribeiro, T.; Henrichs, T.; Hoogeveen, Y. Your Vision or My Model? Lessons from Participatory Land Use Scenario Development on a European Scale. Syst. Pract. Action Res. 2008, 21, 459–477. [Google Scholar] [CrossRef]
  42. Kosow, H.; Robert, G. Methods of Future and Scenario Analysis: Overview. Assessment, and Selection Criteria; German Development Institute: Bonn, Germany, 2008. [Google Scholar]
  43. Mateo, J. Multi Criteria Analysis in the Renewable Energy Industry; Springer Science & Business Media: Berlin, Germany, 2012. [Google Scholar]
  44. Munda, G. Social Multi-Criteria Evaluation for a Sustainable Economy; Springer: Berlin, Germany, 2008. [Google Scholar]
  45. Stirling, A. Analysis, participation and power: Justification and closure in participatory multi-criteria analysis. Land Use Policy 2006, 23, 95–107. [Google Scholar] [CrossRef]
  46. Malczewski, J. GIS and Multicriteria Decision Analysis; John Wiley & Sons: Chichester, UK, 1999. [Google Scholar]
  47. Stillwell, W.G.; Seaver, D.A.; Edwards, W. A comparison of weight approximation techniques in multiattribute utility decision making. Organ. Behav. Hum. Perform. 1981, 28, 62–77. [Google Scholar] [CrossRef]
  48. Yoon, K.P.; Hwang, C.L. Multiple Attribute Decision Making: An Introduction; Sage Publications: New York, NY, USA, 1995. [Google Scholar]
  49. UNEP. Harnessing Opportunity Wastewater as a Managed Resource. United Nations Environment Programme. 2017. Available online: http://wedocs.unep.org/bitstream/handle/20.500.11822/17679/harnessing_opportunity_wastewater.pdf?sequence=1&isAllowed=y (accessed on 15 July 2020).
  50. Ersoy, S.R.; Terrapon-Pfaff, J.; Ribbe, L.; Merrouni, A.A. Water Scenarios Modelling for Renewable Energy Development in Southern Morocco. J. Sustain. Dev. Energy Water Environ. Syst. 2021, 9, 1080335. [Google Scholar] [CrossRef]
  51. Johannsen, I.M.; Hengst, J.C.; Goll, A.; Höllermann, B.; Diekkrüger, B. Future of Water Supply and Demand in the Middle Drâa Valley, Morocco, under Climate and Land Use Change. Water 2016, 8, 313. [Google Scholar] [CrossRef] [Green Version]
  52. GMAO. MERRA-2 tavg1_2d_slv_Nx: 2d, 1-Hourly, Time-Averaged, Single-Level, Assimilation, Single-Level Diagnostics V5.12.4. Goddard Earth Sciences Data and Information Services Center (GES DISC). Global Modeling and Assimilation Office; 2019. Available online: http://www.soda-pro.com/de/web-services/meteo-data/merra (accessed on 5 June 2019).
  53. Christensen, J.H.; Kanikicharla, K.K.; Aldrian, E.; An, S.I.; Cavalcanti IF, A.; de Castro, M.; Kitoh, A. Climate phenomena and their relevance for future regional climate change. In Climate Change 2013 the Physical Science Basis: Working Group I Contribution to the Fifth Assessment Report of the Intergovernmental Panel on Climate Change; Cambridge University Press: Cambridge, UK; New York, NY, USA, 2013; pp. 1217–1308. [Google Scholar]
  54. Sieber, J.; Purkey, D. WEAP—Water Evaluation and Planning System: User Guide; Stockholm Environment Institute: Somerville, MA, USA, 2015; Available online: https://www.weap21.org/downloads/WEAP_User_Guide.pdf (accessed on 10 June 2019).
  55. ABH. Bilan hydraulique et fiche technique du reservoir Mansour Eddhabi, Tiouine et la nappe de Zagora; Agence du Bassin Hydraulique: Zagora, Moroccco, 2019. [Google Scholar]
  56. Fink, A.; Reichert, B.; Christoph, M. West Africa an Integrated Approach to the Efficient Management of Scarce Water Resources in West Africa. In Impetus Atlas Morocco: Research Results 2000–2007, 3rd ed.; Schulz, O., Judex, M., Eds.; University of Bonn: Bonn, Germany, 2008; Available online: http://www.impetus.uni-koeln.de/en/impetus-atlas/impetus-atlas-morocco.html (accessed on 10 June 2019).
  57. Ducrocq, V.; Drobinski, P.; Gualdi, S.; Raimbault, P. Sub-chapter 1.2.1. The water cycle in the Mediterranean. In The Mediterranean Region under Climate Change: A Scientific Update; Moatti, J., Thiébault, S., Eds.; IRD Éditions: Marseille, France, 2016. [Google Scholar] [CrossRef]
  58. WaPOR. Reference Evapo Transpiration (Dekadal). 2019. Available online: https://wapor.apps.fao.org/catalog/1/L1_RET_D (accessed on 10 June 2019).
  59. FAO. Irrigation Water Management: Irrigation Water Needs. Training Manual, 3. Chapter 3: Crop Water Needs. Food and Agriculture Organization of the United Nations. 1986. Available online: http://www.fao.org/3/s2022e/s2022e07.htm (accessed on 10 June 2019).
  60. MASEN. Case Study: Masen NOOR Ouarzazate Solar Complex. 2017. Available online: http://cmimarseille.org/menacspkip/wp-content/uploads/2017/08/Youssef_Stitou_MENA_CSP_KIP_Jordan_Workshop_25_July_2017.pdf (accessed on 18 March 2019).
  61. Capitals 5. NOORo IV Ouarzazate 70 MW Photovoltaic Power Project Kingdom of Morocco: Specific Environmental and Social Impact Assessment Vol 2: Main Text. 2017. Available online: http://www.masen.ma/sites/default/files/documents_rapport/2_4.pdf (accessed on 10 June 2019).
Figure 1. Overview of the research approach and stakeholder participation.
Sustainability 13 00108 g001
Figure 2. System map of water supply and demand in the Middle Drâa Valley.
Sustainability 13 00108 g002
Figure 3. Water demand scenarios for the Middle Drâa Valley (bold lines) and water availability in Table 2030.
Sustainability 13 00108 g003
Figure 4. Ranking of water saving measures for different weighting sets: (a) average weighting; (b) farmers preference weighting; (c) civil society preference weighting; and (d) local administration preference weighting.
Sustainability 13 00108 g004aSustainability 13 00108 g004b
Table 1. Criteria set.
Category CriterionShort Description
EnvironmentC1Water savingsThis criterion estimates the amount of water that could potentially be saved (through both conservation and efficiency measures) by the chosen alternative if implemented on a large scale. The higher the potential, the more preferable the option.
C2Water qualityThis criterion refers to the estimated impact on water quality by the chosen alternative—the ability of the option to improve water quality. The higher the potential, the more preferable the option.
C3Sustainability of water useThis criterion takes the different sustainability degrees of each alternative into account. In particular, the alternatives that do not involve groundwater overexploitation but favor the use of renewable water resources are preferred.
TechnologyC4Technical and operational suitabilityThis criterion is related to the suitability of the technology or political instrument for implementation in the Middle Drâa Valley. The higher the suitability (feasibility and viability), the more preferable the option.
EconomicC5Investment costThis criterion corresponds to the estimated initial investment for implementing an alternative. The lower the cost, the more preferable the option.
C6Operation & maintenance costsThis criterion captures the on-going expenses that a measure entails; for example, for maintenance. The lower the cost, the more preferable the option.
C7Economic benefit This criterion measures the on-going beneficial effects of the measure; for example, through profits from the export of cash crops or money saved through reduced water consumption.
SocialC8Social acceptanceThis criterion estimates the level of social acceptance and willingness of the local community to support the chosen alternative—also based on its compatibility with traditional practices.
Table 2. Water saving measures.
CategoryMeasureShort Description
Water conservation measuresM1Crop choiceThis measure simulates a change in cropping patterns towards less water-intensive crops (e.g., arboriculture).
M2Irrigation practiceThis measure describes the change in irrigation patterns from daytime to night-time irrigation, which can reduce water losses due to evaporation.
Water
efficiency measures
M3Irrigation efficiencyThis measure assumes an improvement in irrigation efficiency by applying drip irrigation.
M4Conveyance efficiencyThis measure covers improvements in conveyance efficiency from current open channel networks (60% efficiency) to lined channels (80% efficiency) or pipes (95% efficiency).
M5Precision agricultureThis measure covers the implementation of precision agriculture on a large scale, increasing water efficiency in the agricultural sector from the current relatively low levels.
M6DesalinationThis measure aims to install desalination units as the high salinity levels of the water in the Drâa Valley is hindering agricultural production. Desalinated water can be used for irrigation to improve water productivity or as drinking water.
M7Wastewater treatmentThis measure describes the re-use of treated wastewater as alternative source of irrigation and drinking water.
M8Rainwater harvestThis measure covers the harvest of rainwater for irrigation purposes and as a domestic water source.
M9Water savings in urban householdsThis measure assumes water savings in the growing urban population by installing water saving appliances.
M10Water savings in the tourism sectorThis measure aims to reduce the per capita water use in the tourism sector.
Water
policies
M11Aligning national water & agricultural strategiesThis measure aims to eliminate inconsistencies and contradictions between the “Plan Maroc Vert” and the national water policies.
M12Regulatory interventionsThis measure designates regulatory changes to either legally limit the cultivation of water-intensive crops or provide subsidies for the cultivation of less water-intensive crops.
M13Information campaignThis measure aims to provide more information and increase knowledge about water saving technologies to allow users to make informed decisions regarding investments in technologies.
M14Conservation-oriented water chargesThis measure aims to introduce water charges to reduce water use in agriculture.
Technical measures: solar power plantT1Conversion of NOORo 1 to wet/dry hybridThis measure simulates the introduction of novel hybrid dry/wet cooling technology, which could save up to 80% of water compared to wet only cooling without compromising performance.
T2Reducing cleaning water consumption NOORo I-IVThis measure covers the optimized cleaning schedules and implementation of devices that cut water consumption for cleaning.
T3Maximize reduction of water consumption for cooling and cleaningThis measure describes the maximum reduction of water consumption in the solar power plant through the application of the latest technological innovations in both cooling and cleaning, as well as an additional reduction through the internal re-use of water.
Table 3. Preference weightings.
Criteria Average Farmers GroupCivil Society GroupLocal Administration
C1Water savings0.160.080.110.34
C2Water quality0.190.110.150.08
C3Sustainability of water use0.120.150.210.03
C4Technical and operational suitability0.110.050.050.21
C5Investment cost0.090.340.080.15
C6Operation & maintenance costs0.100.030.030.11
C7Economic benefit 0.120.020.020.05
C8Social acceptance0.120.210.340.02
Sum 1111
Publisher’s Note: MDPI stays neutral with regard to jurisdictional claims in published maps and institutional affiliations.

