1. Introduction
Signboards (outdoor advertisements) traditionally provide information about stores and help consumers make decisions on purchasing goods when consumers tour cities or engage in consumer activities. Consumers accept visually presented information through their eyes. At this time, if the visual elements of the signboard are made in conformity with the consumer’s visual principles, the consumer at some point recognizes that the signboard has already been perceived and processed for memory [
1]. As such, signboards are crucial elements of commercial streets and may be one of the most effective ways of delivering information.
The signboard is one of the characteristics of the streetscapes of Korean commercial districts. In particular, in places such as Seoul where there is an excessive population and commercialization density, the indiscriminate signboards for advertisements of stores located on commercial streets raise aesthetic issues. Yoon [
2] found that experts in the project for street maintenance selected signboard arrangement as the most essential issue. To solve this problem, Seoul sought to improve the aesthetics of the city by implementing regulations on the quantity and size of outdoor advertising signs through its campaign, "Creating Beautiful Streets". However, regarding these regulations, the shop owners were concerned about negative impacts in terms of advertising effects, resulting in backlash.
So far, in various studies related to signboards in Korean cases, signboards have been generally discussed as a negative factor. Research shows that indiscriminately designed signboards have a visually negative effect on streetscapes [
3]. As the number and types of signboards increase, the aesthetic value decreases, and a decrease in signboards seems to increase pleasantness [
4,
5,
6]. The signboards of stores can be a negative influence on the aesthetic of the streetscape yet are essential to commercial streets. The importance of such signboards also appears in Kim et al. [
7], where signboards are the most urgent negative factor that needs improvement, even while they are the most impressive factor to note. Many studies have thus sought to find improvements in signboard management.
Kim et al. [
8] focused on the direction of signboard management for streetscapes. First, the size, surface, color, quantity, and lighting of signboards may not be suitable for street environments, so guidelines need to be improved. Second, the materials and lighting of signboards need improvement. Third, restrictions on new methods such as occupancy on the building surface regarding the installation of signboards in relation to the legal system are effective, as well as to focus on the design aspect rather than quantitative regulation and make use of local characteristics. In this context, many other studies indicated that it is important to establish a consistent management system to harmonize with the existing environment and to deliver a unified image reflecting the unique identity of each industry by region [
9,
10,
11,
12]. Meanwhile, the continuity and unity of the signboard in the streetscape are emphasized in the literature. Cho [
13] said that the signs’ size and spacing should be constant to give a sense of unity, suggesting several colors or using similar colors to give a sense of unity and rhythm. Additionally, the colors of the surrounding buildings must be considered to keep harmony with the colors of the signboards and colors that provide psychological stability and pleasure [
12]. In terms of visual continuity, it is necessary to consider continuity between facades considering the behavior, color, and material of the facade in order to convey the pedestrian’s horizontal use or effective advertising purpose. Lee and Song [
14] found it is necessary to secure horizontal continuity that fits the movement and gaze of pedestrians rather than vertical continuity at the lower and upper floors.
Then why are signboards so important in commercial streets? Signboards serve as a medium for mutual communication and advertisements. However, in modern urban streets, signboards are an important factor in determining the streetscape beyond simple means of information delivery [
11]. In this study, the importance of signboards is to be investigated whether or not they form an active image of the street visually rather than transmitting information. Commercial streets should be attractive, and visitors should feel that the street is active. Among the sensory organs of people, the dependence on vision is absolute, and visual vitality is generated through the perception of the physical environment of the streetscape.
According to Gestalt theory, perception in morphology is understood as a holistic process. In other words, the physical elements that form the streetscape are perceived as a single scene, rather than individually [
15]. The main laws of Gestalt psychology concern proximity, similarity, continuity, closedness, simplification, equivalence, foreground and background, and familiarity. Among them, the foreground and background are mainly discussed in urban landscapes. Within given visibility, certain forms or objects stand out and others do not attract attention. The outstanding form is called the foreground, and other elements are called the background [
15]. The foreground and the background also appear variously in street space. The first thing a pedestrian sees when walking along the street would be a building that is consecutively built along the side of the street. If you look at the building as the foreground, the sky and the floor will naturally become the background. After that, if you observe the interior in detail, the building becomes the background, the signboards, windows, and show windows in the building become the foreground, or the green space such as a street tree in the street may be the foreground and other things will be the background. As such, the signboard in the streetscape has a strong character of being a foreground element. The foreground element induces people’s attention and interest and can inspire vitality in the street. Chen [
16], as a result of simulation of pedestrian behavior, found signboards attract pedestrians’ interest and induce behavior.
The signboard itself can be an attractive element that attracts people’s attention, serves as a foreground, and infuses people’s interest and street vitality as part of the streetscape. Therefore, this study examines whether there is a difference in interest or vitality felt in the streets according to people’s gaze patterns on signboards for representative commercial streets in Seoul and provides implications for the future function and importance of signboards in streetscape management of the commercial street.
2. An empirical Approach to Landscape Analysis
People are affected by the physical environment of the city. The environment is perceived and the relationship between the environment and people is established. A Zube et al. [
17] model shows feedback on what people find interesting and impressive in their interactions with the physical environment. By studying the interactions with each other and the contents that occur within them, implications for a better urban environment can be found. The landscape is a form of physical space, and humans see and perceive the landscape through sight and subjectivity. However, since humans observe landscapes based on personal, social, cultural, and environmental characteristics, even spaces with the same physical conditions can be perceived differently depending on the characteristics of humans or groups. Lynch [
18] would be a representative researcher who, through mapping, has found out how people perceive images of the cities they live in. He conducted an analysis of the city’s image through “cognition”, which stems from people’s experiences or memories of a particular environment and is the process of creating likes and dislikes. Cullen [
19] is a representative researcher regarding the urban environment and people’s visual perspective. He perceived the urban landscape from a continuous perspective and said that the urban landscape should be designed from a visual perspective.
Craik [
20] set the framework for a research methodology that measures and analyzes people’s responses to the environment. A methodology was prepared to measure how people think about the environment through four factors: “Environmental Displays”, “Media of Presentation”, “Observers”, and “Response Formats”. The perception-based method targeting the general public emphasizes the aspect of the observer, the human, on quality of the landscape, and is an evaluation of the landscape based on visual perception [
21,
22,
23]. However, this methodology has its limitations because there is no consensus on what the aesthetic quality of the landscape is. Accordingly, Vining and Stevens [
24] presented a model that requires dual feedback from the expert and the public on the landscape. Landscapes that visually evoke positive feelings are evaluated as of high quality, and landscapes that evoke negative feelings are evaluated as low quality. It is necessary to objectively measure the visual quality of subjective values, which leads to the methodology of eye-tracking. However, the concentration of the gaze is not necessarily a positive signal. Therefore, a subjective survey must be conducted together to supplement this limitation. Eye-tracking is mainly used in fields such as interfaces and advertisements, but it has also been introduced in landscape-related fields and research is ongoing. Existing researches related to streetscape mainly rely on surveys from people’s perceptions. This method has limitations because the data is measured based on the overall feeling, not knowing where people look specifically to feel that way.
Various studies analyzed the landscape and the perspective of people. As a result of analyzing the landscape bordering the river, the study in Cottet et al. [
25] found that nature has a longer time of fixed gaze in urban and natural scenes. In addition, Holmes and Zanker [
26] demonstrated the correlation between aesthetic preference and average gaze fixation time. Looking at the contents of these two studies, it is likely that those with high aesthetics like nature will have a high gaze-inducing effect. However, being natural does not necessarily mean that the gaze fixation effect is high. People’s gazes are the focused points in the landscape is a point factor. Among the landscape elements, the elements that focus people’s attention are the ones that are emphasized. A transition phenomenon occurs where the natural environment becomes a visual attention factor in artificial facilities and artificial facilities become a visual attention factor in natural environments [
27,
28]. The study by Li et al. [
29] shows that the attention is focused on the letters at the sign or entrance in the streetscape, and the more understandable the letters are, the higher the eye fixation is. Elements such as letters on a signboard have a higher amount of information than a picture or a simple wall, and in order to understand this, the human eye causes fixation of the gaze. Since store information transmission is an important factor in selling products, gaze distribution studies on signboards, displays, and directions during shopping were also conducted [
30,
31].
Landscape analysis has been carried out by various methodologies so far, and it has reached the stage of analyzing by tracking a person’s gaze. As a result of reviewing previous studies, fixation of gaze in the landscape is an element that becomes a point, and in the case of a streetscape, signboards, and letters can become the point. A high gaze fixation effect means that visual communication is active, which can be an element that can induce interest in people. Therefore, it is believed that the analysis can provide more precise implications for landscape design by using a questionnaire survey, which is subjective data, and distribution of gaze, which is objective data, and this study proceeds with the following methodology.
3. Methods
3.1. Design
In this study, the following methodology was carried out to determine whether signboards influence the formation of active street images. First, photographs of streetscapes are taken for various commercial streets, and images suitable for eye-tracking experiments are selected. Second, the Image J program is used to measure the area of the signboard to classify the area of the signboard in the streetscape. This program can measure the area of a picture in pixels. Third, an eye-tracking experiment is conducted by recruiting experimenters and conducting a survey after the experiment. Finally, a statistical analysis was conducted to see if people feel a difference in the active image of the streetscape depending on the sign.
This study selects Jonggak, Insa-dong, Myeong-dong, Garosu-gil, and Gangnam as the most representative commercial areas of Seoul (
Table 1). These five sites are located in the city center and Gangnam and represent commercial districts that attract both Koreans and international tourists. Jonggak, Insa-dong, and Myeong-dong are roads for mixed use, with a D:H scale of less than 2 and more than 2. Garosu-gil and Gangnam are basically separate roads for pedestrians, but there are roads for mixed pedestrians on the back road. In the case of D:H scale, Garosu-gil is a human-scale street and Gangnam is a massive scale street. The sites are suitable for extracting streetscape samples from the perspective of the street structure because they are separated and mixed with road and have various D:H scales. Eye-tracking experimental photographs were randomly taken throughout the entire section of the street through field trips in sites.
3.2. Photograph Experiment
Pedestrians in the pictures were deleted for the streetscape research. Therefore, this excludes locations where photo correction could not be performed in the future due to the narrow width and large floating population. The shooting was done on a clear day with a Canon D100 camera and an 18 mm lens at a height of 1.5 m at the center of the street or at the center of the walkway. When a person walked on the street, the streetscape structure changed frequently, depending on where the person was or according to the movement of the head. However, due to the nature of walking forward, the eyes were mostly fixed towards the front. Therefore, in this study, the photo was taken from the center of the street (sidewalk) pointing to the front, assuming that the pedestrian stared at the center of the street or the center of the pedestrian path. For one month in September 2019, the researchers visited the site in person, and a total of 133 photos were taken. Thereafter, a total of 23 photos were selected for the eye-tracking experiment through a screening process, and in the analysis of this study, 17 photos were finally selected except for photos without signs (
Table 2). Based on the pixel area, images with more than 10% signboard area compared to the total area were grouped as high sign groups (HSG), and images with less than 10% are selected to be low sign groups (LSG).
3.3. Participants and Apparatus
This study was approved by the Institutional Review Board (IRB) of the University’s Institutional Bioethics Committee for the purpose of the eye-tracking experiment and survey. Participants were then recruited for the experiment. Participants had to have no vision problems, but those who wore glasses could participate. Due to the characteristics of the five sites mainly used by young people, participants in their 20s and 30s conducted experiments in March and April 2020. At the time the experiment was conducted, it was difficult to recruit external participants due to COVID-19. So, the recruitment of test subjects was mainly conducted within urban engineering students and experts who work in the same field, and the rest from the general public. Finally, a total of 41 people, including 26 majors, 15 of which were non-Communists, participated in the eye-tracking experiment and survey.
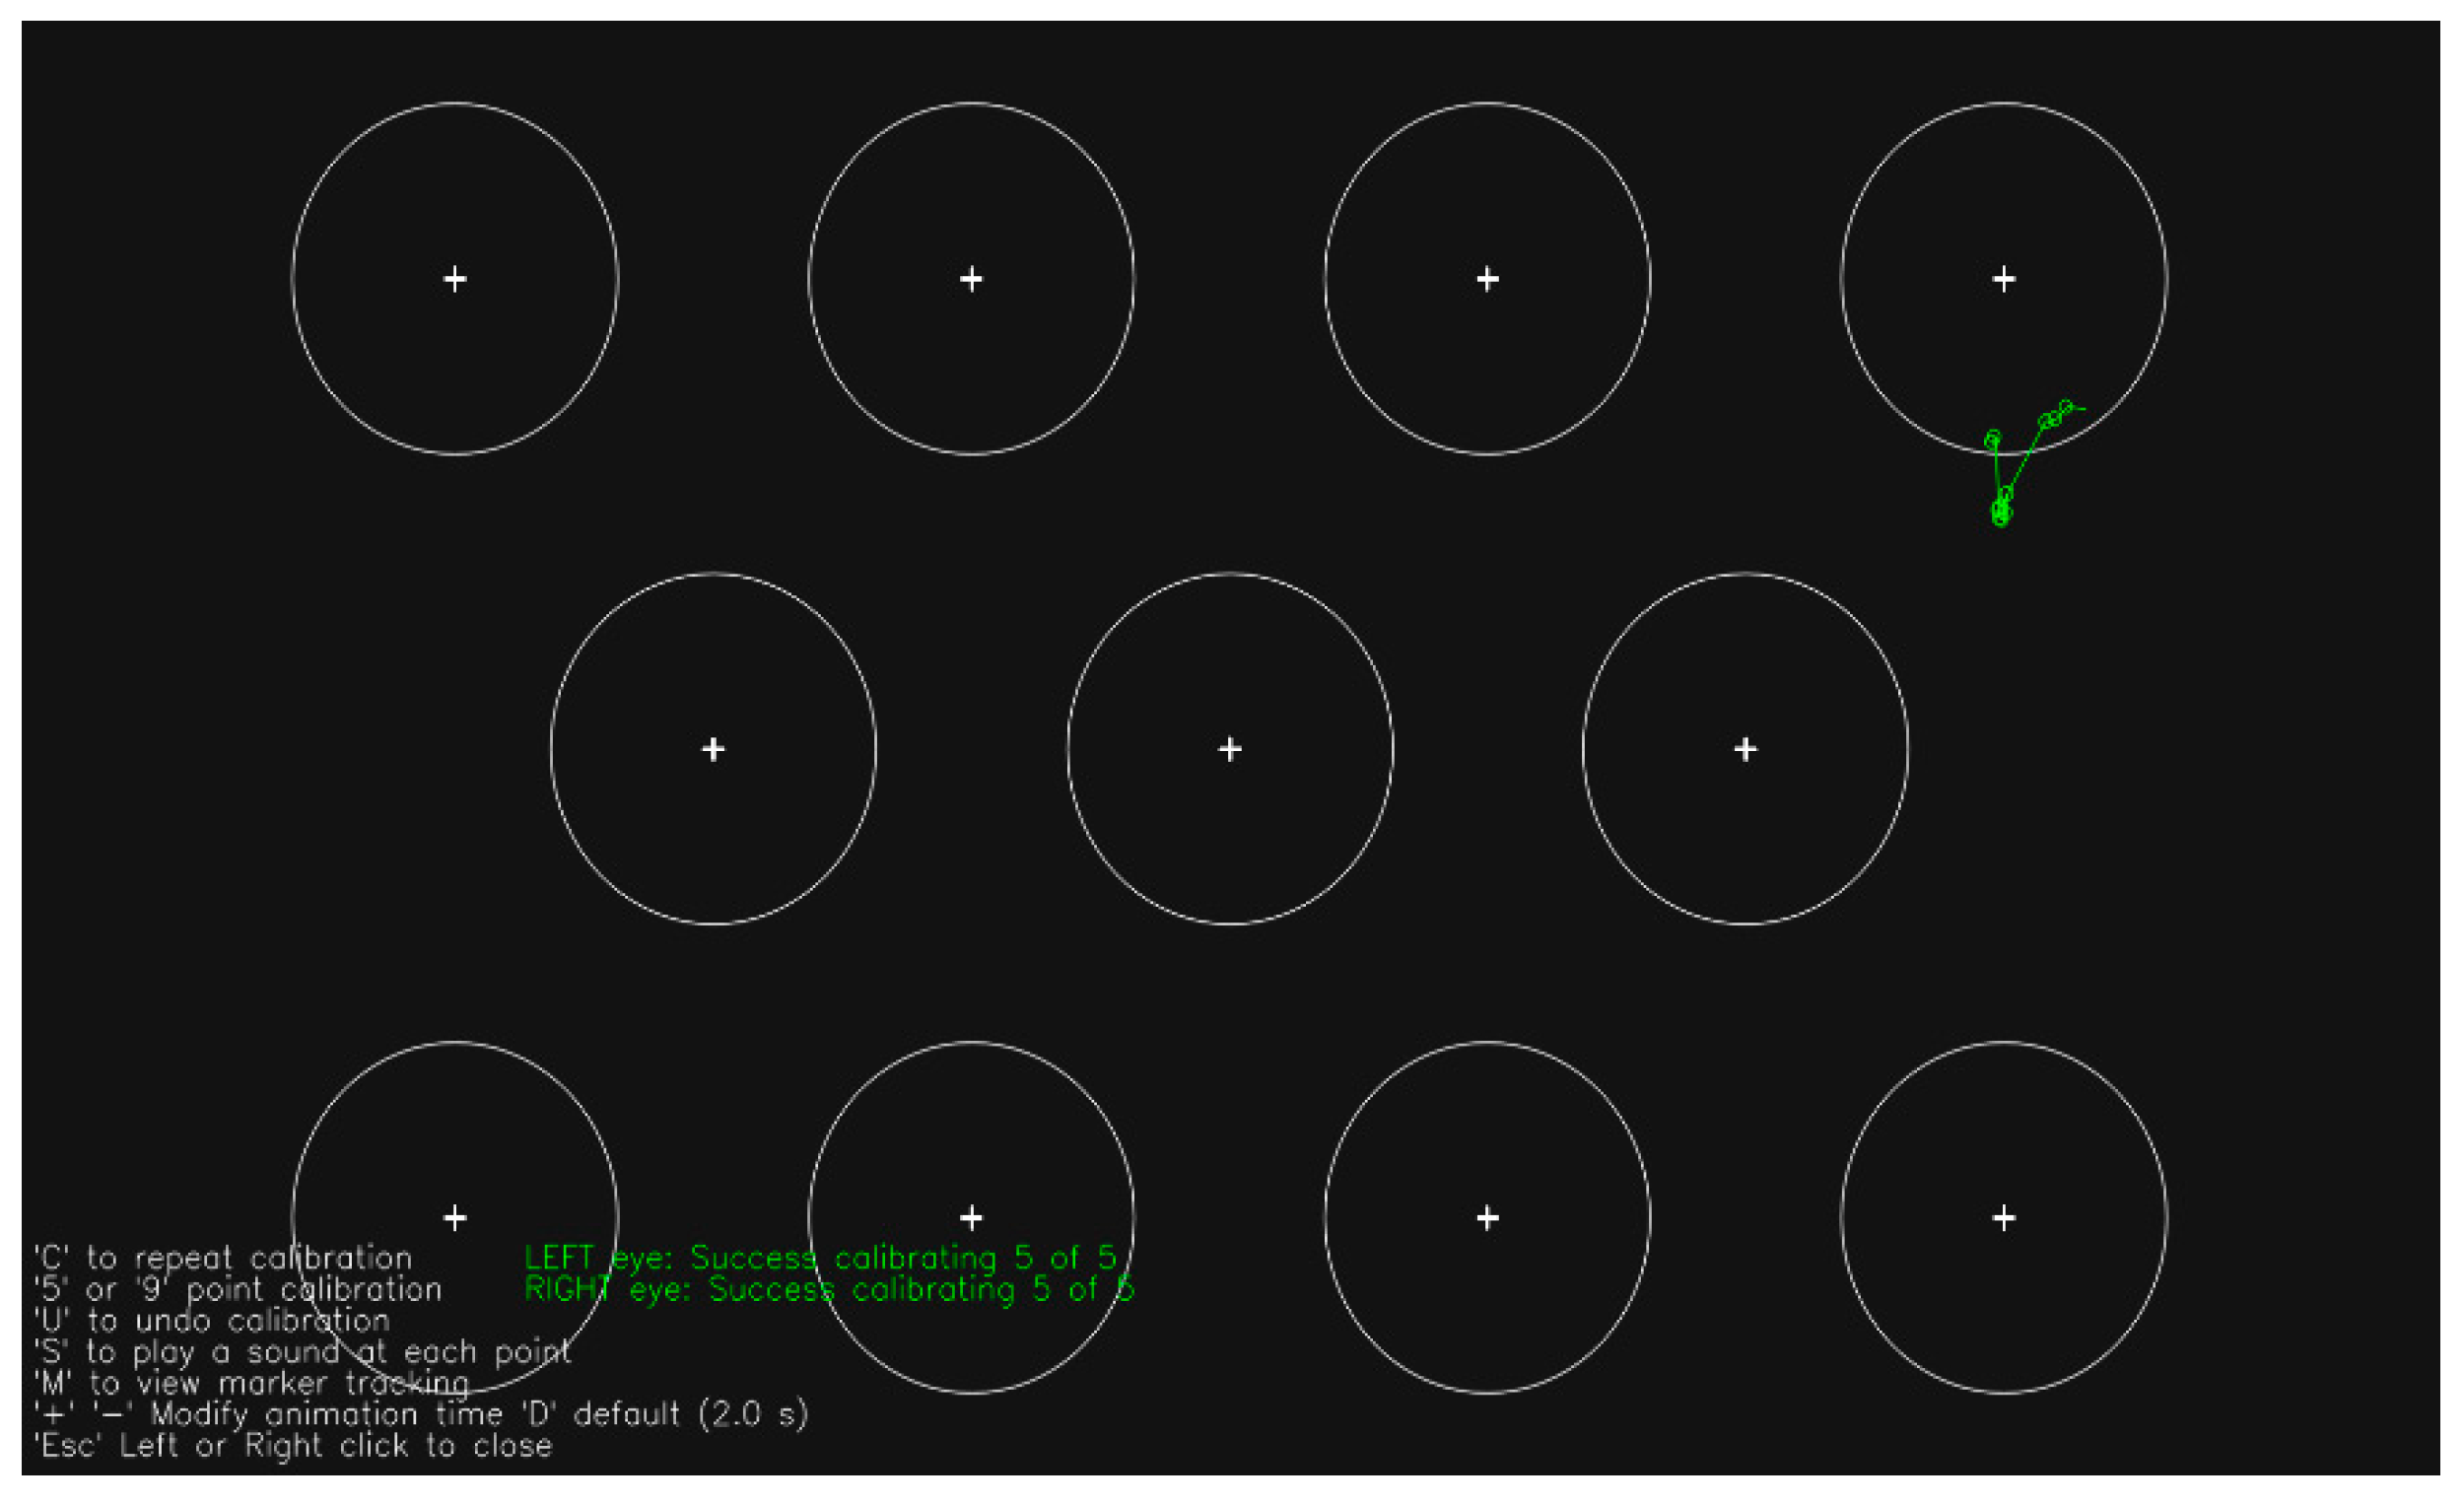
The eye-tracker device used was the GP3 HD Eye Tracker, from Gagepoint. The device is a fixed eye-tracker capable of measuring eyeball movement at 150 Hz per second. After the eye-tracker was installed on a 24-inch monitor, the distance between the participant and the monitor was set at 40–60 cm. Before the experiment, a calibration task was performed to properly fix the eyes of the participants to the camera of the eye tracker (
Figure 1). Calibration is to adjust the distance and height between the eye and the eye-tracker so that the eye-tracker recognizes the eye of the participant.
Figure 1 shows that the eye-tracker recognizes the participant’s pupils and appears in green. The next step in viewpoint adjustment is to test whether the eye tracker properly recognizes the participant’s pupil. The test is a method of checking whether the green cursor moves exactly to the participant’s viewing position by looking at the screen with 11 circles drawn on the monitor and moving their gaze (
Figure 2). If the cursor moves differently from the participant’s gaze, the viewpoint is adjusted again and tested.
Before showing the picture, a situation is assumed where the experimenter visits the commercial street in the picture and walks the streets and looks around freely. Participants looked at the experimental photos for 10 s per photo and conducted eye-tracking tests. After the eye-tracking experiment was over, they filled out a questionnaire for the photos. The total required time for this survey including the eye-tracking and questionnaire took 30–40 min.
3.4. Data Processing
The data obtained from the experiment was exported in a CSV file format and checked whether it is properly measured. Since the device used in the experiment measures 150 hz per second, about 1500 gaze data were secured for 10 s per photo. However, as a result of the review, there were participants whose data were collected less than 1500. As a result of checking the recorded eye-tracking gaze video, there was a case where the participant’s posture was excessively disturbed and changed from the initial viewpoint adjustment and the eye-tracker missed the participant’s pupil due to the nature of the fixed eye-tracker. In addition, when wearing thick plastic glasses or earrings, the eye tracker recognized the part as a pupil due to the reflection and was measured incorrectly. 33 of the 41 participants’ data of the experiment were finally used in the analysis, except for those samples whose eyes were incorrectly measured or did not respond to further surveys.
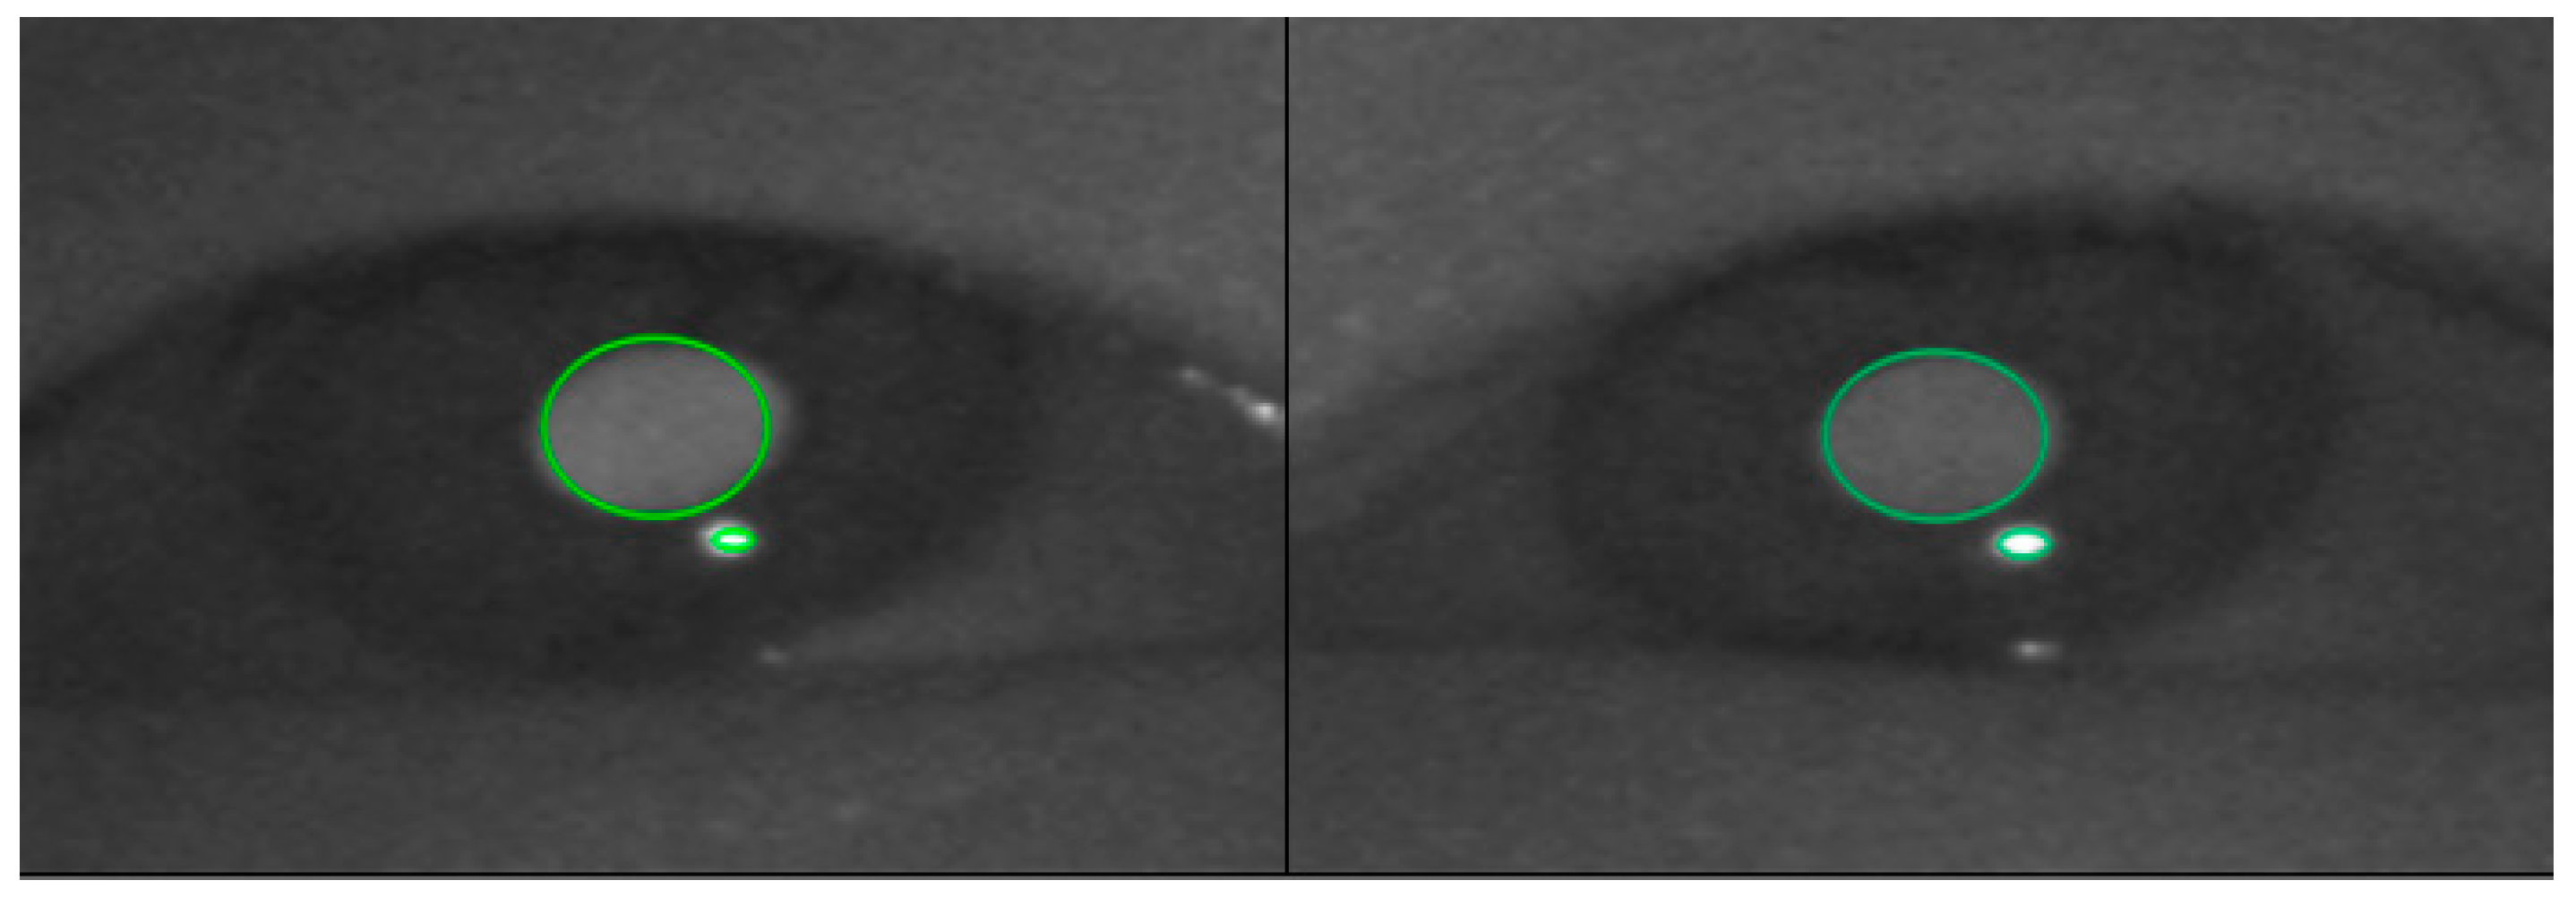
Eye-tracking collects data on eye movements. For each image, the “number of fixations,” “fixation time,” and “Saccade (eye movement distance)” were collected. In addition, by setting the signboard in the image as an area of interest (AOI), gaze data for each AOI was collected so that gaze data for the signboard were secured (
Figure 3). The gaze movement and fixation time can be visually displayed as a heat map in
Table 3, and red indicates a longer fixation time while blue indicates a short fixation time. The survey is a question of the streetscape, with each photo being measured from high to low (five-point scale) by aesthetic qualities of streetscape from interesting to dull and dynamic to still, with signboard satisfaction and complexity from high to low. Also, there were questions where when looking at the streetscape, the most important streetscape elements (signboards, green spaces, facades, street structure shapes, sky, ground floors, and other facilities) were checked. Information regarding participants’ gender, age, major status, and offline consumption activities was collected. Questionnaire data were collected using a total of 561 samples by surveying 17 images from 33 people.
4. Analysis and Results
The gender of the participants was 21 males and 12 females, 17 in their 20s and 16 in their 30s. Among them, 20 people were studying related majors or working in the field, and 13 were non-majors.
Table 4 shows the average number of gazes was 43.5 when looking at the picture, with an average of 178.346 for the Saccade, which indicates the distance of the eyeball, and 0.213 s for each gaze. According to the eye-tracking characteristics of the signboard extracted through the AOI setting, the number of gazes was 17.24 s, the fixed time of gaze was 2.542 s, and the number of revisits was 8.392 times. The participants’ street satisfaction averaged 3.23, the signboard satisfaction was 2.97, the aesthetic quality of the streetscape was 3.29, the dynamic image was 3.42, the interesting image was 3.32, and the complexity of the streetscape was 2.95.
The fixation time for each streetscape element was the highest at 5.86 s for buildings, 2.54 s for signboards, and 0.91 s for green areas and the shortest was 0.24 s at floors (
Table 5). However, the building’s gaze time includes signboards and show windows, so the participants are considered to have the highest gaze time for the building and the signboard.
In addition, 24 people selected signboards which were the highest in the question about the most important landscape elements when looking at the streetscape. Next was green space (14 people), street structure shape (12 people), and floor (11 people). In streetscapes, signboards appear to attract people’s attention and be an important factor in recognizing the streetscape.
After classifying the signboard into two groups (HSG, LSG) according to the high and low area of the signboard in the streetscape, we checked whether the gaze characteristics of people changed using the
t-test.
Table 6 shows those results. As a result of the analysis of the number of fixations, fixation time, and saccade, which are basic gaze movements between the two groups, only saccade (
p < 0.05) was significant. The gaze movement distance appeared longer in LSG than in HSG. The gaze movement distance appeared shorter because the number of signboards and the amount of data that came into the eyes was higher when the area of signboards was wider.
When looking at the AOI result value for the signboard, basically, in the gaze movements the number of fixations to signs (p < 0.01), fixation time to signs (p < 0.01), and revisit of fixation to signs (p < 0.01) are all significant, confirming that there is a difference between the two groups.
The results of confirming the difference in images between the two groups are shown in
Table 7. First, LSG was high in terms of street satisfaction, signboard satisfaction, and aesthetic qualities of the streetscape. This is a negative effect of the signboard on the street environment and has been confirmed in prior studies. However, HSG is higher than LSG in dynamic and interesting images of the streetscape. The presence of signboards seems to have the effect of giving interest, fun, and dynamic images to the streetscape. In addition, people perceived more complex streetscapes when signboards were located high in the verification of complexity differences. While the appropriate level of complexity in streetscape can be attractive, excessive complexity can have a negative effect.
5. Discussion
The results of the analysis objectively show people’s gaze movements on signboards and images of streetscapes through eye movement and surveys. As the subject area is a commercial street, people focus their gaze on buildings and stores to get information on the stores. In terms of the theory of the Gestalt, the sign in the background of the building becomes a foreground element containing information. Recognition of foreground elements can influence the overall image of the landscape. The result of the research supports this theory. As a result of t-testing by dividing into HSG and LSG based on signboards, significant differences between the two groups were confirmed in all matters such as street satisfaction, signboard satisfaction, aesthetic qualities of streetscape, dynamic, interesting, and complexity (
Table 7). This tells us that signboards are the most common streetscape element people see in streetscapes and that streetscape satisfaction, signboard satisfaction, and streetscapes’ aesthetic qualities were low in streetscapes with a wide signboard area.
In this analysis, it should be noted that the values of the two variables Dynamic (
p < 0.01) and Interesting (
p < 0.1) were high in HSG and were significantly different from the opposite group. Dynamic and Interesting can be seen as essential images to make the commercial street attractive. In particular, these results contrast with the overall low-profile street satisfaction (
p < 0.01), signboard satisfaction (
p < 0.01), and the low-level aesthetic quantities of streetscape (
p < 0.01) all showing positive possibilities for the effect of signboards. In addition,
Table 6 objectively shows that HSG is higher than LSG in the number of Fixation to signboards (
p < 0.01), Fixation time to signboards (
p < 0.01), and Revisit of Fixation to signboards (
p < 0.01) all of which are visual attention factors. It may be thought that the group with a large area of the signboard simply showed a high gaze because the ratio of the area occupied by the signboard in the images was high. However, checking the fixation time compared to the area of the signboard confirmed that the HSG was 0.6 sec and the LSG was 0.34 sec (
p < 0.01), showing a significant difference to indicate that the fixation time was high not just because the signboard was wide.
Signboards can make visual attention in two ways: First, is the morphological feature. Korean signboards stand out as protruding from the building. This is in the same context as previous studies related to eye-tracking [
27,
28] that the prominent part of the landscape attracts attention. Second, the signboards have letters, which are the medium of information transmission. People constantly try to attain information through eyesight. In addition, since a form such as a letter requires more visual concentration to understand information, attention to the signboard occurs. This result means that depending on the use of signboards, it is possible to design more attractive commercial streets. For the street to be attractive, it must be able to draw the interest and activity of pedestrians.
On the street, the activity eventually begins with a visual stimulus to pedestrians, which comes from the function of delivering store information to the buyer. Among the scape elements, signboards are important because they are the most intuitive and can deliver a lot of information from sellers to consumers. The external environment of a commercial street that delivers information is important, and to attract and retain shoppers, the importance of a high-quality streetscape must not be overlooked in the contact between the streets and visitors of the commercial district. As mentioned in previous studies [
3,
4,
5,
6], unorganized signboards are a negative factor in the streetscape and lead to various issues. However, the results of this study indicate that signboards fundamentally increase people’s visual participation and are clearly the best physical environmental factor for information delivery. The government is also conducting signboard maintenance projects to improve the streetscape and enhance the uniformity of the shape and scale of signboards. For systematic streetscape management in the future, detailed guidelines (e.g., scale, color, shape) for signboards will be needed when establishing guidelines such as district unit plans. In addition, signboard design should be based on the function and location of the street and its resulting design.
When evaluating a particular landscape, it is important how it is presented to whom. Over the past half-century, landscape evaluation can be seen as a competition between an approach by design experts and a public-based approach [
17,
32,
33]. This means that the landscape evaluation that comes from the differences in experiences and perspectives of the two groups may lead to different evaluations. In this study, the reflection of group characteristics in streetscape evaluation was minimized by conducting an experiment by mixing urban design majors and the general public. In
Table 6, the results of the study also show that, since all variables showed significant differences between HSG and LSG, streetscape evaluation was performed without significant differences between experts and ordinary people.
However, this study has some limitations. First, this is an experimental study based on photographs. There may be a difference between the three-dimensional image seen outside the study and the images in the study viewed as photographs. Second, the angle of the shooting was taken in the middle of the street. When people walk, they move their heads and look at the streetscape from various angles. However, this study used images taken from the center of the street as a photographic experiment. If research is conducted to supplement these limitations using VR utilization or wearable eye-tracker in the future, more accurate and detailed implications may be presented in streetscape design.
6. Conclusions
Until now, research regarding signboards in the commercial streetscape has been conducted based on a questionnaire on people’s perceptions. However, surveys have the limit of not knowing which ones the participants looked at and evaluated. This study is meaningful in that it focuses on the foreground elements of the landscape and analyzes people’s viewing patterns in terms of the theory of the Gestalt to solve this problem. The result confirms that the focus of attention on signboards arouses people’s interest, which makes them perceive a dynamic streetscape image. This represents the effect of a signboard as a foreground element, and also confirms the importance of the foreground element when people perceive streetscape.
This study can suggest the following implications. When designing guidelines for outdoor signboards in streetscapes, consideration of Signboards area and design should proceed. Signboards are an important element in the commercial street landscape. The District unit plan guideline [
34] states the signboards should follow “outdoor advertisement guidelines” once the necessary changes have been made to prevent excessive exposure to the outside or a sense of disparity with the building or surrounding buildings. The results of this study show that signboards can induce people’s gaze and let people feel the image of the active commercial street landscape, but disorganized signboards have a negative aesthetic effect. Therefore, when establishing guidelines for outdoor signboards, considering a plan to harmonize the shape and size of signboards to maintain unity, will benefit the commerciality of signboards which transfers information to people. The research results suggest the importance of signboards in future commercial streetscapes and show that improved visual communication between pedestrians and streetscapes can create attractive streetscapes.


