1. Introduction
In recent decades, the problems associated with the quality of air in confined spaces (indoor) have arisen internationally for various reasons:
The research has recorded profound qualitative and quantitative changes in indoor air, with a progressive increase in absolute terms of pollutants [
1]; today, numerous pollutants are detectable in these environments, and many of them have significant health effects [
2]. The recent COVID-19 pandemic has contributed to highlighting the relevant role of indoor air and crowding in disease transmission [
3].
Health problems related to indoor pollution affect the entire population exposed, even if the phenomenon is relevant above all for the most fragile subjects, such as the elderly, children, and individuals already suffering from chronic diseases (heart disease, respiratory diseases, bronchial asthma, allergies), who spend most of their time in their home and school environments [
4,
5]. Some studies show a particular sensitivity of children to inadequate air quality due to the small size of their airways and higher ventilation rates than adults [
6].
In the countries of the European Union, including Italy, the population spends most of their time (about 90%) in an indoor environment. Therefore, the duration of exposure is considerably prolonged. Nonetheless, no effective effort has yet been undertaken to assess and manage these risks [
2,
4].
The crisis of world energy resources, directly affecting Italy and other countries, made it necessary to adopt new technical-design criteria for buildings for civil use, to contain consumption through better thermal insulation. Consequently, the tendency to seal internal environments and to replace natural ventilation methods with artificial means has become commonplace. In particular, the exposure of the population finds its maximum expression in the winter season, aggravated by the need to contain energy consumption and improve thermal comfort, reducing the frequency of opening the windows [
4].
The pollutants detectable in indoor environments are numerous and range from biological ones (mites, fungal spores) to chemical ones (i.e., NO
2, CO, Polycyclic Aromatic Hydrocarbons—PAH, benzene, Volatile Organic Compounds—VOC and their very volatile subgroup (VVOCs), formaldehyde, PM10, PM2.5), often showing higher concentrations than those detectable outside [
7]. In particular, VOCs are widely diffused in indoor environments as they can be emitted by construction and finishing materials, furniture and equipment, and cleaning products. VOCs include numerous compounds, such as alcohols, aliphatic hydrocarbons (e.g., methane), aromatic hydrocarbons (e.g., benzene), aldehydes (e.g., formaldehyde), ketones, esters, halogenated hydrocarbons (e.g., chloroform) etc., some of which have carcinogenic, mutagenic, and teratogenic action [
5,
8,
9]. Other products used in construction have also recently aroused particular health interest. These are artificial fibres, as well as flame retardants, such as perfluoroalkyl substances (PFAS) and plasticizers (e.g., phthalates), as, given their widespread use, they have often been found in significant concentrations in environmental samples. Most of these substances do not remain in the products of origin: migrating from the products to the air and dust, inducing a body accumulation over time [
10].
Indoor pollution has been associated with some clinical manifestations, including “Building-related illnesses (BRI)” and “Sick building syndrome (SBS)” [
11,
12,
13]. The first includes real diseases (allergic asthma, humidifier fever, legionellosis, etc.) for which a specific causative agent present in the confined environment can be identified (e.g., microorganisms, radon, formaldehyde, etc.).
In addition to these pathologies, SBS is more frequently observed, characterized by neurosensory effects that cause malaise, mucous membrane irritation, headache; these effects regress once a person moves away from that specific room/building [
11]. Typically, SBS occurs in a large number of occupants of modern or recently renovated buildings, equipped with mechanical ventilation and air conditioning systems (without fresh air intake from outside) and used as offices, schools, hospitals, nursing homes, homes [
14]. From numerous investigations in buildings where cases of SBS have been reported, it has emerged that the prevailing problem (in almost half of the cases) was inadequate ventilation [
14], adding to the problems in the heating, ventilation, and air conditioning (HVAC), or linked to the phenomenon of outgassing of some materials used in construction, to the air dispersion of VOCs, moulds, ozone (such as that produced by photoreproduction equipment) or to the lack of filtration of air recirculation.
The need to regulate the levels of exposure to VOCs has led international organizations, such as the World Health Organization (WHO), to define Indoor Air Guide Values (IAGVs) for various pollutants of particular health and hygiene interest to prevent adverse effects on the population. In particular, the WHO has developed, for the European Region, specific guidelines [
5] concerning numerous pollutants present in confined environments, and related to the effects on humans deemed sufficiently strong in the scientific knowledge. The substances considered are benzene, nitrogen dioxide, polycyclic aromatic hydrocarbons (especially benzo[a]pyrene), naphthalene, carbon monoxide, radon, trichloroethylene, and tetrachlorethylene. Many countries have then developed their own standards defining the limits of numerous VOCs. In most countries, in line with the WHO, the guide values refer to individual substances. Only in a limited number of countries (e.g., Portugal, The Netherlands, Belgium) has an acceptability limit been defined for Total VOCs (TVOC).
In Italy, a specific standard that incorporates WHO guidelines has not been developed [
5], while, with the Ministerial Decree of 11 October 2017, the Minimum Environmental Criteria (
Criteri Ambientali Minimi—CAM) for construction were identified, which exclusively define the limits of emissions from materials, but not the limitations to concentrations in the indoor environment.
As highlighted by the EPA (United States Environmental Protection Agency) [
2], the reduction of health risks for users must be achieved through better design, construction and operation of buildings, improvements in the development and use of indoor products, and mitigation of existing exposures inside a building or in its immediate vicinity. Over the years, numerous studies have dealt with the quality of indoor environments and their impact on health, which has led to the definition of the concept of “Healthy Buildings” [
10]. It is well known that the construction methods and building products can produce effects on the natural environment, on the indoor environment, and on the health of the occupants; hence, the need to use products whose life cycle is carefully evaluated both in the short and in the long term. The design and construction choices, the plant solutions, and the eco-compatibility of the materials become essential factors in every phase of the building’s life and an indispensable condition for the development of the materials industry and the technologies of the sector, as well as taking on an aspect of competitiveness for market growth [
15]. The choice of tested and certified products, on which it is possible to find reliable information, is fundamental. The concept of “Healthy Buildings”, in addition to Indoor Air Quality (IAQ), also includes other fundamental factors such as, i.e., ventilation, thermo-hygrometric comfort, natural and artificial lighting, plant safety [
10]. These factors are directly controllable in the various stages of the building process and represent a basis for evidence-based design, defined as “the process of systematic research, evaluation, and use of contemporary research results as a basis for design decisions”. This definition is the adaptation to the design problem in architecture and engineering of evidence-based medicine (EBM) which deals with making decisions about the care of individual patients. All this is to increase the environmental and technological quality of the project.
The use of numerical modelling in the context of studies aimed at guaranteeing and improving IAQ is an example of evidence-based design. Fluid dynamic models, although they were not originally developed for the purpose, are currently widely applied for IAQ problems [
13] and represent an integrated tool for design. In fact, they are capable of simulating the global conditions that determine indoor well-being by simultaneously considering forcing (i.e., environmental factors), construction characteristics and activities, and the use of the environments.
On the one hand, the use of numerical modelling in the design phase makes it possible, by varying the aforementioned parameters in the various simulations, to direct the design choice concerning the required objectives and, on the other hand, to highlight any unexpected critical situations, i.e., reaching high concentrations or exceeding threshold values. Within the numerical models used for IAQ applications, two different types are distinguished: box-type models using the mass balance approach and computational fluid dynamics (CFD) models. The choice between the two classes of models should be guided by the type of modelling output of interest and by any need to integrate the model with further processes, such as Building Information Modeling (BIM).
The first type of models, the box-models, is divided into single-zone (when the single indoor environment is considered separate from the context) and multi-zone models (when considering an overall context of different indoor rooms connected within the building). These models, starting from the hypothesis of complete mixing of the pollutant within the confined environment (box), estimate, using the pollutant mass balance equation, the homogeneous concentration that is reached in the considered volume as a function of the ventilation, the sources, and the chemical-physical phenomena that may affect the contaminant. They calculate the time variation of the substance concentration considering the contributions that determine it: quantities of a substance entering and leaving the volume due to ventilation, quantities emitted by indoor sources, quantities removed from filtration systems, and those related to phenomena that can affect aerosols: sedimentation, resuspension, adsorption, and aggregation. The use of box models is widely recognized in the literature for IAQ applications [
16,
17,
18,
19,
20,
21]. Furthermore, the theoretical methodology underlying these models is used in the experimental tests, i.e., chamber tests carried out to determine the parameters that describe the emissive capacity of the materials.
The second type of model is instead that of computational fluid dynamics (CFD) models. Among the most used CFD models, those strictly related to IAQ are Ansys Fluent, COMIS, and CONTAM, although the last one contains a very simple CFD module [
22]. The CFD models make it possible to investigate the 2D and 3D spatial distribution, with respect to the variation of fundamental forcings such as ventilation and temperature, numerically solving the balance equations of momentum, mass, energy, and concentration of the dispersed substances in a computational domain representing the indoor environment [
23].
In both types of models, the presence of VOC sources is typically represented by imposing an inlet mass flow rate on the volume-environment, thus directly considering the VOCs exchanged at the interface between material and air-environment. However, it is necessary to emphasize that over time models of the diffusion of substances within the materials themselves have also been developed [
24]. The application is mainly limited to tests in the test chamber and rarely used in real cases.
In this paper, both types of models were used to estimate indoor concentrations due to building materials as part of a real case study.
The paper presents the development of a numerical box-model predicting VOC concentration in the indoor environment and the proposal of a guide value for environments with low-emissivity building materials. What is presented here is part of more in-depth research “BIM4H&W: BIM for Health and Wellbeing” (POR FESR LAZIO 2014/2020- Integrated projects) developed in a partnership of effective collaboration between the company RI.EL.CO IMPIANTI S.R.L. and the University of Rome “La Sapienza”, CRITEVAT.
2. Materials and Methods
The methodology applied in this part of the research is divided into four sections: experimental sampling on TVOC (Total Volatile Organic Compounds), the definition of the VOC material emission parameters required by numerical models, the development of a box-model for the prediction of VOC emission from building materials, and the CFD simulation of VOC concentration in the indoor environment.
The methodological approach, both regarding the modelling tools chosen and the analysis of experimental data, derives from the general purpose of understanding and representing the contribution to indoor concentrations due to construction materials.
The first part of the study was carried out considering two specific environments, subject to the sampling of environmental parameters and indoor contaminants. These experimental data made it possible on the one hand to evaluate the air quality conditions in these environments, on the other hand, they were used in modelling. The numerical modelling was carried out to simulate the indoor dispersion of the contaminants emitted by the materials relative to these two environments, with two different modelling tools: a box-model using the mass balance approach and a numerical model of computational fluid dynamics (CFD) and dispersion.
A second part of the work was instead focused on highlighting the role of ventilation and materials. In particular, using the box-model developed, we considered a case study carried out under standard conditions which would, therefore, allow the comparison with the IAGVs (Indoor Air Guide Values) for TVOCs (Portugal) and emission limit values of the individual materials (CAM). The availability of indoor VOC measurements, together with the conditions of use of the building itself, being just built, devoid of furniture and not frequented by people, made it possible to focus the attention on the building box, geometric characteristics, and materials.
The contribution to the indoor VOC concentration due to exchanges with the external environment, necessary to understand the contribution of materials concerning the actual concentration, was estimated from literature data [
25,
26].
In both models, it was decided to consider the interior finish paint as the only source of VOC. This finish is low in VOC and is used on wall surfaces, while the finishing materials of countertops (metal) and floors (stoneware) are non-emissive.
2.1. Sampling Campaign
The experimental data, analyzed in this study, were collected by the company RIELCO IMPIANTI S.R.L. at the Research Area of the CNR of Pisa (Italy) in two different rooms of block A of the new expansion of building B. The sampled environments represented in
Figure 1 are the meeting room (B2A2-2), and office 11 (B2A2-9). Data of the two rooms are reported in
Table 1.
Two types of sampling were collected: continuous environmental sampling through instruments integrated into the ventilation management system (SIEMENS system) and data measured with mobile samplers, positioned in the centre of each room and 1 m from the floor.
The environmental parameters measured by the sensors installed in the ventilation system are: indoor air temperature [°C], ventilation rate [m3/h], airspeed [m/s], and CO2 concentration [ppm]; these data were acquired with variable frequency.
The mobile acquisition tools used in the sampling campaign are:
Photo-Ionization Detector (PID), TIGER—VOC detector (isobutylene calibration) 1 ppm resolution;
Laser Particle Counter, AIRY TECHNOLOGY P311 (0.5 μm–2,5 μm–5 μm);
Multisensor 8-Channel IAQ Monitor, YESAIR.
The data measured with these mobile samplers, shown in
Figure 2, are VOC concentration [ppm], temperature [°C], and relative humidity [%] with an acquisition frequency of 5 min. The measurements with mobile samplers were carried out during campaigns lasting 3 days, which took place on 20-21-22 July 2020 for the meeting room (for a total of 64 continuous hours) and 29-30-31 July 2020 for office 11 (for a total of 51 continuous hours). The sampling took place with closed windows and closed doors, the forced ventilation system was kept on continuously with variable flow recorded.
The values deriving from the sampling will be compared with the IAGVs.
Table 2 summarizes the guide values relating to TVOCs [
27,
28]. As reported, the WHO and France and Germany, usually particularly attentive to the regulatory aspects of indoor pollutants, have not released guide values. While Belgium and Holland define a value of 200
/m
3, but with very different and contrasting evaluation periods, it was, therefore, decided to choose as the reference guide value the one expressed by Portugal, equal to 600
/m
3 over an evaluation period of 24 and 8 h.
2.2. VOC Material Emission Parameters
To model the diffusion of a substance within a fluid such as the air present in an indoor environment, it is necessary to correctly represent the sources of this substance. In this work, attention has been focused on the contribution of building material emissions to the total indoor VOC concentration. The methodology whereby it is possible to derive the VOC material emission parameters to be used within the numerical models, starting from the data generally available for building materials provided by manufacturers, is explained below.
The EN16515 standard [
29,
30] defines a methodology for determining the VOC emissions from materials following tests carried out in a controlled “chamber test”. The emission capacity of the material over time, i.e., the Emission Rate (ER)
, which represents the flow rate introduced into the volume of air in the unit of time, is expressed as a function of the concentration occurring in these test chambers for a given air exchange rate. The emissivity of the material (ER) can be derived from the concentration (
CCH) [μg/m
3], established in the air inside the “chamber” equal to 1 m
3 of volume with Air Exchange Rate (AER) equal to 0.5 1/h:
Starting from this parameter, it is possible to define the area-specific emission capacity or area-specific emission rate, SER:
The previous relations provide parameters that can be used in numerical models, depending on the representation adopted for the sources.
The emissive capacity per unit area (SER), when associated with the real extension of the applied material, represents the flow rate introduced by this material source. In the EN16515 standard, an ideal environment with known characteristics, i.e., the reference room, is also defined. This can be used as a standard model for estimating concentrations. This environment is characterized by 3 × 4 × 2.5 m dimensions, a volume equal to 30 m3, and known fluid dynamic conditions: AER equal to 0.5 1/h, T = 23 °C and relative humidity (RH) equal to 50%. The loading factors (L) concerning this ideal model, defined by the relationship between the extension of the emissive surfaces and the volume of the environment, are determined. In detail, L is equal to 1 m−1 for walls, 0.4 m−1 for ceilings and floors, 0.05 m−1 and 0.007 m−1 for small and very small surfaces, respectively.
The substance concentration in the reference room (
CRR), considering the emission from a generic surface and the SER of the material, can be hence obtained as:
For the simulations conducted in the two environments, office 11 and meeting room, the VOCs emitted by the low-emissive finishing paint used on the walls were considered.
The area-specific emission capacity used in the modelling has been estimated from the emission test data provided by the material manufacturer. Specifically, the SER was obtained from the concentration data detected in the test chamber (
CCH) after 28 days of laying the material. This data is considered admissible in the study as the 28-day chamber test data are provided as representative of the long-term behaviour of the materials, and that the paint was applied several months before the sampling. Furthermore, in consideration of the time elapsed since the application of the paint and having also simulated short time intervals (maximum 3 days), it is possible to consider the emission value of the material as constant [
19].
2.3. Numerical Model for Prediction of Indoor VOC Concentration
To estimate the indoor concentration of VOCs, a box-model was used, developed ad hoc for the present research project. The model was built to be able to calculate the time variation of the VOC concentration as a function of ventilation, indoor environment geometry, and emissive materials. Using a hypothesis of complete mixing within the volume considered for the mass balance of the VOCs, the concentration calculated by the model has a homogeneous distribution in the volume itself. Below are the equations underlying the calculation model. The model calculates the VOC concentration in the indoor environment using the following equation:
where
V [m
3] is the volume of the considered indoor environment,
Cind [
g/m
3] is the concentration of VOC in the indoor environment,
Cvent [
g/m
3] is the VOC concentration in the ventilation air entering from the outdoor,
S [
g/h] is the term that describes the internal sources of VOCs.
The model scheme allows us to highlight and distinguish the different contributions that determine the total concentration in the indoor environment.
As in Equation (5), the variation in concentration within the volume depends on (i) the amount of outdoor VOC entering with the ventilation system; (ii) the amount of VOC removed from the ventilation system; and (iii) the amount of VOC emitted by the sources within the volume.
Equation (5) is solved iteratively:
where the apex (
i) indicates the
i-th integration step.
By indicating the area of the emitting surface with As and using the definition of SER (2), the following is obtained:
The previous equations were used to estimate the temporal variation of the VOC concentration in the two environments under this study, office 11 and the meeting room.
The clarification of the terms relating to the various contributions and the application of the model to the time intervals concerning the sampling performed in the two environments allowed a detailed analysis of the contributions and the comparison between simulated and experimental data.
Furthermore, since the main purpose of the work is to investigate the contribution of materials to the indoor concentration of VOC, a relationship to estimate the VOC concentration (
) has been obtained (8). This equation refers to the concentration reached in an environment of volume
, in stationary ventilation conditions determined by the
, due to the emissions related to the internal source of VOC, consisting of a material characterized by
, and distributed on the surface of the area
. Equation (8) has been obtained starting from the defined emission parameters and the previous equations.
Equation (8) applies what is defined in the EN 16515 standard relating to the ideal reference room to a real environment, where the loading factor (
) is defined as the ratio between the m
2 surface where the material is applied (
, and the m
3 of the volume of the considered room, (
):
Equation (9) was used in the second part of the work to investigate the role of ventilation and the effect of materials with different emissive capacity in determining the indoor concentration.
2.4. CFD Simulation of VOC Concentration
In parallel with the development of the described box-model, a CFD (Computational Fluid Dynamics) numerical model was used to investigate the spatial distribution of the VOC concentration within the considered indoor environments. The model was applied to office 11 and the meeting room in Block A of the building to compare the VOC concentrations obtained with the two modelling tools.
The use of the numerical model, implemented in the CONTAM software, was also motivated by the aim of simulating and understanding the three-dimensional fluid dynamic field in the case studies and to highlight the fundamental role of air circulation in the phenomena of VOC transport and dispersion in indoor environments [
31,
32]. CONTAM is a freely distributed software, developed by NIST (National Institute of Standards and Technology), widely used for various applications including the study of ventilation in indoor environments and the determination of air quality through dispersion simulation and the occupant’s exposure assessment to indoor pollutants. CONTAM version 3.4.0.0 was used in this work; the CFD model, integrated into the CONTAM software, is the CFD0 module (version 3.4.0.0), which solves the fluid dynamic field with a zero-order turbulence closure [
33]. Two types of simulations were conducted:
As for the simulations with the box-model, the emissions due to the interior finish paint applied to the walls were considered.
3. Results
The results of the research are divided into 4 subsections: sampling campaign; box-model for prediction of VOC indoor concentration; CFD simulations; comparison of sampled and simulated VOC concentration.
3.1. Sampling Campaign
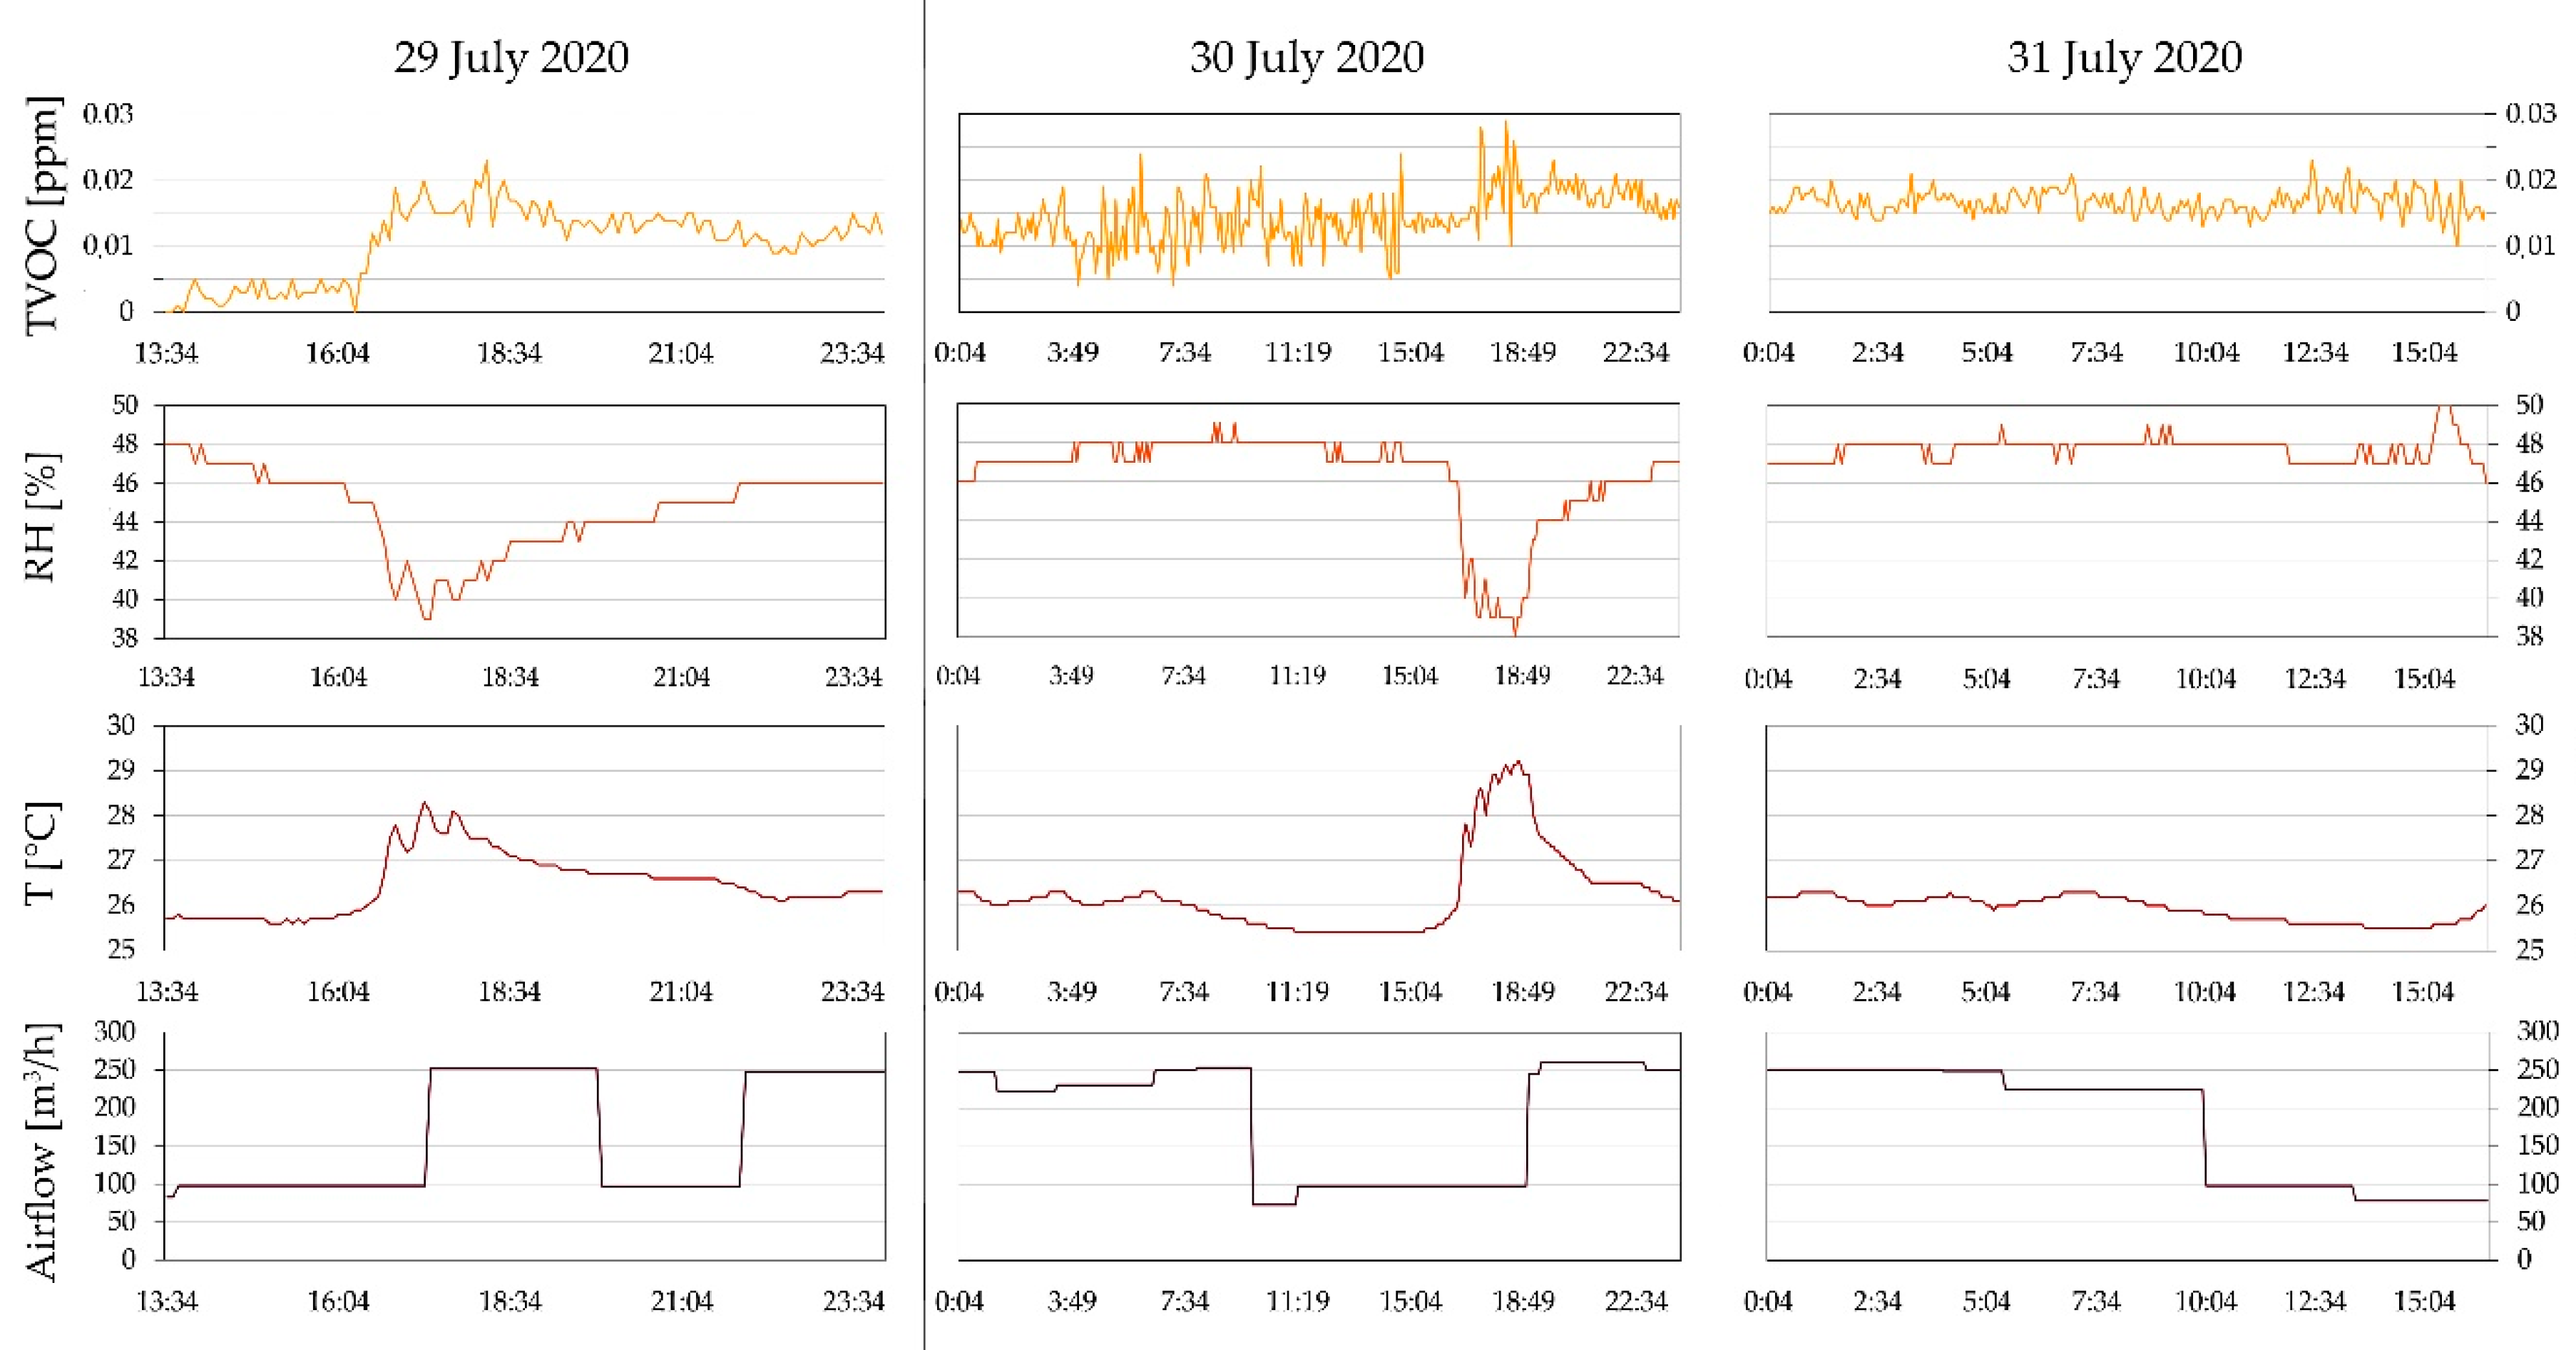
The results of the sampling campaign in the two environments, meeting room and office 11, are shown, respectively, in
Figure 3 and
Figure 4. Specifically, the time variation of the VOC concentration [ppm], relative humidity [%], and indoor air temperature [°C] measured with portable samplers in the meeting room (20–22 July 2020) and in office 11 (29–31 July 2020), together with the forced ventilation flow rate [m
3/h], are shown. Since the temperature measured with the portable sampler was found to agree with that measured by the SIEMENS sensors, it was considered useful to present only the one measured with the mobile samplers. By analysing the concentration of VOC, which is the most interesting parameter for this work, it is possible to note a marked variability in the trend. The variations observed for this parameter do not seem to be correlated with the environmental parameters that usually affect emissions from materials, such as temperature and relative humidity. Only for the measures taken on July 29 and 30, when the temperature rises a few degrees, reaching approximately 29° C, does the VOC concentration even show a slight increase. Furthermore, there is no correlation between the sampled VOC concentration and the airflow rate introduced by the ventilation system. The lack of a link with the ventilation rate, which appears to be the most important parameter in determining the concentration, suggests the presence of a different forcing.
If the VOC emission concerned only the finishing materials of the walls, a dilution effect should occur in the face of an increase in flow rate, with a consequent decrease in the sampled concentration or, on the contrary, an increase in VOCs as a result of less air exchange. The concentration of VOCs, on the other hand, shows a trend that suggests the presence of a variable contribution, not consistent with an almost constant emission over time, such as VOCs emitted from building materials. This contribution could be represented by a quantity of VOCs entering the ventilation system that captures the air from the outdoor environment.
A clarification is necessary by observing the temperature data compared to those of the airflow.
In fact, in both environments, there is no correlation between the two. This is due to the fact that the indoor temperature variations depend on the one hand on the solar irradiance affecting the rooms, and on the other hand, not on the airflow rate, but on its temperature, which is not shown here. The temperature peaks observed in the morning and afternoon, respectively, in the meeting room and office 11 are compatible with the irradiation determined by their orientation. The first environment is in fact oriented to NE and the second to SW.
Regarding the environmental parameters measured by the SIEMENS system, it should be emphasised that, for both rooms and the entire duration of the sampling, environmental conditions occur that are comparable to those suggested in the UNI EN 16516 standard (temperature 23 °C and humidity 50%).
3.2. Numerical Model for Prediction of Indoor VOC Concentration
3.2.1. Model Application to the Case Study and Comparison with Sampling
The box-model was used to estimate the VOC concentration in the two environments considered in the case study, office 11 and meeting room. The simulations were conducted by solving iteratively the mass balance Equation (6), and obtaining the time variation of the VOC concentration in the volume represented by the indoor environment. Numerical solving was adopted in order to consider the real AER, which is characterized by an irregularly variable trend.
To make a comparison with the experimental data available, the model was applied considering the time intervals coinciding with the samples made in the two environments: 20-21-22 July and 29-30-31 July, respectively, for the meeting room and office.
The simulations were carried out considering the real AER (1/h), variable over time, derived from the measured flow rate (m3/h), available in the aforementioned intervals.
To highlight the role of the different factors, i.e., internal sources, outdoor contribution, and the effect of ventilation, which contribute to determining the total concentration in the indoor environment, the model was applied for all the time intervals considered, according to the following cases:
internal source of VOC in real variable ventilation conditions;
VOC input from outdoor via the ventilation system, in real variable ventilation conditions;
internal source of VOC and outdoor VOC input through the ventilation system, in real variable ventilation conditions;
internal source of VOC considering design ventilation conditions, constant over time.
Case 4 was considered to highlight the dilution effect operated by ventilation.
In all the simulations, the internal source of VOC is represented by the emission due to the finishing paint applied to the walls of the rooms. Only this emission was considered because there were no furnishings in the rooms and the floor, and ceiling and window materials were considered non-emissive. In the model, area sources with continuous and constant emission were considered. The amount of VOC released over time was calculated considering the SER of the material, derived from the CCH value provided by the manufacturer, and the extension of the walls in the different environments. In particular, the SER of the finishing paint used was equal to 3.55 µg/m2 h compared to a CCH equal to 7.1 µg/m3.
To consider the quantity of VOC present in the outdoor environment, entering through the HVAC ventilation system (
Cvent), literature values were used, not having available sampling data carried out near the sockets or inside the system ducts ventilation. A constant VOC concentration of 20 µg/m
3 was considered in the model [
25,
26].
To perform the comparison between simulated and sampled data, it was necessary to convert the latter from ppm to µg/m3. Both emission data and guide/threshold values for indoor concentrations are indicated in µg/m3. For the conversion, given the calibration of the instrument with isobutylene, the molecular weight of the latter was considered, equal to 56.11 g/mol, in the formula Y (mg/m3) = (X ppm) (molecular weight)/24.45.
Figure 5, (a) for office 11 and (b) for the meeting room, shows the temporal trends of concentration in logarithmic scale and calculated by the model for the different cases identified:
curve “s-VOC_MAT_Rvent” relates to the indoor concentration with real ventilation, due to the emissive material;
curve “s-VOC_OUT_Rvent” refers only to the entry of VOC from the outdoor environment in real ventilation conditions;
curve “s-VOC_MAT/OUT_ Rvent” represents the condition in which both outdoor VOC and indoor VOC sources are considered in the real ventilation conditions;
curve “s-VOC_MAT_Nvent”, is related to the indoor concentration, with constant nominal-design ventilation, due to the sole internal source.
The graphs also present the curves relating to the experimental data:
“m-VOC”, environmental sampling data;
“m-VOC_avg”, the average value over the sampling time interval;
IAGV equal to 600 µg/m
3 [
8,
27].
3.2.2. Model Application to a Guide Value Definition
The main purpose of this work is the investigation of VOC emissions from building materials. The box-model was applied considering different types of materials and different ventilation conditions, to clarify the weight of the contribution of building materials concerning the concentration levels detected and recommended in an indoor environment and, at the same time, to evaluate the parameters suitable for mitigating user exposure.
To highlight the well-known mitigation function operated by ventilation, the model was applied in the two environments, office 11 and meeting room, estimating the concentration for constant the Air Exchange Rate (AER) values. Significant cases were considered in this work, such as the average value of the real AER measured during sampling, the design AER, and the AER used in CFD simulations. Furthermore, the minimum value of 0.5 exchanges per hour established by EN16516 for the reference room and values increasing up to 10 exchanges per hour are considered (Circ. Min. LL.PP. 22 November 1974, No.13011).To clarify the weight of the contribution emitted by the materials on the total concentration, the model was applied considering the low-emissive material present (Low VOC), with CCH equal to 7.1 µg/m3, and a high-emissive material (Max VOC), hypothesised with CCH equal to 1500 µg/m3, i.e., the maximum emission limit permitted for materials in the CAM.
Figure 6 shows the two environments, meeting room on the left and office 11 on the right.
Table 3 shows all the fixed parameters used in the model.
Table 4 and
Table 5 report the concentrations obtained for the two different materials for the significant ventilation values, respectively, for office 11 and the meeting room. The tables also show the percentage value of the VOC concentration due to the materials compared to the average value sampled in the two environments and to the IAGV of 600 µg/m
3.
Figure 7 shows the trend, on a logarithmic scale, of these concentrations as a function of the different areas for the two materials. The criticality represented by the use of high-emissivity materials is evident, certainly in poor ventilation conditions, i.e., with AER equal to 0.5–1 1/h.
The box-model was also used to define a threshold value useful for building design IAQ aspects oriented.
The box-model was applied considering 3 types of low-emissivity materials (M1, M2, M3).
These values were compared with the threshold values established by the BREEAM certification protocol [
35] (Basic level BREEAM-B; Exemplary Level—BREEAM-EX) and with the limit value defined by the Italian CAM:
BREEAM-B—300 μg/m3
BREEAM-EX—1000 μg/m3
CAM—1500 μg/m3
These emission values were applied in the box-model developed to evaluate the TVOC concentration in the indoor environment. In this case, the simulations were carried out considering the geometric parameters of the reference room, defined by the EN 16516 standard. The parameter relating to the load factor, Loading Factor (L) [m2/m3], was kept fixed with a value equal to 1. The ventilation was instead varied considering the AER air exchange rate values [1/h], in the range between 0.5 and 10. The concentration values thus obtained were compared with the IAGVs defined by Portugal, equal to the value of 600 /m3.
Looking at the results obtained (
Figure 8), we decided to set the limit to the value of 50
/m
3 as a precautionary limit. This reasoning is due to the consideration that this limit only refers to the concentration of TVOC emitted from building materials and, therefore, useful for design purposes. To this value, the contributions of outdoor air, people, furniture, and cleaning products must be added. Therefore, we decided to settle on a value equal to approximately 10% of the IAGV considered.
3.3. CFD Simulations
For the CFD simulations, constant indoor temperature and pressure were set as initial conditions. Furthermore, the doors and windows were always considered closed, in analogy with the VOC sampling conditions.
The initial VOC concentration within the environments under study and the one entering the forced ventilation system were set as null. The walls covered with the finishing material were the only sources of VOC considered, i.e., the two short walls of the two rooms and the non-windowed part of the wall with the windows; while the wall where the doors are positioned is glazed, so its contribution to the emission of VOC is zero.
As in the application of the box-model with low emissivity material, the material area-specific emissive capacity of VOC (SER) was set equal to 3.5 μg/m2 h, derived from the VOC emission data for the finishing material, CCH equal to 7.1 µg/m3, provided by the manufacturer. Furthermore, VOCs were considered as passive tracers and, therefore, no reaction kinetics or removal phenomena were predicted.
Steady and unsteady simulations, analysing the 10 h following the VOC emission, were performed, considering both the environments and the ventilation system configurations (summer and winter).
To simulate the dispersion of VOC in office 11, the fluid dynamic field was calculated, schematising the forced ventilation system to faithfully reproduce the real case, and providing an inlet and outlet airflow of 180 m3/h, equally distributed between the micro-perforated panels of the false ceiling.
The results of the CFD simulations are presented in
Figure 9 and
Figure 10. It is evident that in the summer case, the VOC concentrations are higher near the floor of the room. This is because air circulation develops mainly in the upper part of the room, as shown in
Figure 9a–c. Whereas with increasing ventilation the concentration of VOC decreases, here there are concentrations of 2 orders of magnitude lower than in the other parts of the room.
Figure 10a–c further clarifies the role played by the configuration of the ventilation system concerning the conformation of the room. The winter configuration, compared to the summer one, favors more the dilution of VOCs throughout the volume of the room and from the maps,
Figure 10d–f, and lower concentrations can be noted than in the summer case.
Knowing the fluid dynamic field allows us to consider the areas of possible VOC accumulation. The ventilation system, thanks to its configuration studied in detail, favors the correct exchange of air for the entire volume of the room, but the highest concentrations of VOC occur near the source (walls) and in the corner opposite the outlet micro-perforated panel in both forced ventilation configurations (summer and winter). These are critical areas of VOC accumulation where the concentration is maximum and equal to 100 μg/m3 in the summer case, and 50 μg/m3 in the winter case. The CFD model calculates the concentration in kg/kg, but this has been converted to μg/m3 to compare it with the results of the box-model simulation and with the sampled values.
Similar considerations can also be made by analysing the results of CFD simulations in the meeting room. In this case, for computational reasons, the forced ventilation system has been represented with some simplifications: the 19 micro-perforated panels for the incoming air have been schematised with 8 panels with the equivalent area, and for the same reason, 2 panels have been used for exhaust air, instead of 4. For the simulations, an airflow rate of 475 m3/h was considered.
The VOC concentration fields in the meeting room, resulting from the CFD simulations for the non-stationary case for the summer configuration, are represented in
Figure 11a–c, and for the winter configuration in
Figure 12a–c. Observing these figures, it is possible to notice that the VOC concentration is distributed following the structures of the airflow field; in the meeting room, the higher flow rates and the configuration of the more complex ventilation system trigger a more complex speed range, compared to office 11, but this favours a greater dilution of VOC.
In the summer case, after 10 h from the start of the simulation (
Figure 11d–f), the critical areas for the accumulation of VOC are the corners formed by the short walls and the wall with the doors. The movement of the air mainly involves the central part of the room, while in the areas near the walls the air is practically still, here the VOC concentrations are of the order of 10
1 µg/m
3.
A similar situation also occurs in the winter case (
Figure 12d–f); the concentration maps show how the area where the highest concentrations of VOC are found is in the vicinity of the short walls, approximately of the order of 10
1 µg/m
3.
3.4. Comparison of Sampled and Simulated VOC Concentration
CFD simulations make it possible to obtain a 3D representation of the indoor VOC concentration useful for understanding the dynamics of diffusion processes in indoor environments. Unsteady CFD simulations of VOC diffusion allow us to evaluate the temporal variation of the concentration; the results show that this reaches stationarity after a few hours from the start of the emission. The asymptotic values of the VOC concentration are on average in the order of 10−1 µg/m3, both in the winter and summer configuration and for both environments. The same order of magnitude is obtained by evaluating the concentrations calculated with the box-model for similar ventilation conditions, i.e., the same AER. Indoor VOC concentration, extracted from CFD simulation in the low-concentration zone corresponding with the sampling instrument position, was found similar to the one obtained with the box-model. In particular, a VOC concentration equal to 0.2 µg/m3 and 0.5 µg/m3 was estimated, respectively, with the CFD and box-model considering the meeting room with a ventilation rate of 1.7 h−1. Referring to office 11, the inferred concentration was 0.2 µg/m3 and 0.59 µg/m3 with a ventilation rate of 4 h−1.
These results allow us to say that, despite the simplifications adopted in the CFD model, the obtained result highlights the usefulness of CFD in studying indoor air quality problems related to building materials as also highlighted in the literature [
22,
31,
32,
36].
However, in the present work, CFD results cannot be quantitatively compared with experimental data in which there is a probable contribution from the outdoor environment of a higher order of magnitude.
Otherwise, the results obtained with the box-model considering both the indoor VOC source and the outdoor VOC contribution, although the latter is estimated by literature, were considered comparable with experimental data.
Table 6 shows the comparison, concerning the two environments, between the measured VOC concentration and the one calculated with the box-model (case 4), both averaged over the entire sampling period. In detail, the latter concentration is derived from the “s-VOC_MAT/OUT_ Rvent” curve presented in
Figure 5.
4. Discussion
4.1. Validity of the Numerical Model and Control of TVOC Emissions for Building Design
An important advantage of the box-models is the possibility they offer to investigate with relative simplicity the different contributions to the total indoor concentration. Given the choice of the type of numerical model to be used, the quality and reliability of the simulated results will depend on the availability and quality of input data. In the investigation of indoor VOC concentrations, it is, therefore, essential to have data relating to the emissions of materials present within the environment and the circulation data of the air, in addition to those due to any external sources or related to the activities carried out in the environment.
From the analysis of the data, it is evident that the concentrations measured in both environments, with an average value of 25–30 µg/m3, are one order of magnitude lower than the IAGV of 600 µg/m3. The concentrations calculated considering only the contribution of the VOCs emitted by the walls assume values approximately equal to 1% of the measured concentration, both for real (variable value) and design ventilation (constant value). This result is due to the use in the environments, and consistently in the model, of a highly low-emissivity material.
It is interesting to compare the trend of the two curves relating to emissions due to an internal source for variable or constant ventilation. From the curve relating to variable AER conditions, the dilution mechanism operated by the ventilation system on the constant emission due to the finish is evident and, on the contrary, an increase in indoor concentration is observed for lower ventilation rates.
Observing the results obtained considering the entry of VOC from the outside, the weight of this contribution is evident. Despite having estimated a relatively low quantity for outdoor VOCs, 20 µg/m3, the effect on indoor concentration is significative. This is due to the outdoor contribution that is entered with the HVAC system and is, therefore, linked to the AER, which results in a fundamental forcing of the problem.
It is interesting to note, as proof of the greater influence of the outdoor contribution compared to that due to internal sources, that data simulated with only outdoor VOC or outdoor VOC and internal source assume similar values.
Furthermore, it is important to underline that, in this discussion, no filtration phenomena have been considered, with consequent lowering of concentrations, achievable through HVAC systems.
Finally, it is clear that for a correct estimate of indoor concentrations it is essential to know the ventilation of the environment or the AER, and at the same time, the knowledge of outdoor concentrations cannot be ignored. These, among other things, are strongly dependent on the external wind field, the building geometry, the intensity and position of the pollutant sources [
37,
38,
39,
40].
The analysis of experimental data and simulations conducted for the different environments, according to different ventilation conditions, made it possible to highlight the contributions of forcings and parameters that determine the concentration of VOC in an indoor environment.
Having conducted the simulations with the primary interest of representing the contribution due to the emissions of building materials and also not having at disposal outdoor sampled data, attention was focused on the fluid dynamic parameters, such as ventilation, and the one related to emissions and extension of materials, extrapolated from the BIM modelling.
In particular, Equation (7) is able to estimate the concentration of VOC (), which is reached in an indoor environment of known volume (, in stationary ventilation conditions determined by the due to the emissions coming from an internal source of VOC, consisting of a material, characterised by and distributed on the surface of the area . All these parameters can be obtained from a BIM modelling developed for this purpose. We can affirm that the identification of these parameters, together with the definition of Equation (7), represents the first result in the search for interoperability between BIM modelling and IAQ models.
Using this modelling it is also possible to consider the presence of multiple sources by linearly adding the terms related to the different single sources. Similarly, although not developed in the present work, the model is potentially able to consider a sink term designed to describe the presence of phenomena, such as adsorption on materials, which can occur within the volume-environment. It is important to note that in this case, due to the re-emission from the same materials, the VOC concentration that initially decreases, extend in time. Furthermore, secondary emissions, due to reactions between VOC and outdoor pollutants, such as ozone or NO2, could be potentially added to the model.
4.2. The Role of Building Materials Emissions in the IAQ
The results of the analyses showed that the satisfaction of the emission threshold values (i.e., for the LEED and BREEAM protocols) and the regulatory limits (CAM) do not have a direct correspondence with high indoor air quality. Indeed, the upper limit imposed by the CAM (1500 μg/m3) should first be contextualised compared to the actual air changes in the environment under analysis. Considering a minimum exchange of 0.5 volumes/h as described by the regulations for the evaluation of individual materials, the result is an indoor concentration value far superior to the IAGVs elaborated in the scientific literature.
A fundamental role in the evaluation of IAQ is, therefore, linked to air changes and the design of the HVAC system. The greater the ventilation rate the system is designed with, the greater the dilution of the substances present in the air and, therefore, the lowering of their concentration. The considerations set out here take into account the minimum air change, i.e., a value of 0.5, for two main reasons:
it is not always possible to know the air changes of the HVAC system, in the early stages of the development of the architectural project, or it is not certain that there are air changes higher than the minimum in the absence of mechanised ventilation (i.e., in residential construction);
in the case of the HVAC system with ventilation rates higher than 0.5, a malfunction could occur, which would lead to an accumulation of VOCs in an indoor environment.
The method presented here is intended to be a first verification tool for the designer on the IAQ performance of the building organism. This tool focuses on the performance of the building box alone, precisely to allow the evaluation of design choices, and the proposed guide value is precautionary because the contributions of users, furnishings, and cleaning systems must be considered in the real situation, in addition to the ones of the construction elements. All these other contributions require a more complex simulation in the early stages of the building design.
A critical issue that emerged during the development of the research project relates to the topic of knowledge by the technicians and manufacturers of building materials. Although it is true that to date the majority of construction products are certified and report emission data, these data still appear to be incomplete or not correctly disseminated.
The issues can be summarised in the following list:
materials with technical data sheets containing incomplete emission data: not always all the main indoor pollutants are present (i.e., Formaldehyde, VOC, benzene);
unclear understanding of the VOC emission data: when the data are present, it is often not specified with which procedures and tests the value was obtained, how many days after application it refers to, and whether the declared data refer to the VOCs contained in internal material or those emitted.
In most cases, when present, the VOC emission data referred to the TVOCs and not to a specification, with reference at least to the main compounds. However, it should be noted that there were also manufacturers who provided complete data of certifications and indications on the methods of testing the emissivity of materials, and which allowed the analyses to be carried out.
These considerations have directed the project to focus on the TVOC data, which, therefore, appears to be the easier one to find even for architectural designers.
It is certainly necessary to work for greater awareness of the IAQ theme and for an increase in the technical knowledge of both the designers, who must request the information and the manufacturers, who must provide it; this work could make the design towards Healthy Buildings and the simulation of significative performances more effective.
4.3. Use of CFD Simulation of TVOC Concentration
The three-dimensional representation obtained using CFD models allows the concentration field that is established in an indoor environment to be visualised realistically, highlighting a fundamental aspect in diffusion problems, namely, the position of the sources concerning the indoor fluid dynamic field. CFD is, therefore, particularly useful for highlighting the role of ventilation in determining the spatial distribution of dispersed contaminants. At the same time, it has the disadvantage of requiring high calculation times and costs, especially in the case of unsteady simulations to take into account variations in the fluid dynamic boundary conditions, i.e., variable ventilation. Furthermore, to date, interoperability with current digital modelling tools for building design such as BIM is not guaranteed [
41,
42].
The representation of forced air circulation by the ventilation system, simulated with CFD, allows us to appreciate its spatial variability but having approximated the geometric characteristics of the micro-perforated panels, it is not reproduced in detail. CFD remains a very useful tool for the study of the fluid dynamics field and is a necessary step in the analysis of air quality problems.
More detailed CFD simulations could be carried out taking into account various aspects: the VOCs emitted by the furnishings, the contribution of external VOCs entering the ventilation system, and any reduction due to the presence of a filtration system. From the fluid-dynamic point of view, a detailed representation of the micro-perforated panels or fundamental aspects such as solar radiation on the windows and the temperature differences between the different environments could be implemented.
In the specific case of this study, the numerical simulations, albeit characterised by simplifications due to the lack of data relating to some of the forcings involved, nevertheless made it possible to adequately represent the complexity of the 3D velocity field, thus highlighting the role essential for ventilation in diluting the VOCs emitted by the walls and allowing the identification of critical areas for the accumulation of contaminants.
The convergence achieved between the data, obtained with the two different modelling tools, provides a result confirming the applicability of the box-model. The box-model allows a first evaluation of the IAQ concerning an average value reached in the indoor environment and finds its application in the building design control and for the comparison with the concentration values defined by the IAGVs. On the other hand, this modelling does not allow a detailed spatial analysis necessary for understanding the critical issues related to the positions of the sources and, therefore, the creation of areas of accumulation of pollutants, which instead is allowed by the CFD.
4.4. Limitations and Future Research Directions
The study has a limitation concerning the sampling protocol implemented. Although the environmental sampling was carried out following the indications for monitoring VOCs in indoor environments issued by the CEN (European Committee for Standardisation) and the ISO (International Organisation for Standardisation), as well as by the Italian implementation of UNI (Italian National Body of Unification) through the technical standard UNI EN ISO 16000, and the recommendations proposed in the document prepared by the European Concerted Action (ECA) in report number 6 ‘Strategy for sampling chemical substances in indoor air’, it was possible to carry out the sampling for only 3 days for 2 indoor environments. Unfortunately, the period of the Covid-19 pandemic has severely limited the availability of access to the case study. Despite this, the sampling was carried out for 3 days in a row, showing a complete history of the indoor environments both during the day and at night. In particular, the absence of users made it possible to concentrate the reading of the results on the building materials data only, avoiding further confounding factors. The different orientations of the two selected environmental units (NE meeting room—SW office11) allowed a differentiated reading of the sampling data, also concerning the position of the sun. Undoubtedly, the air temperatures show a rise in the early morning hours in the meeting room and late afternoon in office 11. Therefore, future research developments will have to consider a temporal extension of the sampling, from 5 to 14 days, and the repetition in two different seasons (summer and winter). For further confirmation regarding the contribution of VOC entering from the outside through the ventilation system, measurements should be carried out simultaneously in the two environments, indoors and outdoors. Outdoor VOC sampling data should be used as input in numerical modelling to perform realistic conditions.
Regarding the numerical modelling, extensively used CFD models such as ANSYS Fluent could be used to investigate VOC indoor concentration performing detailed simulations that consider both the indoor and outdoor VOC contribution as well as a proper representation of the fluid-dynamic field.
Another criticality is represented by the sampling of TVOCs only, but this aspect was linked to the possibility of obtaining technical information by the manufacturers of building materials and was discussed in
Section 4.2. Future research developments should consider a specification of VOCs, at least in the major ones discussed in the scientific literature. In the current state of product certification and manufacturers’ awareness, this appears to be a critical issue.
Finally, it is emphasised that some simplifying conditions were necessary. In particular, it was decided to simulate the emission of VOCs in the rooms as coming from a single type of material: the internal finishing paint applied to the walls. This choice, while offering a limited estimate of the real concentration established in the environments, made it possible to highlight the contribution related to the materials in the VOC concentrations simulated in indoor environments. The choice is also simplifying from the point of view of the actual composition of the materials present in the rooms. The material charged with the emission of VOC with this hypothesis is considered as composed solely of the finishing layer, thus not considering the presence of the underlying layers.
It was decided to carry out this simplification as it is known from the literature that the emissions from multilayer materials are comparable with those of the outermost top-layer material [
43]. At the same time, because over the years the phenomena of diffusion within multilayer materials have been extensively investigated [
24], the integration of this modelling into the BIM process represents a field of sure interest and possible future development [
44].
Despite these limitations, the study made it possible to analyse the relationship between IAQ and the contribution of building materials. The scientific literature appears substantial and consolidated on the emissivity of these materials, relegated to test chambers rather than to real contexts. An area of great interest, but difficult to investigate, is that of the analysis of the various contributions that add up in the definition of the concentrations of pollutants in an indoor environment: people, building materials, outdoor air, furnishings, and cleaning products. The peculiar condition of the case study, still devoid of users and furnishings, allowed this fundamental step. Furthermore, as the population spends more than 90% of their time in different confined spaces, useful future research developments could be directed towards additional analyses in residential and commercial spaces, as well as in the workplaces.
5. Conclusions
The profound qualitative changes in indoor air and the progressive increase in the absolute number of pollutants, combined with the scientific awareness of the health impacts deriving from spending more than 90% of one’s time inside confined spaces, have increased the attention to needs of psycho-physical well-being and health of users.
In this context, salutogenic design finds fertile ground since, by focusing on the potential positive impact of design on health, through the application of the principles of health building, it allows the design of buildings that promote health and well-being.
The scientific attention to these issues has produced numerous pieces of research that lead to an evidence-based investigation to investigate the performance aspects of construction most relevant to the health of users [
13].
The complexity of the IAQ theme, with its specificities in terms of environmental hygiene and chemistry of materials, places the architectural designer in a condition of complex application of rules and laws, mainly oriented to the emissivity of materials rather than concentrations of indoor pollutants. Furthermore, as demonstrated in the results, the mere satisfaction of the emissivity limits of the materials is not equivalent to the definition in an indoor environment with tolerable TVOC concentrations. The noncomplete definition of the performance specifications in the regulatory field, therefore, obliges us to refer to the IAGVs, making the application in the project even more complex, as well as nonmandatory. The method presented here is intended to be a first verification tool for the designers of the building organism on the IAQ performance. This tool, therefore, focuses on the performance of the building box alone, precisely to allow the evaluation of design choices.
What is presented is a first step of the research “BIM4H&W: BIM for Health and Wellbeing” (POR FESR LAZIO 2014/2020–Integrated projects) and in another contribution by the authors presented in this special issue, the application of this VOC prediction model is developed by integrating it with digital aided design systems such as BIM (Building Information Modelling) [
44].

 ,
, 


