Article

Introducing a Multiscalar Framework for Biocluster Research: A Meta-Analysis

Leibniz Institute of Agricultural Development in Transition Economies (IAMO), 06120 Halle (Saale), Germany
*
Author to whom correspondence should be addressed.
Sustainability 2020, 12(9), 3890; https://doi.org/10.3390/su12093890
Submission received: 25 March 2020 / Revised: 6 May 2020 / Accepted: 7 May 2020 / Published: 9 May 2020
(This article belongs to the Special Issue Sustainable Bioeconomy)

Abstract

:
Bioclusters have grown in popularity in the last decade in response to the global environmental and climate challenges. These clusters envisage sustainable and local production value chains in different sectors of the bioeconomy. However, the sustainability of these clusters is often questioned because of the negative social and environmental effects they can have both inside and outside of their region. At present, a framework is missing to analyze these effects that span multiple levels and multiple scales. The aim of this paper is to develop such a multiscalar framework. For this aim, we conducted a meta-analysis of biocluster case studies. As a result, we constructed a framework that combines the aspects of sustainability, knowledge and resource flows, cluster network properties, and the political and institutional structures. We tested this framework on the question of how the different scales of biocluster performance interact and depend on each other.

1. Introduction

The bioeconomy was originally envisaged as an alternative economic system that would not jeopardize the environment, and that would provide a safe living for future generations [1]. In recent years, this concept has been growing in popularity, in both the science and the policy arenas, as a potential way of organizing production and consumption practices in society in a more sustainable way by using renewable and biological resources instead of fossil fuels [2]. In a bioeconomy, energy, materials, chemicals, food, and feeds are produced using plant and animal sources [3,4]. The hope and expectations of a bioeconomy are that it can combine combatting climate change and the reduced use of fossil fuels with the promotion of innovation, the knowledge economy, and rural and regional sustainable development [5,6]. As such, a transformation toward a bioeconomy promises innovative and sustainable use of renewable biological resources in different sectors of the economy, and opens new avenues to reach different Sustainable Development Goals (SDGs) [7,8].
However, a bioeconomy transformation does not automatically imply sustainability. Carelessly designed bioeconomy strategies can lead to economic, social, and environmental problems [9]. The history of first-generation biofuels reminds us how different issues related to indirect land use, deforestation, biodiversity losses, and negative social and environmental effects might arise at different geographical levels [4,10,11,12,13].
Therefore, one of the central challenges of the transformation process toward a bioeconomy is dealing with the inherent complexity of increasing the scale of production, while at the same time balancing the social and environmental aspects of sustainability that contain many of the SDGs [4,14]. In order to deal with this complexity, it is necessary to develop a framework that addresses the question of how certain developments on one level ultimately influence processes occurring at other levels, because in complex systems, cause and effects are often linked at different scales and levels [15,16]. Such a scale-sensitive framework is especially relevant for bioeconomy clusters (hereafter, bioclusters) that are nowadays central to many national bioeconomy policies and will play an important role in bioeconomy transition [8,17,18].
Economic activities tend to cluster in specific regions [19,20], and the activities in the field of bioeconomy are no exception. Clustering may promote innovativeness, productivity, regional economic development, employment, and business competitiveness [21,22,23,24,25]. The transition to the bioeconomy is often practiced in bioclusters in Europe and all over the world [17]. These bioclusters are used by the governments to strengthen the collaboration between different bioeconomy actors and, ultimately, to contribute to active learning and to enhance the innovative activity in the bioeconomy. Building upon the cluster definition of Porter [26], we define bioclusters as specific types of sustainability-oriented clusters that constitute geographically proximate and interconnected firms and organizations specializing in various fields of bioeconomy. Different types of bioclusters vary in their resource use, production, structure, and goals [17]. One common biocluster classification is the “colors” of the Knowledge-Based Bio-Economy (KBBE) concept [27]. The “green” KBBE clusters focus on the agro-food sector with agricultural resources as inputs, the “white” KBBE clusters are more industrialized types of bioclusters focusing on bioenergy, biochemicals, food ingredients, pulp and paper, etc., the “blue” KBBE clusters cultivate and process marine biological resources, and the “red” KBBE clusters largely focus on healthcare, bio-pharmacy, and clinical research.
Bioclusters prove to be particularly relevant for developing a multiscalar framework, because, first, they are supposed to work on sustainability and to maintain sustainable interaction between ecology and economy [28]. Second, bioclusters offer the opportunity to localize the whole production value chain within the same region [29,30], while simultaneously being embedded into the global resource streams. This means that a multiscalar framework for bioclusters would combine scales accounting for the processes both inside and outside of the biocluster. The primary aim of this paper is thus to develop a multiscalar framework that makes it possible to study their sustainability effects at different scales and levels.
This paper proceeds as follows: in Section 2, we discuss the concept of scales and multiscalarity, their importance in sustainability issues, and their application for biocluster analysis. Section 3 describes the methodology of this study. Results of our research are presented in Section 4. Section 5 provides a discussion of the results, and the paper ends with a conclusion.

2. The Concept of Scales and Multiscalarity

We argue that biocluster research requires a more scale-sensitive approach in order to ensure more stable and reliable prospects for the bioeconomy. Studies on human–environment dynamics [31], socio-ecological systems and resilience [32], policy debates on sustainability [33], and the development of agricultural grassroots innovations [34] have previously applied scales, levels, and dimensions. These concepts become central to our research design as a means to better understand the biocluster-internal aspects, and the different connections of bioclusters to the outside world.

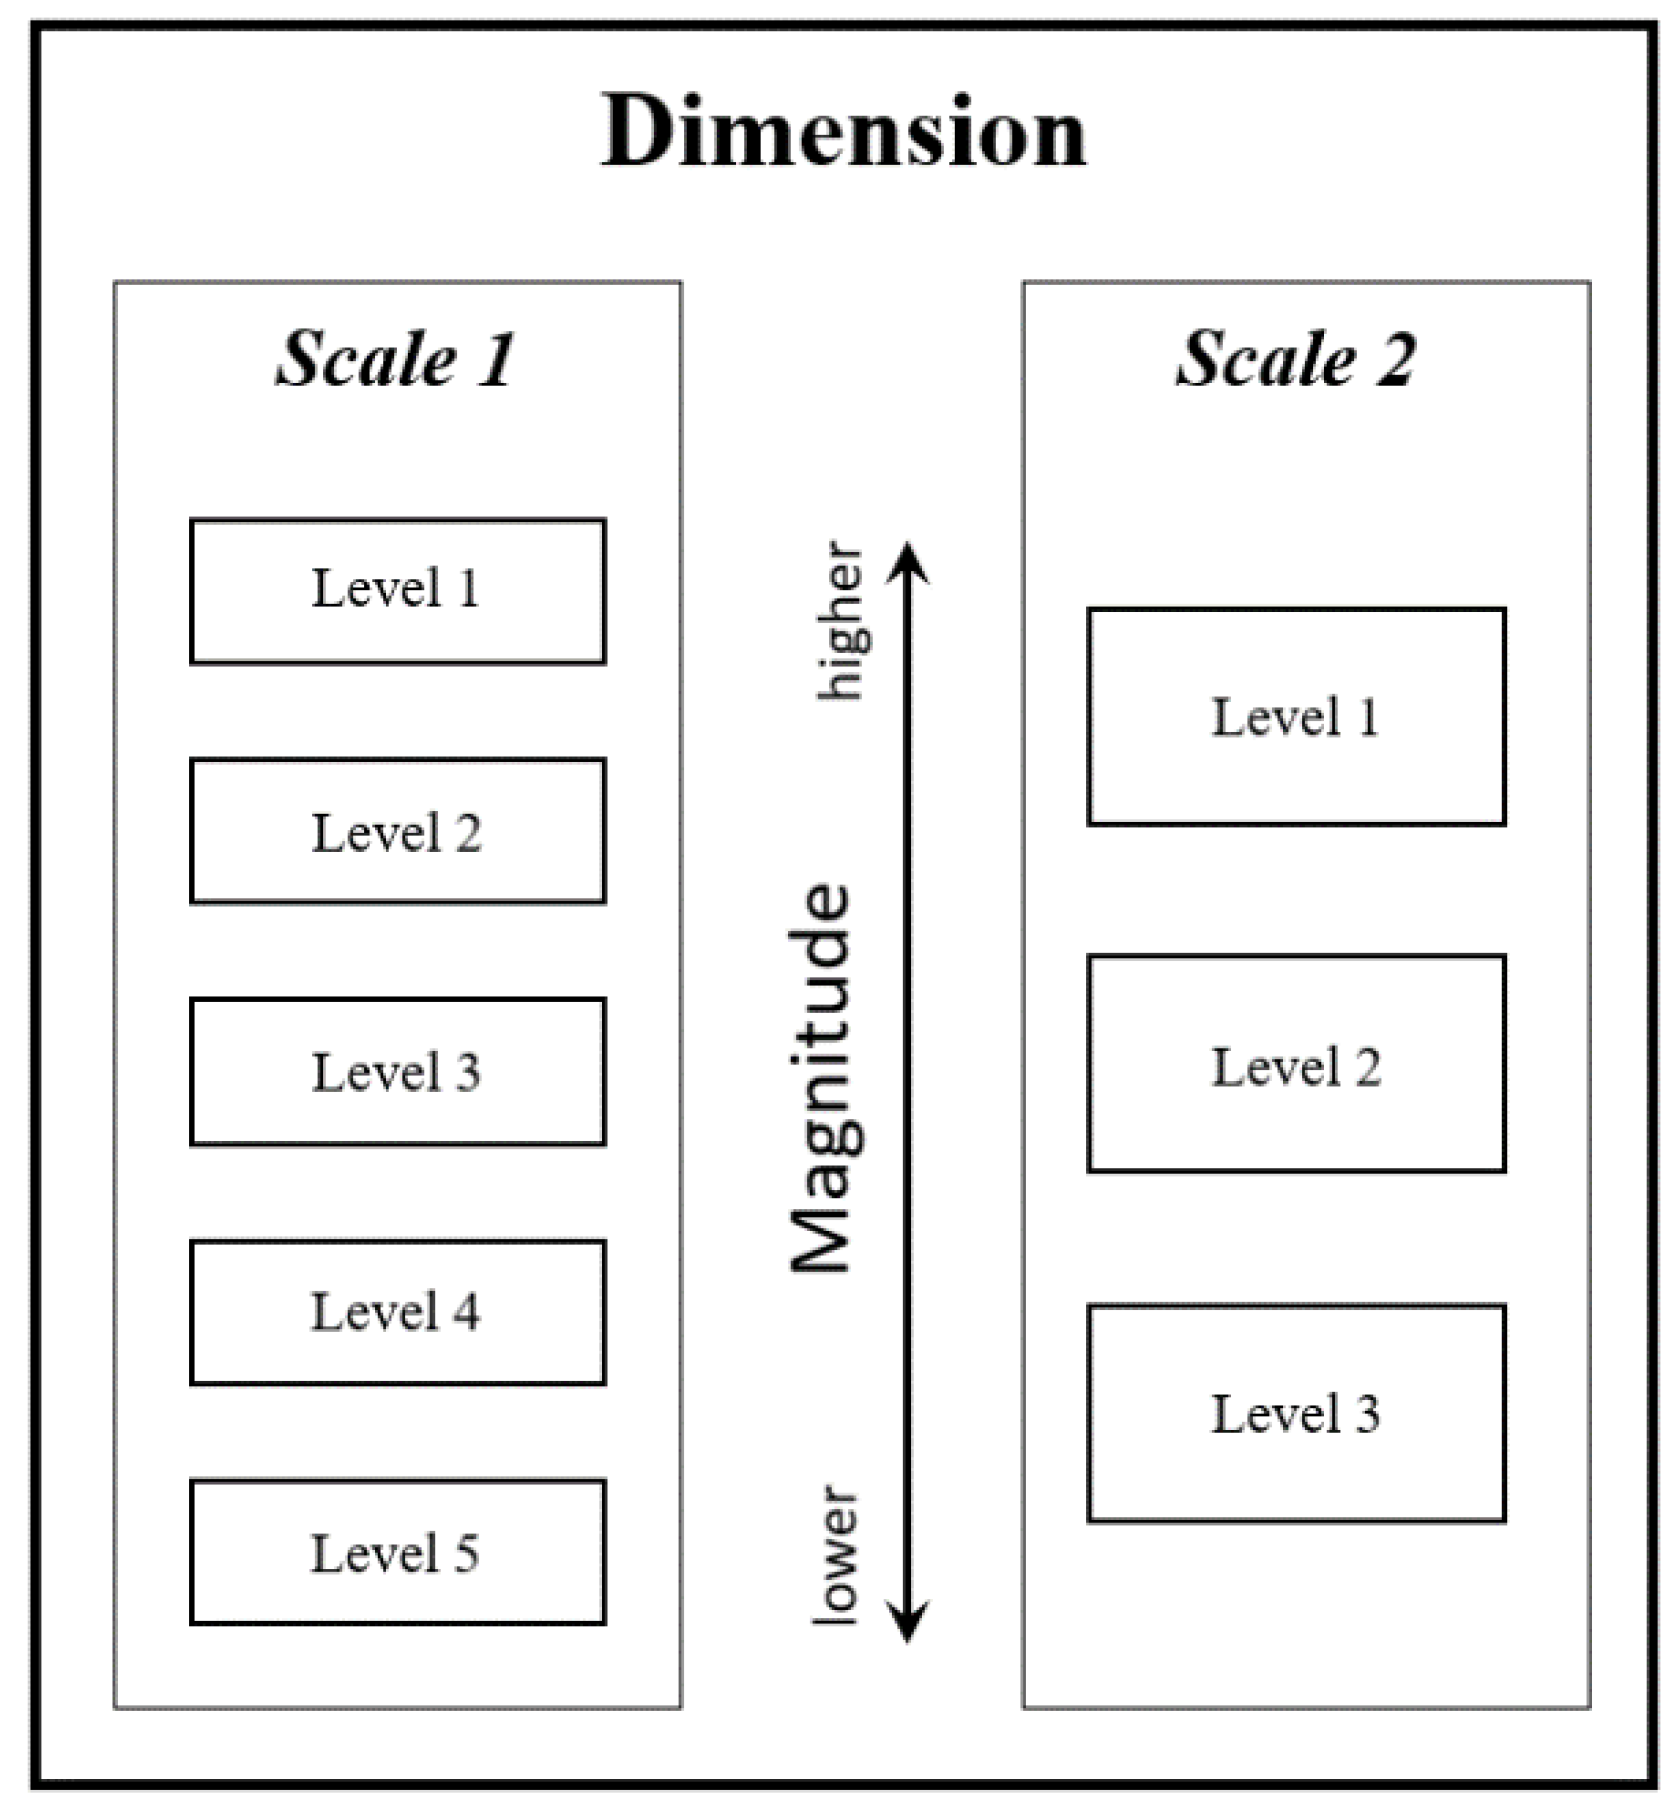
2.1. What Are Scales

Scales are widely applicable in modern society due to the way the latter is structured [35,36]. The decisions people make, the laws they pass, the rules they follow, the knowledge they exchange, etc. all happen on different levels that are either formally defined or socially created. The meaning of terms like dimension, scale, and level differs depending on where and how they are applied [37,38]. We define them based on Gibson et al. [36], who refer to dimensions as concepts we want to study, scales as measures for different spatial, temporal, quantitative, or analytical aspects, and levels as specific positions on those scales. A schematic illustration of two scales with different numbers of levels is shown in Figure 1. The lower levels on the scales correspond to the lower magnitude of the scale. Accordingly, the higher levels stand for the higher magnitude.
The levels on the scale present information about the scale. Scales can have nominal, ordinal, interval, and ratio levels. In our framework, we assume a basic order or hierarchy between levels, which means we do not incorporate “unordered” nominal scales (such as male and female gender levels). Ordinal scales have a basic order in their levels that can be qualitatively expressed in higher and lower levels. Interval and ratio scales contain levels that can be quantified. Interval scales have levels with proportionate intervals between levels, and ratio scales also include a true zero point. Temperature can be measured in Celsius or Fahrenheit (interval scales) or in Kelvin (ratio scale).
In Figure 2, we illustrate this with examples of six scales and discuss them in the context of their application in cluster analysis.
The most commonly used example of a scale in sustainability research is the geographical scale. It is used to measure the spatial range of events and processes [31,33,34,36,37]. The levels on the geographical scale denote the exact specification of the territorial boundaries: these are usually the local, regional, national, international, and sometimes the global levels. For clusters, this scale is relevant to measure their geographical span. Newly emerging clusters are often small and thus local in nature [39], but over time clusters can grow or merge, crossing regional and even national boundaries. The administrative scale includes the various levels of government that influence the cluster through the laws and regulations that apply for the cluster [31,34]. The institutional scale represents the hierarchy of rules, laws, and regulations [31,33,34]. The levels on this scale illustrate how agreements between actors can evolve from some simple informal rules to the formal laws and constitutions. In small emerging clusters, informal rules may suffice to coordinate activities, but as clusters grow in membership, these informal rules often need to become more formalized and codified. These three scales are widely applied in the literature on sustainability, human agency, and social change [31,33,34]. We consider these scales as primary for cluster analysis, because they address the key elements of space, power, and governance.
The geographical, administrative, institutional, and trust scales are ordinal scales: they have qualitative levels with a certain order. The network size is a ratio scale (it has a true zero point). It measures the size of a cluster by the number of actors and can indicate any value from zero up to the largest observed quantity of actors. All these values would be the possible levels on this scale. The heterogeneity scale says something about the composition of the cluster, based on economic sector classifications such as NACE or ISIC. The amount of different economic sectors within the cluster can be measured quantitatively in certain intervals. The heterogeneity scale can thus have all the possible values between homogeneous actors (only producers or manufacturers from the same sector) and complete heterogeneity: all actors from different sectors.
Literature on scales and their application often point to an important issue of completeness of scales as well as issues such as complementarity, substitutability, or independence [33,34,35]. It is problematic to ensure that, in a given scale analysis, all the relevant scales and levels have actually been included. This issue may not be highly problematic for natural scientists, because they normally share a common understanding of the existing hierarchies and levels within their disciplines [36]. In social sciences, however, there is no common consensus as to which scales and levels constitute the studied phenomenon. This is especially the case for issues related to the essentially contested concept of sustainable development: there is no single definition that covers all its different aspects [40,41]. Consequently, researchers, guided by their interests in a particular discipline, often choose the scales and levels arbitrarily to some extent [33,36].
Since the primary aim of this paper is to create a multiscalar framework for bioclusters that can help to study their effects on multiple scales and levels, this is an important issue to be aware of. For instance, it is possible to notice overlaps within the scales we illustrated in Figure 2. The scale of trust and the institutional scale may overlap because a high level of trust between actors is likely to be a pre-requisite to maintain informal operating rules in a cluster. Alternatively, considering the scales of geography and network size, an emergent cluster with a small network size is unlikely to spread beyond the local geographical level.
Another problem related to the use of scales has to do with their measurement. For instance, a quantitative scale such as network size can be relatively easy to measure if the data on the number of actors in the cluster is available. On the contrary, measuring a qualitative scale such as trust is likely to be a complicated task, because it would require collecting and analyzing sensitive data on personal and cooperative relationships between actors in the cluster. This is not to say that qualitative scales are more difficult to measure than the quantitative scales. Instead, the measurement difficulties depend on the data, on which the scale is built, and on the concept behind the scale. This is especially the case for sustainability issues that we will discuss in the next section.

2.2. Scales for Sustainability Performance of Bioclusters

Scales and scaling are especially important for decisions and processes dealing with sustainability [31]. This is due to the complexity of sustainability issues that are not confined to activities and processes happening on a single scale or a single level. Furthermore, when a sustainability issue is discussed, researched, or managed, it is often the case that a single set of processes is cut from the general context, whereas the related effects occur on the higher levels or on other scales [31]. This also seems to be related to the conformist tendencies of the traditional scientific and managerial approaches toward adhering to their own disciplinary scopes [42]. If these tendencies prevail, it may result in adverse effects and unexpected outcomes that Cash et al. [31] generalize under the idea of scale challenges such as ignorance, mismatch, and plurality.
An ignorance challenge arises when certain scales, levels, or their dependencies are not taken into account. This challenge commonly manifests in the consequences that a managerial effort on a certain level has on other levels of the same scale. The challenge of mismatch may occur when the characteristics of an institution at a higher level do not fit those characteristics at lower levels. Finally, the plurality challenge has its roots in the tendency to devise simple and manageable solutions, designed to satisfy all actors involved in a scale. However, there is often strong heterogeneity in the way actors perceive and value the scale [31]. As mentioned by Loorbach and Rotmans [43]: “…a practical implementation of sustainable development has to incorporate the inherent conflicts between the values, ambitions, and goals of a multitude of stakeholders.” An inadequate representation of all of the stakeholders and their interests at a certain scale or level can bring about the challenge of plurality [33,38].
For the application of bioclusters, this means we should look for specific sustainability performance indicators. Conventional clusters are known to have advantages regarding economic performance, which include increased innovativeness, productivity, employment, and competitiveness [22,23,24]. Successful clusters are supposed to have and maintain these advantages. Bioclusters differ from conventional clusters in that they can work toward sustainability [3,8,28,44], and this means that the performance of bioclusters should be broadened to include social and environmental scales as well [3,8,44].
In line with the second aim of our study, we want to test the relationship among the economic, social, and environmental performances of bioclusters. Therefore, we included the three scales of biocluster performance into the multiscalar framework. However, the issue of completeness of scales, discussed in Section 2.1, might become even more complex if we use scales to measure sustainability. Which scales best represent the different sustainability pillars? Although attempts have been made to structure the different SDGs along the three sustainability pillars [45,46], there has been limited consensus so far. This means that we have not classified the scales of economic, social, and environmental performances into a single dimension beforehand, because they can represent a multitude of different indicators and effects. Instead, we will look at the literature through a meta-review and classify some of the indicators we find there in these three broad categories of biocluster sustainability performance. Building on the ideas discussed above, the two aims of this study are as follows: first, to develop a multiscalar framework for bioclusters, and second, to test the relationship among the economic, social, and environmental performances of bioclusters. To reach the aims of our study, we conducted a systematic review of biocluster case studies. The next section presents the methodology of our review.

3. Data and Methodology

For integrating results, insights, or perspectives from different independent studies, scholars often use the method of quantitative meta-analysis [47,48]. Using this method, we analyzed the content of different biocluster case studies to find out the scales and levels involved in these bioclusters.

3.1. Article Retrieval

This study is based on the data derived from 35 articles on biocluster case studies indexed in the Scopus database (https://www.scopus.com). Keyword selection was the main tool for identifying the necessary literature. Following the advice of Ramcilovic-Suominen and Pülzl [4], we did not restrict the notion of a bioeconomy to its novel sense of highly engineered bio-based manufacturing that is at the forefront of the current European Union bioeconomy policy. Instead, we took a broader perspective and considered sectors such as forestry, agriculture, and fisheries. We thus developed an algorithm that searched for the words bioeconomy, biobased, eco-industrial, cleantech, biofuel, agroindustry, agribusiness, wood, mari*, and aqua* occurring together with the words cluster, industrial district, agglomeration, park, innovation ecosystem, and industrial ecosystem in the titles, abstracts, and keywords of the articles. Truncations and hyphens created variations of the terms to account for different endings and writing styles. For better precision, we excluded a number of fields from the Scopus subject areas of health sciences, life sciences, and physical sciences. We adjusted the search query to include only publications in English from the period 2000 to 2018. The final search query was run in July 2018 and produced 4027 articles.

3.2. Inclusion Criteria

In order to filter out the necessary case studies from the 4027 results, we refined them by applying four inclusion criteria. First, we only considered articles with case studies of bioclusters. Even though we chose the search keywords and their combinations in a way to retrieve the case studies of bioclusters, only the vast minority of the 4027 results in fact met our expectations. This was because the keywords in the algorithm were still widely used in all kinds of articles that did not focus on case study bioclusters. Fortunately, a quick look at the title and sometimes the abstract made it clear whether the article was a biocluster case study or not. This was the most important filtration step and allowed for the exclusion of around 95% of the articles. Formally, we considered only clusters working with renewable biological resources, which is in line with the definition of bioeconomy used in this paper [3]. Second, we included articles that studied only bioclusters existing in reality. To clarify, we considered bioclusters that were in fact located in some parts of the world regardless of their status or performance compared to other bioclusters. The articles we excluded at this step were those creating (computer) models of bioclusters or designing hypothetical bioclusters for the specific aims of their studies. Third, we excluded case studies of “red biotechnology” clusters focusing on healthcare, bio-pharmacy, and clinical research [27]. These type of clusters, also commonly referred to as, simply, “biotech” clusters, operate largely independently from biomass streams [8]. However, issues related to sustainability often arise where the streams of natural resources are concerned. Since our rationale for developing a multiscalar framework is tied to the issues of sustainability and resource flows, we focused on bioclusters with a strong component of natural renewable resources. Finally, we excluded the articles using the case studies only as a source of a specific type of data. For instance, a few articles retrieved and analyzed the patent data from certain bioclusters. A thorough analysis of these articles revealed that they do not serve the aims of our study and hardly ever point to any scale, level, or dimension. The articles left after applying the last inclusion criterion had a rather descriptive nature of the case studies. They described the history of the bioclusters, studied their growth, resource flows, and networks, analyzed the policy effect on cluster development, the innovativeness of clusters, and their institutional structures, and so on. Applying these inclusion criteria yielded 42 cases reported in 35 articles.

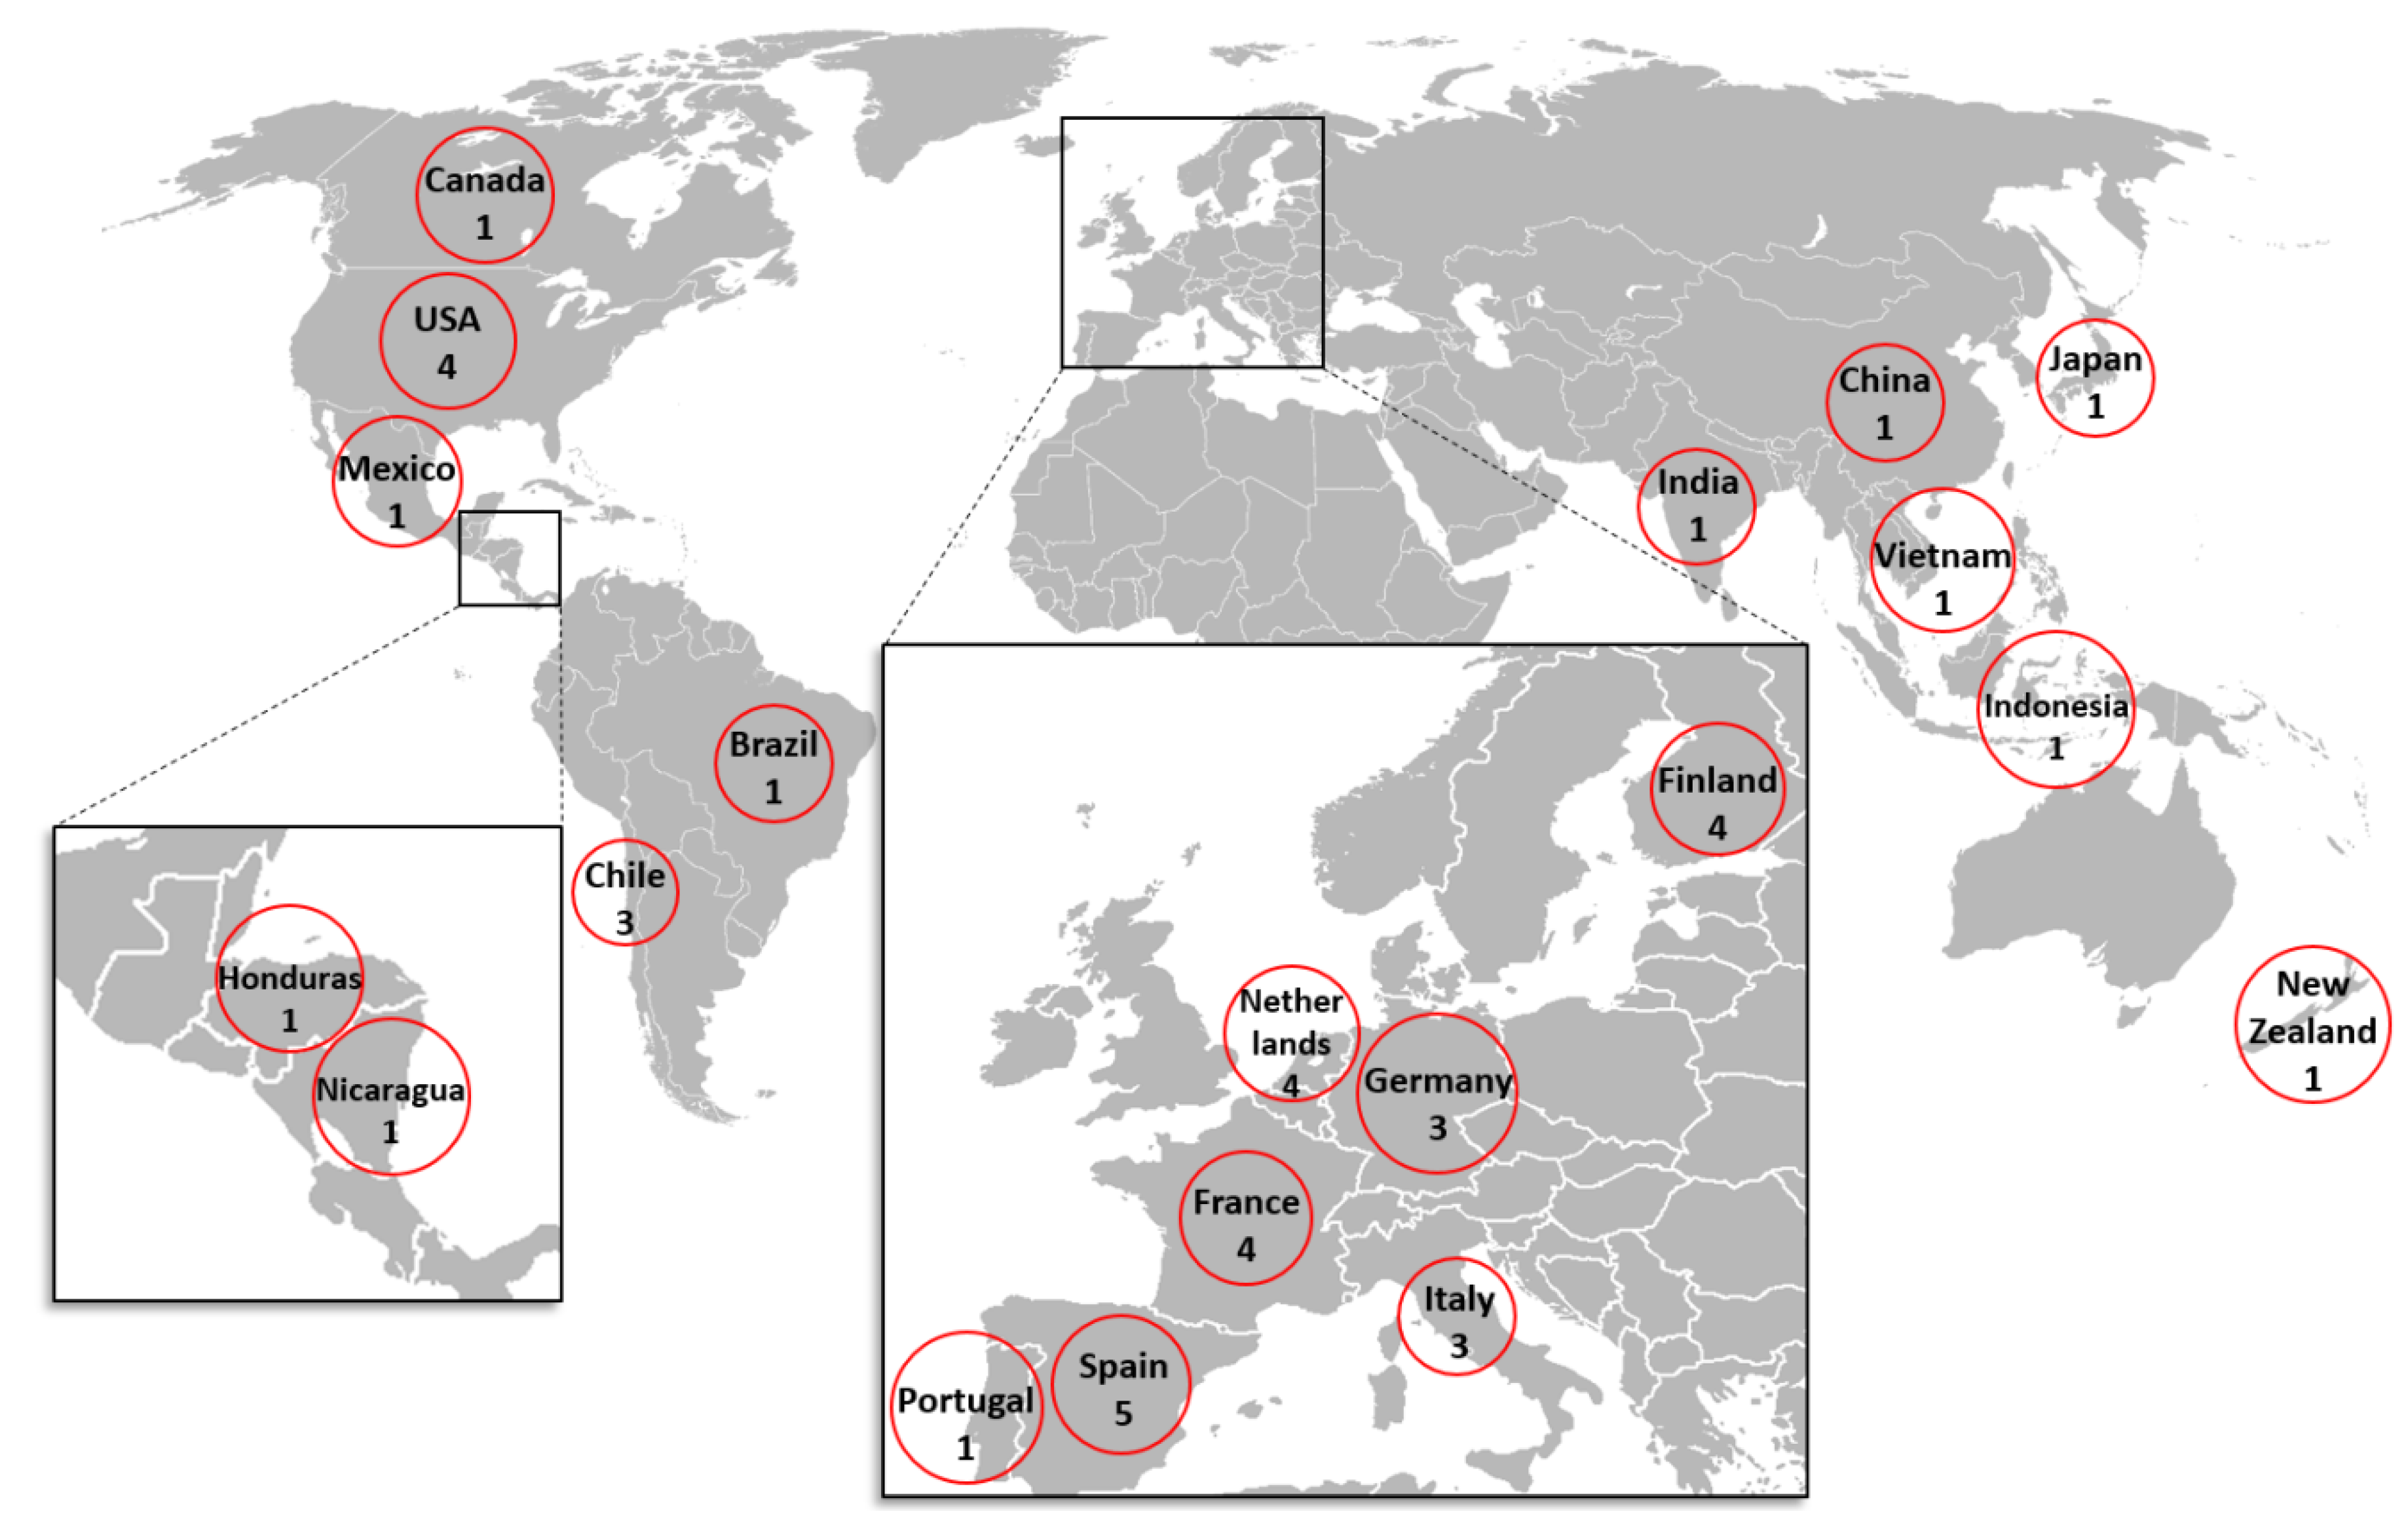
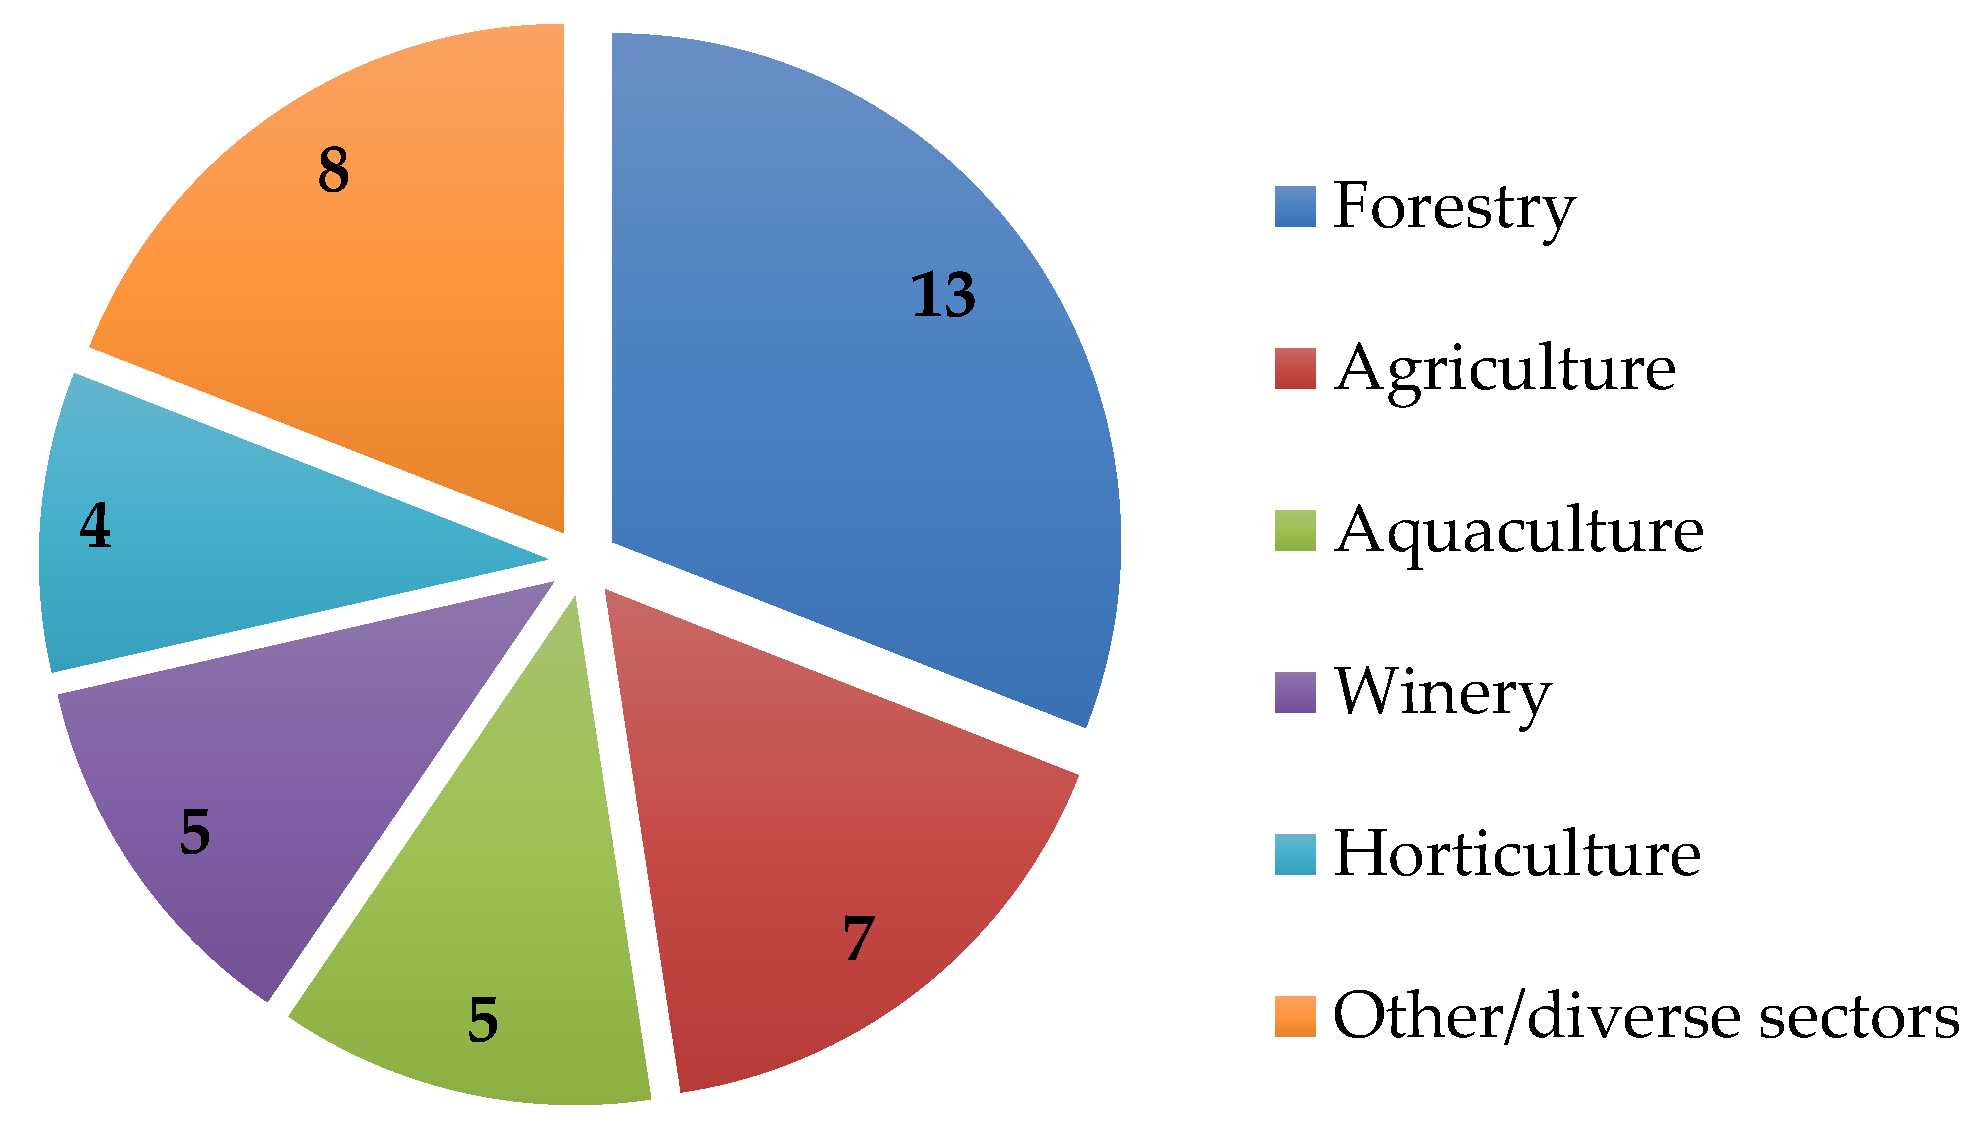
3.3. Description of the Sample of the Case Studies

We would like to shortly reflect on the location of the bioclusters in our set of articles and on the bioeconomy sectors they cover. The 42 bioclusters reported in this paper were localized in 20 countries in different parts of the world. Figure 3 presents the global distribution of the bioclusters in our sample of articles.
Seven countries in Europe were the focus of 24 case studies, thus representing a higher frequency of cases relative to the other countries, and a higher concentration in that geographic region. Outside of Europe, all of the countries, with the exception of the USA and Chile, were the focus of one single case study. This means that there seems to be a significant bias in the spatial distribution of the 42 bioclusters in Figure 3, and the distribution of bioclusters is not representative of all the bioclusters on the planet.
The case studies in our sample of articles specialized in different bioeconomy sectors. We grouped our case studies into six sectors. These are presented in Figure 4.
Forest bioclusters, with 13 cases, were prevalent among the case studies. The other sectors were agriculture (seven cases), aquaculture (five cases), wineries (five cases), and horticulture (four cases). The remaining eight bioclusters had either a broad spectrum of bioeconomy sectors or represented a sector that occurred only in that single case study. As it was the case with the spatial distribution of the 42 bioclusters (Figure 3), the distribution in Figure 4 represents neither the whole spectrum of bioeconomy sectors nor their relative sizes.

3.4. Data Extraction

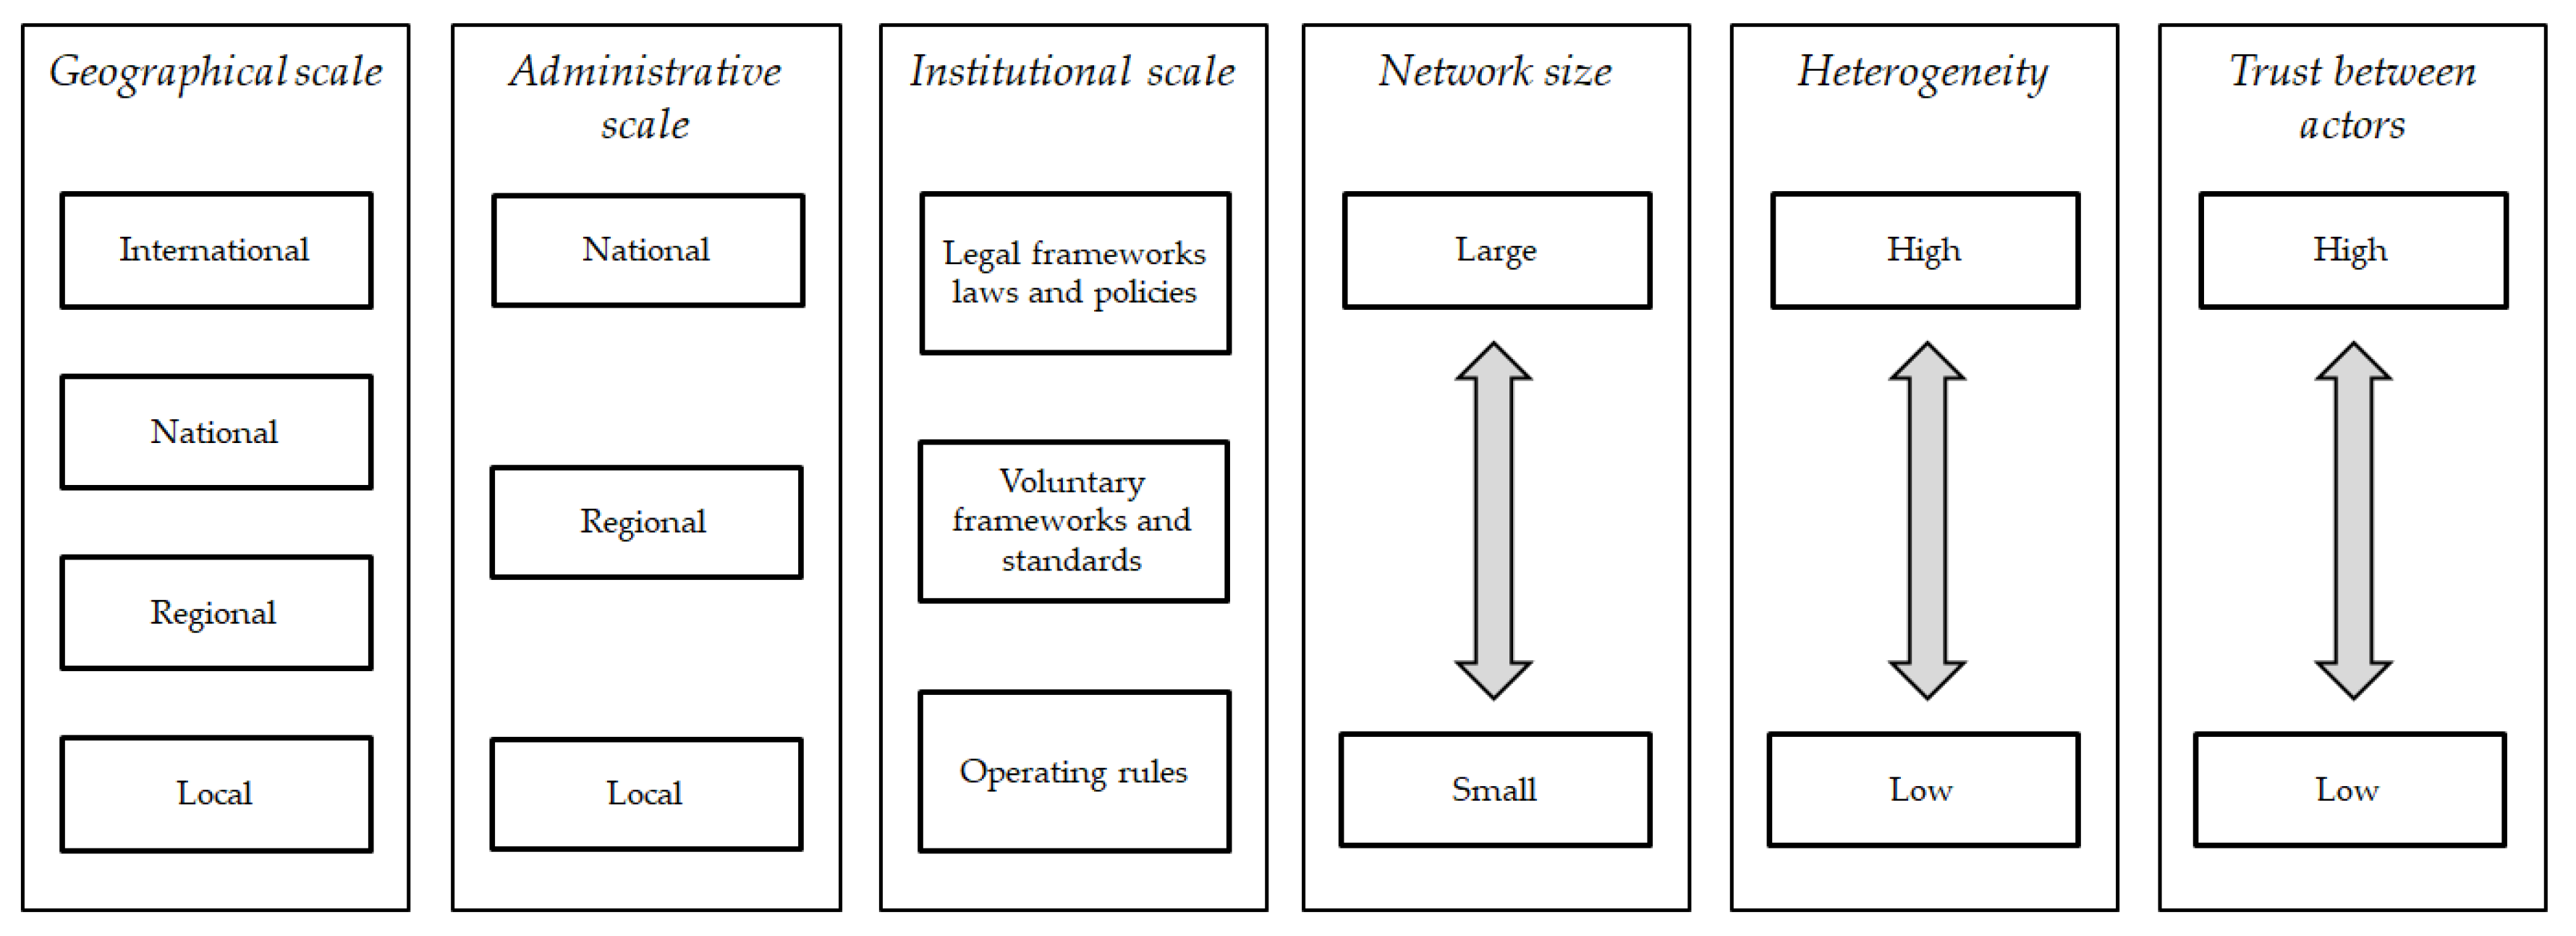
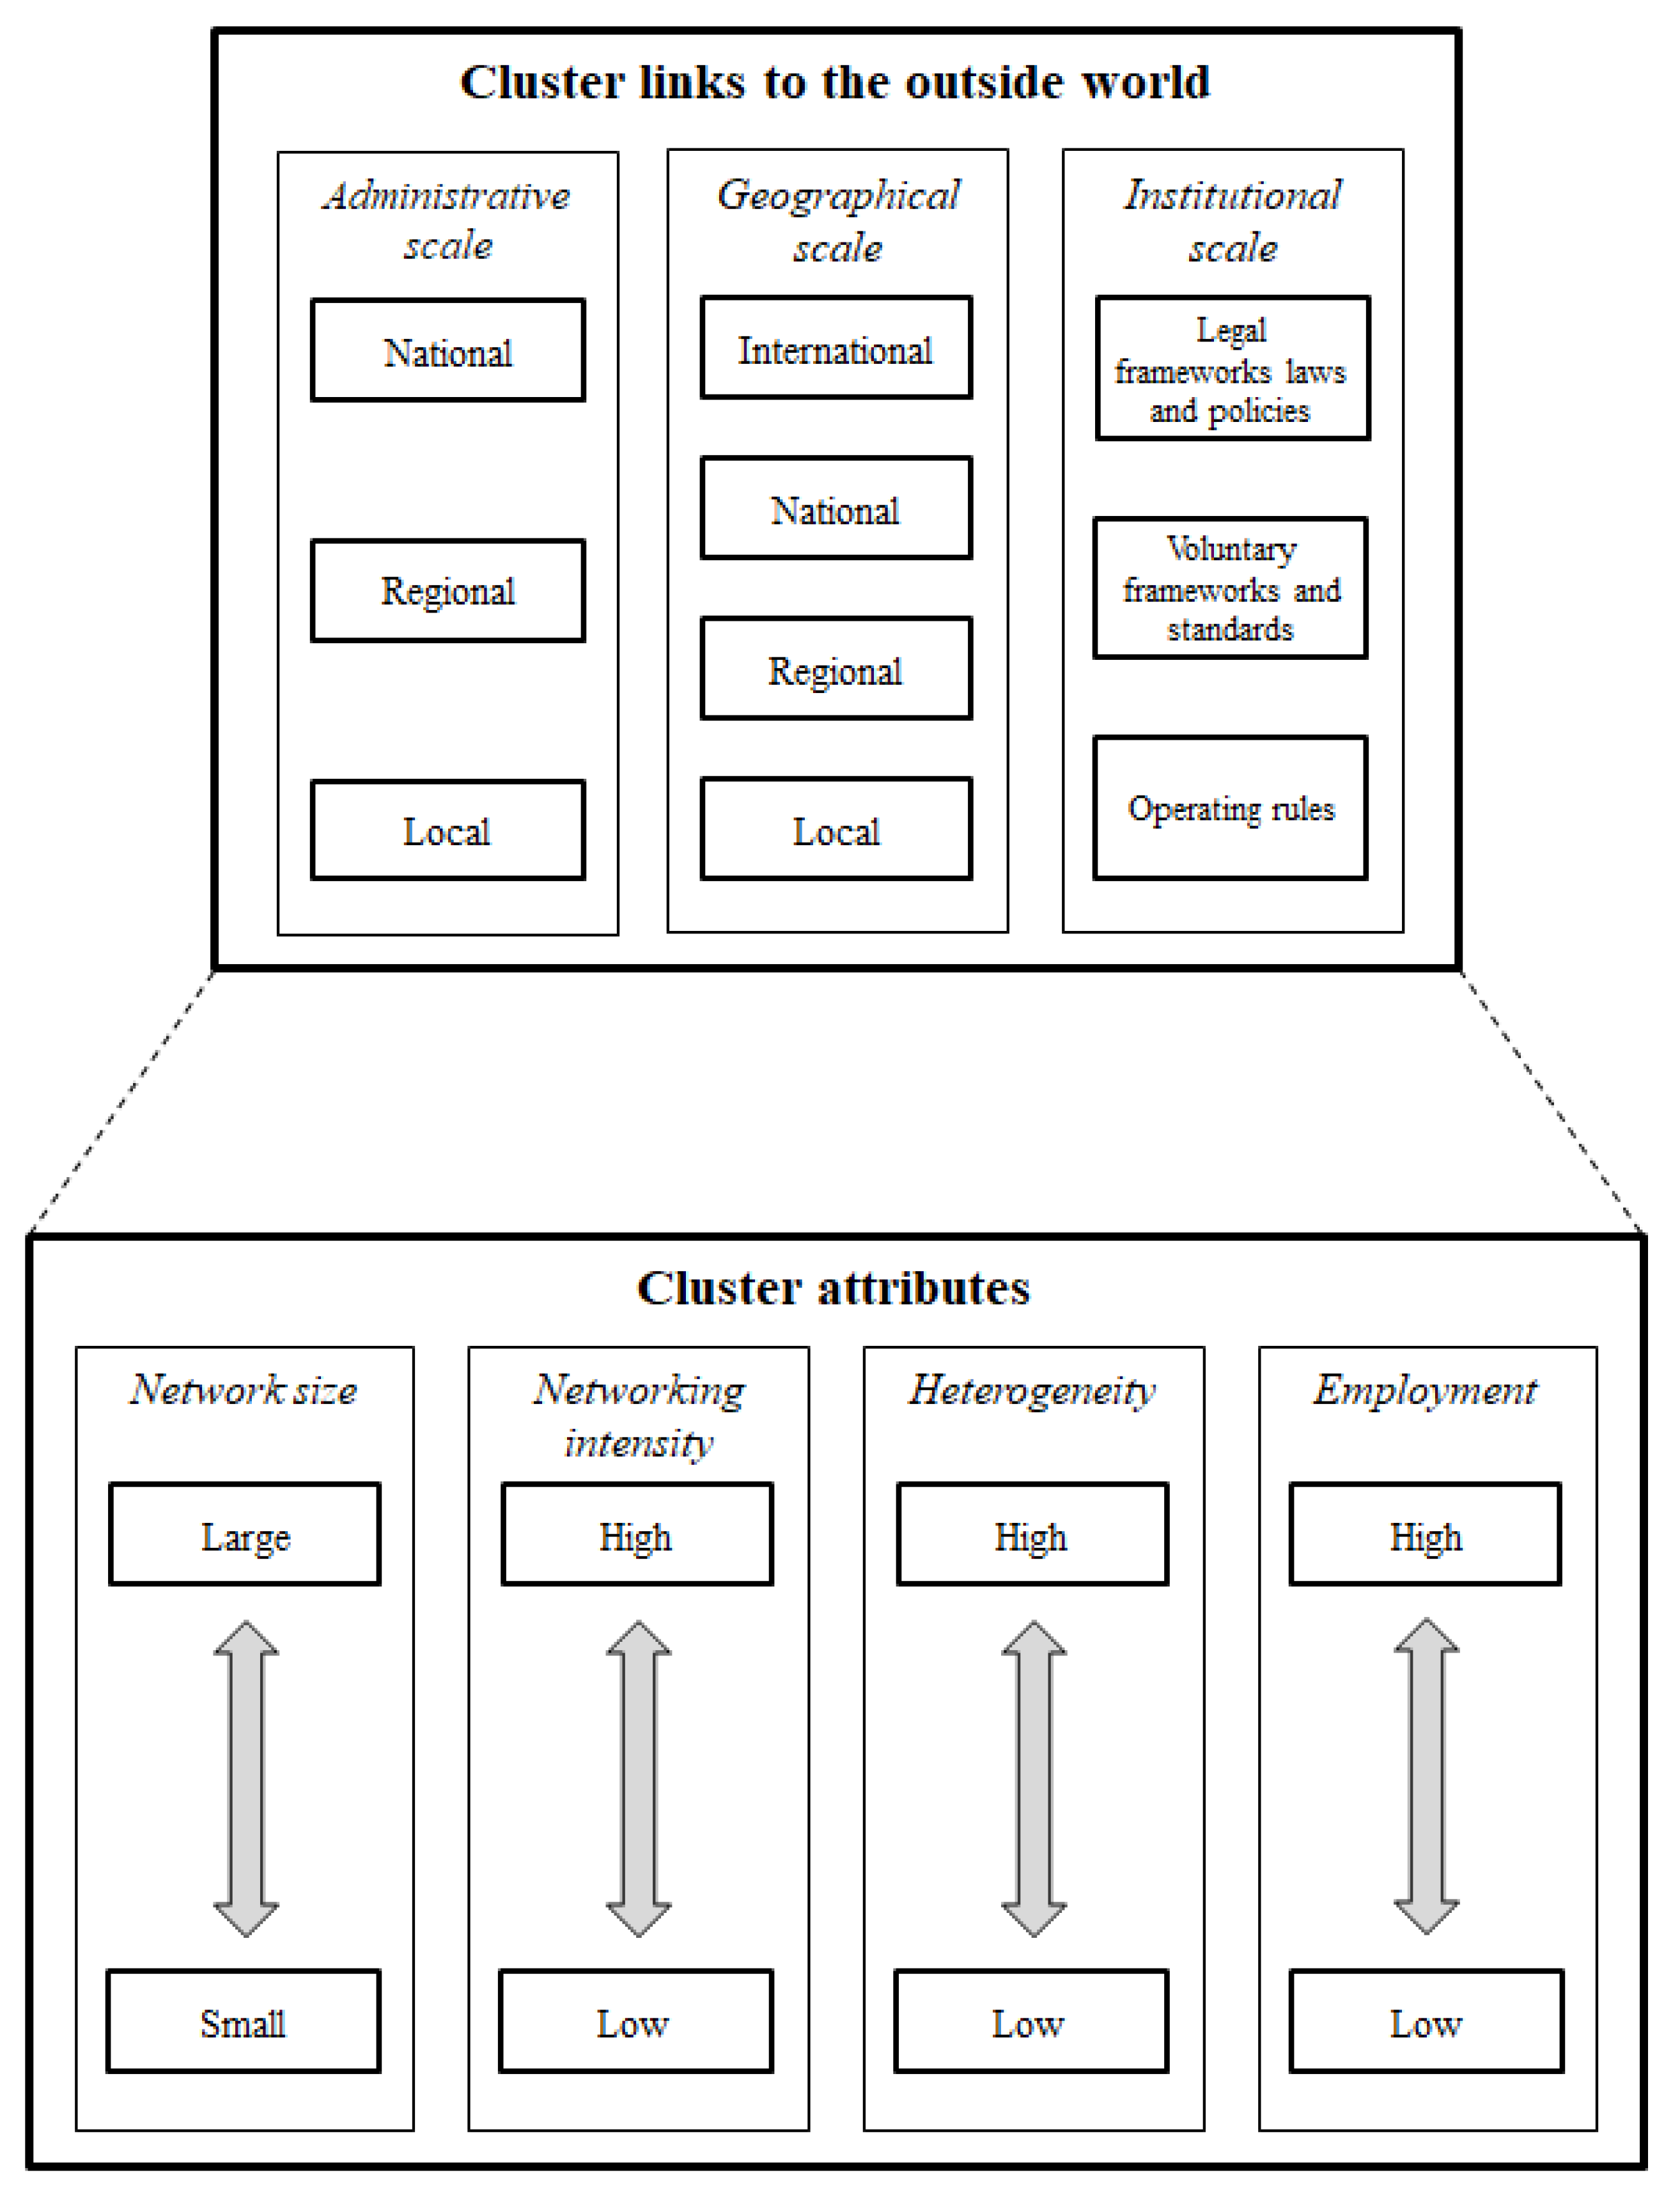
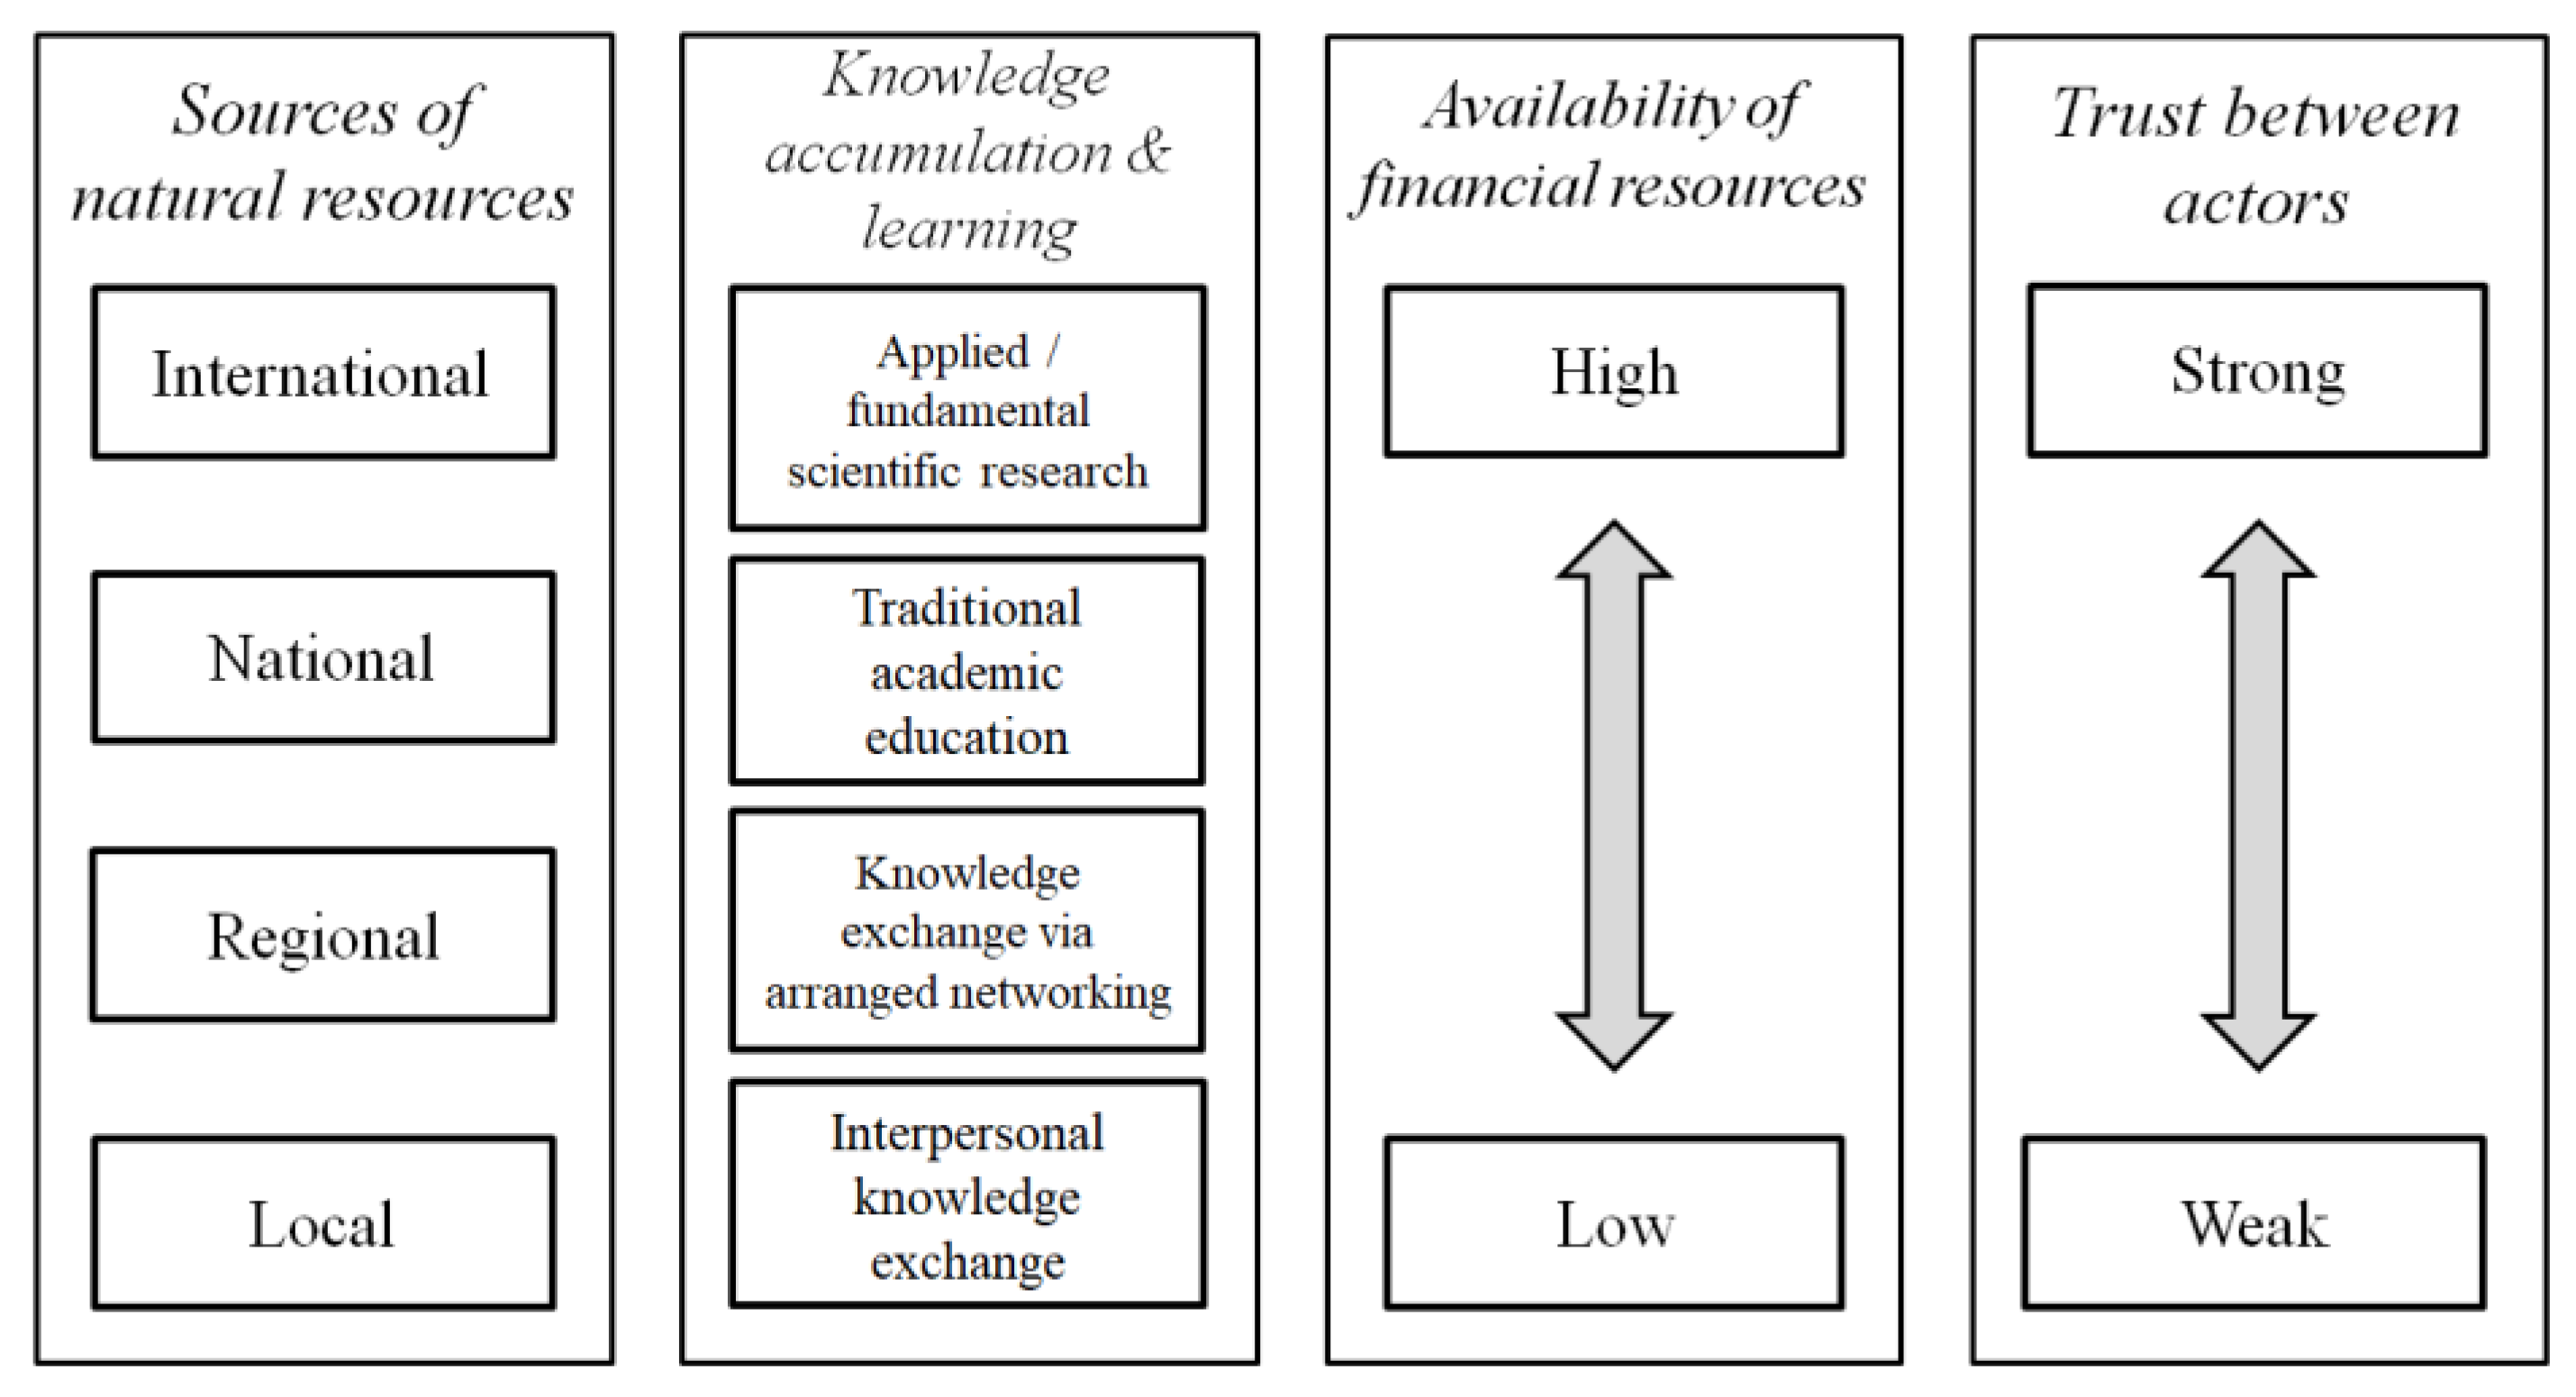
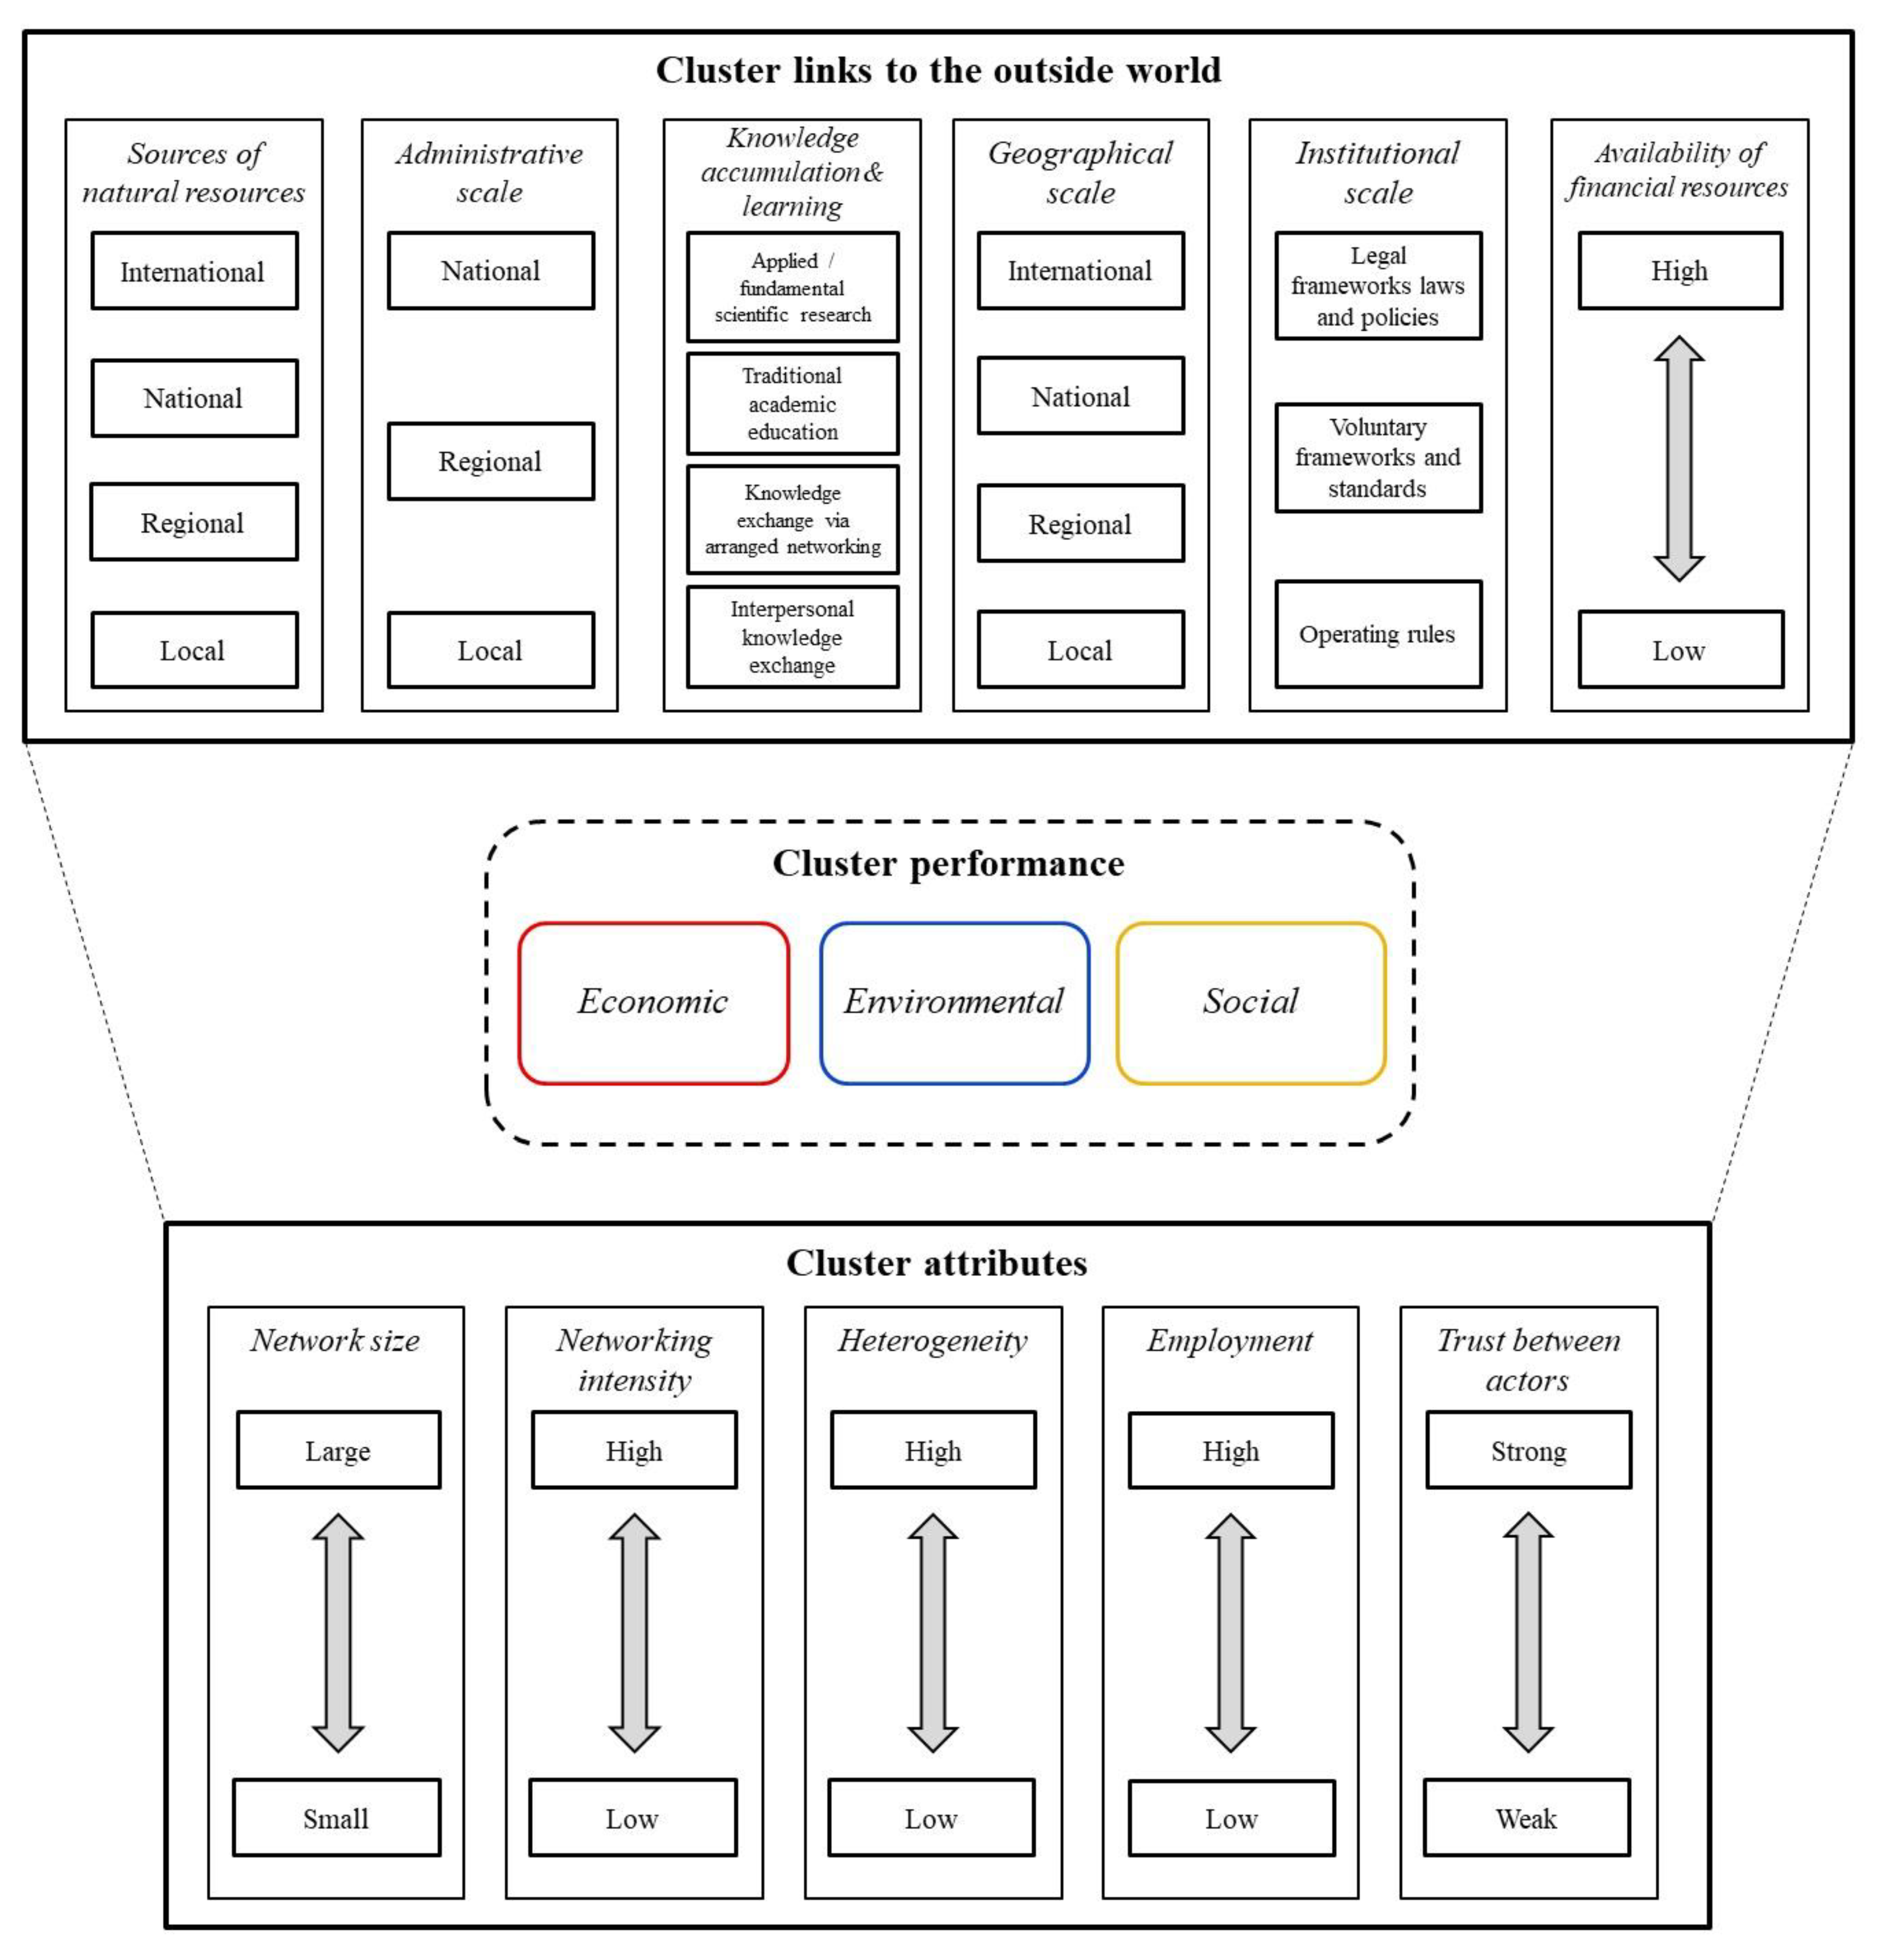
3.4.1. Developing the Multiscalar Framework

The construction of the multiscalar framework was an iterative process combining top-down and bottom-up approaches. Starting with a top-down approach, we adopted four scales from the literature on cluster evolution [39]: network size, networking intensity, heterogeneity, and employment. These scales represent only the cluster-internal elements. We discussed the scales of network size and heterogeneity in the theoretical section.
The scale of networking intensity measures the intensity of networking among the different actors in a cluster. The levels of this scale can take all the values between the lowest and the highest observed networking intensity. The employment scale measures the level of employment in the cluster and can involve all the levels between the lowest and the highest observed levels.
Bioclusters are also embedded into global streams of natural resources and can thus have both positive and negative sustainability effects both in their locality and at higher levels and scales. For the second category of scales, we appropriated three scales from the literature on sustainability research. These were the geographical, administrative, and institutional scales. The lower levels of these scales, e.g., “local” and “operating rules” (see Figure 2), would concern the biocluster alone, whereas the higher levels, e.g., “national” and “laws and policies,” would be situated outside of the biocluster. In this way, the scales in this category will represent the connections of the biocluster to the outside world. This will allow one to study the cause–effect links at different levels and scales and, ultimately, to create awareness about the different sustainability effects of bioclusters. The initial design of the multiscalar framework is shown in Figure 5. The dimension of cluster attributes includes the scales of network size, networking intensity, heterogeneity, and employment. The dimension of cluster links to the outside world includes the administrative, geographical, and institutional scales.
We continued the development of the multiscalar framework with a bottom-up approach by constructing new scales retrieved from the 42 empirical cases and adding those scales to the different dimensions of the framework. The papers were analyzed by between one and three persons for the sake of increased reliability. The process of data extraction implied finding references to different scales and levels in the articles (hereafter, scale references). By “references,” we do not only mean that the authors explicitly stated the importance of any particular scale. In fact, this type of reference constituted the minority of the extracted data. Most often, an extracted datum would stem from a simple reference to, or mentioning of, that scale in the process of describing or analyzing the case study. Statements from the literature were thus labeled and subsequently aggregated into a (new) scale where necessary.
During the analysis and coding of the 42 cases, we created new scales as soon as the scale references allowed differentiating among at least two levels of the scale. In this way, we added the scales of sources of natural resources, knowledge accumulation and learning, the availability of financial resources, and trust between actors. These scales are presented in Figure 6. Naturally, the articles that were analyzed before the addition of the new scales were thereafter re-analyzed for the added scales.
To create the final version of the multiscalar framework, we integrated the four new scales into the different dimensions of the initial framework. The scale of trust between actors was classified into the dimension of cluster attributes, because all the possible levels of this scale relate only to the actors inside the cluster. The three other scales were classified into the dimension of cluster links to the outside world. A biocluster can source its natural resources directly from its locality, or from other regions and countries. The new knowledge in the cluster can be created and exchanged via face-to-face contacts inside the cluster (local buzz), but it can also be created in universities and research centers outside the cluster (global pipelines) [49]. Similarly, the financial resources can be sourced directly among the cluster members. However, different institutions and governmental actors can also be involved in financing the cluster. Therefore, the resulting multiscalar framework is built upon an iterative process of the inclusion of scales applying both the top-down and bottom-up approaches.

3.4.2. Classifying the Sustainability Performance of Bioclusters

In line with the second aim of our study, we want to test the relationship among the economic, social, and environmental scales of bioclusters. Therefore, we included the three scales of biocluster performance into the multiscalar framework. However, the scales of economic, social, and environmental performances are not classified into any of the dimensions, because they represent a multitude of different indicators and effects. For example, the environmental performance consists of eight different types of references mentioned in 20 case studies. These were the references to environmental advantages, the use of fossil fuels, the use of renewable energies, waste utilization, environmental management, ecological effects, pollution reduction, and CO2 reduction. The scale of social performance aggregates the references to different types of social developments, social benefits, and effects made in eight case studies. Finally, the economic performance is a compilation of multiple indicators from 37 case studies. Among these indicators were economic development, innovativeness, competitive advantage, regional or sectoral development, and marketing success. Most of these indicators were mentioned only once in all of our case studies. Therefore, it would not allow one to decide on the types of the respective scales and their levels.
It was possible to classify the case studies only according to their economic performance. This is due to the fact that the articles in our sample did not systematically discuss any social or environmental effects, whereas the “performance” of bioclusters always related to the economic performance only. Hence, the majority of our case studies provided information about economic performance, either having it as their goal or simply describing the economic performance in the course of the narrative.
Different articles described the economic performance of the bioclusters in different ways. We categorized 37 case studies along three performance levels: good, average, and poor (for the remaining five case studies, we found no information regarding their performance). Detailed information on performance levels for each case study is provided in the results section.
Some authors analyzed in their articles two or more case studies, comparing, as a rule, their performance. In these few cases, we assessed relatively easily to which performance level a case study belonged. For most of our case studies, however, an assessment of cluster performance was not the main purpose of the authors. Nevertheless, the authors of many case studies often provided obvious hints and keywords that helped us to define their performance levels. This was especially true for a few case studies with good performance levels, which operated with key phrases such as “… leadership as a regional model and unique case study” [50], “… a success story” [44], or “…an image of a rising star in the wine world…” [51]. Even in the absence of such suggestive keywords, the authors of the biocluster case studies with good economic performance levels increasingly stressed the positive aspects of the bioclusters, by describing how the clusters’ performance was “good,” often with respect to regional economic development, innovative capacity, enhanced competitive advantages, and regional employment.
The classification criteria were different for the bioclusters with average economic performance. Certainly, the authors did not describe how the clusters’ performance was “average.” Instead, they pointed, as a rule, to the important shortcomings such as weak governance, lack of trust, and potential scale challenges such as ignorance and plurality.
Finally, the case studies with poor economic performance had more pronounced shortcomings of the same nature and, most importantly, an almost ubiquitous plurality challenge described as a discrepancy of political intentions, lack of coordination, and opposite expectations at different governmental levels. In the next section, we present the results of our analysis.

4. Results

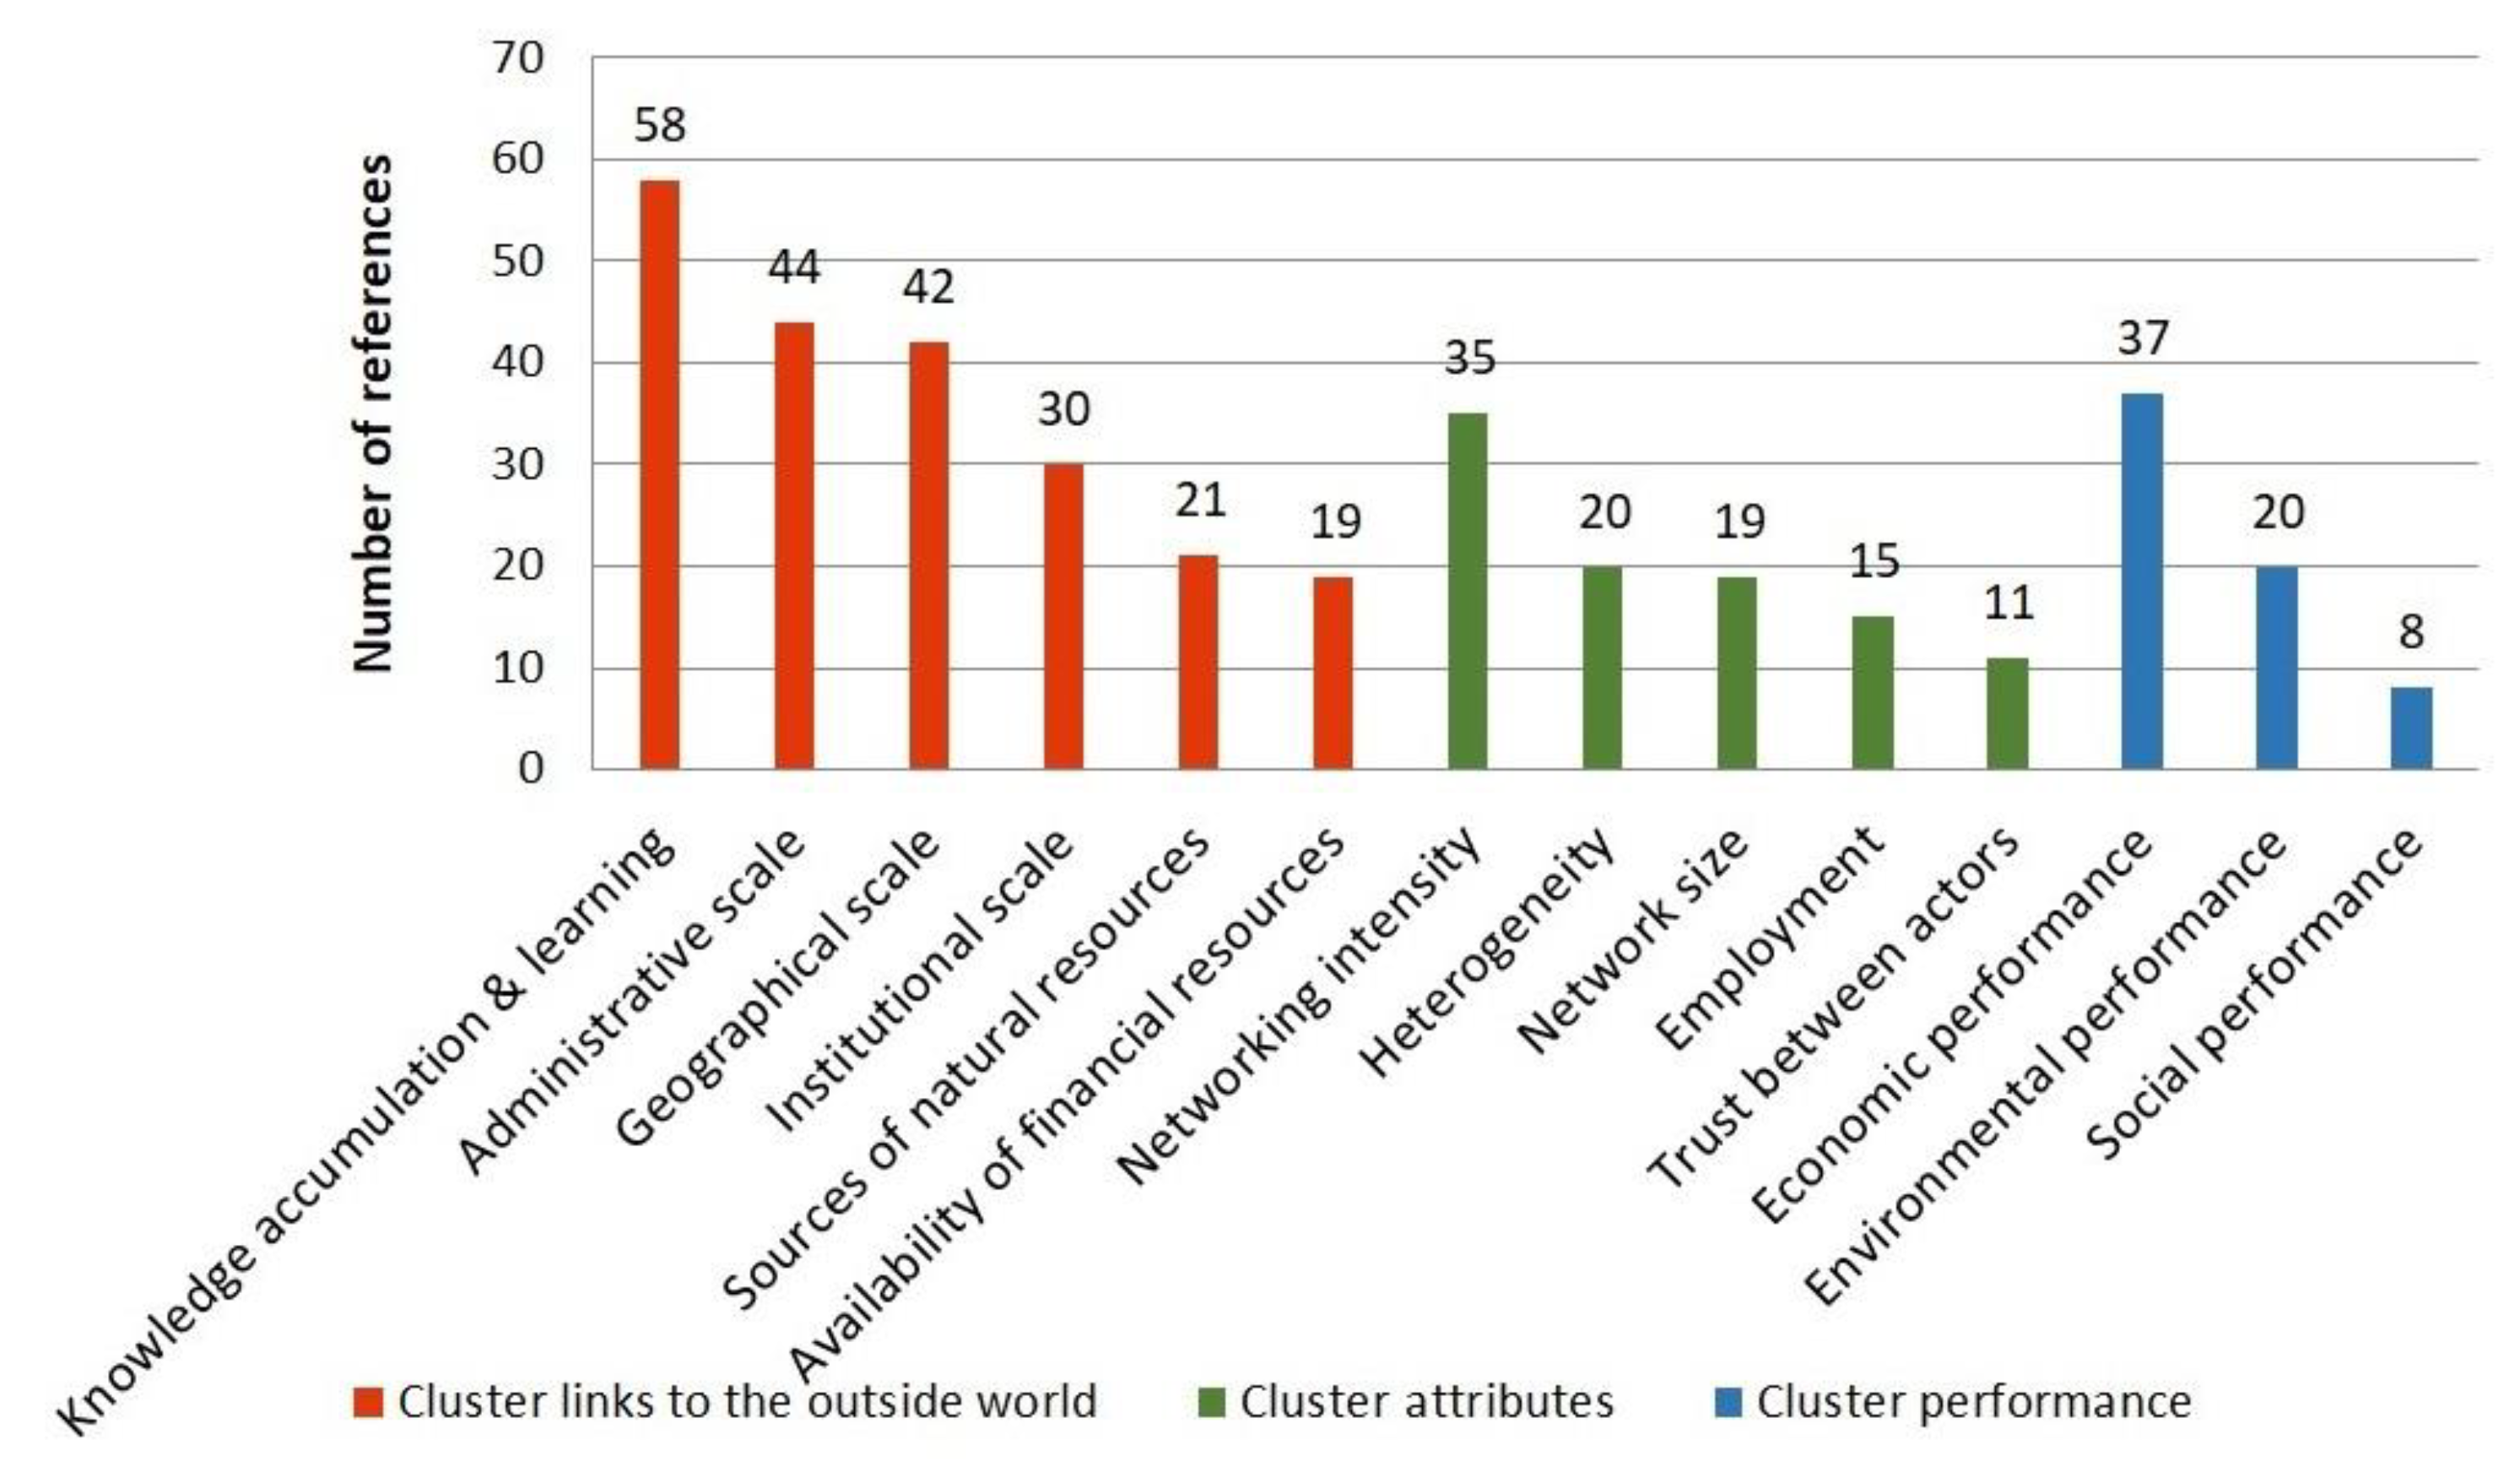
4.1. The Multiscalar Framework

Figure 7 presents our multiscalar framework. It compiles 14 scales, 11 of which are classified between the dimensions of cluster attributes and cluster links to the outside world.
The scales of economic, social, and environmental performance are grouped into cluster performance. However, we caution the reader against interpreting “cluster performance” as another dimension of scales in the framework. As a reminder, the three scales are compilations of multiple economic, social, and environmental effects. These effects can occur within the cluster alone, but they can also play out at higher geographical levels and be connected to other scales that connect the cluster to the outside world. Altogether, we found 379 scale references in the 42 case studies. Their distribution across the 14 scales is shown in Figure 8. We counted 214 references to the scales in the dimension of cluster links to the outside world. Scales in the dimension of cluster attributes were emphasized 100 times. Finally, we counted 65 references to the scales of cluster performance. It is useful to keep in mind that the distribution of the scales in Figure 8 does not imply that, e.g., the availability of financial resources or trust between actors are not very important in the bioclusters. All of the 14 scales were significant enough to be emphasized as many times as they were emphasized, whereas some of them were emphasized more than the others.
In Figure 8, the numbers specifying the scale references indicate also the number of case studies that emphasized those scales, with the exception of the knowledge accumulation and learning scale (emphasized in 36 case studies), the administrative scale (emphasized in 31 case studies), and the institutional scale (emphasized in 24 case studies). Several case studies emphasized two or more levels of these scales. For instance, a biocluster can be supported from both local and regional governments (administrative scale), or it can have knowledge flows both at the interpersonal level and through collaboration with research centers (knowledge accumulation and learning). Ultimately, a biocluster can incorporate all the levels of the institutional scale together by simultaneously involving operating rules, standards of operation, and legal frameworks. The levels in the scale of sources of natural resources were not emphasized together in any case study. Regarding the other 10 scales, their levels are exclusive in nature. For instance, the size of the biocluster network cannot be small and large at the same time. Neither can the geographical range of a biocluster be local and national simultaneously.
Below, we showcase four scales from our multiscalar framework—sources of natural resources, knowledge accumulation and learning, the availability of financial resources, and trust between actors—because they were retrieved from our case studies (see Figure 6) and not from existing theoretical literature.
The scale of sources of natural resources informs us about the geographical levels, from which the bioclusters source their natural resources. This scale was mentioned 21 times. Four case studies emphasized the local level, 14 case studies the regional level, one case study the national level, and two case studies the international level. The scale of knowledge accumulation and learning represents the different levels of formalization of knowledge exchange and learning. This scale was mentioned 58 times. With regard to the levels, interpersonal knowledge exchange was mentioned in four case studies, knowledge exchange via arranged networking was mentioned in eight case studies, traditional academic education was mentioned in 16 case studies, and applied/fundamental scientific research was mentioned in 27 case studies. For the scale of availability of financial resources, we counted 19 references. One case study emphasized the low level of this scale, and six case studies emphasized the high level. The other 12 case studies emphasized the flows of financial resources without specifying the level of their availability. Finally, trust between actors was emphasized in 11 case studies, three of which pointed to a weak level of trust between cluster actors, four to a high level of trust, and four to the importance of trust for the cluster in general, without specification of the level.
Having constructed the multiscalar framework, we can now move to the second aim of our study.

4.2. The Relationship among the Scales of Biocluster Performance

In this section, we address the second aim of our study by investigating the relationship among the different scales of biocluster performance. Table 1 lists the 42 bioclusters, the references to their economic performance, their level of economic performance, and, where applicable, their environmental and social performances.
Altogether, we counted 19 bioclusters with good economic performance, 13 bioclusters with average performance, and five bioclusters with poor performance. The remaining five bioclusters were not classified due to an absence of data on their economic performance.
Different environmental effects were emphasized in 20 case studies, whereas 8 case studies mentioned different social effects. Table 2 shows the results of testing the scales of environmental and social performances of our multiscalar framework against the three economic performance categories of bioclusters. Since there are different numbers of case studies in each economic performance level, we present the prevalence of the environmental and social scales not in absolute but rather in relative terms. The percentages in Table 2 denote the share of case studies in the given economic performance category that emphasized the respective scale. Positive environmental performance was observed in 63% of bioclusters with good economic performance, in 38% of bioclusters with average economic performance, and in none of the bioclusters with poor economic performance. Positive social performance was observed in 21% of bioclusters with good economic performance, in 15% of bioclusters with average economic performance, and in none of the bioclusters with poor economic performance.
As can be seen, the scales of environmental and social performance are associated more with bioclusters in the average and, especially, good economic performance level. Within our results, we observed no positive environmental or social effects in the bioclusters with poor economic performance.

5. Discussion

In this section, we discuss the implications of our results by addressing the multiscalar framework we developed and the different correlations, overlaps, and dependencies between the scales of the framework. At the end, we discuss the limitations of our study.

5.1. Multiscalar Framework and its Application

We designed our multiscalar framework to allow studying bioclusters from the viewpoint of the cause–effect links that the different sustainability effects can have across different scales and levels. The multiscalar framework is a combination of scales and levels that are based both on the existing theoretical literature and on the 42 empirical case studies. Therefore, the multiscalar framework is a response to different authors calling for more attention to the process of inclusion and exclusion of different scales [33,34,35]. However, applying the concepts of scales and levels to the analysis of the empirical literature on bioclusters produced a number of overlaps and correlations between the scales. For the future applications of our multiscalar framework, it might be important to be aware of these overlaps and correlations. We thus reflect on them by conducting a correlation analysis between the 14 scales of our multiscalar framework.
In Table 3, we show the results for the Pearson’s correlation coefficients of the 14 scales. If the correlation between any two scales is significant, the two scales were often emphasized together in the case studies.
We observed two significant correlations between the scales in the dimension of cluster links to the outside world. These were the correlations between the administrative scale and availability of financial resources (p < 0.05), and between the institutional scale and availability of financial resources (p < 0.01). No significant correlations were observed between any scales in the dimension of cluster attributes. All the other significant correlations appeared between the scales in different dimensions and with/within the scales of biocluster performance.
The scales of networking intensity and knowledge accumulation and learning have a significant correlation (p < 0.01). Only 7 of the 42 case studies emphasized one of these scales without emphasizing the other. However, it is important to consider the possible overlaps between the levels of these scales (see Figure 7). For instance, all the levels in the scale of knowledge accumulation and learning on their own assume “networking.” Another potential overlap can be noticed between the scales of employment and social performance that were significantly correlated (p < 0.01). Women employment in certain economic sectors, as well as employment of vulnerable groups in general, are considered as part of the social performance and social sustainability [84]. Despite the overlaps, these scales measure different aspects of clusters and are situated in different dimensions of our framework. Another significant correlation can be observed between the environmental performance and the administrative scale (p < 0.01). Our results suggest that positive environmental effects were often emphasized together with many administrative levels in bioclusters.
The scales of social and environmental performance show positive correlation (p < 0.05), meaning that these scales were frequently considered together in the case studies. However, it does not mean that these case studies systematically elaborated on the different social and environmental effects. A closer look at the case studies reveals that the references to the different social and environmental effects often occurred incidentally without further information on the causes or magnitudes of these effects. Furthermore, the social effects were often superficially emphasized together with environmental effects in the same sentence. On the other hand, the economic effects were discussed systematically in most case studies. Therefore, there is an asymmetry of treatments of the economic, social, and environmental aspects of bioclusters in the empirical literature. This might be due to the fact that cluster studies, generally, are conducted within the field of economic geography, which on its own is an economic discipline.
Despite the fact that there was little discussion in the case studies in the social and environmental sense, we found that the case studies with average and, especially, good economic performance were more likely to include different environmental and social benefits. However, since we have only 19, 13, and 5 cases in each economic performance category, we do not make any inference about the causal relationships among the three performance scales.

5.2. Limitations and Future Research

The literature used for this meta-analysis was rather unbalanced with respect to the roles of economic, social, and environmental effects of bioclusters. Consequently, our multiscalar framework in its present state is not a tool to assess sustainability. Instead, it is a tool that maps the different scales and dimensions to help with the assessment of different sustainability effects, if these effects are separated and presented as scales in future studies. Depending on the researched processes and the discipline, different scales might become important [33]. Therefore, applying our framework to a particular biocluster would require retrieving the necessary sustainability effects, presenting them as scales, and categorizing them either to the dimension of cluster internal elements, or to the dimension of cluster links to the outside world. This will allow one to study the interplay of different sustainability effects of bioclusters across different levels, scales, and dimensions.
One important aspect that has not been included in the different scales that we identified is that of the temporal scale. Certain events can generate both short- and long-term effects, but currently, the framework does not really identify such a scale. One way this can be achieved in future research is by conducting a longitudinal study of one or more bioclusters. A history of a biocluster can be interpreted as a development across different scales, levels, and dimensions. As a cluster moves through different development stages, for instance, according to the cluster life cycle model [39,85], its performance, as well as the scales and levels involved, are likely to change. Thus, in a longitudinal research design, the temporal effect of certain developments could be studied. In addition, such a longitudinal analysis would also make it possible to address another weakness of the current study and the difficulty this framework has in identifying causal relationships in scale dynamics. Although we discovered that different levels of economic performance of bioclusters are associated with different social and environmental performances, their cause–effect relations still need to be addressed.

6. Conclusions

In this paper, we introduced a multiscalar framework that can help to assess the sustainability effects of bioclusters. We argue that the application of this framework will increase awareness about the different scales and levels and their interactions, and will help to minimize the negative scale effects in the process of biocluster development. We tested the multiscalar framework to investigate the interrelation among the economic, social, and environmental performance scales of bioclusters. We found that, within our results, the case studies with better economic performance were more likely to include different environmental and social benefits.

Author Contributions

Conceptualization, D.A. and F.H.; data curation, D.A.; formal analysis, D.A.; investigation, D.A.; methodology, D.A. and F.H.; validation, D.A. and F.H.; visualization, D.A.; writing—original draft, D.A.; funding acquisition, F.H.; project administration, F.H.; supervision, F.H.; writing—review & editing, F.H. All authors have read and agreed to the published version of the manuscript.

Funding

This research was funded by the German Federal Ministry of Education and Research (BMBF), grant number 031B0020. The APC was funded by the Leibniz Institute of Agricultural Development in Transition Economies (IAMO).

Conflicts of Interest

The authors declare that there is no conflict of interest.

References

  1. Georgescù-Roegen, N. De la Science Economique à la Bioéconomie. Rev. Econ. Polit. 1978, 88, 337–382. [Google Scholar]
  2. Bugge, M.M.; Hansen, T.; Klitkou, A. What is the bioeconomy? A review of the literature. Sustainability 2016, 8, 691. [Google Scholar] [CrossRef] [Green Version]
  3. McCormick, K.; Kautto, N. The Bioeconomy in Europe: An Overview. Sustainability 2013, 5, 2589–2608. [Google Scholar] [CrossRef] [Green Version]
  4. Ramcilovic-Suominen, S.; Pülzl, H. Sustainable development—A ‘selling point’ of the emerging EU bioeconomy policy framework? J. Clean. Prod. 2018, 172, 4170–4180. [Google Scholar] [CrossRef]
  5. El-Chichakli, B.; von Braun, J.; Lang, C.; Barben, D.; Philp, J. Five cornerstones of a global bioeconomy. Nature 2016, 535, 221–223. [Google Scholar] [CrossRef] [PubMed]
  6. Lehtonen, O.; Okkonen, L. Regional socio-economic impacts of decentralised bioeconomy: A case of Suutela wooden village, Finland. Environ. Dev. Sustain. 2013, 15, 245–256. [Google Scholar] [CrossRef]
  7. Biber-Freudenberger, L.; Basukala, A.K.; Bruckner, M.; Börner, J. Sustainability Performance of National Bio-Economies. Sustainability 2018, 10, 2705. [Google Scholar] [CrossRef] [Green Version]
  8. Dietz, T.; Börner, J.; Förster, J.; von Braun, J. Governance of the bioeconomy: A global comparative study of national bioeconomy strategies. Sustainability 2018, 10, 3190. [Google Scholar] [CrossRef] [Green Version]
  9. Gawel, E.; Pannicke, N.; Hagemann, N. A Path Transition Towards a Bioeconomy—The Crucial Role of Sustainability. Sustainability 2019, 11, 3005. [Google Scholar] [CrossRef] [Green Version]
  10. Edwards, R.; Szekeres, S.; Neuwahl, F.; Mahieu, V. Biofuels in the European Context: Facts and Uncertainties. Available online: https://ec.europa.eu/jrc/sites/jrcsh/files/jrc_biofuels_report.pdf (accessed on 8 February 2019).
  11. Priefer, C.; Jörissen, J.; Frör, O. Pathways to shape the bioeconomy. Resources 2017, 6, 10. [Google Scholar] [CrossRef] [Green Version]
  12. Van Eijck, J.; Romijn, H. Prospects for Jatropha biofuels in Tanzania: An analysis with strategic niche management. Energy Policy 2008, 36, 311–325. [Google Scholar] [CrossRef]
  13. Oberlack, C.; Boillat, S.; Brönnimann, S.; Gerber, J.-D.; Giger, M.; Heinimann, A.; Ifejika Speranza, C.; Mann, S.; Messerli, P.; Rist, S. Polycentric governance in telecoupled resource systems: Is the tragedy of the grabbed commons unavoidable? In Proceedings of the XVI Global Conference of the International Association for the Study of the Commons, Utrecht, The Netherlands, 10–14 July 2017. [Google Scholar]
  14. Pfau, S.F.; Hagens, J.E.; Dankbaar, B.; Smits, A.J.M. Visions of sustainability in bioeconomy research. Sustainability 2014, 6, 1222–1249. [Google Scholar] [CrossRef] [Green Version]
  15. Buizer, M.; Arts, B.; Kok, K. Governance, scale, and the environment: The importance of recognizing knowledge claims in transdisciplinary arenas. Ecol. Soc. 2011, 16, 121. [Google Scholar] [CrossRef] [Green Version]
  16. Kok, K.; Veldkamp, T. Scale and Governance: Conceptual Considerations and Practical Implications. Ecol. Soc. 2011, 16, 223. [Google Scholar] [CrossRef] [Green Version]
  17. Zechendorf, B.; Aguilar, A. Regional biotechnology—The EU biocluster study. J. Commer. Biotechnol. 2011, 17, 209–217. [Google Scholar] [CrossRef]
  18. Befort, N. Going beyond definitions to understand tensions within the bioeconomy: The contribution of sociotechnical regimes to contested fields. Technol. Forecast. Soc. Chang. 2020, 153, 9923. [Google Scholar] [CrossRef]
  19. Boschma, R.; Martin, R. Editorial: Constructing an evolutionary economic geography. J. Econ. Geogr. 2007, 7, 537–548. [Google Scholar] [CrossRef]
  20. Marshall, A. Principles of Economics; Macmillan: London, UK, 1890. [Google Scholar]
  21. Brown, R. Cluster Dynamics in Theory and Practice with Application to Scotland; University of Strathclyde, European Policies Research Centre: Glasgow, UK, 2000; ISBN 1871130166. [Google Scholar]
  22. Simmie, J. The contribution of clustering to innovation: From Porter I agglomeration to Porter II export base theories. In Handbook of Research on Innovation and Clusters: Cases and Policies; Karlsson, C., Ed.; Edward Elgar Publishing Ltd.: Cheltenham, UK, 2008; pp. 19–32. ISBN 9781847208422. [Google Scholar]
  23. Cantner, U.; Graf, H.; Hinzmann, S. Policy induced innovation networks: The case of the German “Leading-Edge Cluster Competition”. In The Geography of Networks and R&D Collaboration; Scherngell, T., Ed.; Springer International Publishing: Cham, Switzerland, 2013; pp. 335–352. [Google Scholar]
  24. Brakman, S.; van Marrewijk, C. Reflections on Cluster Policies. Camb. J. Reg. Econ. Sci. 2013, 6, 217–231. [Google Scholar] [CrossRef] [Green Version]
  25. Boschma, R.A. Proximity and innovation: A critical assessment. Reg. Stud. 2005, 39, 61–74. [Google Scholar] [CrossRef]
  26. Porter, M.E. Clusters and the new economics of competition. Harv. Bus. Rev. 1998, 76, 77–90. [Google Scholar]
  27. Regional Biotechnology. Establishing a Methodology and Performance Indicators for Assessing Bioclusters and Bioregions Relevant to the KBBE Area. The Final Report; Regional Biotechnology: Pali, India, 2011. [Google Scholar]
  28. Bosman, R.; Rotmans, J. Transition governance towards a bioeconomy: A comparison of Finland and The Netherlands. Sustainability 2016, 8, 1017. [Google Scholar] [CrossRef] [Green Version]
  29. Deutz, P.; Gibbs, D. Industrial ecology and regional development: Eco-industrial development as cluster policy. Reg. Stud. 2008, 42, 1313–1328. [Google Scholar] [CrossRef] [Green Version]
  30. Ehrenfeld, J.R. Industrial Ecology: A framework for product and process design. J. Clean. Prod. 1997, 5, 87–95. [Google Scholar] [CrossRef]
  31. Cash, D.; Adger, W.N.; Berkes, F.; Garden, P.; Lebel, L.; Olsson, P.; Pritchard, L.; Young, O. Scale and cross-scale dynamics: Governance and information in a multilevel world. Ecol. Soc. 2006, 11, 8. [Google Scholar] [CrossRef] [Green Version]
  32. Gunderson, L.H.; Holling, C.S. Panarchy: Understanding Transformations in Human and Natural Systems; Island Press: Washington, DC, USA, 2002; ISBN 978-155-963-857-9. [Google Scholar]
  33. Schut, M.; Leeuwis, C.; Van Paassen, A. Ex ante Scale Dynamics Analysis in the Policy Debate on Sustainable Biofuels in Mozambique. Ecol. Soc. 2013, 18, 120. [Google Scholar] [CrossRef] [Green Version]
  34. Hermans, F.; Roep, D.; Klerkx, L. Scale dynamics of grassroots innovations through parallel pathways of transformative change. Ecol. Econ. 2016, 130, 285–295. [Google Scholar] [CrossRef]
  35. Vervoort, J.M.; Rutting, L.; Kok, K.; Hermans, F.L.P.; Veldkamp, T.; Bregt, A.K.; van Lammeren, R. Exploring Dimensions, Scales, and Cross-scale Dynamics from the Perspectives of Change Agents in Social-ecological Systems. Ecol. Soc. 2012, 17, 424. [Google Scholar] [CrossRef] [Green Version]
  36. Gibson, C.C.; Ostrom, E.; Ahn, T.K. The concept of scale and the human dimensions of global change: A survey. Ecol. Econ. 2000, 32, 217–239. [Google Scholar] [CrossRef]
  37. Raven, R.; Schot, J.; Berkhout, F. Space and scale in socio-technical transitions. Environ. Innov. Soc. Transit. 2012, 4, 63–78. [Google Scholar] [CrossRef]
  38. Lieshout, M.V.; Dewulf, A.; Aarts, N.; Termeer, C. Do Scale Frames Matter? Scale Frame Mismatches in the Decision Making Process of a “Mega Farm” in a Small Dutch Village. Ecol. Soc. 2011, 16, 138. [Google Scholar] [CrossRef] [Green Version]
  39. Menzel, M.-P.; Fornahl, D. Cluster life cycles-dimensions and rationales of cluster evolution. Ind. Corp. Chang. 2010, 19, 205–238. [Google Scholar] [CrossRef]
  40. Hermans, F.; Knippenberg, L. A principle-based approach for the evaluation of sustainable development. J. Environ. Assess. Policy Manag. 2006, 8, 299–319. [Google Scholar] [CrossRef]
  41. Dobson, A. Environment sustainabilities: An analysis and a typology. Environ. Politics 1996, 5, 401–428. [Google Scholar] [CrossRef]
  42. Hull, V.; Liu, J. Telecoupling: A new frontier for global sustainability. Ecol. Soc. 2018, 23, 441. [Google Scholar] [CrossRef]
  43. Loorbach, D.; Rotmans, J. Managing transitions for sustainable development. In Understanding Industrial Transformation; Olsthoorn, X., Wieczorek, A., Eds.; Springer: Dordrecht, The Netherlands, 2006; pp. 187–206. ISBN 978-140-203-755-9. [Google Scholar]
  44. Anbumozhi, V.; Gunjima, T.; Prem Ananth, A.; Visvanathan, C. An assessment of inter-firm networks in a wood biomass industrial cluster: Lessons for integrated policymaking. Clean Technol. Environ. Policy 2010, 12, 365–372. [Google Scholar] [CrossRef]
  45. Paoli, A.D.; Addeo, F. Assessing SDGs: A Methodology to Measure Sustainability. Athens J. Soc. Sci. 2019, 6, 229–250. [Google Scholar] [CrossRef]
  46. Kostoska, O.; Kocarev, L. A novel ICT framework for sustainable development goals. Sustainability 2019, 11, 1961. [Google Scholar] [CrossRef] [Green Version]
  47. Matarazzo, B.; Nijkamp, P. Meta-analysis for comparative environmental case studies: Methodological issues. Int. J. Soc. Econ. 1997, 24, 799–811. [Google Scholar] [CrossRef] [Green Version]
  48. Ragin, C.C. The Comparative Method: Moving beyond Qualitative and Quantitative Strategies; University of California Press: Oakland, CA, USA, 2014; ISBN 978-052-095-735-0. [Google Scholar]
  49. Bathelt, H.; Malmberg, A.; Maskell, P. Clusters and knowledge: Local buzz, global pipelines and the process of knowledge creation. Prog. Hum. Geogr. 2004, 28, 31–56. [Google Scholar] [CrossRef]
  50. Ferrell, J.C.; Shahbazi, A. County government led EIP development using municipal biomass resources for clean energy production, a case study of the Catawba County North Carolina EcoComplex. Prog. Ind. Ecol. 2015, 9, 69–81. [Google Scholar] [CrossRef]
  51. Beebe, C.; Haque, F.; Jarvis, C.; Kenney, M.; Patton, D. Identity creation and cluster construction: The case of the Paso Robles wine region. J. Econ. Geogr. 2012, 13, 711–740. [Google Scholar] [CrossRef] [Green Version]
  52. Branco, A.; Lopes, J.C. Cluster and business performance: Historical evidence from the Portuguese cork industry. Investig. Hist. Econ. 2018, 14, 43–53. [Google Scholar] [CrossRef]
  53. Stadler, T.; Chauvet, J.-M. New innovative ecosystems in France to develop the Bioeconomy. New Biotechnol. 2018, 40, 113–118. [Google Scholar] [CrossRef] [PubMed]
  54. Weiss, G.; Pelli, P.; Orazio, C.; Tykka, S.; Zivojinovic, I.; Ludvig, A. Forest industry clusters as innovation systems: Analysing innovation support frameworks in five European regions. Austrian J. For. Sci. 2017, 134, 119–148. [Google Scholar]
  55. Auer, V.; Zscheile, M.; Engler, B.; Haller, P.; Hartig, J.; Wehsener, J.; Husmann, K.; Erler, J.; Thole, V.; Schulz, T.; et al. Bioeconomy Cluster: Resource efficient creation of value from beech wood to bio-based building materials. In Proceedings of the World Conference on Timber Engineering 2016, Vienna, Austria, 22–25 August 2016. [Google Scholar]
  56. Ramon-Muñoz, R. The growth of an agribusiness cluster in Catalonia: Evidence from the Olive Oil Industry. Tijdschr. Soc. Econ. Geschied. 2016, 13, 41–66. [Google Scholar] [CrossRef] [Green Version]
  57. Liu, Z.; Jongsma, M.A.; Huang, C.; Dons, J.H.; Omta, S.O. The sectoral innovation system of the Dutch vegetable breeding industry. NJAS-Wagen J. Life Sci. 2015, 74, 27–39. [Google Scholar] [CrossRef] [Green Version]
  58. Aznar-Sánchez, J.A.; Galdeano-Gómez, E. Territory, Cluster and Competitiveness of the Intensive Horticulture in Almería (Spain). Open Geogr. J. 2011, 4, 103–114. [Google Scholar] [CrossRef] [Green Version]
  59. Larreina, M.; Gómez-Bezares, F.; Aguado, R. Development rooted on Riojan soil: The wine cluster and beyond. Open Geogr. J. 2011, 4, 3–15. [Google Scholar] [CrossRef] [Green Version]
  60. Bumgardner, M.S.; Graham, G.W.; Goebel, P.C.; Romig, R.L. How Clustering Dynamics Influence Lumber Utilization Patterns in the Amish-Based Furniture Industry in Ohio. J. For. 2011, 109, 74–81. [Google Scholar]
  61. Balocco, R.; Andreoni, M.C.; Rangone, A. eBusiness applications in SMEs of Italian industrial districts: The textile and wood/furniture cases. Serv. Bus. 2008, 2, 303–319. [Google Scholar] [CrossRef]
  62. Mrosek, T.; Schulte, A. Cluster organization in forestry: Supporting information and knowledge transfer in the practice, science and policy of sustainable forest management. In Sustainable Forestry: From Monitoring and Modelling to Knowledge Management and Policy Science; Reynolds, K.M., Thomson, A.J., Köhl, M., Shannon, M.A., Ray, D., Rennolls, K., Eds.; CABI Publishing: Oxfordshire, UK, 2007; ISBN 978-184-593-174-2. [Google Scholar]
  63. Perez-Aleman, P. CLUSTER formation, institutions and learning: The emergence of clusters and development in Chile. Ind. Corp. Chang. 2005, 14, 651–677. [Google Scholar] [CrossRef]
  64. Martinez, P.R.; Molnar, J.; Trejos, E.; Meyer, D.; Meyer, S.T.; Tollner, W. Cluster membership as a competitive advantage in aquacultural development: Case study of tilapia producers in Olancho, Honduras. Aquac. Econ. Manag. 2004, 8, 281–294. [Google Scholar] [CrossRef]
  65. Perdana, T.; Mahra Arari, H.; Fernianda Rahayu, H.; Ginanjar, T.; Ajeng Sesy, N.P. Development of collaboration in sustainable agribusiness cluster. In Proceedings of the MATEC Web of Conferences, Bali, Indonesia, 30 March 2018. [Google Scholar]
  66. Ylimartimo, A. Case study on Bioeconomy Campus, Central Finland. Biofuels Bioprod. Biorefin. 2018, 12, 177–186. [Google Scholar] [CrossRef]
  67. Sarturi, G.; Vargas, C.A.F.; Boaventura, J.M.G.; Santos, S.A.D. Competitiveness of clusters: A comparative analysis between wine industries in Chile and Brazil. Int. J. Emerg. Mark. 2016, 11, 190–213. [Google Scholar] [CrossRef]
  68. Spekkink, W. Institutional capacity building for industrial symbiosis in the Canal Zone of Zeeland in the Netherlands: A process analysis. J. Clean. Prod. 2013, 52, 342–355. [Google Scholar] [CrossRef]
  69. Amisse, S.; Leroux, I.; Muller, P. Proximities and Logics Underlying Cluster Dynamics: The Case of the Ornamental Horticulture Cluster in Maine-et-Loire. Ind. Innov. 2012, 19, 265–283. [Google Scholar] [CrossRef] [Green Version]
  70. Anh, P.T.; Dieu, T.T.M.; Mol, A.P.J.; Kroeze, C.; Bush, S.R. Towards eco-agro industrial clusters in aquatic production: The case of shrimp processing industry in Vietnam. J. Clean. Prod. 2011, 19, 2107–2118. [Google Scholar] [CrossRef]
  71. Lehtoranta, S.; Nissinen, A.; Mattila, T.; Melanen, M. Industrial symbiosis and the policy instruments of sustainable consumption and production. J. Clean. Prod. 2011, 19, 1865–1875. [Google Scholar] [CrossRef]
  72. Bélis-Bergouignan, M.-C. Bordeaux wines: An archetypal Terroir Cluster? Open Geogr. J. 2011, 4, 73–90. [Google Scholar] [CrossRef]
  73. Pavlovich, K.; Akoorie, M. Innovation, sustainability and regional development: The Nelson/Marlborough seafood cluster, New Zealand. Bus. Strategy Environ. 2010, 19, 377–386. [Google Scholar] [CrossRef]
  74. Tavoletti, E. The Role of Universities in Supporting Local Agroindustry: The Case of the Piceno District in Italy. Ind. High. Educ. 2008, 22, 411–424. [Google Scholar] [CrossRef] [Green Version]
  75. Pöyhönen, A.; Smedlund, A. Assessing intellectual capital creation in regional clusters. J. Intellect. Cap. 2004, 5, 351–365. [Google Scholar] [CrossRef] [Green Version]
  76. Perez-Aleman, P. Decentralised production organisation and institutional transformation: Large and small firm networks in Chile and Nicaragua. Camb. J. Econ. 2003, 27, 789–805. [Google Scholar] [CrossRef]
  77. De Hoop, E. Understanding marginal changes in ecosystem services from biodiesel feedstock production: A study of Hassan Bio-Fuel Park, India. Biomass Bioenergy 2018, 114, 55–62. [Google Scholar] [CrossRef]
  78. Maya-Ambía, C. Constructing agro-industrial clusters or disembedding of the territory? Lessons from Sinaloa as the leading horticultural export-oriented region of Mexico. Open Geogr. J. 2011, 4, 29–44. [Google Scholar] [CrossRef] [Green Version]
  79. Gatrell, J.D.; Reid, N.; Steiger, T.; Smith, B.W.; Carroll, M.C. “Value”-chains: Identity, tradition, and Ohio’s flori(culture) industry. Appl. Geogr. 2009, 29, 346–357. [Google Scholar] [CrossRef]
  80. Doloreux, D.; Shearmur, R.; Figueiredo, D. Québec’ coastal maritime cluster: Its impact on regional economic development, 2001–2011. Mark. Policy 2016, 71, 201–209. [Google Scholar] [CrossRef]
  81. Yu, F.; Han, F.; Cui, Z. Evolution of industrial symbiosis in an eco-industrial park in China. J. Clean. Prod. 2015, 87, 339–347. [Google Scholar] [CrossRef]
  82. Ganzevles, J.; Asveld, L.; Osseweijer, P. Extending bioenergy towards smart biomass use Issues of social acceptance at Park Cuijk, The Netherlands. Energy Sustain. Soc. 2015, 5, 22. [Google Scholar] [CrossRef] [Green Version]
  83. Hintjens, J.; Vanelslander, T.; Van der Horst, M.; Kuipers, B. Towards a bio-based economy in ports: The case of the Flemish-Dutch delta. Int. J. Transp. Econ. 2015, 42, 229–247. [Google Scholar]
  84. Bournaris, T.; Manos, B. European Union agricultural policy scenarios’ impacts on social sustainability of agricultural holdings. Int. J. Sustain. Dev. World Ecol. 2012, 19, 426–432. [Google Scholar] [CrossRef]
  85. Abbasiharofteh, M. Endogenous effects and cluster transition: A conceptual framework for cluster policy. Eur. Plan. Stud. 2020, 1–24. [Google Scholar] [CrossRef]
Figure 1. Schematic illustration of the scales and levels (based on Cash et al. [31] and Vervoort et al. [35]).
Sustainability 12 03890 g001
Figure 2. Illustration of geographical, administrative, institutional, network, heterogeneity, and trust scales and their associated levels.
Sustainability 12 03890 g002
Figure 3. Localization of the 42 bioclusters described in the set of the articles.
Sustainability 12 03890 g003
Figure 4. Distribution of the bioeconomy sectors among the bioclusters in the set of the articles.
Sustainability 12 03890 g004
Figure 5. The initial design of the multiscalar framework.
Sustainability 12 03890 g005
Figure 6. The new scales retrieved from the 42 case studies.
Sustainability 12 03890 g006
Figure 7. The multiscalar framework.
Sustainability 12 03890 g007
Figure 8. Distribution of the scale references across the scales and dimensions.
Sustainability 12 03890 g008
Table 1. The case studies and their economic, environmental, and social performance.
Case StudyReferences to Economic PerformanceEconomic PerformanceEnvironmental PerformanceSocial Performance
Cork cluster in Santa Maria da Feira, Portugal [52][cluster] is the main source of employment, added value, and exports, and the main support of this key sector in PortugalGoodenvironmental benefitssocial development
IAR-Pole, Hauts-de-France and Grand Est, Northern France [53]complete innovation ecosystem on bioeconomy; largest bioeconomy network in France Goodenvironmental benefits
Forestry cluster in North Karelia, Finland [54](based on the comparative analysis of the cases in the article)Goodpollution reduction
Xylofutur cluster, Aquitaine, France [54](based on the comparative analysis of the cases in the article) all three segments of the triple helix model […] actively included in the sectoral development; cluster organization […] connects all three spheres and outreaches across sectoral and regional boundariesGoodenvironmental benefits
Forestry cluster in Baden-Württemberg, Germany [54](based on the comparative analysis of the cases in the article) strong sectoral organizations from all triple helix spheresGoodutilizing renewable energies
Bioeconomy cluster, Saxony, Saxony-Anhalt, Germany [55]outstanding research in interdisciplinary teams; innovative industrial companiesGoodenvironmental preservation
Southern and Western Catalan olive oil cluster, Spain [56]favorable factors of Porter’s diamond of national competitive advantage; successful response of agents to changing conditionsGood
Waste Management EcoComplex, North Carolina, USA [50]EcoComplex demonstrates leadership as a regional model and unique case study; key elements of triple helix working in collaborationGoodstriving towards zero waste
Vegetable breeding cluster, the Netherlands [57]this successful industry is playing important roles in the Dutch public domains; one of the most innovative in the worldGoodenvironmental benefits
Paso Robles wine cluster, California, USA [51]an image of a rising star in the wine world; a consistent increase in the number of wines and the average rating in Wine SpectatorGood
Cluster in Horticulture, Campo de Dalías, Almeria, Spain [58][…] generating systemic and dynamic competitive advantages; the economic model […] has allowed growth of both the economy and the population of AlmeríaGoodenvironmental advantagessocial benefits
Wine cluster in Rioja, Spain [59]the production of wine in Rioja has developed a successful cluster, which has fostered innovation and regional competitivenessGood social development
Wood cluster, Holmes, northeastern Ohio, USA [60]unusual competitive success; the presence of this successful […] cluster helps sustain regional forest-based economiesGood
Wood waste processing cluster, Maniwa, Okayama Prefecture, western Japan [44]the social capital […], the attitude and values […], institutions, and their relationships, contributed to the economic and social development, as well as environmental preservation, thus turning the Maniwa model to a success storyGoodCO2 reductionsocial development
Furniture cluster, Brianza area, Italy [61]the district of Brianza [has] a leading position in the production of high-quality furnitureGood
Forest and wood-processing cluster in North Rhine-Westphalia, Germany [62][cluster] is of nationwide and international relevance; highly significant for the regional economy and employment marketGoodenvironmental advantages
Salmon industry cluster, Tenth region, Chile [63](based on the content of the article—no specific references)Goodreduced environmental impact
Agroindustry cluster, Curicó and Talca, Chile [63](based on the content of the article —no specific references)Good
Tilapia production cluster in Olancho, Honduras [64]successful adoption and retention of tilapia culture; […] facilitates technology adoption, production success, and marketing competence for all its membersGood
Sustainable agribusiness cluster, Kuningan District, West Java, Indonesia [65]the multi-stakeholders [of the] cluster should develop better relationship, […] communication, […] collaboration; some parties still doubt and lack of trust (potential plurality challenge)Averageenvironmental advantagessocial benefits
Bioeconomy Campus, Tarvaala, Northern Central Finland [66]somewhat lagging within the existing industrial structure; lacks the specificity of a distinct cluster and […] a market-driven perspectiveAverage
Wine cluster in Valle del Maule, Chile [67](based on the comparative analysis of the cases in the article)Average
Wine cluster in Serra Gaúcha, Brazil [67](based on the comparative analysis of the cases in the article)Average
The Canal Zone, Zeeland, The Netherlands [68]occasional lack of government support; occasional difficulties in creating a clusterAveragereduction of environmental impact
Maine-et-Loire Horticultural Cluster, Angers, Anjou Region, Western France [69]incompatibility between the industrial strategies of national and regional governments and local economic reality (potential plurality challenge)Average
Shrimp processing cluster, Soc Trang Province, Vietnam [70]lack of public awareness and community action (ignorance challenge)Averagereducing pollution, protecting natural resources
Forestry cluster, Kouvola, Southeast Finland [71]policy instruments have [not] succeeded in […] systematically encouraging operators toward symbiosis-like activitiesAverageenvironmental benefits
Bordeaux Wines Terroir Cluster, France [72](based on the content of the article—no specific references)Average
Nelson/Marlborough seafood cluster, Upper South Island, New Zealand [73]incomplete local supply chain; inadequate educational programsAveragecontributed to slowing down the serious exploitation facing fisheriessocial development, responsibility towards social and cultural conditions
Agroindustry cluster, Piceno district, the Marche Region, Italy [74](based on the content of the article—no specific references)Average
Mechanical wood processing industry, Eastern Finland [75]poorly structured production network, resulting in inefficient production processes; lack of trustAverage
Dairy cluster in Nueva Guinea, Nicaragua [76]issues related to weak governance and an absence of necessary policies and programsAverage
Hassan Biofuel Park, Karnataka, India [77]plurality challenge—discrepancy in the political intentions of different governmental levels regarding biodiesel: […] while India’s national and Karnataka’s state-level biodiesel policies set blending targets as their main priorities, the Hassan Bio-Fuel Park project is heralded by policy-makers for its intention to contribute to the eradication of rural poverty without affecting food productionPoor
Basque Country Wood cluster, Spain [54](based on the comparative analysis of the cases in the article) plurality challenge—complicated administrative system and a lack of trust and co-operation among the various stakeholders; governmental actors seem to be very weak when it comes to innovation support […] which is a severe obstacle for developing a support system in the sectorPoor
Catalonia Wood cluster, Spain [54](based on the comparative analysis of the cases in the article) weak sectoral innovation systemPoor
Agroindustry cluster in horticulture in Sinaloa, Mexico [78]plurality challenge—lack of coordination among different administrative levels of government; weak economic effects, adverse social and ecological effects; […we have enough elements to qualify Sinaloa as a dysfunctional territory…]Pooradverse ecological effectsadverse social effects
Floriculture cluster, Maumee Valley, Ohio, USA [79]persistent social and cultural barriers and [problems breaking the traditional values and business models]; plurality challenge—[the expectations of policy makers may not coincide with industry participants]; opposite expectations and perception between policy-makers and local stakeholdersPoor
Québec coastal maritime cluster, Canada [80] no data
Rizhao Economic and Technology Development Area, Rizhao, China [81] no datastriving toward minimal use of raw materials and energy, minimal production of waste and emissions
Biobased Economy Park, Cuijk, The Netherlands [82] no dataCO2 reductionsocial advantages
Broad specialization cluster, Flemish-Dutch Delta, The Netherlands [83] no data
Textile/clothing cluster, Como, Italy [61] no data
Table 2. Relationship among the different scales of biocluster performance.
ScaleEconomic Performance
GoodAveragePoor
Environmental performance63%38%20% *
Social performance21%15%20% *
* the percentages reflect the one case study [78] with negative environmental and social effects.
Table 3. Pearson correlation matrix for the 14 scales.
Sources of Natural ResourcesAdministrative ScaleKnowledge Accumulation and LearningGeographical ScaleInstitutional ScaleAvailability of Financial ResourcesEconomic PerformanceEnvironmental PerformanceSocial PerformanceNetwork SizeNetworking IntensityHeterogeneityEmploymentTrust between Actors
Sources of natural resources1
Administrative scale0.111
Knowledge acc. and learning0.110.041
Geographical scale---1
Institutional scale00.020.02-1
Availability of financial resources0.050.35 *0.25-0.42 **1
Economic performance0.220.020.16-−0.04−0.111
Environmental performance0.190.51 **−0.14-0.050.280.061
Social performance00.040.13-0.110.41 **−0.010.39 *1
Network size0.14−0.16−0.07-−0.23−0.060.04−0.20.171
Networking intensity0.06−0.050.4 **-−0.17−0.110.43 **−0.21−0.11−0.111
Heterogeneity0.1−0.050.34 *-0.050−0.09−0.150.020.190.171
Employment0.250.190.24-−0.050.52 **−0.030.180.4 **−0.080.2−0.011
Trust between actors−0.05−0.160.11-0.01−0.11−0.12−0.240.120.22−0.02−0.03−0.221
* correlation is significant at the 0.05 level (two-tailed); ** correlation is significant at the 0.01 level (two-tailed). The correlations for the geographical scale are not available because this scale was emphasized only once in all the 42 case studies.

