1. Introduction
At the end of 2019, when health officials in Wuhan (China) reported a group of pneumonia cases caused by an unknown agent, later identified as SARS-CoV-2 in mid-January, the rest of the world saw it as a local problem occurring a long way away. The World Health Organization (WHO) named this new illness COVID-19, and it quickly spread throughout the population, with particularly serious impacts on Italy and Spain during its first phase of expansion outside China to the rest of the world. On 11 March, the WHO declared this illness to be a “global pandemic”, and at the date of this article, there are currently over 1,800,000 confirmed cases and many thousands of dead. Some publications have already analyzed and modelled the expansion of this virus [
1,
2,
3], and recent studies have assessed the utility of Big Data tools to support the analysis of available data to make predictions about this and other illnesses [
4,
5].
Regarding the repercussions of the virus on the transport sector and mobility, most research has concentrated on the effects global mobility has had on China and its influence on how the virus has spread in that country [
6,
7,
8,
9,
10]. Regional, interregional, and municipal aggregated analysis has been found using mobile phone tracking [
11] or mobile applications [
12]. All these studies provide irrefutable evidence that provincial and interprovincial mobility has reduced analogously to how it was observed in China in preceding studies. Moreover, Ivanov [
13] reported using supply chain risk disruption under different outbreak scenarios to assess the impacts on mobility.
However, the repercussions the pandemic has had on internal mobility within towns and cities, above all in Europe, have not been reported on in any detailed way until now. Partial reports, news, press notes, etc., have been found where some reference has been made to the fall in mobility due to social distancing measures and the reduction in journeys being made. A report produced by INRIX [
14] in the city of Seattle (USA) using data from mid-March found a reduction in commuting journeys of up to 60% and improvements in journey times of 26% with a 13% reduction in vehicle/km. A global analysis of mobility has recently been published by Google [
15] revealing a worldwide drop in journeys in practically every country.
All the analyzed published data coincides in that mobility has dropped around the world as the spread of the virus has increased and crossed frontiers. The success of the lockdown policy implemented in Wuhan led the most affected countries to apply similar measures which restricted mobility [
16,
17]. The analysis carried out by TomTom published at TomTom Traffic Index [
18] quantifies the congestion levels in many cities around the world. They found that current congestion levels are below 10% due to the COVID-19 effect, where typical congestion levels in these cities are normally around 50–70%. Public transport systems are the most prejudiced in this decrease, with many users refusing to use them to avoid social contact and reduce risk of contagion. Where limitations have been imposed on travel, the drop in the number of journeys being made has always been greater percentage-wise for public transport than for private traffic. For example, Wuhan (China) or Delhi (India) have registered reductions of 80–90% in the number of users [
19]. On 23 March, the city of Bogotá (Colombia) performed a simulation of journey limitation measures, and the TransMilenio system registered a fall in the number of users of 87% [
20]. There are also some guidelines and recommendations based reports published by official entities such as the International Association of Public Transport (UITP) [
21] or the Transportation Research Board (TRB) [
22] to provide best practices on planning and operating public transport systems under health emergency conditions. In fact, reports are already available highlighting the economic consequences that these measures could have on service providers due to the enormous switch in supply and demand and the possible reductions in bus drivers to address the current adjustment in supply [
23,
24].
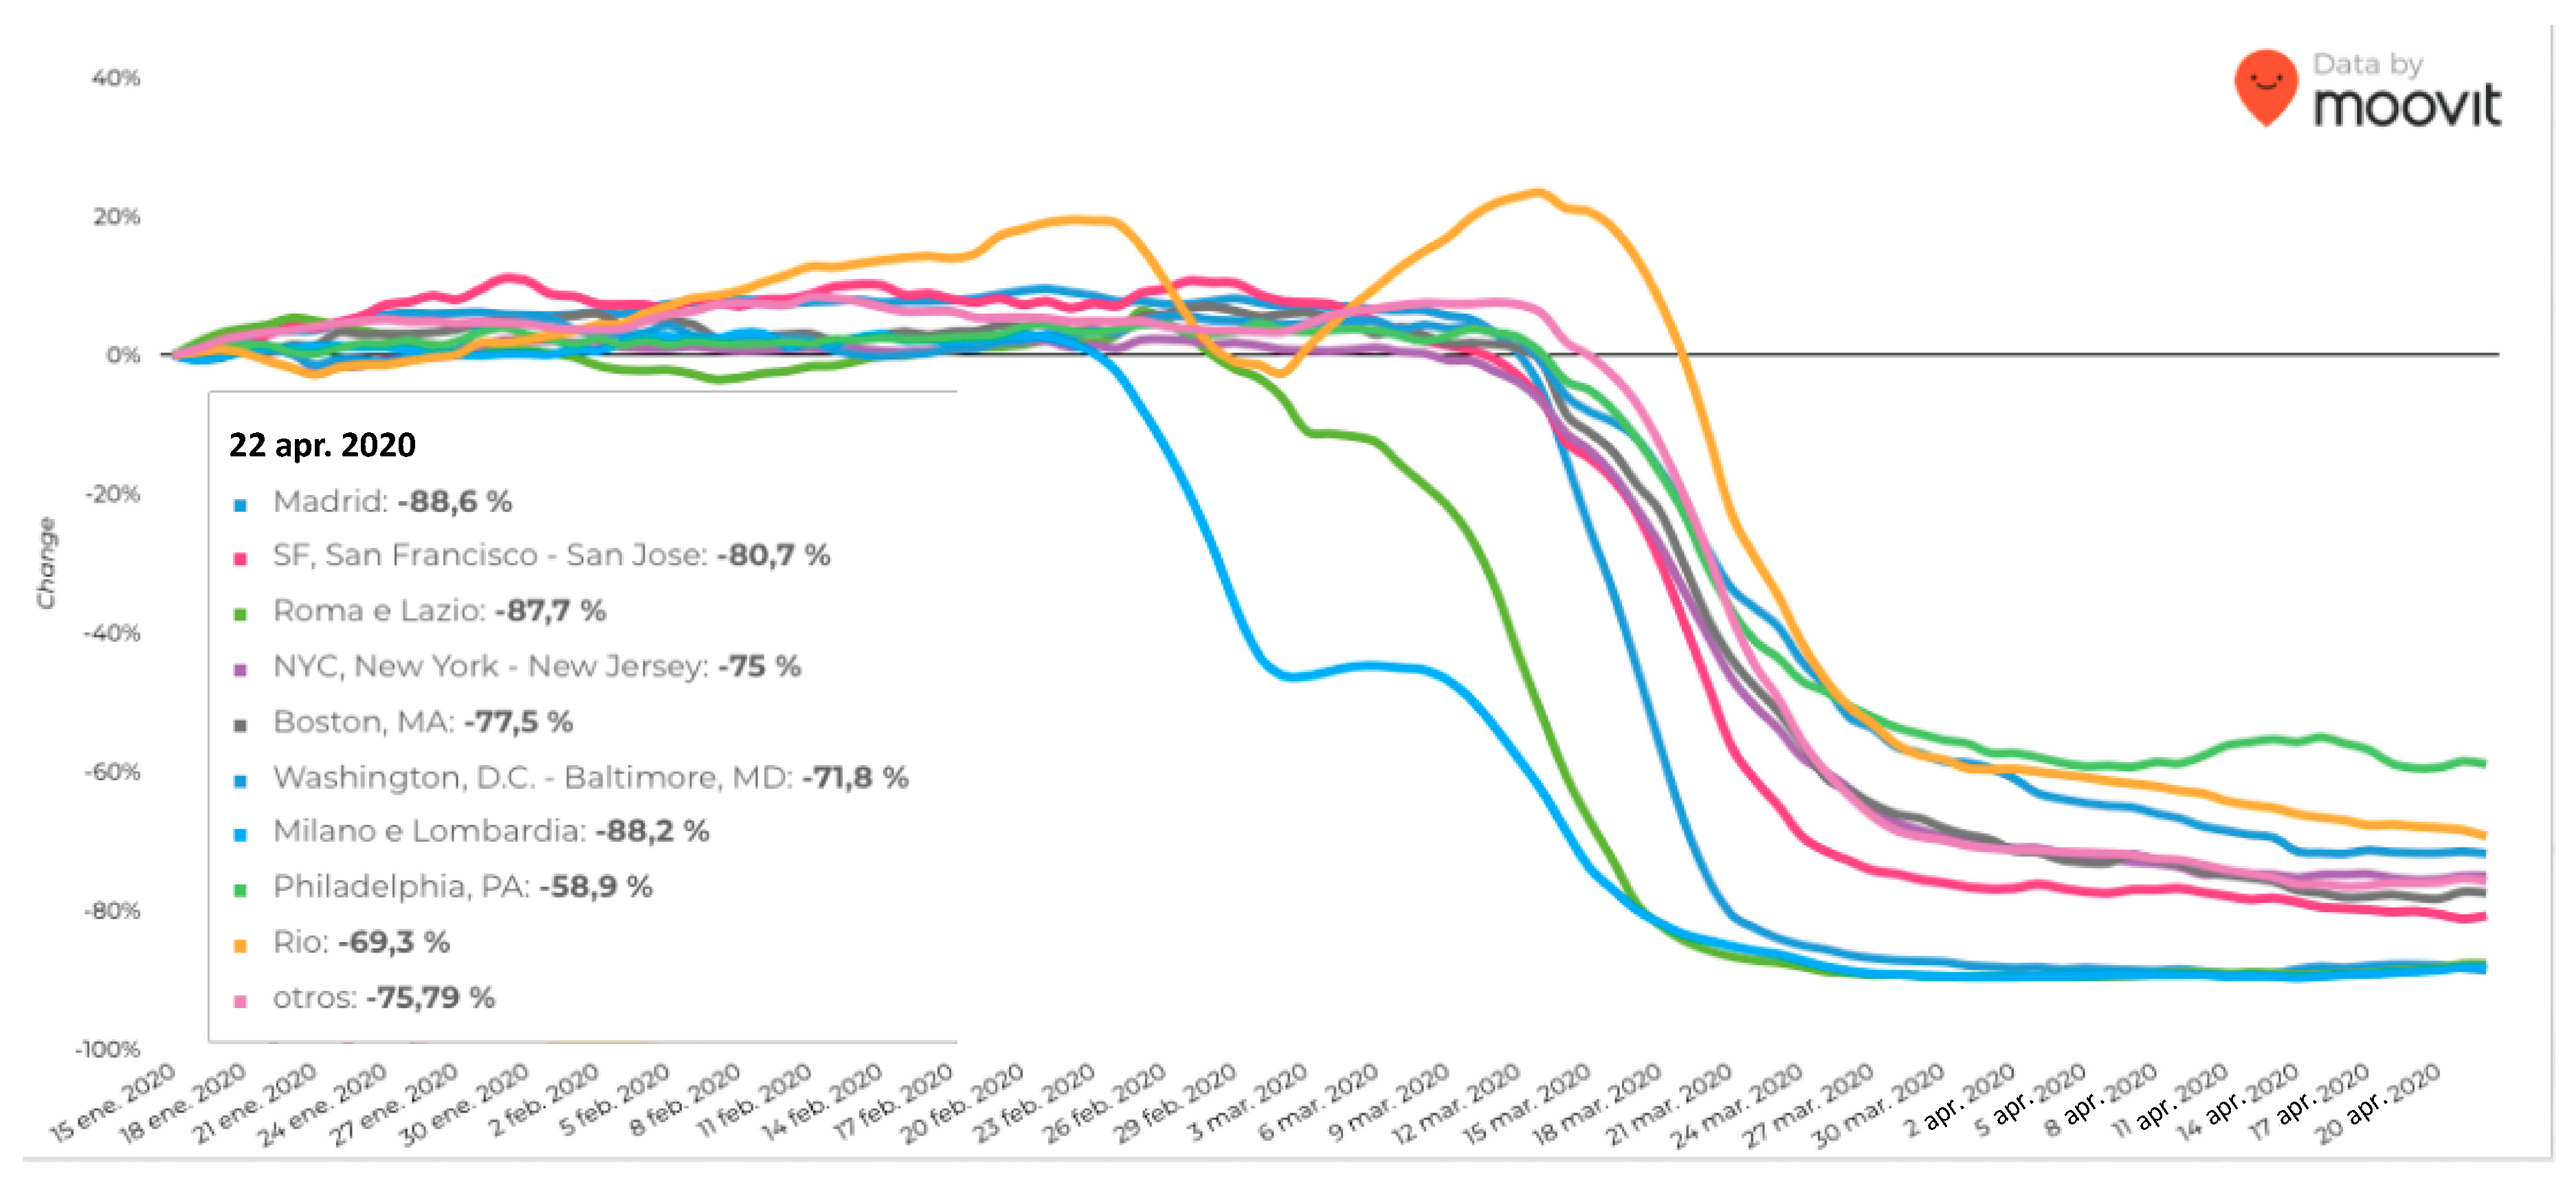
Figure 1 shows how volumes of public transport users have evolved in different cities around the world, as reported by the Moovit platform [
25]. The figure shows how large cities have experienced strong declines as the virus has extended and more restrictions have been imposed.
This drop in usage has been caused by both the reticence of the users themselves and the recommendations of health authorities to avoid using public transport as much as possible, recommending the use of individual means of transport such as bicycles. In spite of such recommendations, research has also been found highlighting the risk of contagion associated with the use of shared bicycle systems [
26].
These reductions in travel have had similar repercussions on the main externalities normally associated with motorized transport modes, mainly journey times, accidents, and pollution. Data has been published in different media revealing reductions of 35% in accident rates in Istanbul (Turkey), where the only action taken during the period of study was to close the schools [
27]. Reductions in emissions have also been reported from different countries around the world, especially significant in the cases of NOx, CO
2, and PM
2.5 [
28,
29,
30]. In China, for example, the measures to minimize the spread of SARS-CoV-2 have resulted in reductions of 25% in CO
2 emissions, and NO
2 levels were 36% lower than in the same period in 2019. In Italy, significant reductions in NO
2 concentrations have been found to be mainly due to the reduction in the use of diesel vehicles for transport. In France, minimum NOx levels have been reached due to the restrictions adopted to fight COVID-19 in economic activities and transport. During the spread of the COVID-19 pandemic in New York, traffic levels were estimated to be down 35% compared with a year ago. CO
2 levels dropped 5–10%, and significant decreases in the emissions of CO and methane were also detected [
31]. Wang et al. [
32] applied the Community Multi-scale Air Quality model considering the constraints caused by the situation with COVID-19 in China. In particular, a traffic reduction of 80% was considered in the most restrictive case. After analyzing the model results, they concluded that anthropogenic emissions decreased, especially in transport and industry, with a reduction in PM
2.5 concentrations. However, the study concluded that the reduction was not enough to avoid the occurrence of severe air pollution events in most of the areas being studied.
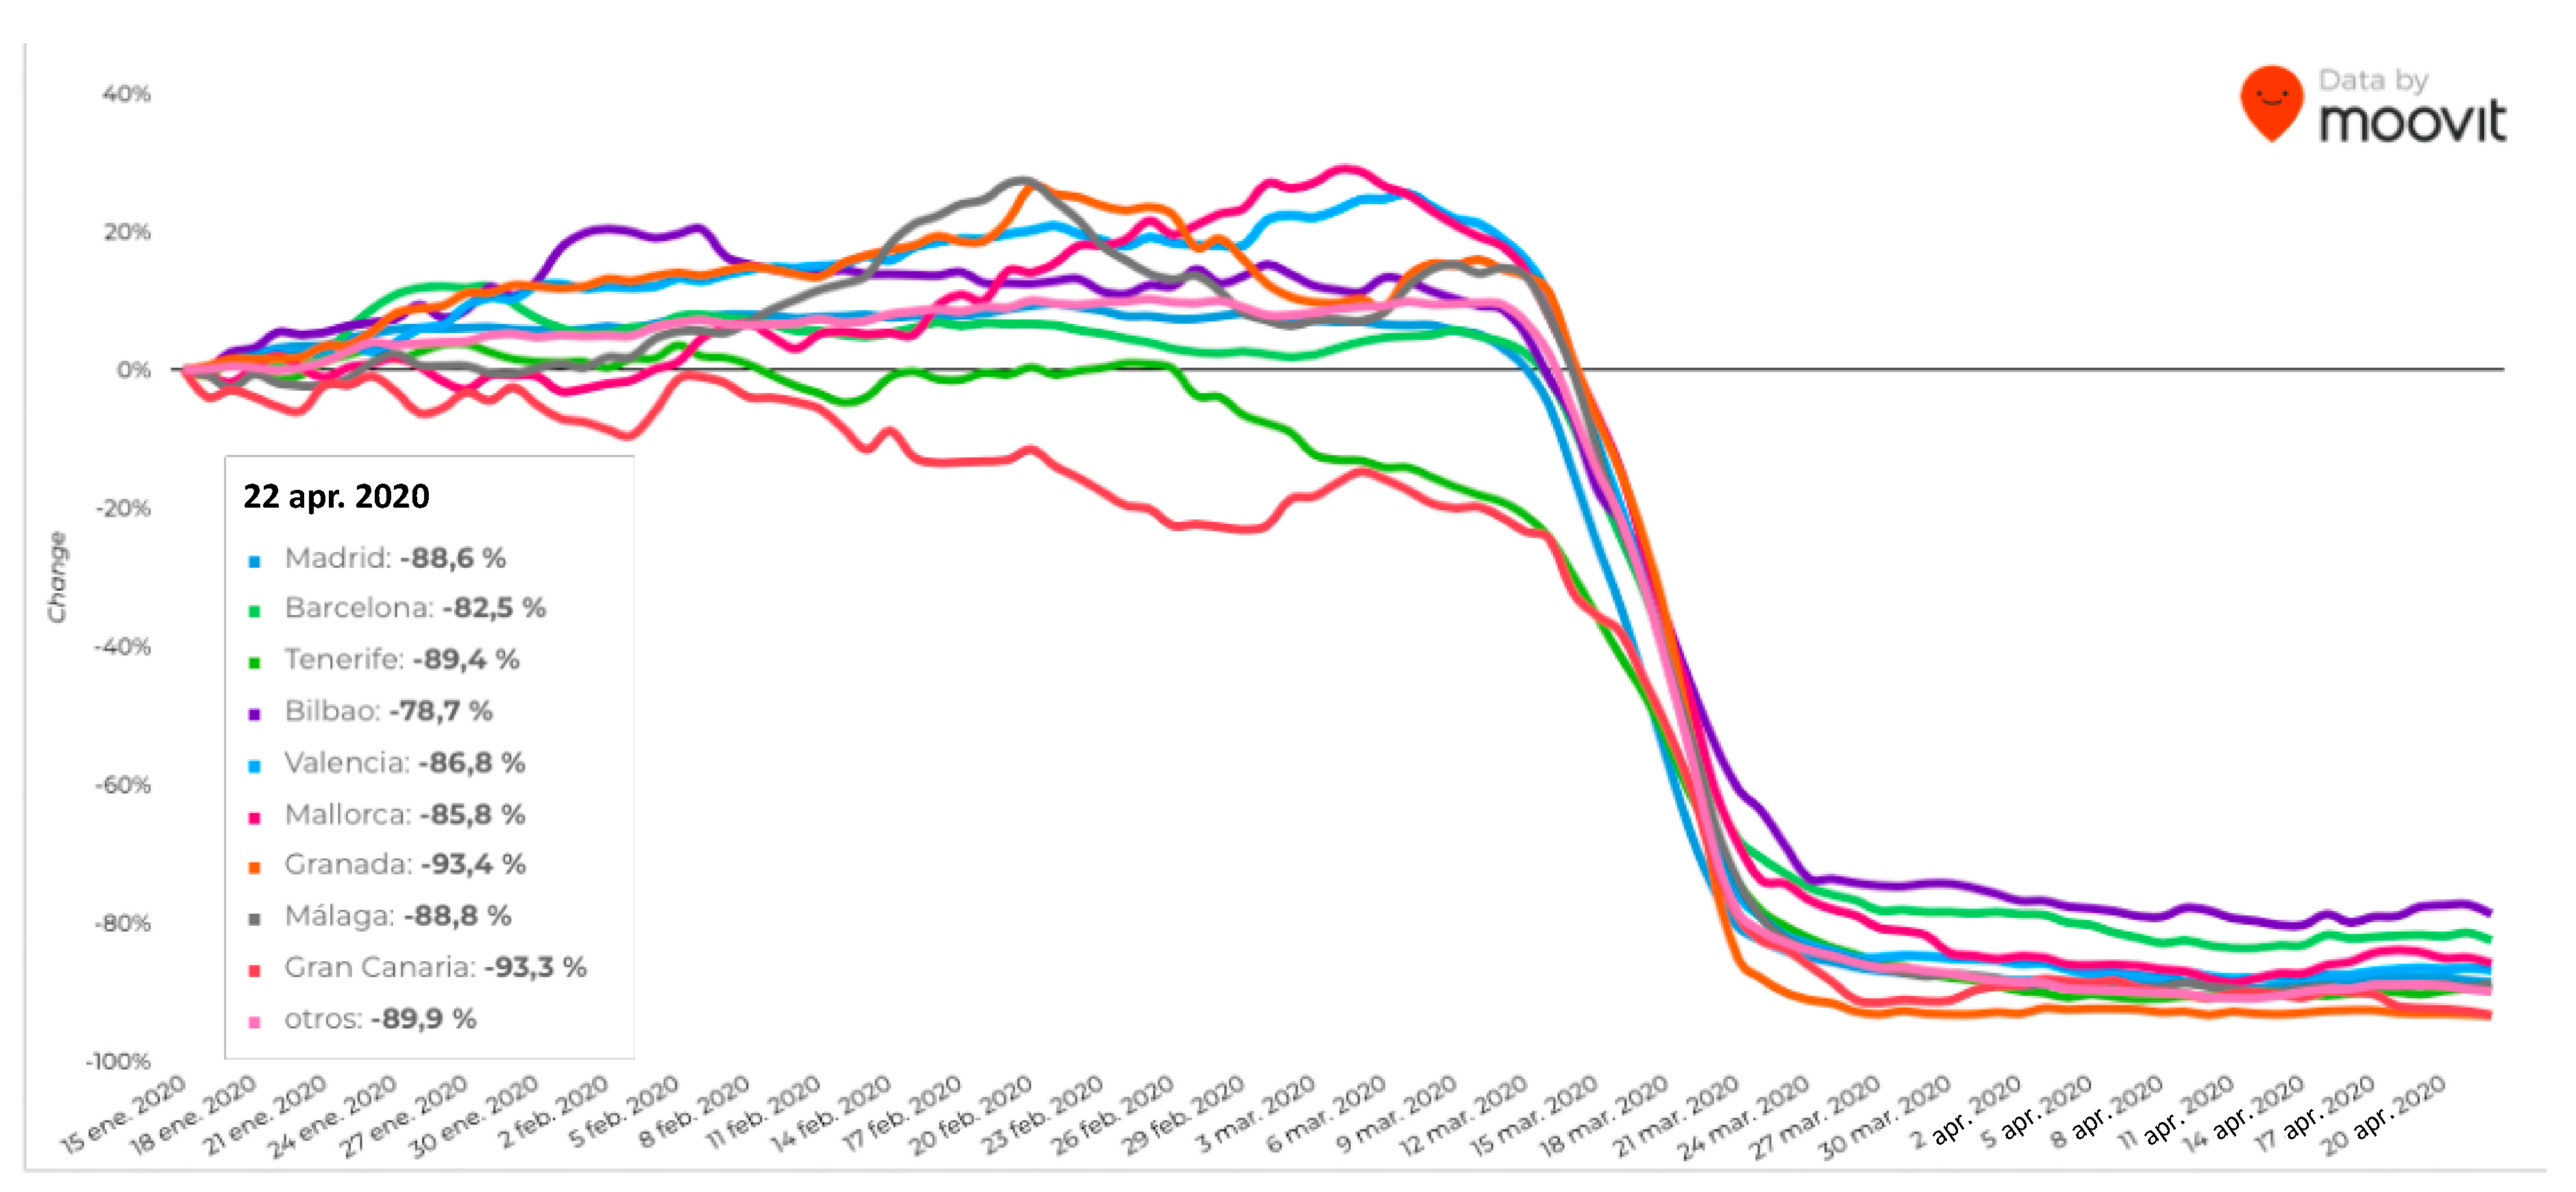
In the case of Spain, the simultaneous closure of centers of education and restrictions on mobility were introduced on Sunday, 15 March 2020 and extended 15 days later, limiting all travel to only those journeys considered to be essential. This date is clearly reflected in
Figure 2, representing the evolution of public transport use for various Spanish cities. A strong decline in the number of users began on the 15th and stabilized approximately one week later. The drop in user numbers is similar for all the cities, at around 80–90%. An analysis of the Google report [
15] for Spain once again found falls of 94% in journeys made for reasons of leisure or shopping, 77% in journeys for food or trips to pharmacies, 89% in mobility around stations and transport nodes, and 68% towards work places. These reductions have been found to be homogenous for all the Spanish regions, including Cantabria, where Santander (the case study of this work) is located.
The reported data proves that overall mobility in many countries of the world has fallen as a consequence of the sudden stop to human activities due to lockdown (quarantine) policies. This has led to the extreme breakdown of mobility patterns [
33,
34] and halted the current trend towards sustainable transport in cities. In spite of increasing motorized traffic as the economic crisis was being overcome, especially on regional networks [
35,
36], the use of personal transport systems (both shared and private) such as bicycles or scooters was exponentially growing in urban areas [
37].
The authors, therefore, decided to report on a more detailed and integrated analysis of the mobility changes that have occurred within a city. This study covers various modes of transport and their effect on other externalities, and this research will provide data which can be used to make more thorough detailed comparisons with other case studies.
2. Case Study Analysis
The particular case being studied in this article is the city of Santander, located on the North Spanish coast. Santander is the capital of the autonomous region of Cantabria. With nearly 180,000 inhabitants according to the National Institute of Statistics, trade and services provide employment for more than 70 percent of its active population.
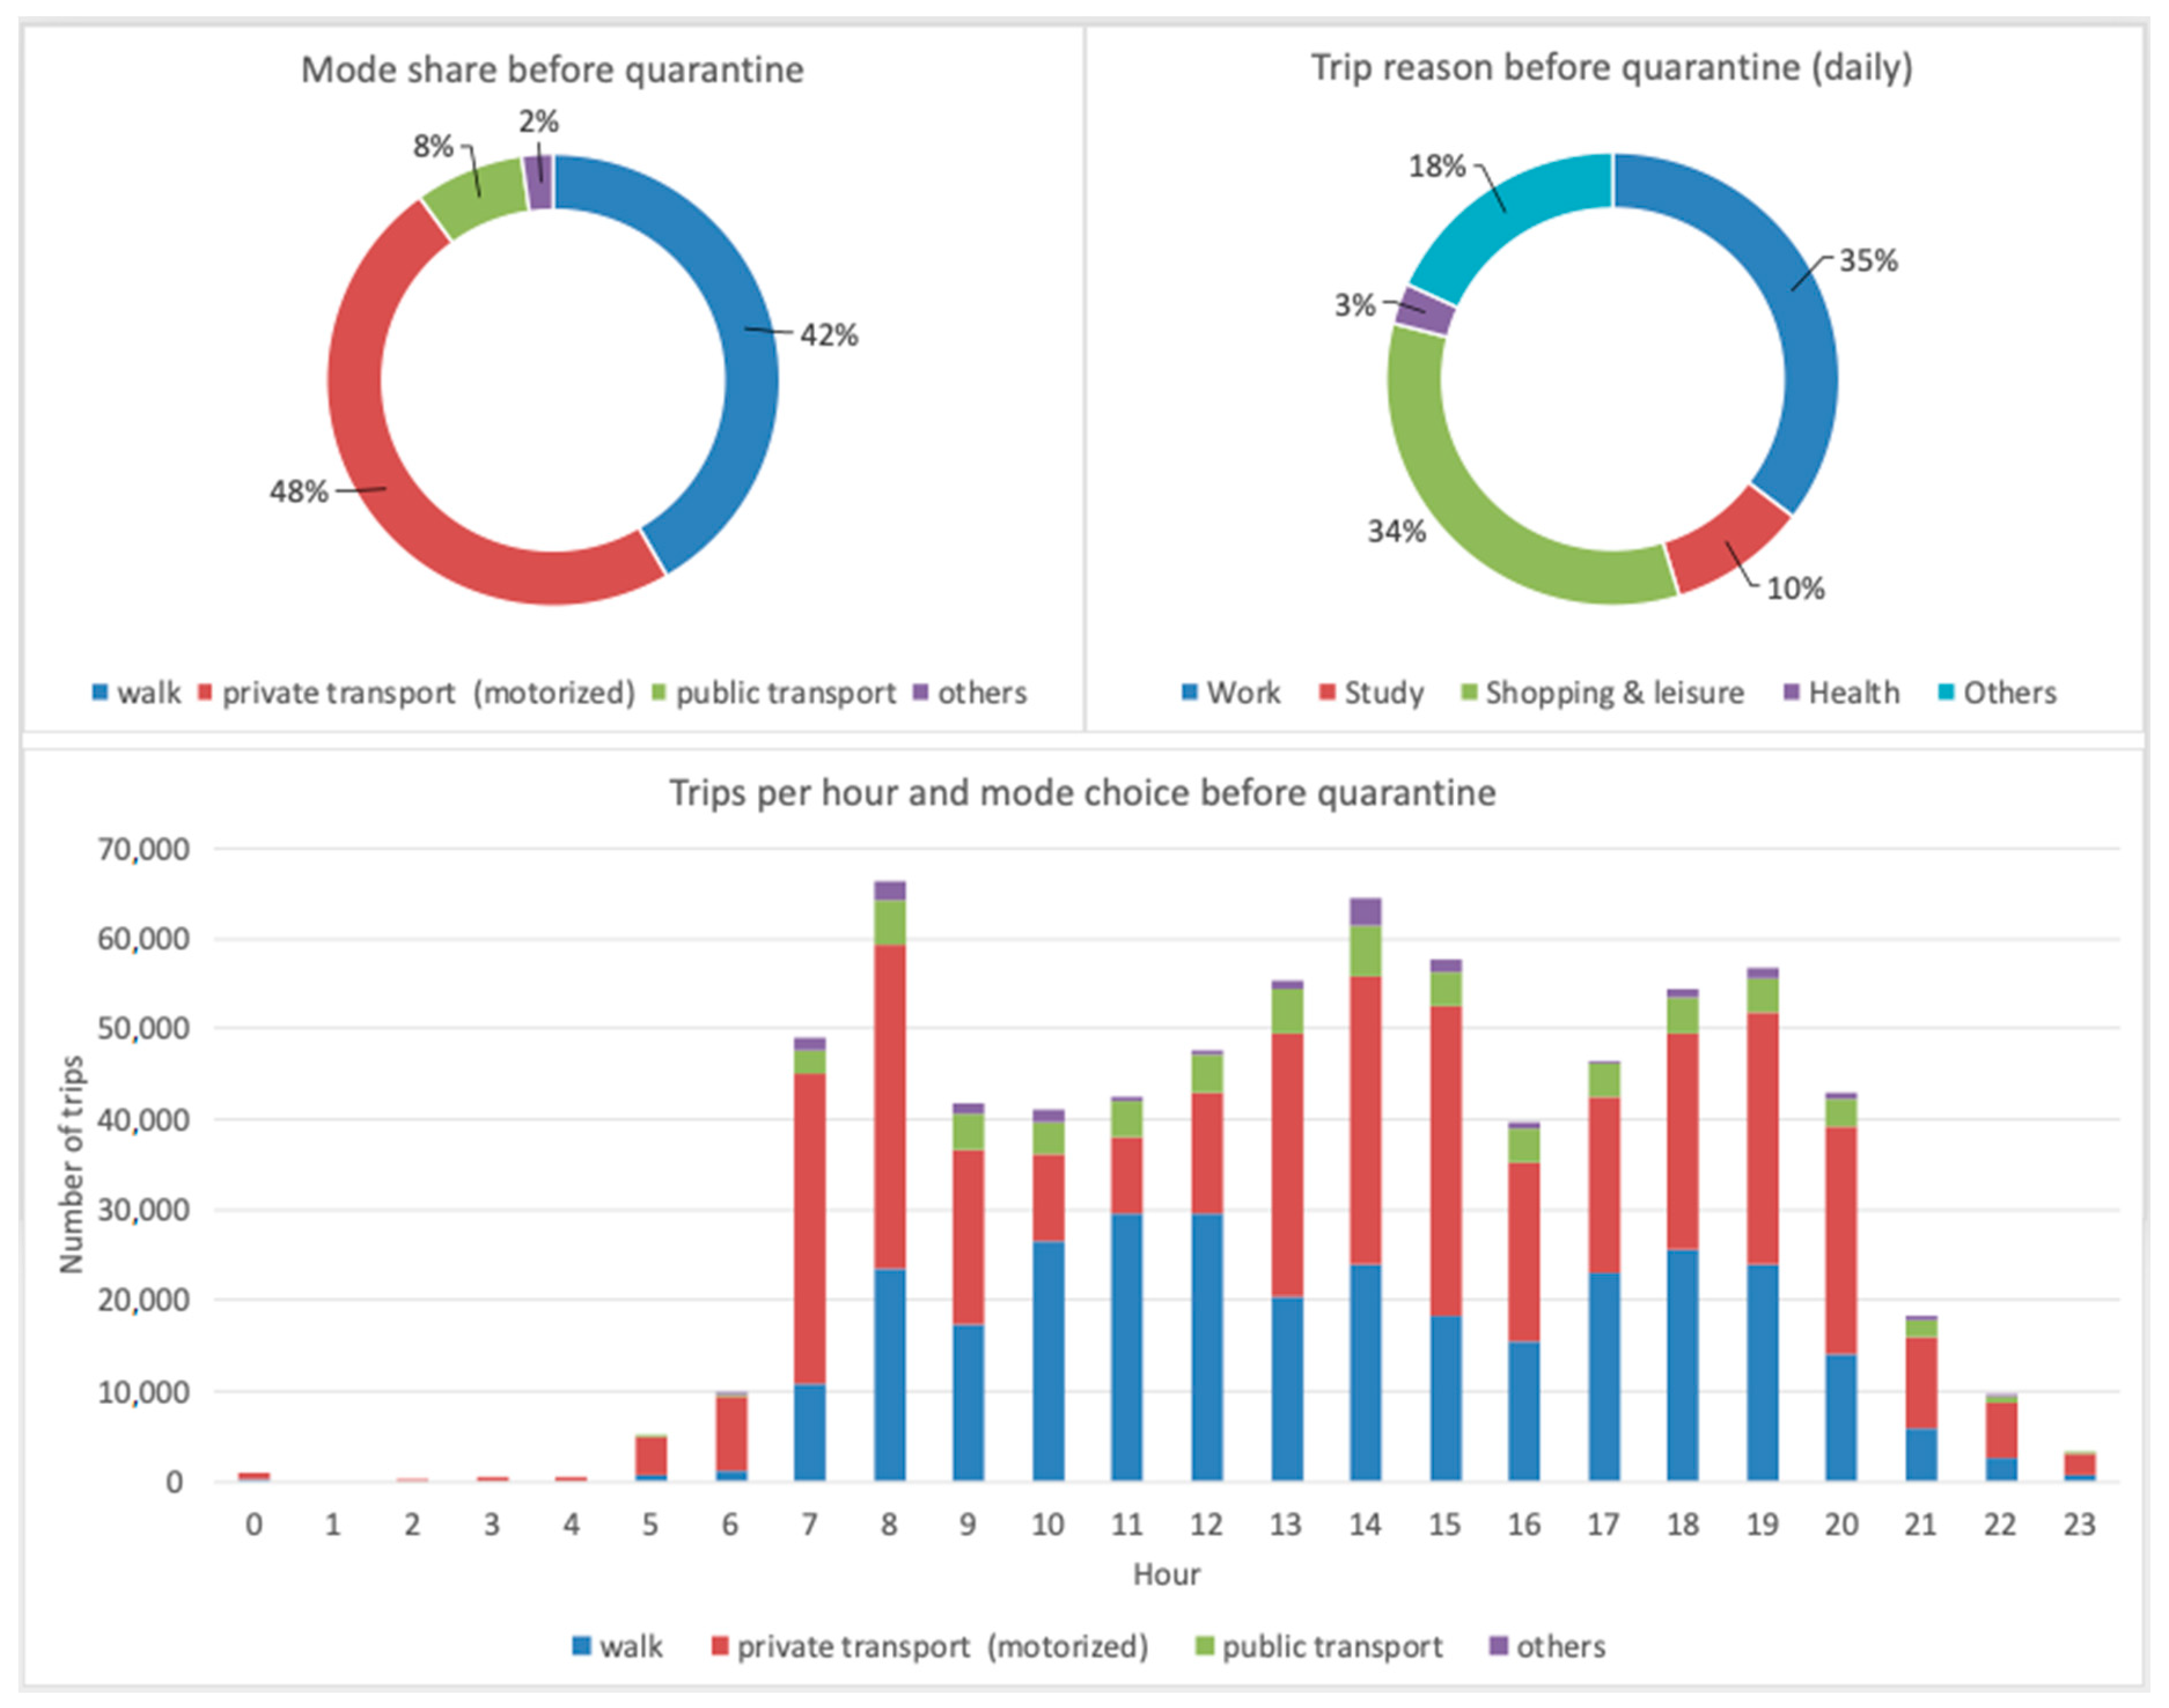
According to the 2013 mobility survey updated with traffic transit and pedestrian counts in 2018, the aggregated picture of mobility before (including commuting) the quarantine can be seen in
Figure 3, where 42% of urban mobility is done by walking, 48% by private motorized transport (driving or passenger), and 8% by bus. The remaining 2% is done by bike/scooter. It should be highlighted that public transport is more often used for study and health related trips. The daily trips profile was estimated using this data.
Figure 3 also shows three peak periods in a working day as many people return home for lunch due to the Spanish working day. These peak hours and patterns match for all modes throughout the day, with the exception of the afternoon peak hour, which is slightly longer for the private vehicle mode.
The new urban mobility patterns resulting from the quarantine are calculated from different data obtained by the authors thanks to an agreement with the city hall, which provides real time information to a data processing laboratory located at the University of Cantabria. A total of 480 electromagnetic traffic counters reported values for intensity and occupation every minute. Public transport GPS positioning data were analyzed to provide speed and number of stops from the onboard Intelligent Transport System (ITS), ticketing data provided the number of users at any given moment, at what stop, line, and vehicle. Finally, 45 traffic control cameras were analyzed, and using image processing techniques the authors were able to discretize pedestrian flows. Thanks to the recording system, we were able to process and compare the images before and during the quarantine.
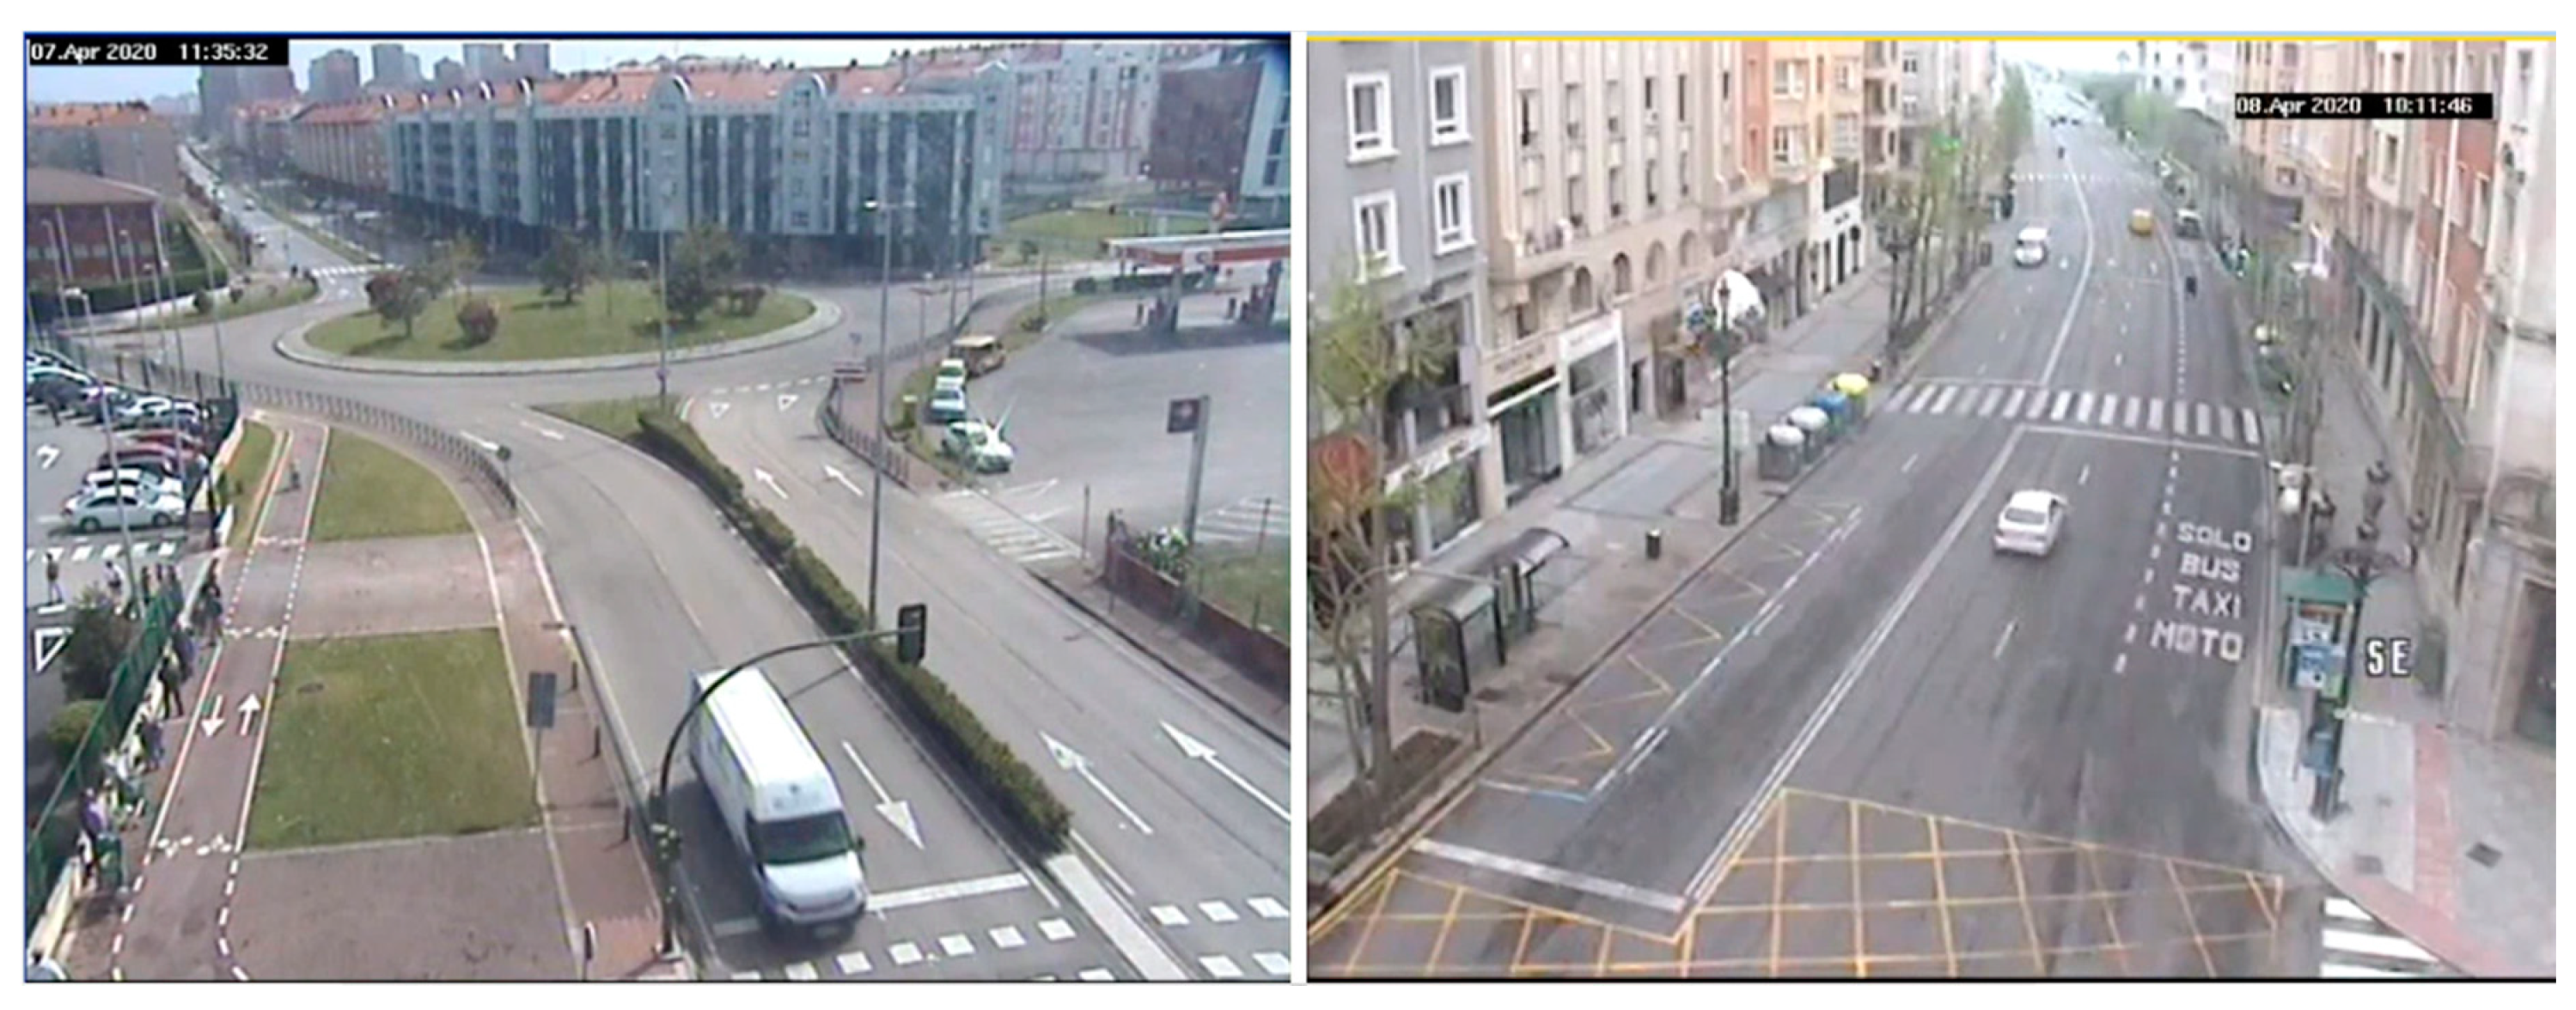
An example of the data used is shown in
Figure 4. On the left, the figure shows a moment taken of a residential zone, showing the queue of people waiting to enter a supermarket, and on the right is the main street in the center of the city with a clear absence of vehicles and pedestrians.
Finally, data from fixed sensors installed by the Regional Government’s Environmental Department was also analyzed along with data from mobile sensors installed on the roofs of local buses.
The analysis started with general motorized traffic, where a strong decline was found throughout the city. As a reference, before confinement, the main entrance to the city registered about 42,000 vehicles on a working day. After confinement was declared, the traffic reduced by 64%, and during week 3, the reduction rose to 78%. In order to obtain an overall result, a Network Macroscopic Fundamental Diagram—NMFD [
38] was estimated for all the Mondays in the month of March. Days 2 and 7 of March can be considered as normal, days 16 and 23 enter the first period of quarantine, being the first and second working Monday of the quarantine (days 2 and 9), respectively. The 30th of March (Monday) enters the second period of quarantine (16th day of quarantine), where the restrictions on mobility are even more severe (and still are, at the date of writing this article), trips being limited to essential activities only and the purchase of basic necessities. The data was aggregated into periods of 5 min.
Figure 5 shows how the normal days before quarantine show practically identical behavior, with average maximum intensities of around 600 veh/h and always within the stable range, never reaching capacity. Flow and occupancy drastically reduce during the quarantine, with an even greater reduction (over 65%) on the 30th of March. The figure on the right shows the same behavior throughout the day, clearly showing that during confinement, morning mobility is greater than during the afternoon, where afternoon rush hour has all but disappeared, and morning rush hour smoothed its peak after the restrictions were hardened as fewer people were allowed to travel for reasons of work. An increase in the average flow during the night period (between 1:00 a.m. and 5:00 a.m.) has also been noted, but no further data are available at this time to explain this fact.
A similar analysis can be performed by disaggregating the city into corridors [
39].
Figure 6 shows the corridor with the most traffic (Marqués de la Hermida street) which is also the main entrance route to Santander from the East (direction Bilbao).
The resulting diagrams (
Figure 6 left) follow the same pattern of behavior as the case explained above, although with higher intensity and occupancy values. The same occurs with the traffic profiles (
Figure 6 right), where the morning peak is quite striking as it is a Monday and the main access point from the surrounding catchment area. This peak continues to appear during quarantine, but is much less striking with lower traffic intensity. As before, once morning rush hour has passed, the amount of traffic drops and afternoon rush hour disappears completely.
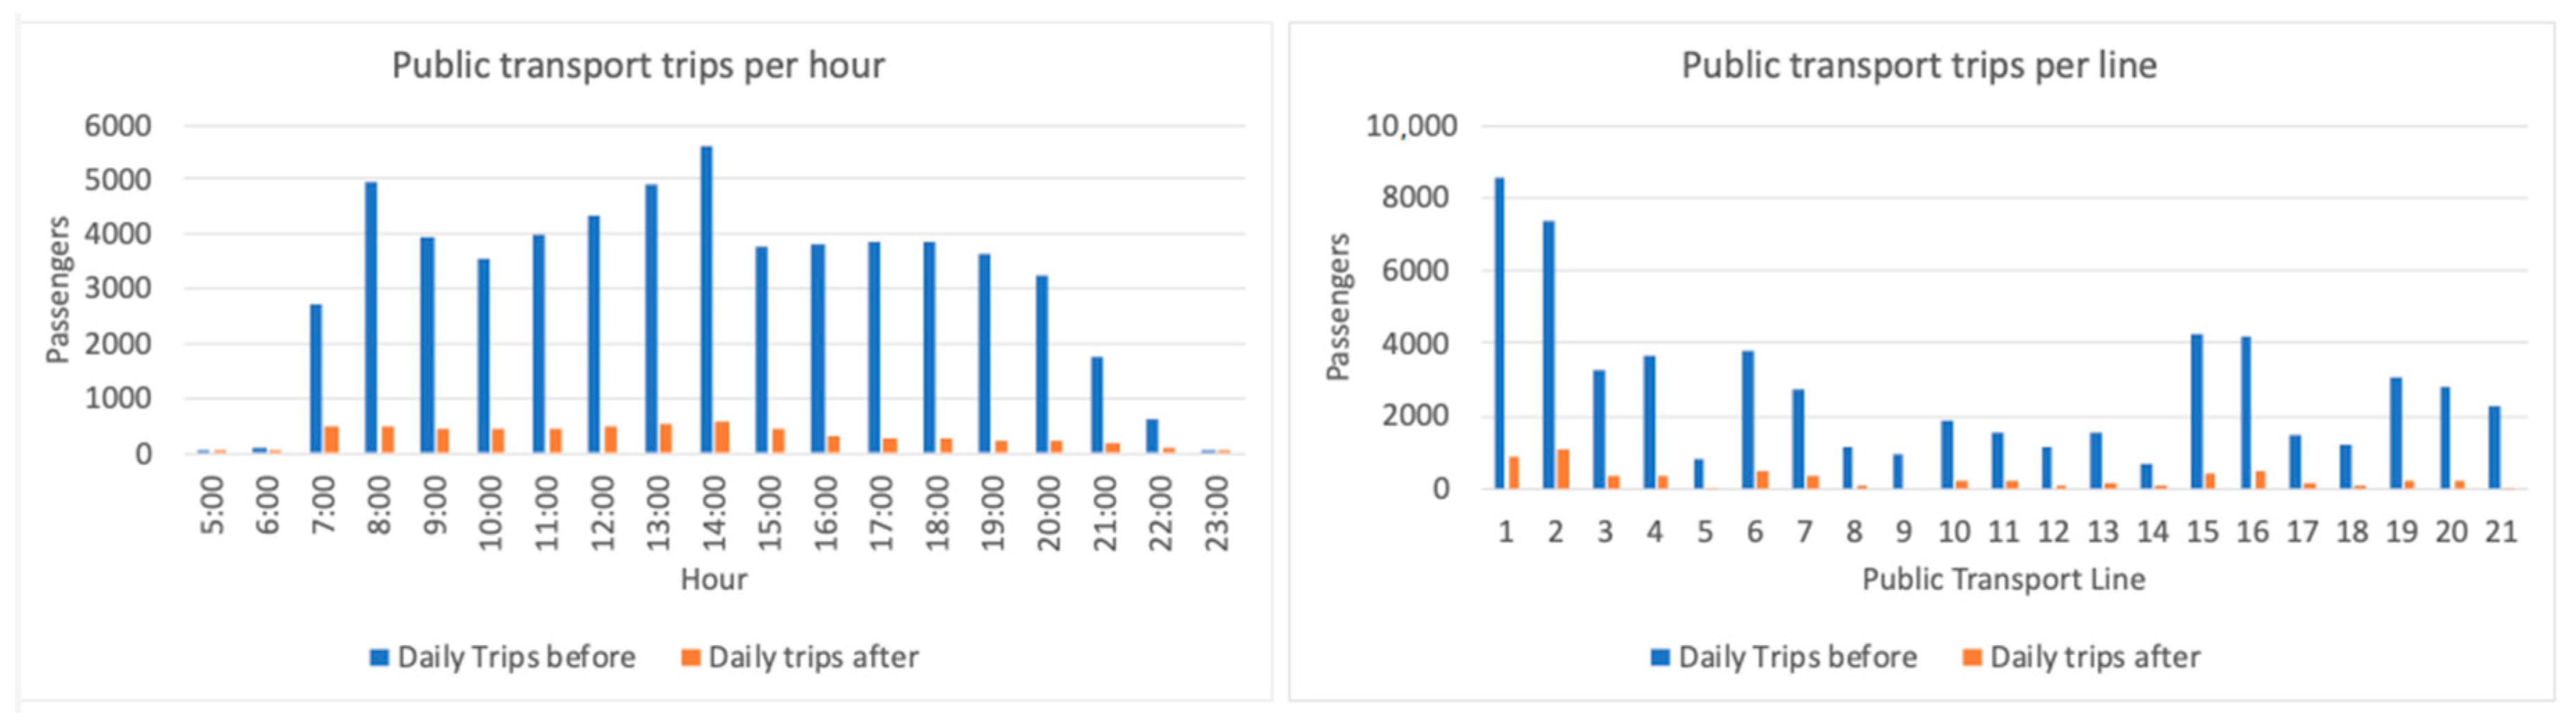
The drop in mobility was much steeper for the city’s public transport system. The dramatic fall can be seen in (
Figure 7 left), with an average of over 90%, the morning peak disappearing, and the mid-day peak being slightly maintained. As happened with general traffic, a 35% decrease in users appears in the afternoon period compared with the numbers registered in the morning. If the data is analyzed by bus line (
Figure 7 right), lines 1 and 2 carry the most passenger loads, and their demand dropped by more than an average of 85%. The lines servicing the university campus (among other zones) suffered an average reduction of 92% and those serving the city periphery reduced by 88%.
The much lower demand, together with the reduction in general traffic and a lack of congestion, has meant the journey times of the lines have been notably reduced. As an example,
Figure 8 shows the journey times by time of day for two lines of high and low demand (lines 1 and 6c2 respectively). Both cases registered 30% reductions in cycle times.
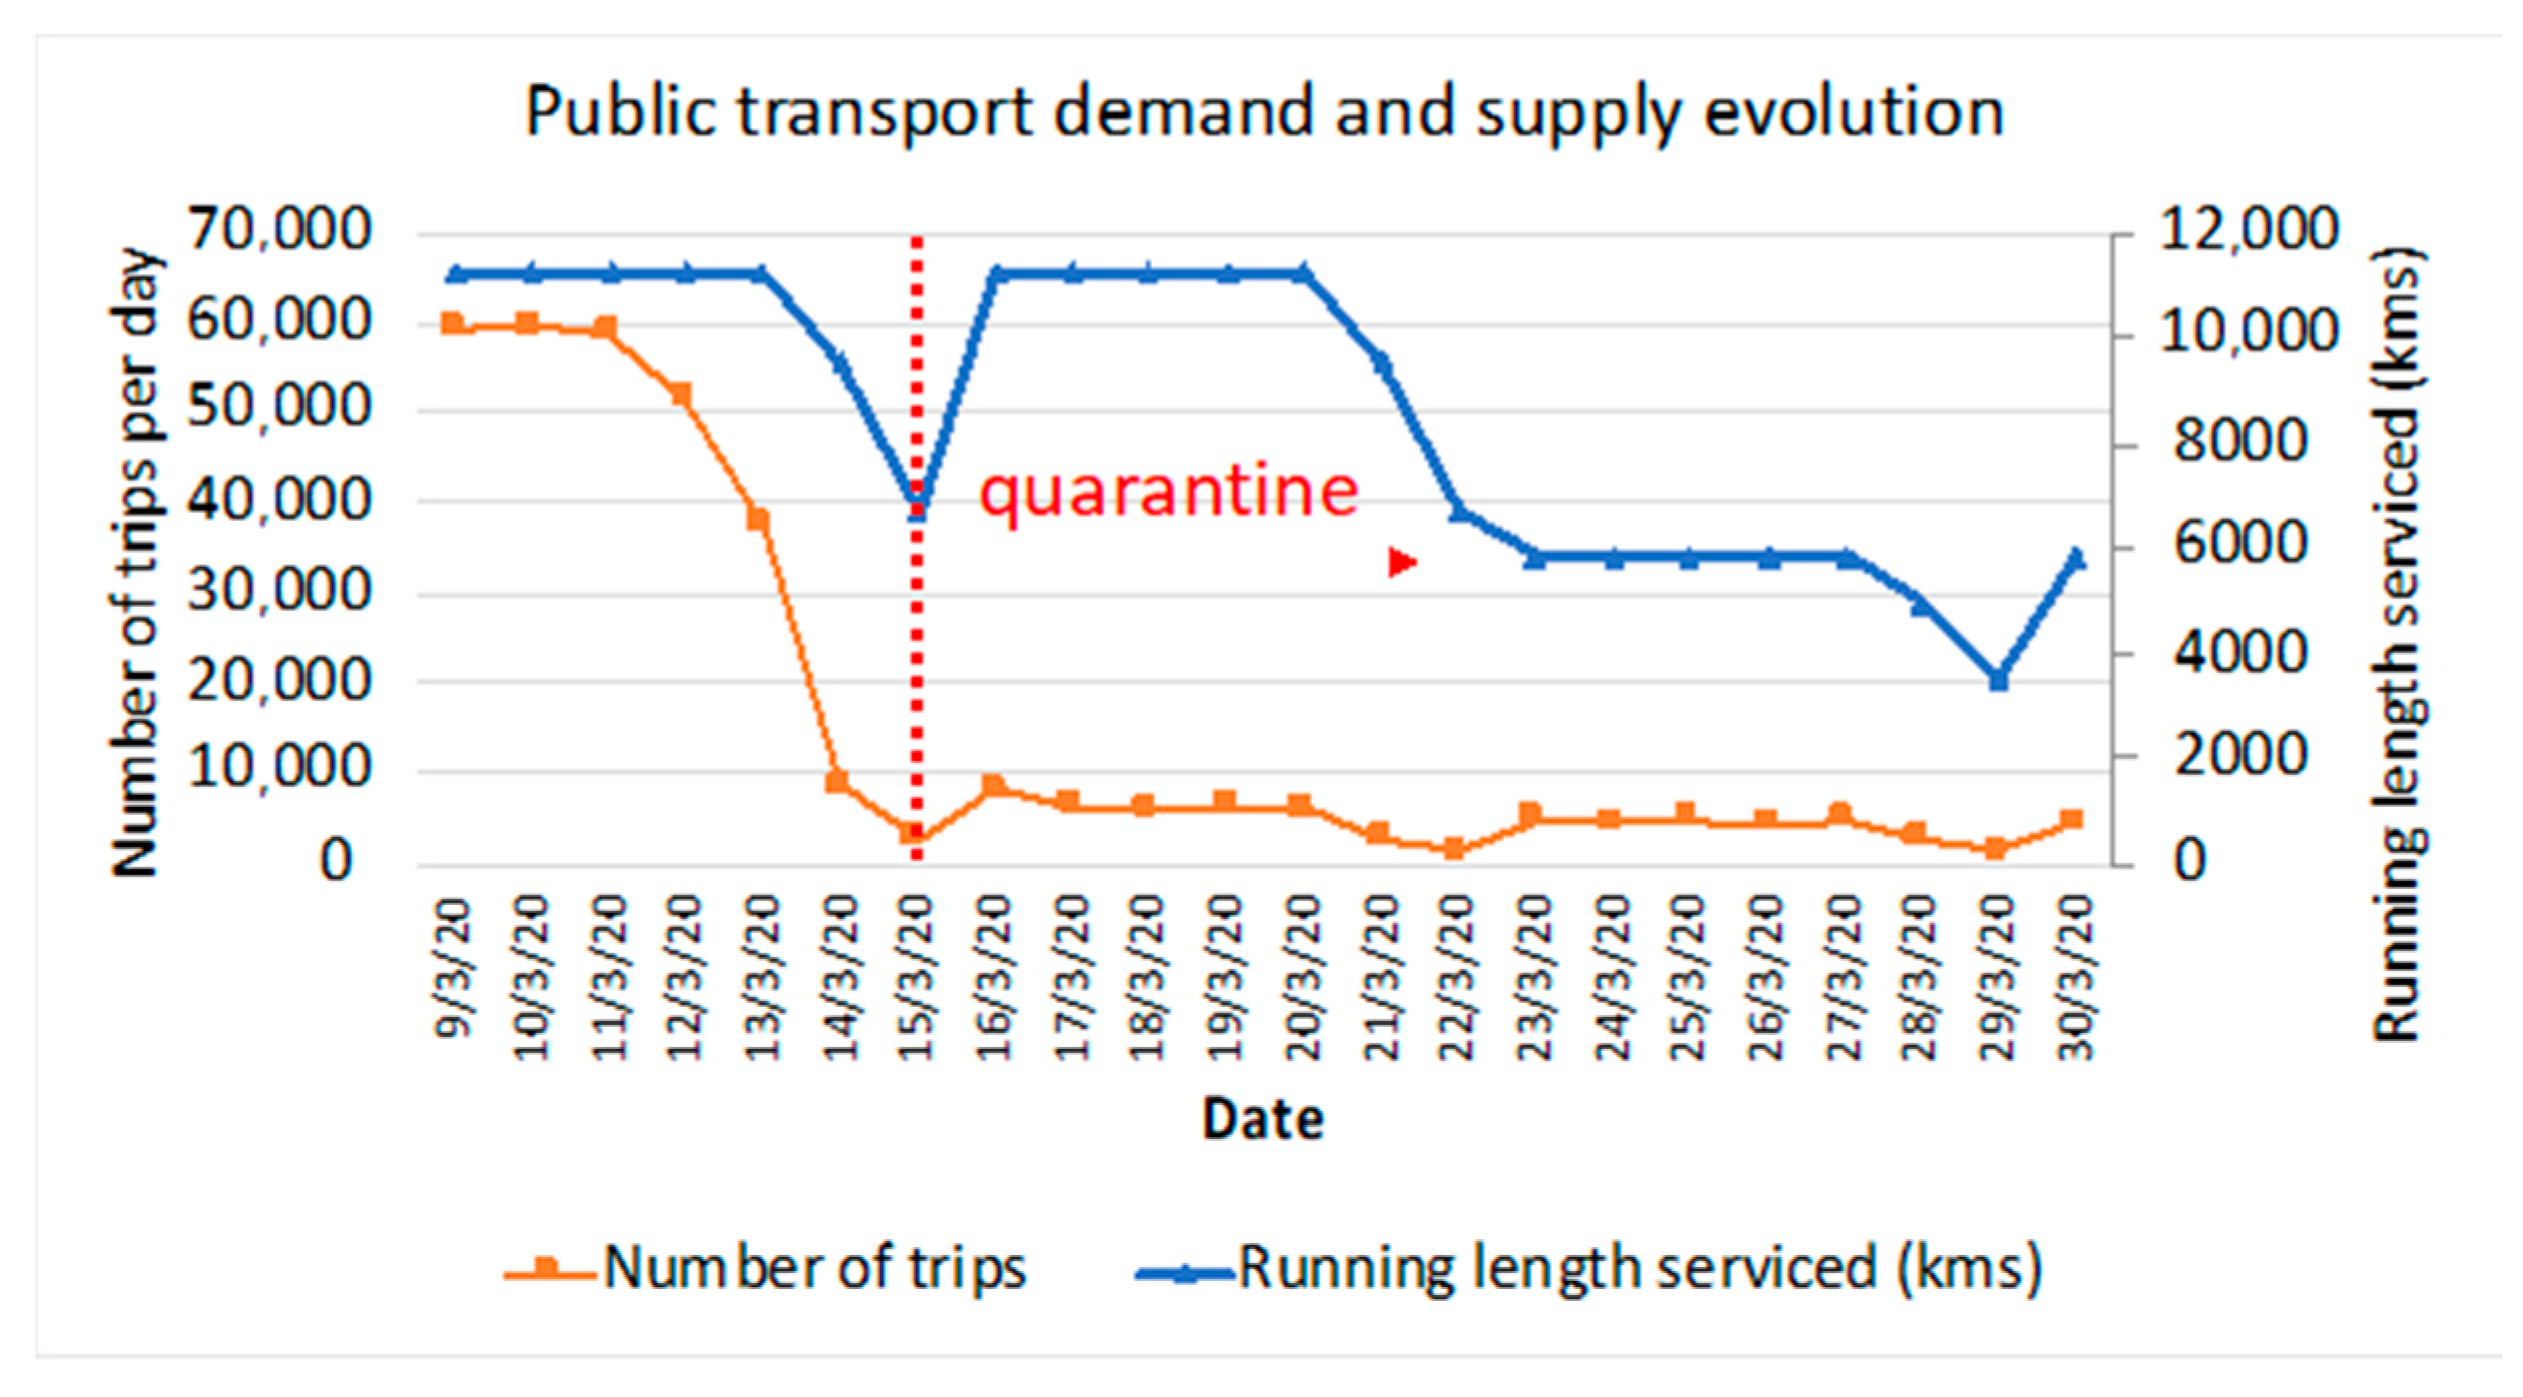
Figure 9 shows the evolution of the daily demand and the total running length per day as a performance indicator of the service provided. As can be seen, the demand started dropping slightly at the end of the week before quarantine. However, during the first working day of the lockdown period, the number of users fell to levels that were even lower than those reported on a normal Saturday. These results for the public transport system are in line with those already reported in
Section 1 and, as can be deduced, they represent a strong blow to the budgetary balance of the system, since the operational cost is now more disproportionate to the new scenario of reduced demand. The public transport operator kept the usual working day services during one week, but the service had to be adapted to readjust the line intervals to this new demand (
Figure 9).
A decision support tool is needed to optimize the design of the new services. Applying the social optimum results of the frequency optimization model for this same network [
40,
41] provides a rapid response for the operator to be able to readapt the service, as well as taking into account the new cycle times recorded.
Table 1 shows a precise comparison between the situation prior to confinement with the calculated optimal intervals and the current situation of the service during confinement, where a great similarity can be seen.
These operational adjustments, assuming an operating cost of 3.5 euros/km (it is assumed that there are no fleet or personnel savings, since the situation is provisional), show significant savings of close to 50%, which allow the economic impact of the lower demand to be reduced, while maintaining the social optimum in the system, as shown in
Table 2.
Because of the type of restrictions imposed, fewer journeys were made using public transport for reasons of work in favor of using the private car. The same has happened with pedestrian mobility during the morning rush hour, which has been drastically reduced. The only mobility now occurring on foot has been to walk to local food shops and to buy other essential products. Due to the impossibility of performing specific counts in person, the authors were able to access and process the images from traffic control cameras, many of which are located in the streets with the highest pedestrian flows in the city. The same approach has been followed to quantify the trips made by bikes/scooters. In this sense, it is important to notice that the public bike system was closed during the quarantine, and there are no private operators of any sharing mobility.
The results obtained revealed a similar reduction in pedestrian flows, although to a lesser degree than was found with the public transport service.
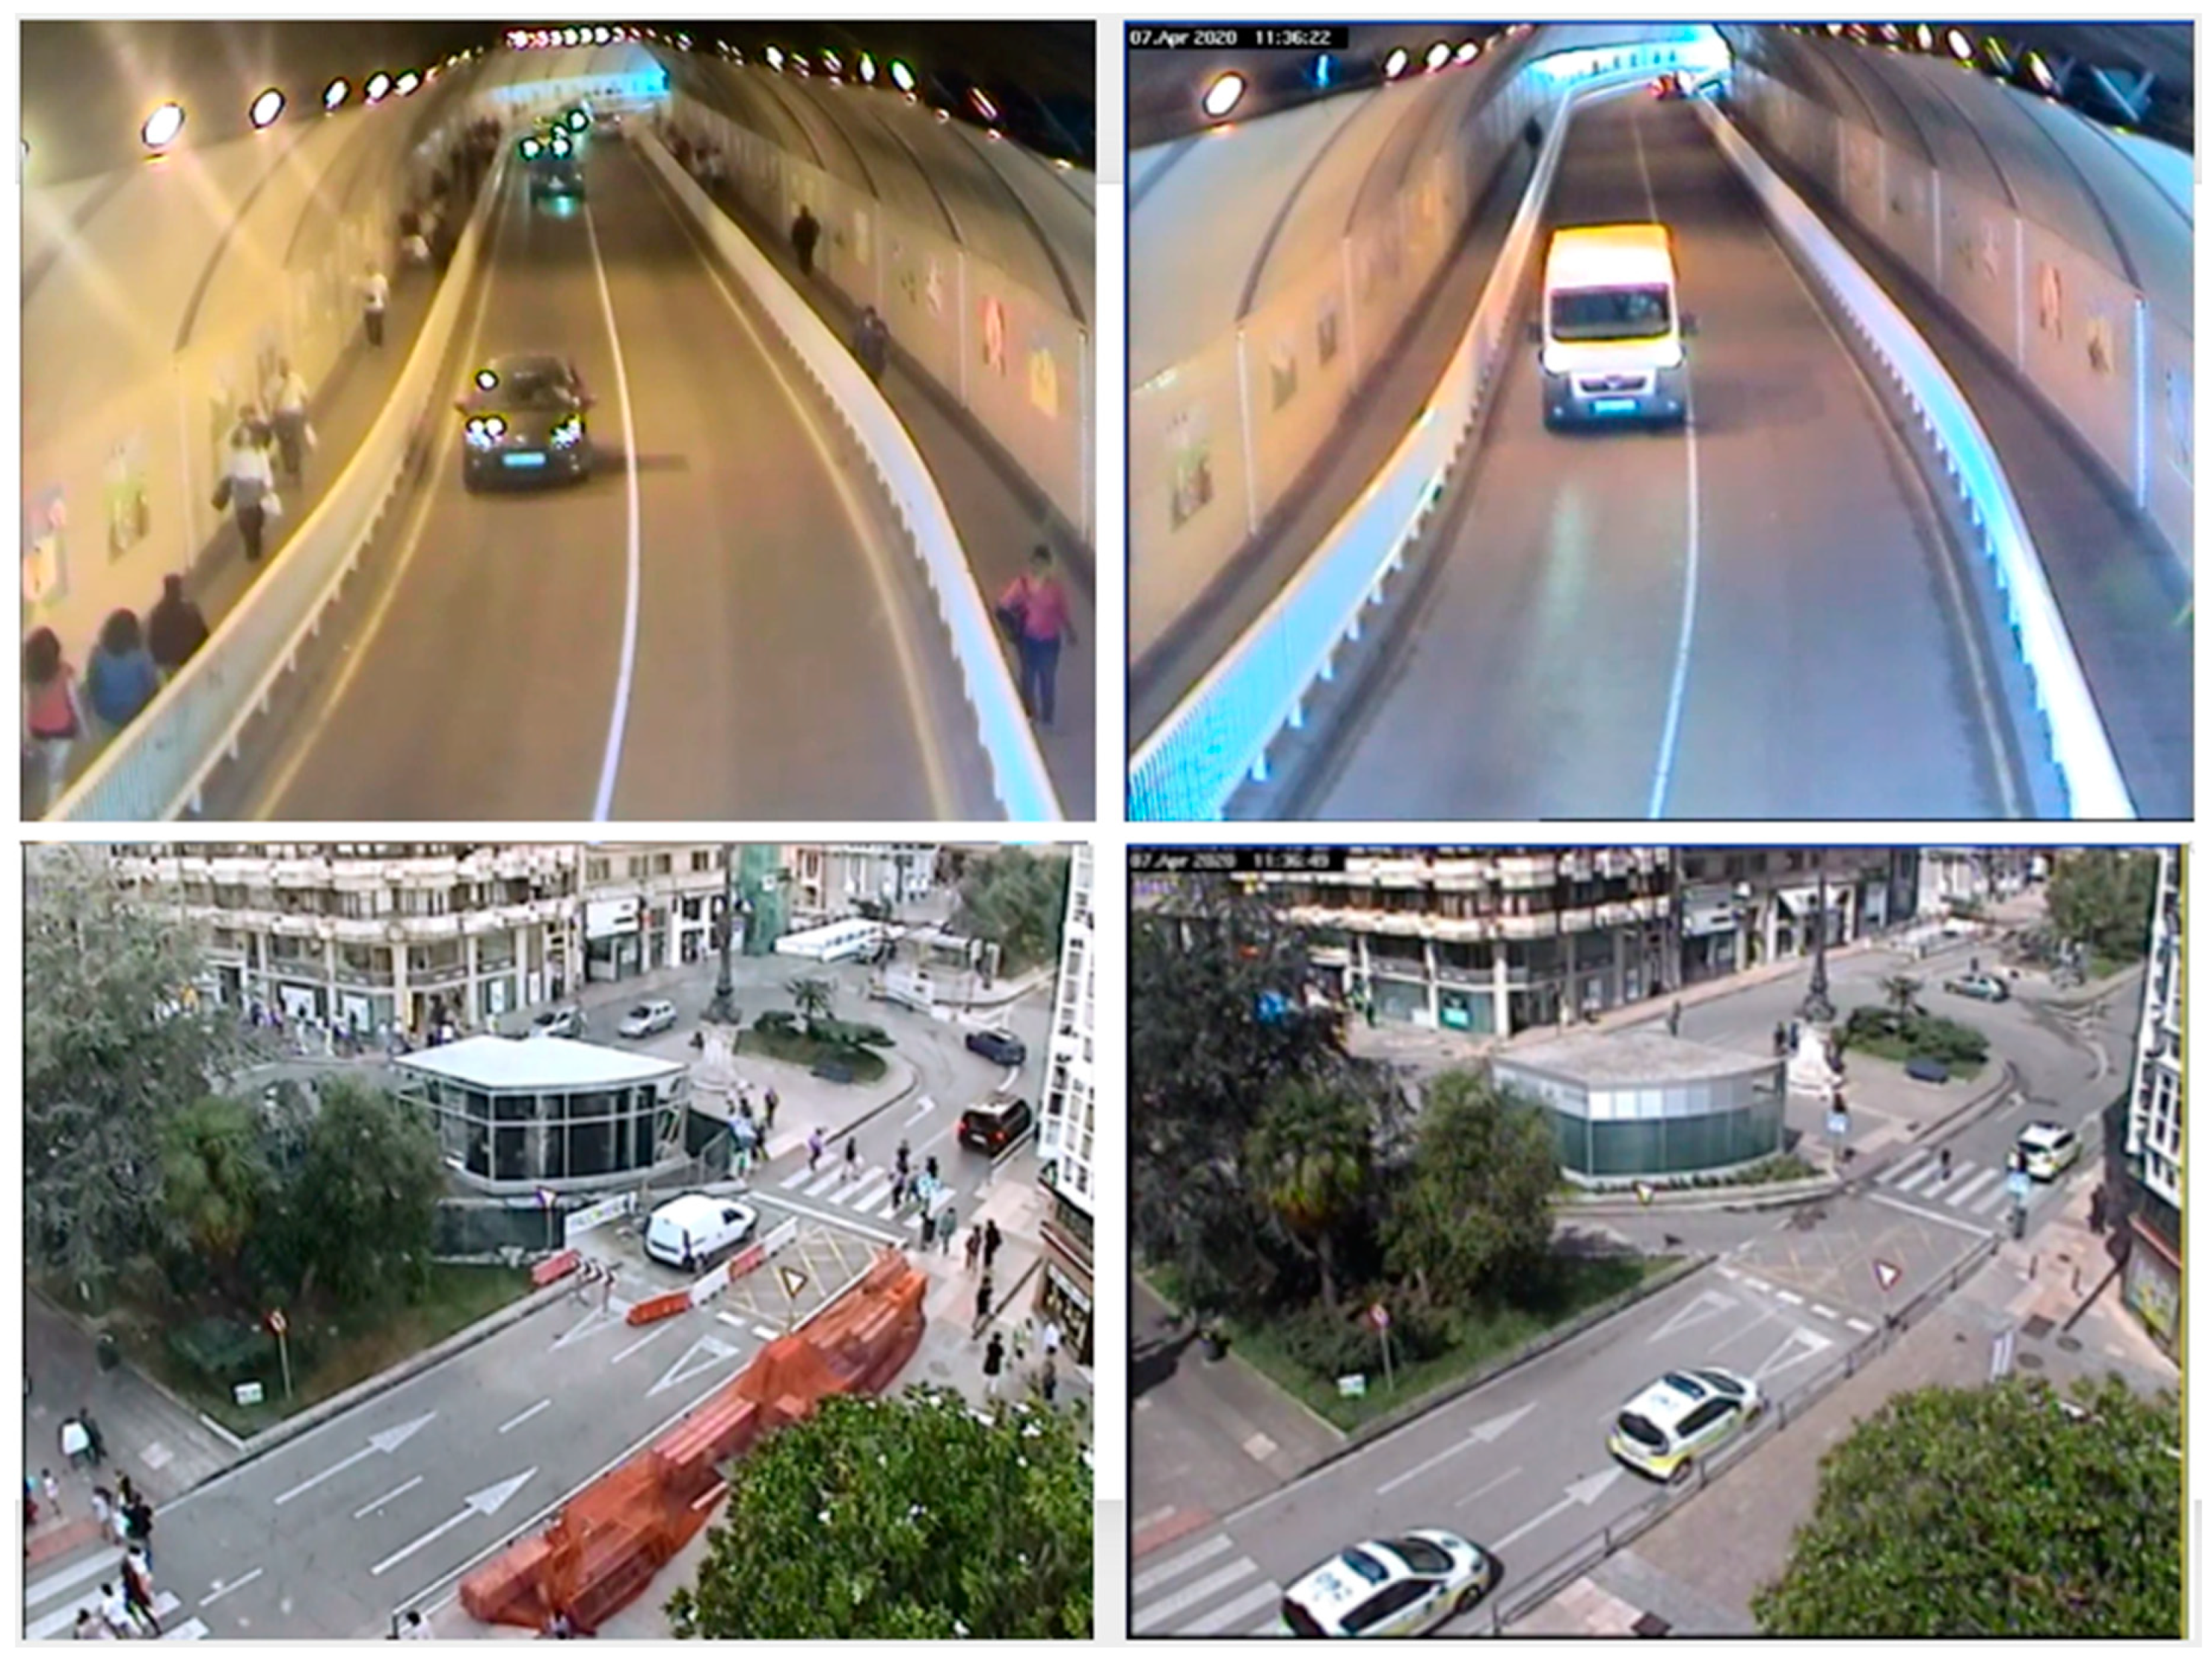
Figure 10 shows two examples of the comparison between the same location at the same time of day between vehicle and pedestrian flows before (left) and after (right) the restrictions were imposed. The upper example compares an access tunnel to a central intermodal area, and the lower example compares one of the main pedestrian locations in the city (Numancia square).
The differences are revealing about the resulting drop in mobility. To estimate the daily trip profile for pedestrians and bikes, the authors correlated the pedestrian and bikes flows obtained from 9 different camera recordings with the existing pedestrian and bikes flow assignments from the mobility model that the University of Cantabria had calibrated for the city and the profile obtained from the latest Origin-Destination (O-D) survey, updated with manual counts up to 2018. The same correlation has been applied using the new flows obtained from the images taken during the quarantine period, once again re-estimating the trip matrices and finding the daily travel profile.
The resulting reduction coincided with that observed for general traffic and public transport: The morning and evening peaks disappeared drastically with the appearance of a mid-day peak period between 11:00 and 13:00 when many people leave their homes to do basic shopping. Mobility during the afternoon period falls by approximately 55% compared with the morning, where for a normal day the drop is slightly lower than was found for motorized vehicles, not reaching 70%.
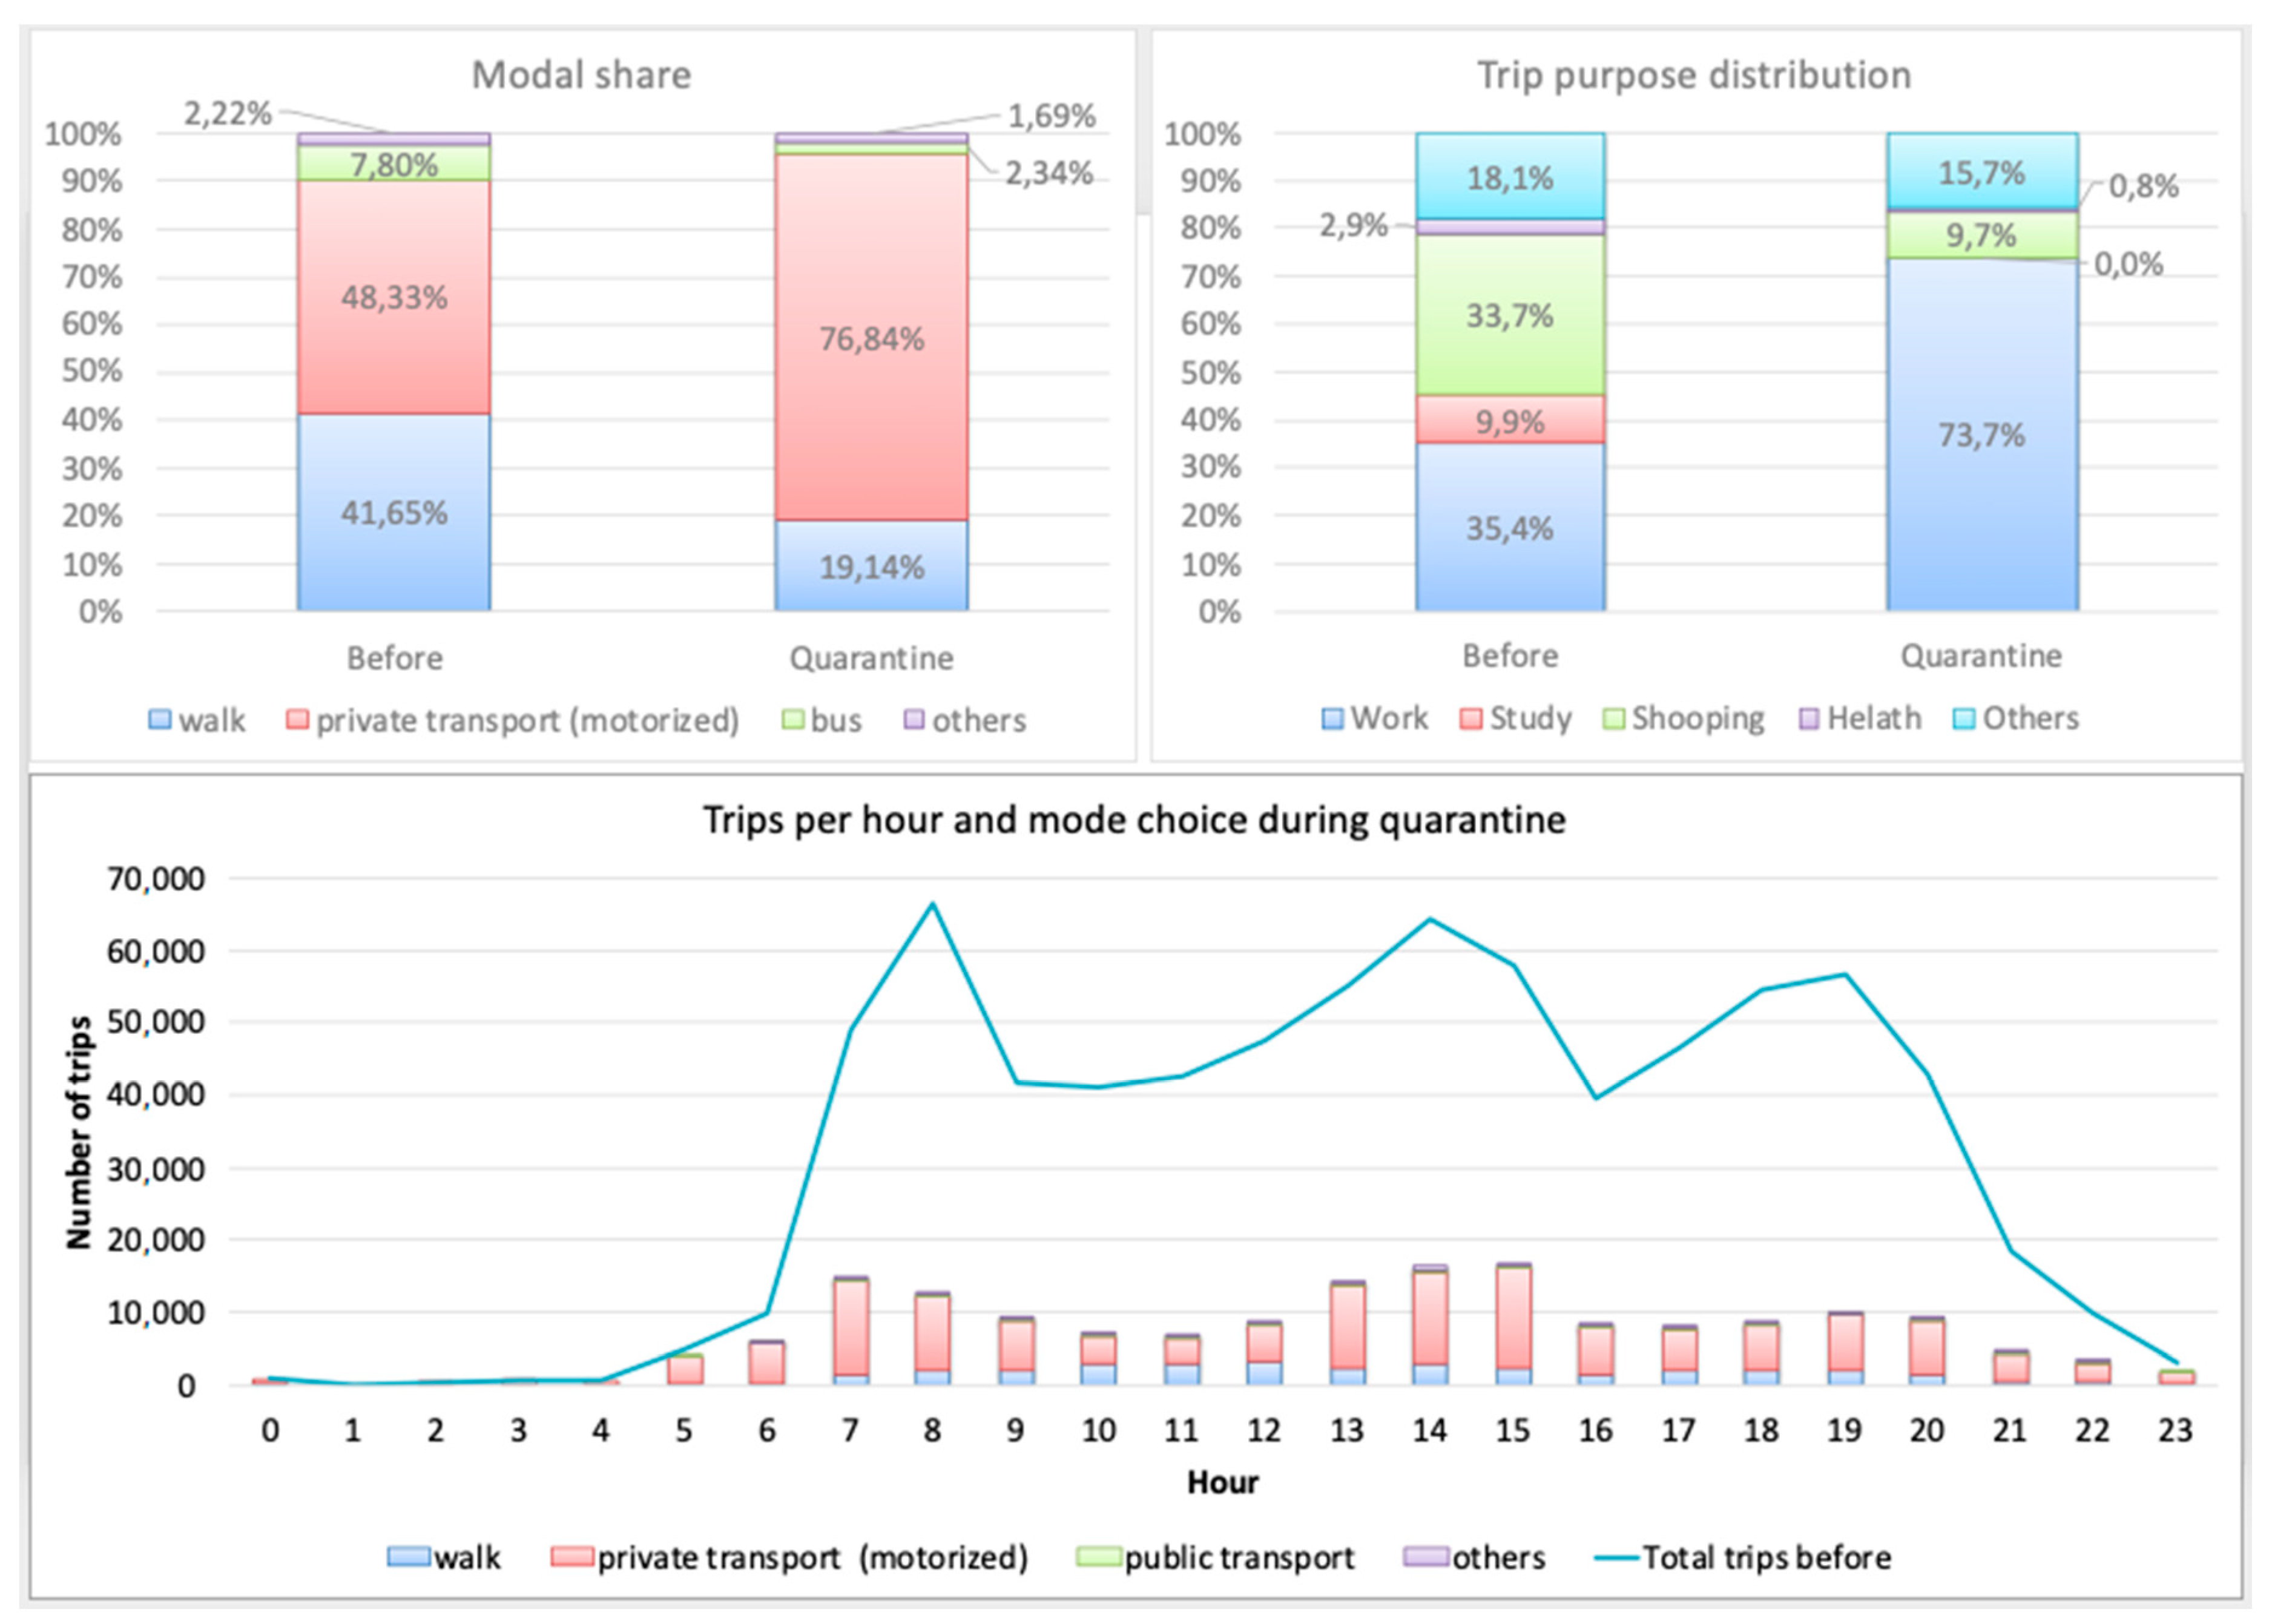
All the updated information was introduced into the city mobility model, the O-D matrices were re-estimated, and the data was expanded to include night time. This process provides the new overall modal distribution for the entire day and for separate periods during the day as well as the trip profiles shown in
Figure 11. As can be seen, the new modal distribution changes significantly, as car journeys change from 48% to 77% (it is important to clarify that the number of total car journeys is much lower during the quarantine), and public transport from 8% to 2%. Pedestrian journeys also show a significant drop in their share from 42% to 19%. It was estimated that overall mobility has fallen by 76%, with variations throughout the day, reaching falls of up to 85% at certain times. Car travel fell by 68% (in some periods by up to 85%) and bus travel fell by 93%. These results are consistent with the data provided by Moovit [
23] and the Spanish Ministry of Mobility [
11].
Figure 3 shows that the proportion of trips using bicycles or scooters (labeled as “others”) was very low before the quarantine. As happened with other modes of transport, overall mobility using these means of transport also decreased. However, the resulting proportional reduction was lower than the one observed for public transport or walking. This means that most people continued cycling (or using scooters) during the quarantine, which is consistent with the results found by some bike sharing companies [
17]. Furthermore, if the origins and destinations of the estimated matrices are now combined with the information provided by Google in their regional mobility report [
15], the new reasons for journey during the quarantine period can then be inferred. Logically, the journeys made for reasons of education disappear; those made for work are clearly in the majority, moving from 35% before quarantine to 74% (over the whole day). The remaining journeys are explained by the requirement to obtain basic products and the purchase of other available products.
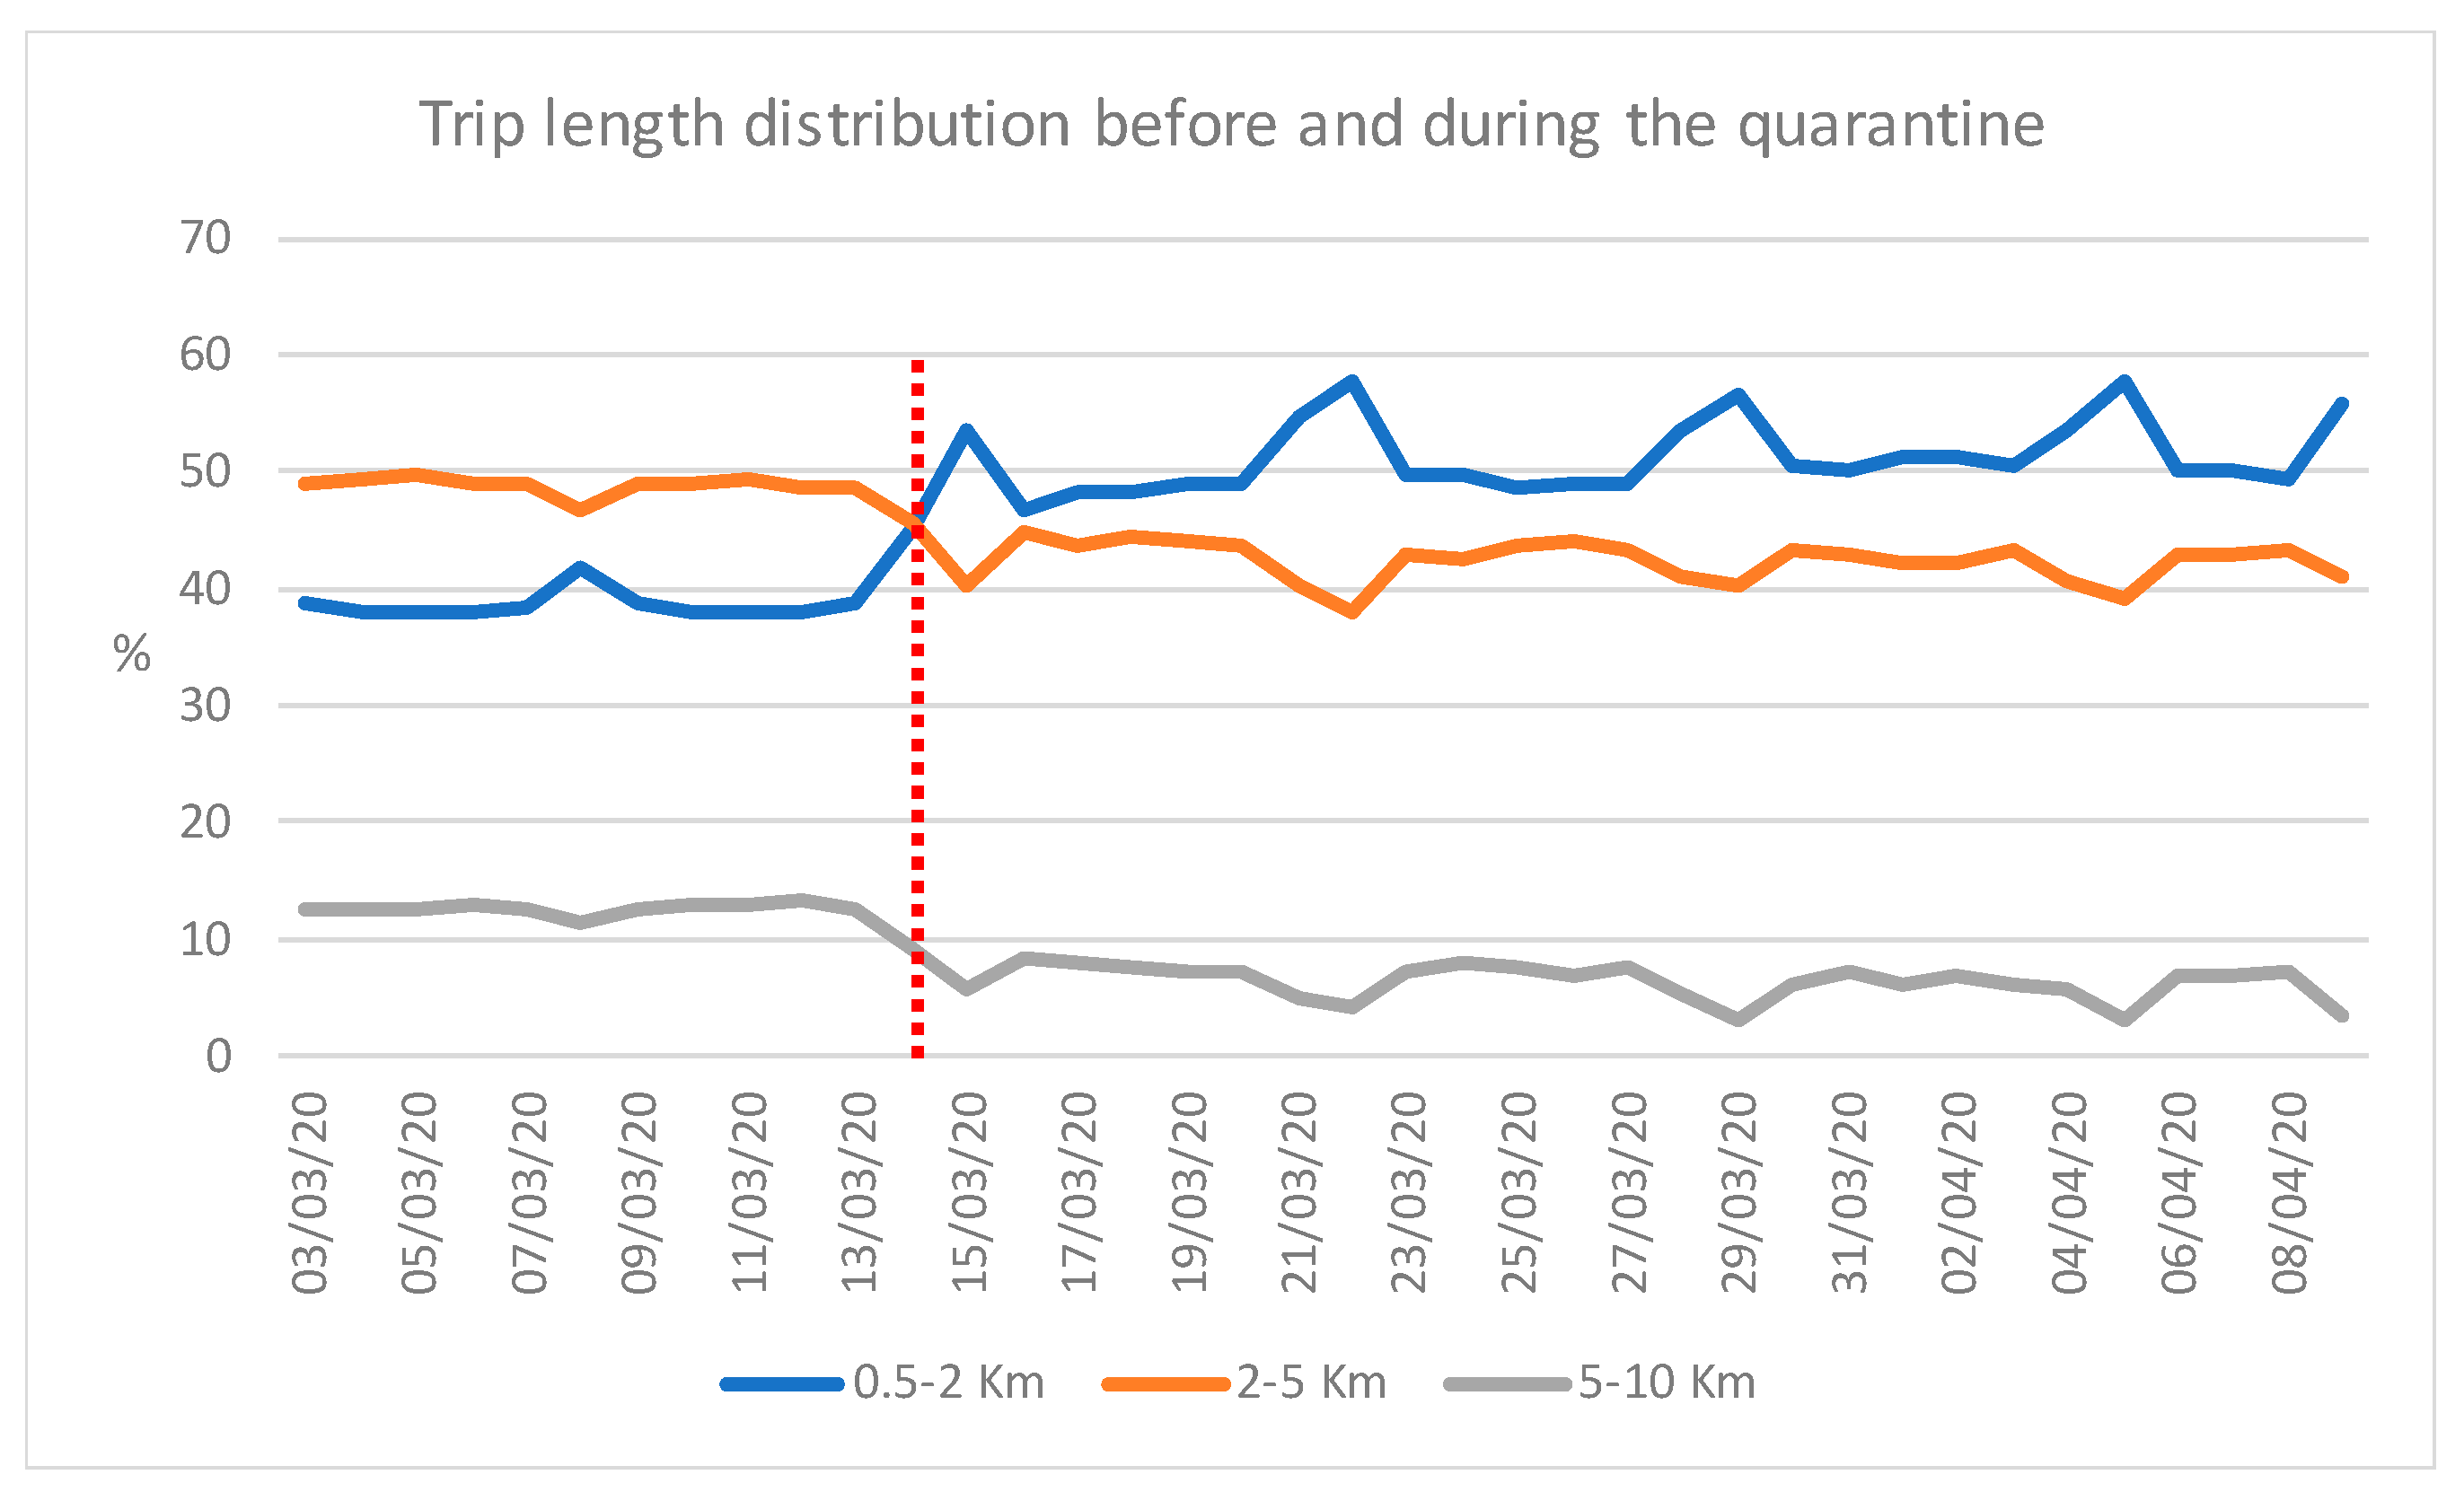
The lockdown measures can also cause changes to proximity mobility during the SARS-CoV-2 pandemic. This can be seen in changes in the length of the trips being made by citizens (see
Figure 12) as reported by the Spanish Ministry of Transport based on mobile phone data [
11]. The lockdown has caused the shortest trips (0.5–2 km) to clearly gain weight over long-distance trips (more than 5 km).
Figure 12 also shows how the weight of shorter trips increases at weekends, because travelling for work (mid-long distance mainly) decreases and most of these trips are made for buying basic products.
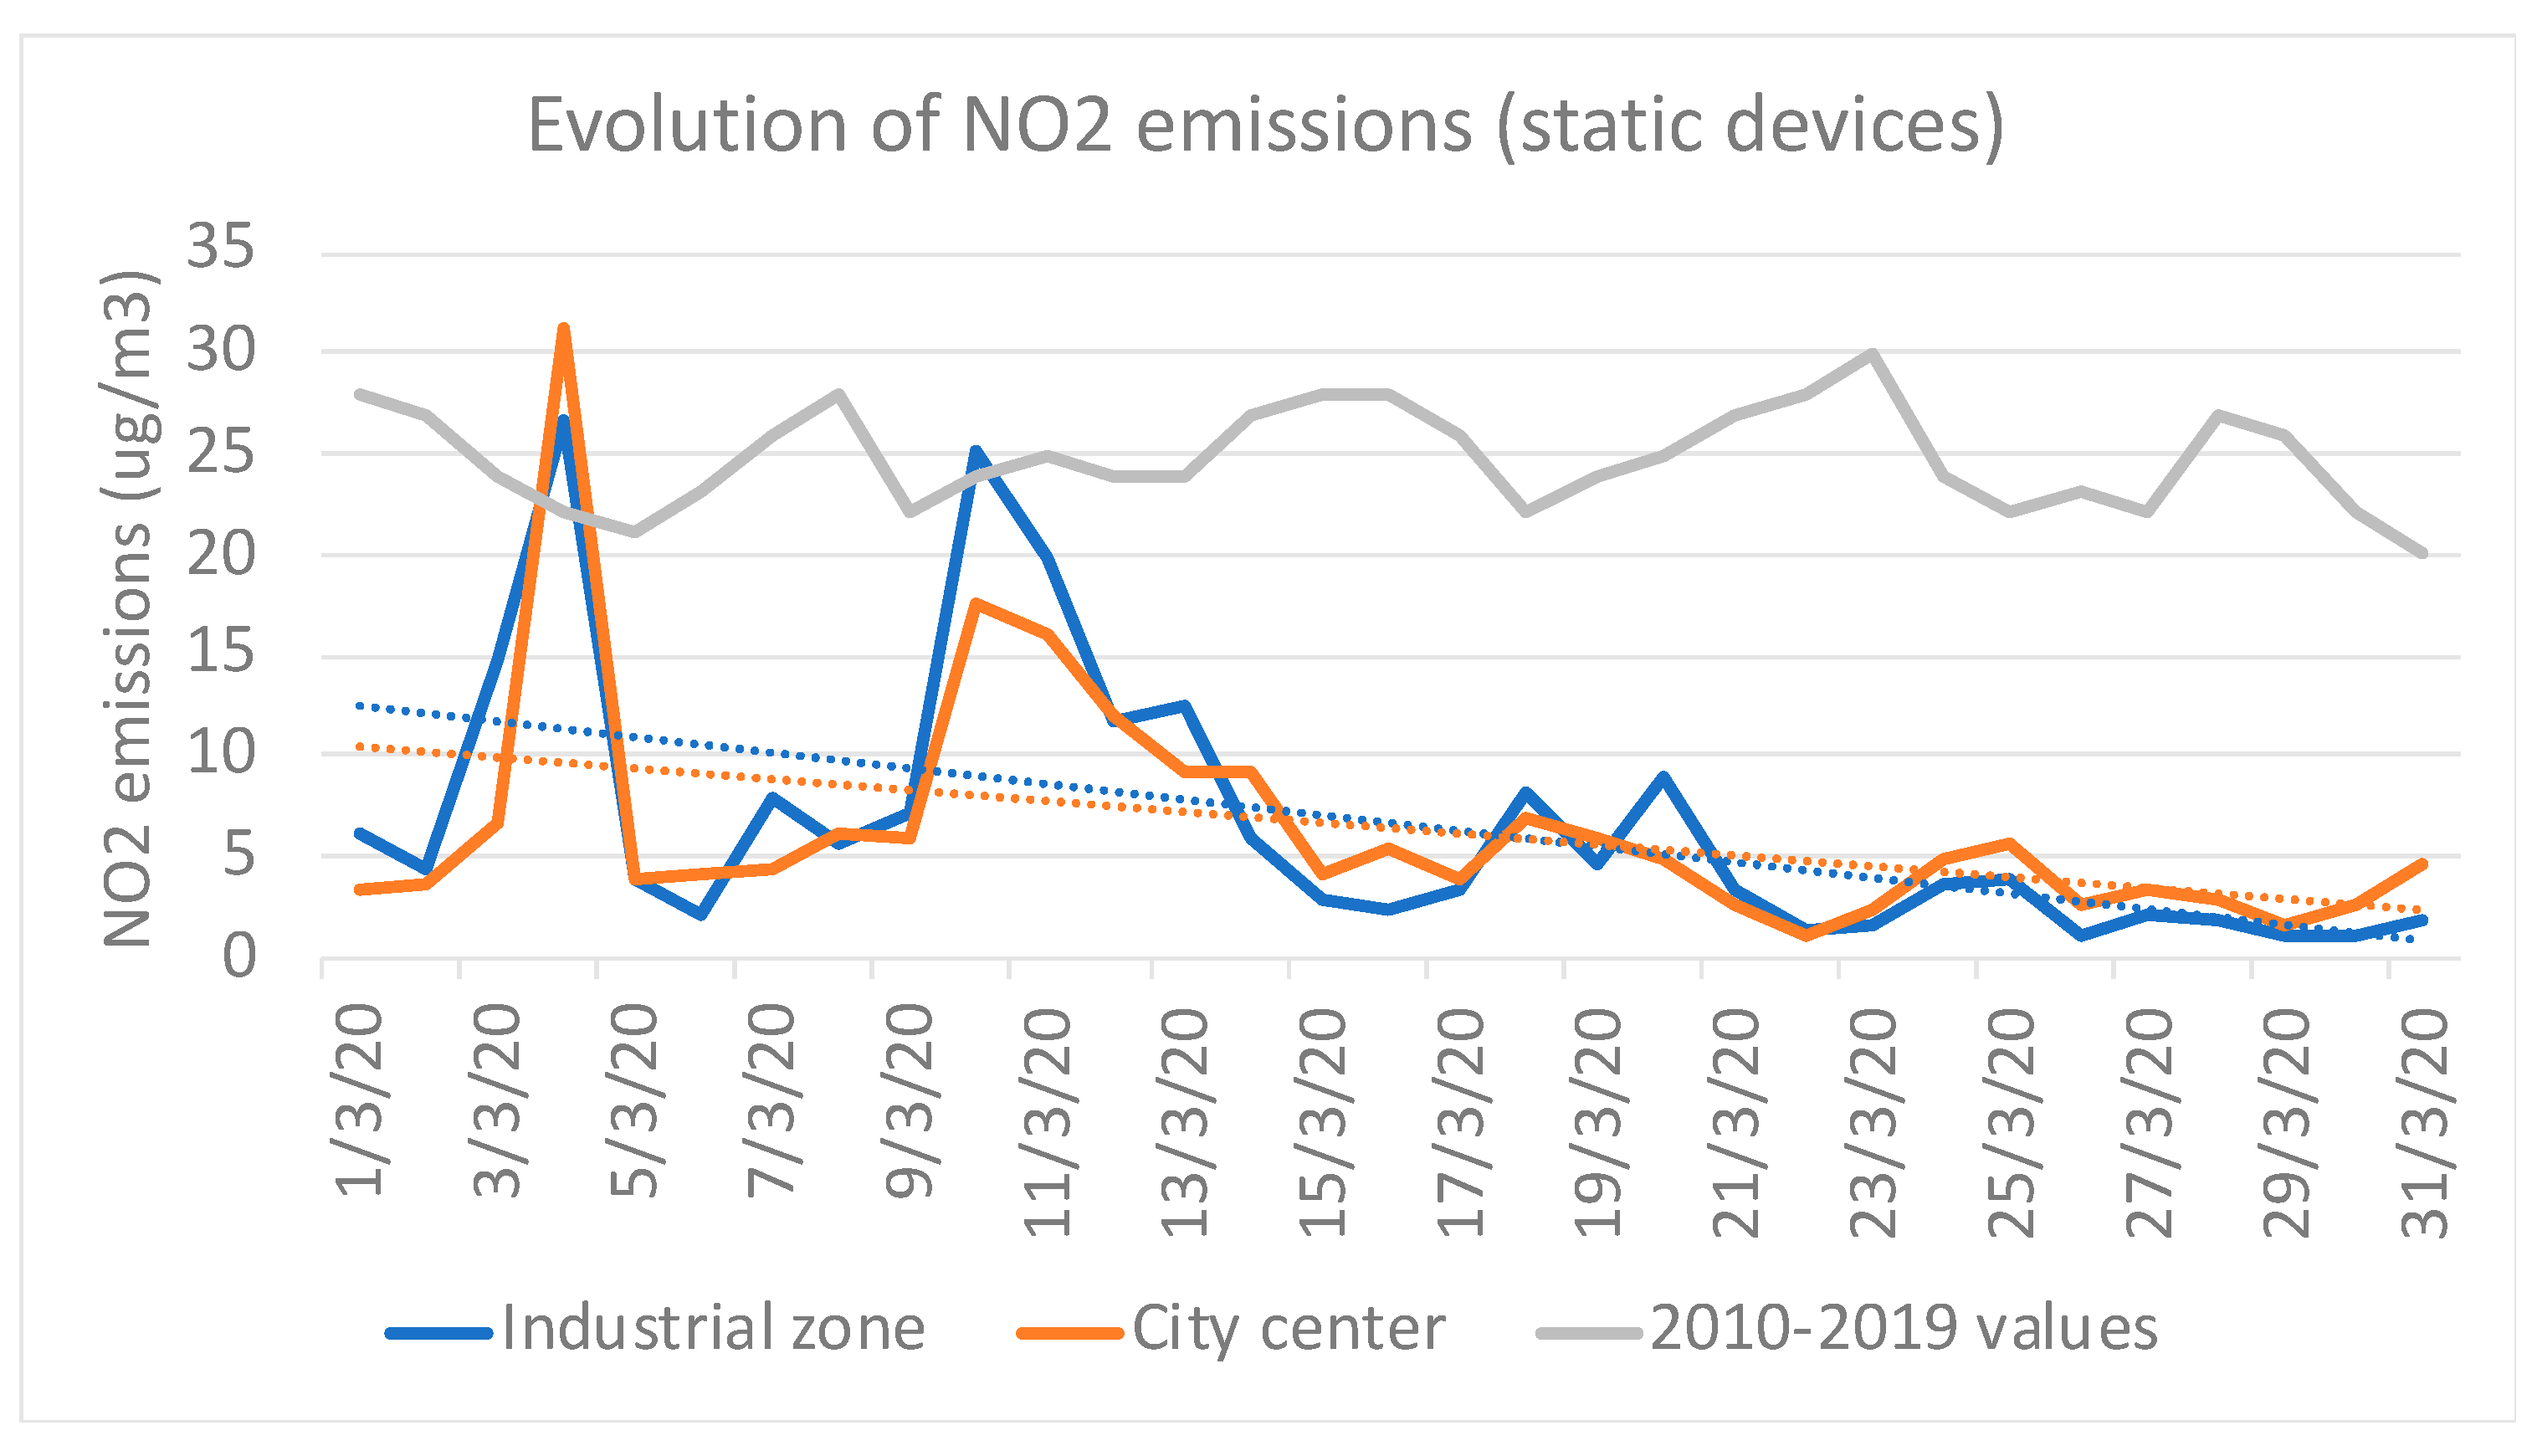
As explained beforehand, this strong decline in motorized mobility has resulted in a reduction in externalities such as emissions. In terms of emissions, the analysis has been focused on NO
2, as it is the substance most directly related to urban traffic, as opposed to other pollutants coming from alternative sources such as PM
10 and PM
2.5 [
42,
43,
44]. The analysis of the NO
2 values from the static Department of the Environment stations located in the city center and in an industrial zone located in a nearby town shows how the normal peaks that used to be registered disappeared completely at the beginning of the quarantine, with reductions of over 50–60% compared with the average values measured in the period 2010–2019 (
Figure 13).
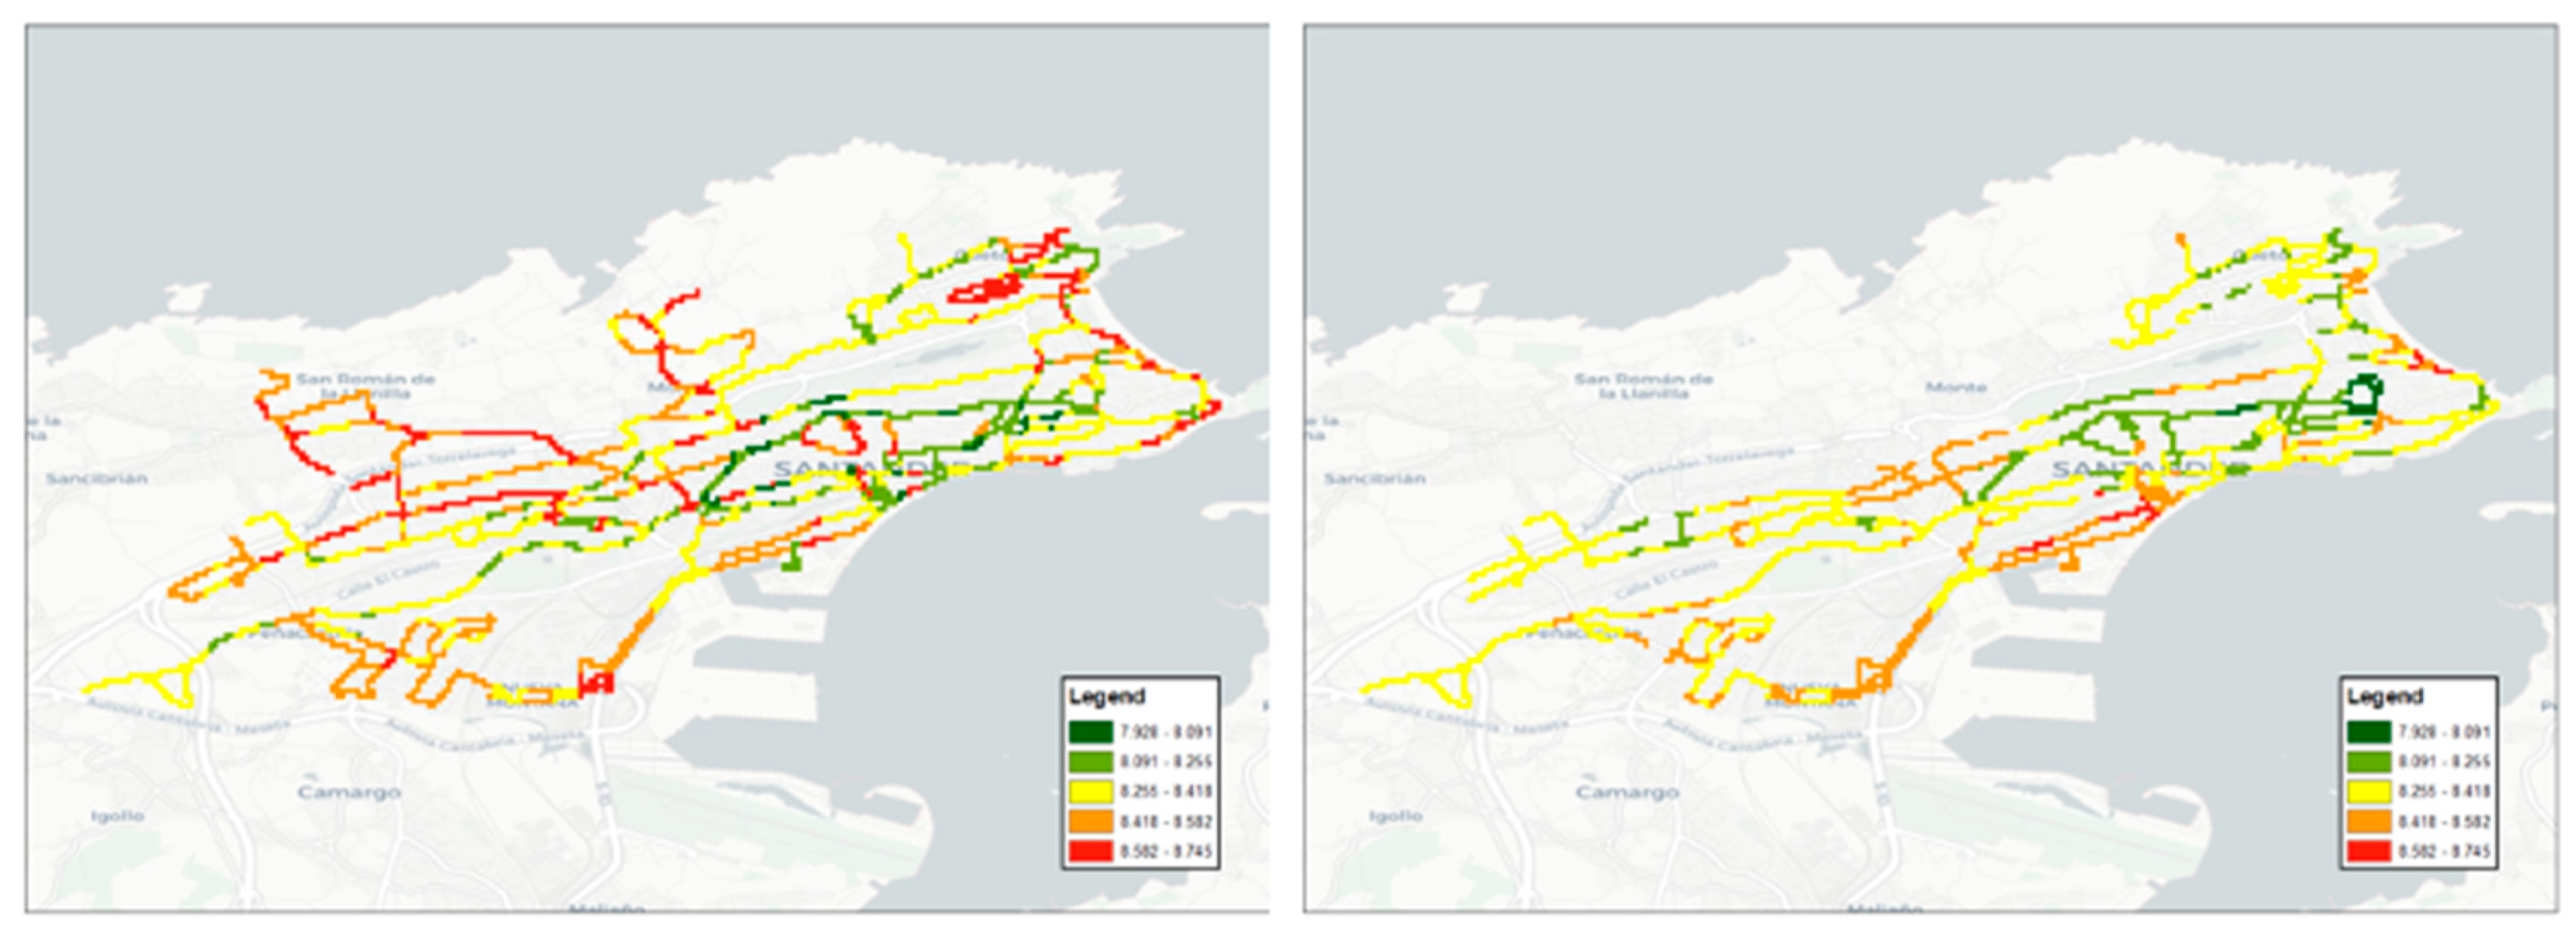
The values provided by the static stations can be complemented by data from the mobile sensors installed on the city buses. All the different NO
2 measurements were used in order to have more data available (
Figure 14) and all the data from the month of March has been aggregated. This has resulted in an overall reduction in NO
2 emissions throughout the city, but especially in the North, Central, and West zones, where a large number of work places, colleges, and university buildings are located. The absence of data from the northern zone is because the buses equipped with sensors were not running in that zone during the analyzed time period. The results obtained are consistent with those found in an independent report made by a Spanish ecologist organization [
42].
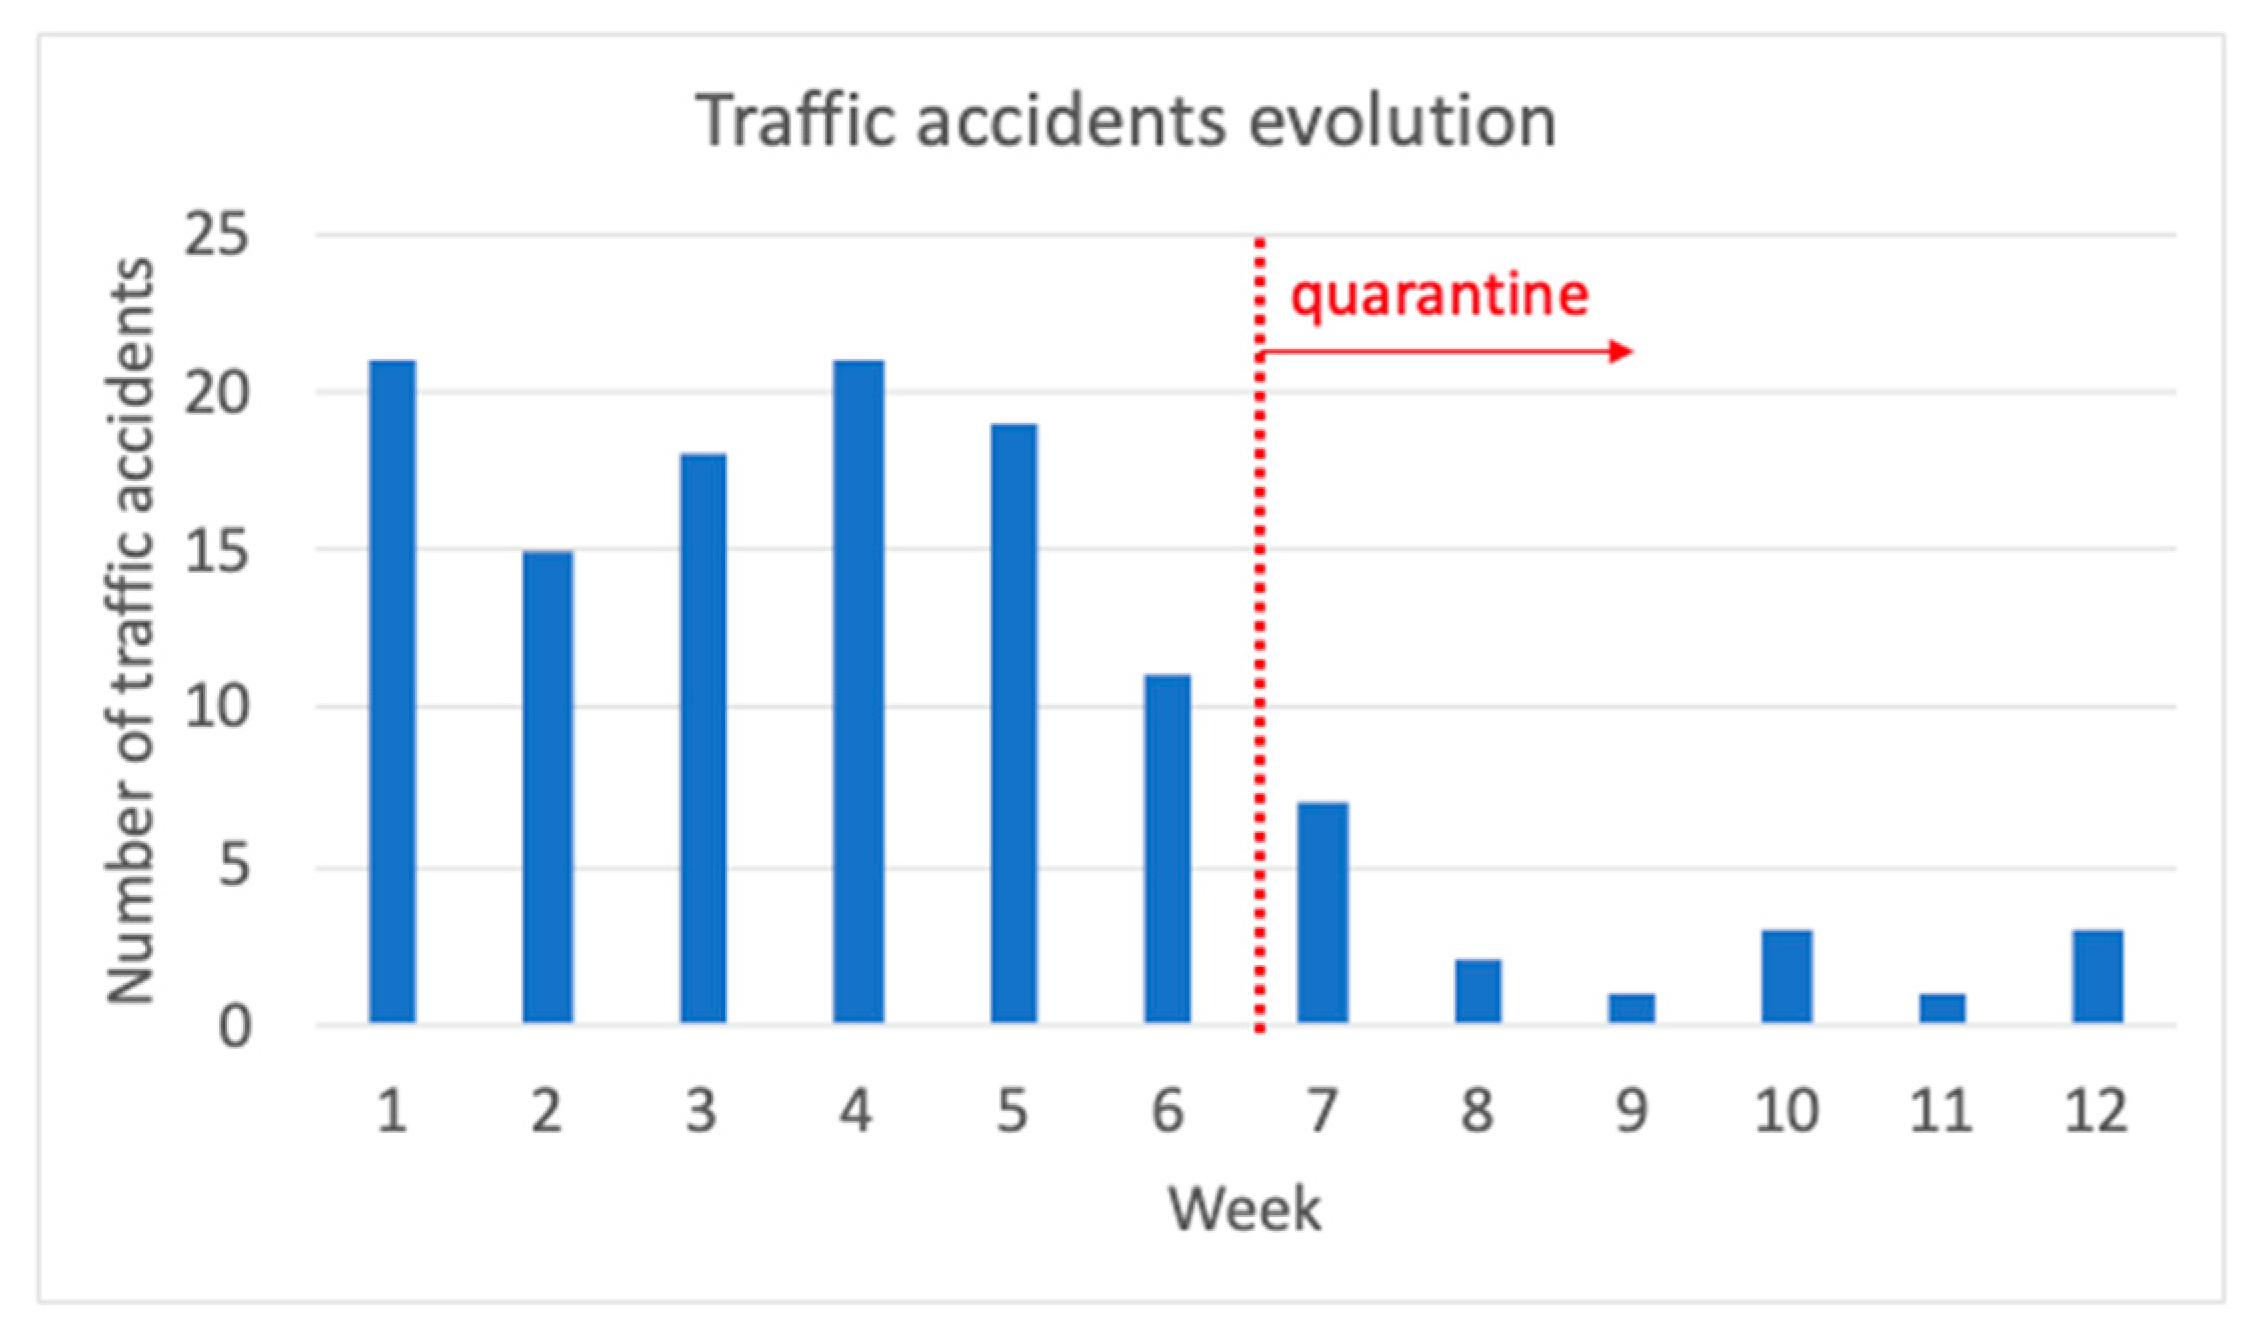
Finally, accident data reported by the local city police was analyzed. Data from approximately one and a half months before quarantine was compared with data produced during quarantine: From the start of February to the 14th of March, and from the 15th of March to the 23rd of April. The number of accidents in absolute terms has fallen from the start of quarantine (
Figure 15) from a total of 105 to 17 (−83.8%), from 17.5 accidents per week to 2.83. However, if this data is weighted to consider the average daily traffic intensity registered in the city, the fall is around 67%.
3. What Is Next?
Evidently, urban mobility, and Santander is no exception, has been put on hold during the quarantine period. The great unknown being faced by many cities is how the demand for transport and mobility will evolve during the following stages in the process (the recovery period).
Many cities are planning measures to coordinate the slow increase in mobility during the recovery period with the social distancing required to avoid the probability of new contagion and the return of the illness. It is a worry that the move towards sustainable mobility has been halted and we have returned to the ratios of motorized transport found over a decade ago. Considering the experience of China, the trend is to favor trips being made on foot or using individual means of sustainable transport such as bicycles or scooters [
17]. To support this change, investment has been made in providing the infrastructure required for these means of transport by removing lanes that were previously used for traffic and reducing city center speed limits to 30 km/h [
45,
46,
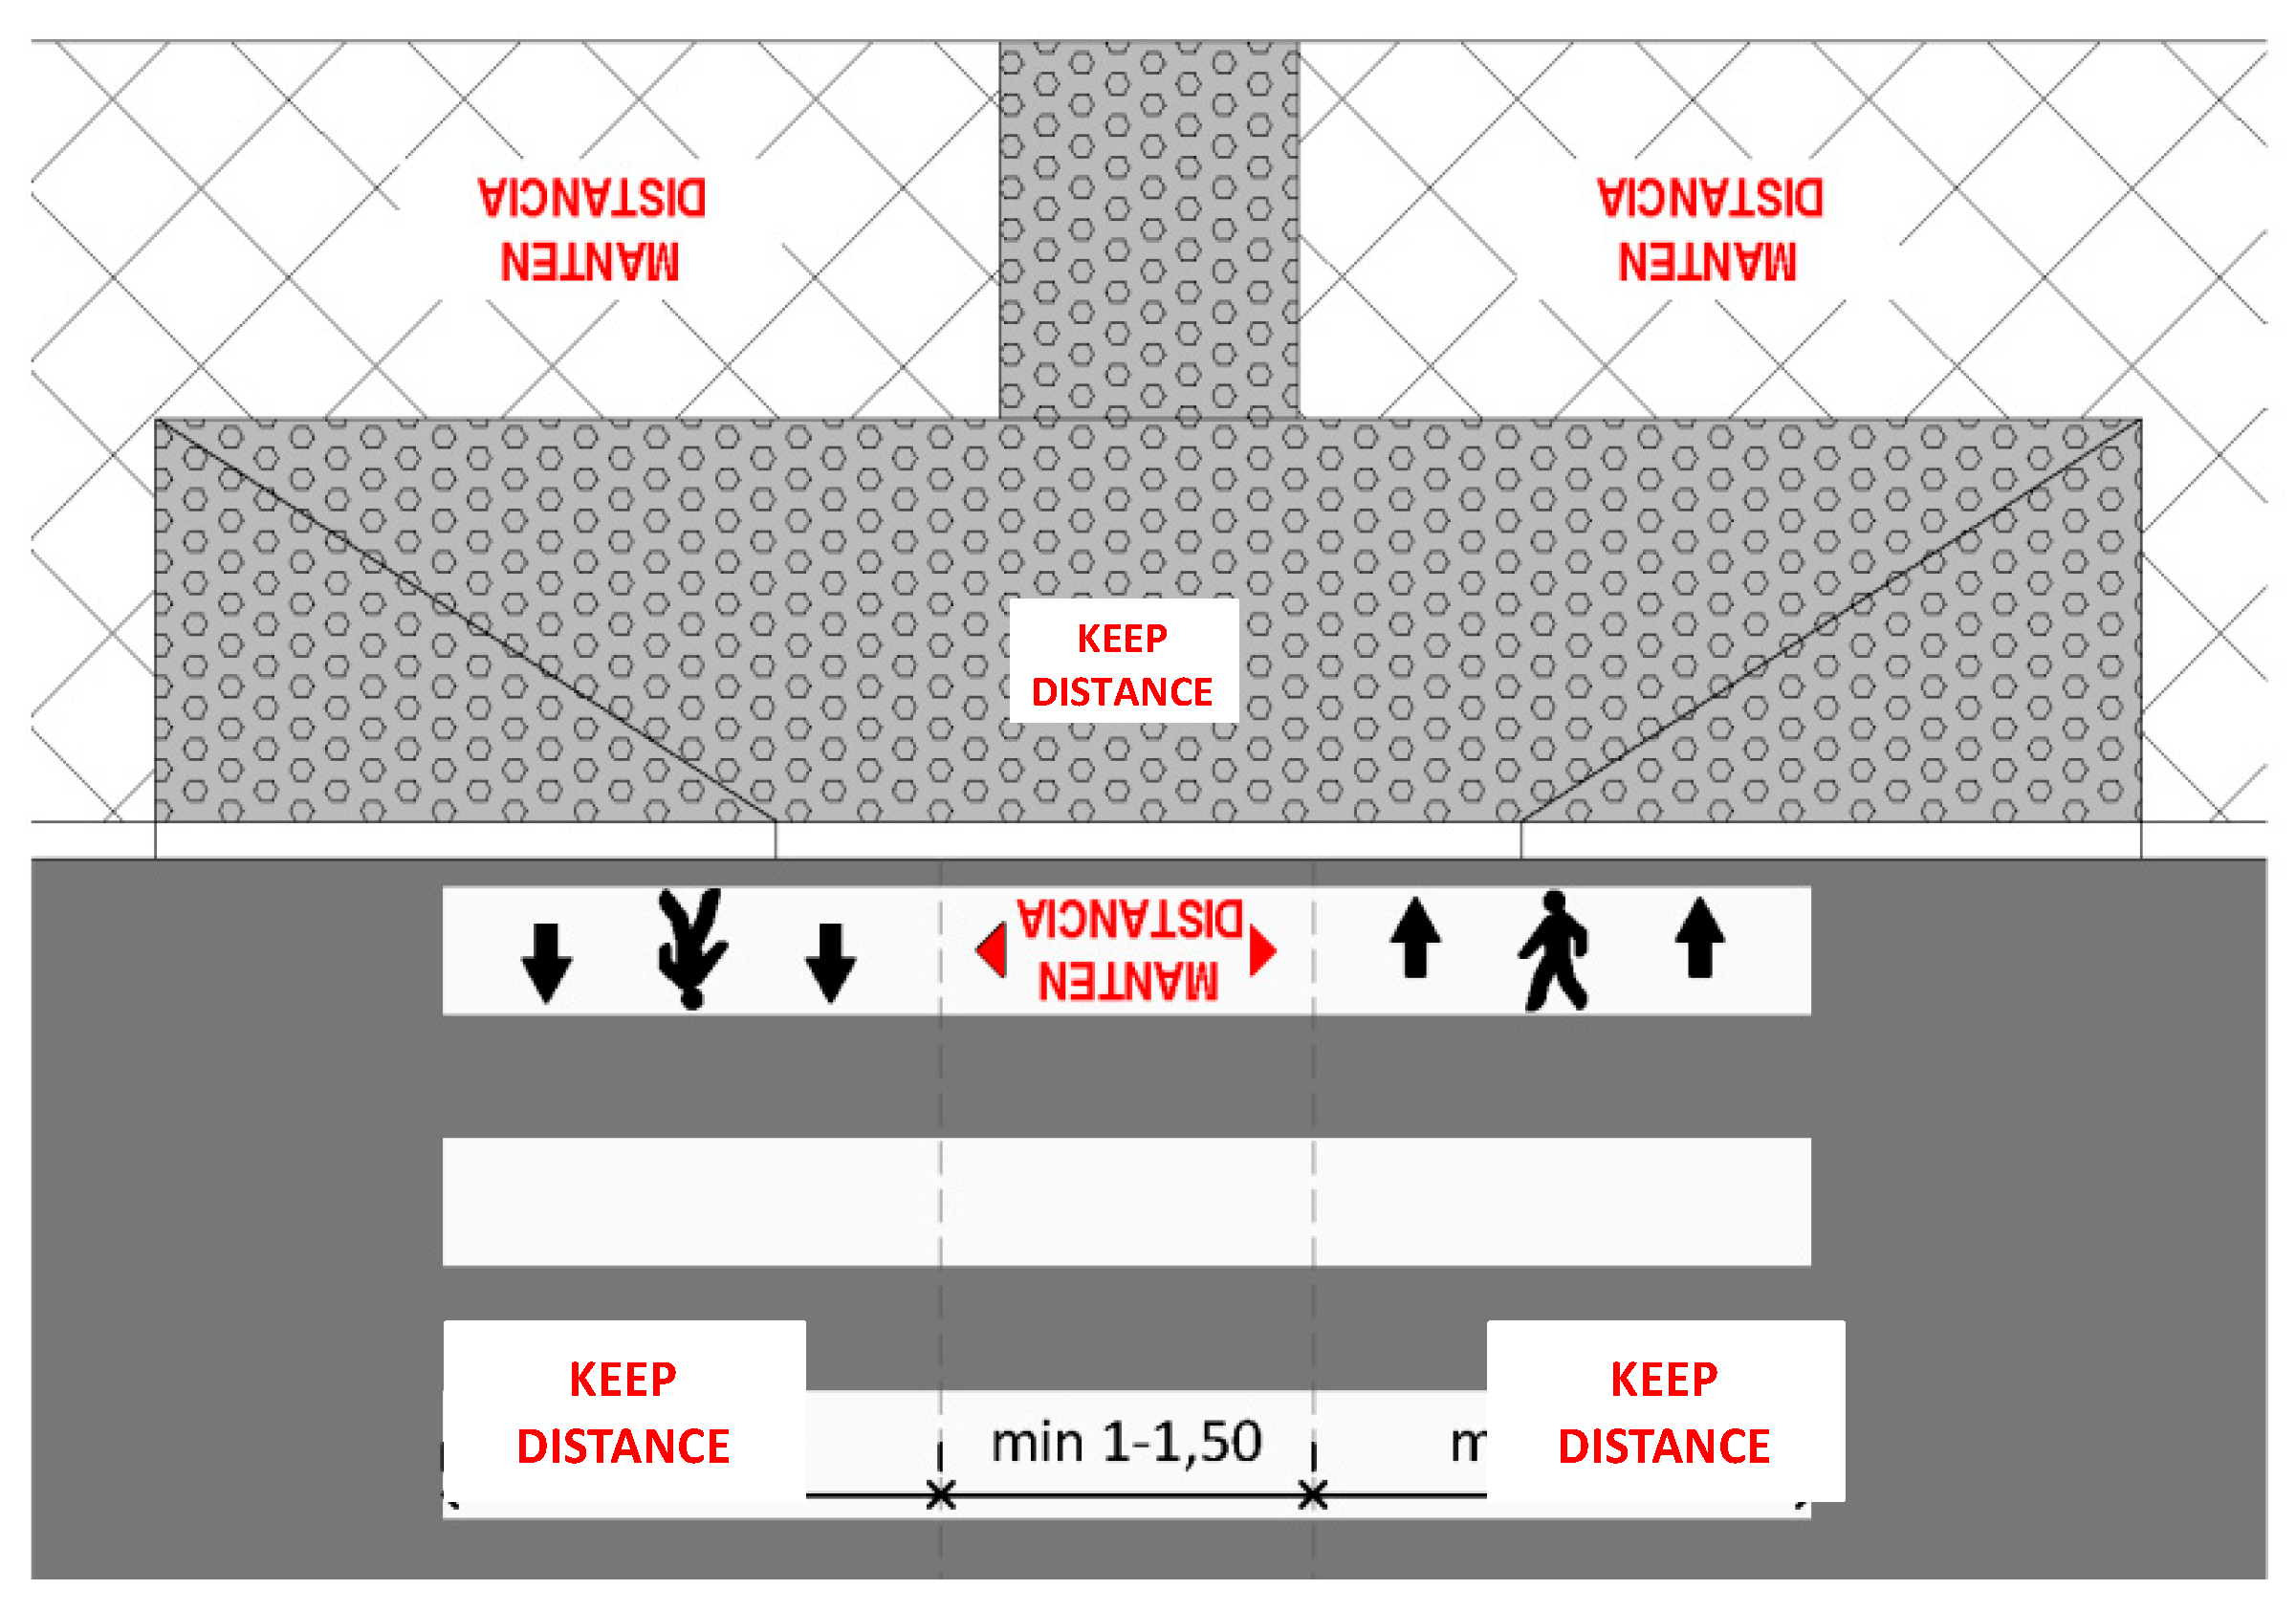
47]. The measures that have simultaneously been taken to maintain social distancing between people means that pedestrian areas have to be redesigned along with crossings (
Figure 16) and traffic lights, removing buttons [
48] and lengthening the crossing time phase for pedestrians, which partly compensates for the reduced capacity caused by a smaller crossing section and thereby avoids the accumulation of pedestrians waiting to cross. These measures will inevitably result in a reduction in the capacity of the infrastructure provided for motorized transport.
Nevertheless, for all the effort that is used introducing these measures, their success will inevitably depend on the behavior of public transport. The effect will be clearer in those cities with large public transport systems (metros, BRTs, etc.) where the transport capacity will be reduced (and is already being seen in cities undergoing a period of recuperation) due to social distancing measures between passengers inside the vehicles [
49] and the increased frequencies required to reduce waiting times and passenger accumulation at stops and stations. All these factors inevitably mean more vehicles are required, and more drivers are required for non-automatic systems. Both these cases imply significant increases in the operating costs of systems that will be carrying a reduced demand compared to the situation as it was before quarantine. Data is already available from some cities in China where the passenger demand for public transport is slowly recovering, reaching 30% by the 4th week into the recovery period [
50]. Faced with this situation, many administrations and operators are working with different recovery hypotheses and, although market prediction models are available [
51,
52,
53], the intrinsic characteristics of the nature of this crisis and the abnormal situation it generates may affect their efficiency.
As an example and in the specific case of Santander, where the normal bus load at the rush hour is 82% in the city center corridor, different scenarios can be analyzed for both the growth in demand and the system operation. Assuming similar rates of growth to the Chinese case [
50] and that social distancing rules are maintained, the resulting reduction in vehicle capacity will be around 70% of the nominal capacity, possibly rising to 50% with any potential relaxing of distancing rules by the authorities when the situation warrants it.
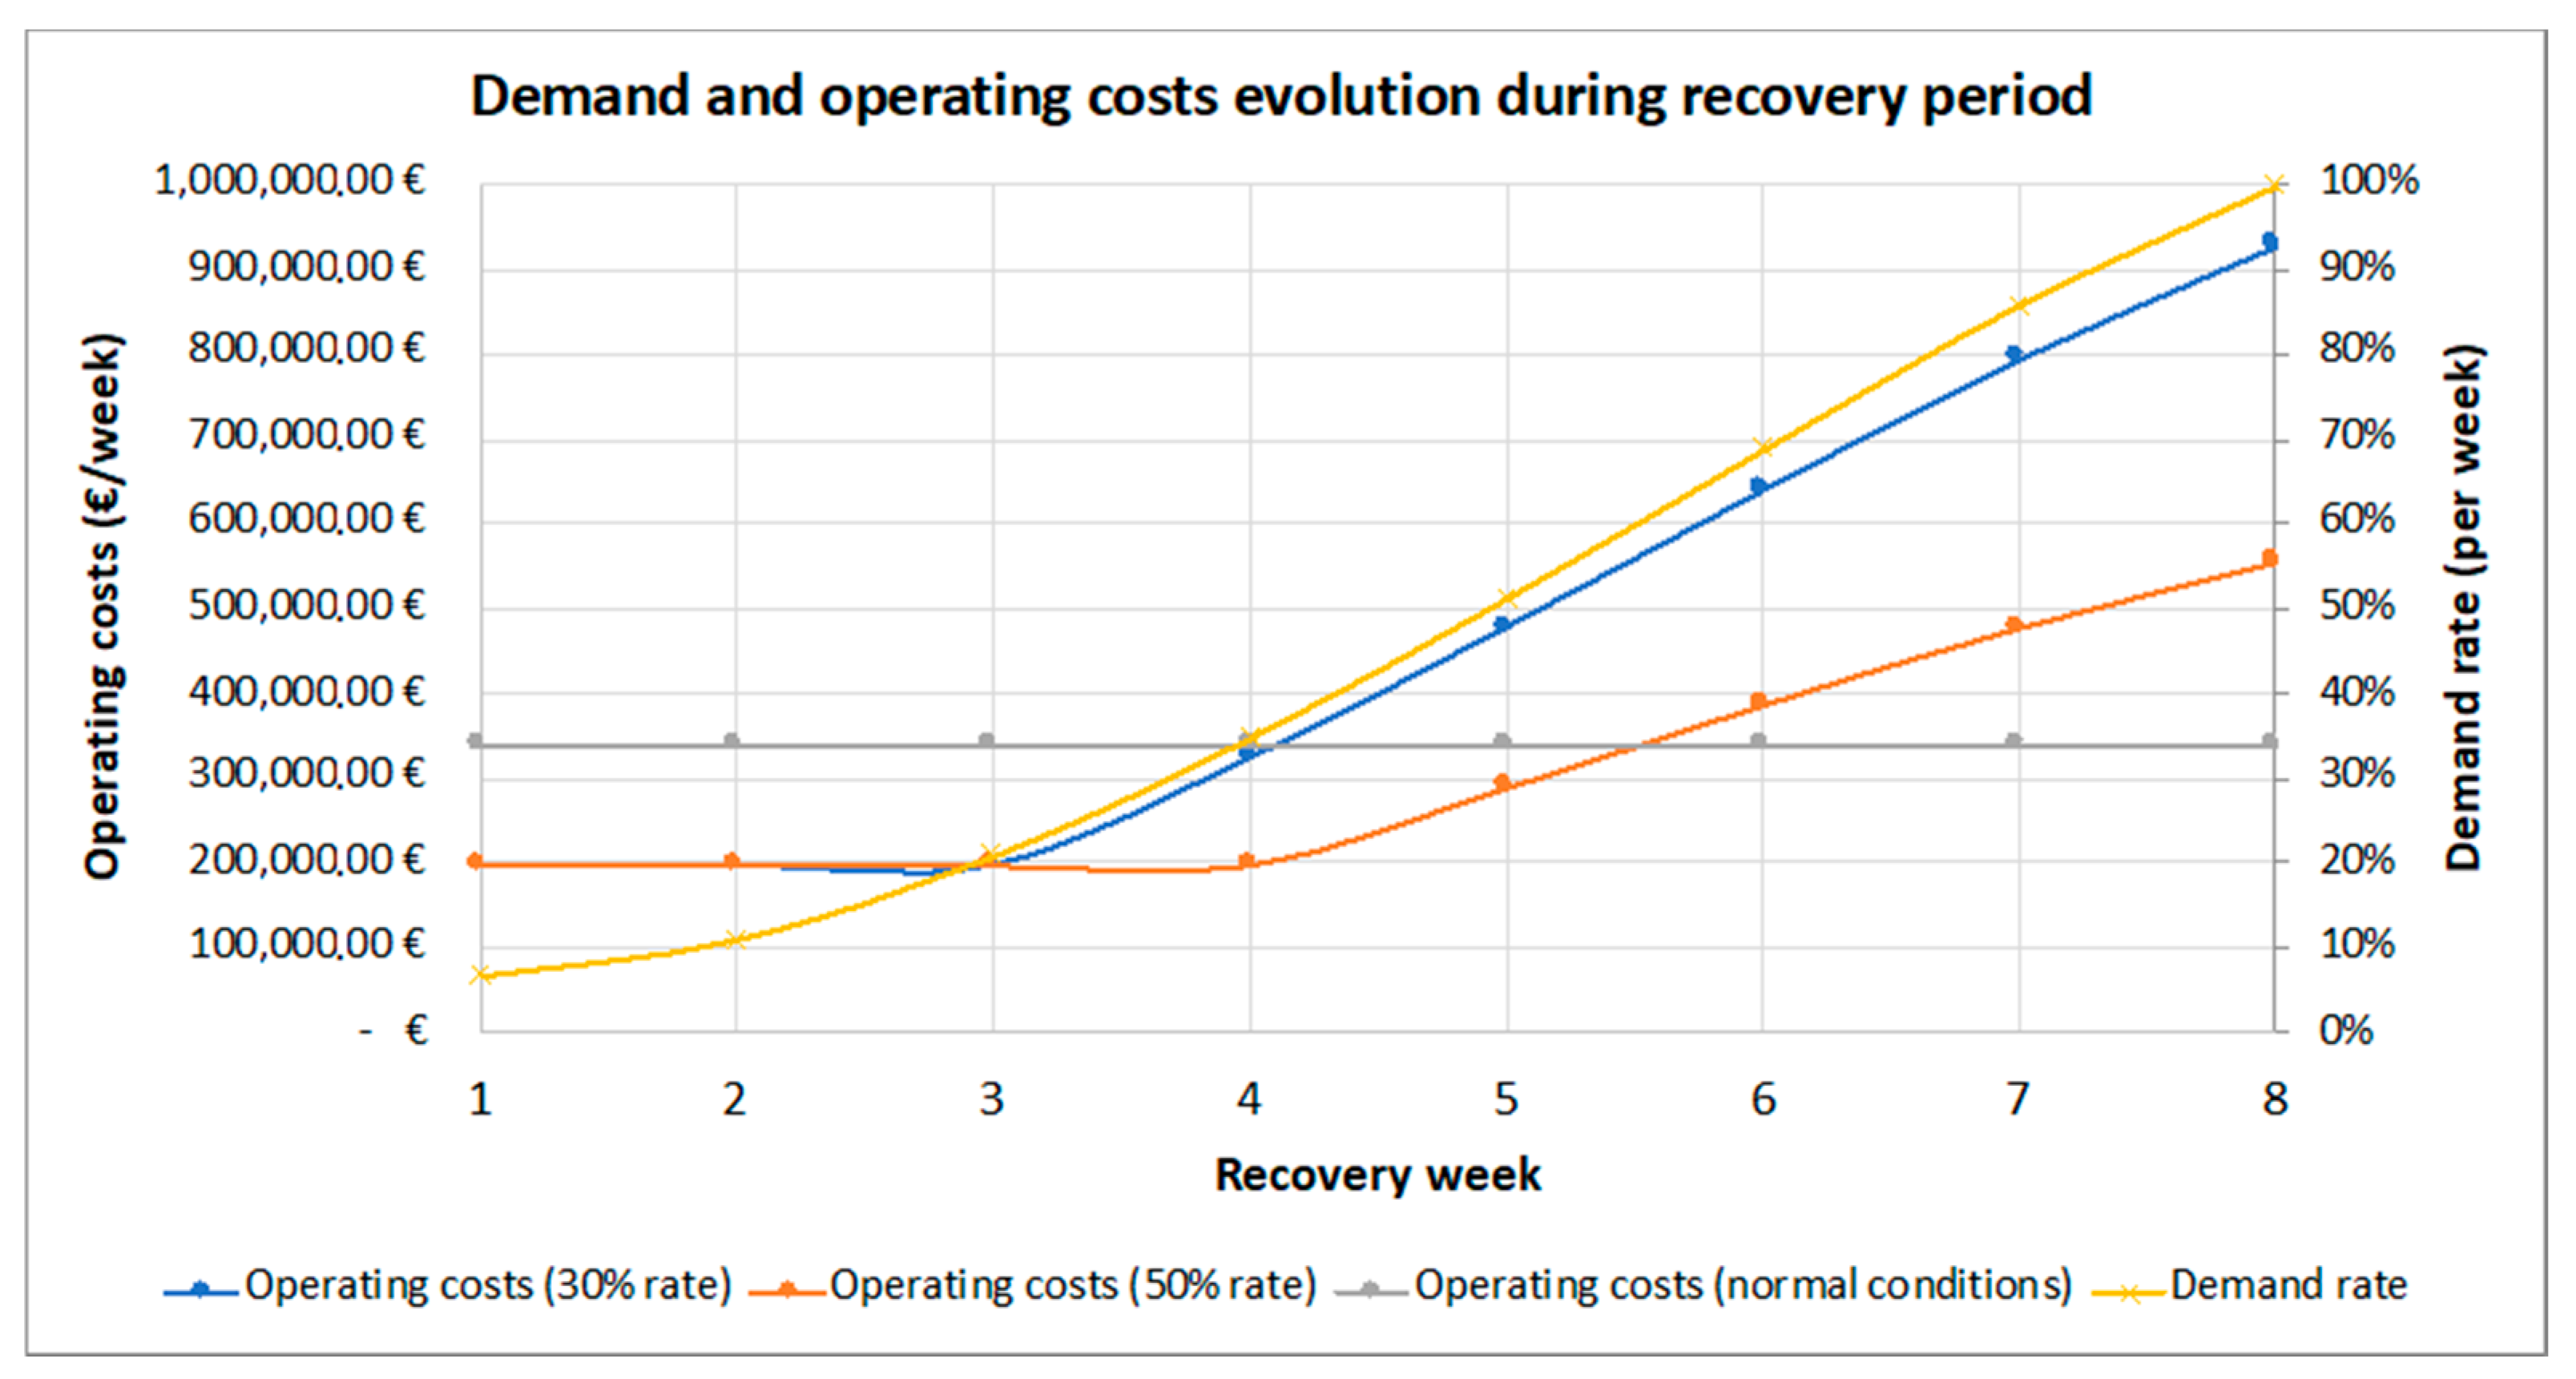
Figure 17 shows the evolution of the required operating costs to satisfy the predicted demand whilst maintaining “safe” occupancy rates. Assuming a recovery period lasting 2 months, the operator will have to double their normal operating costs for over 3 weeks and at the same time carry a much reduced demand. With all these factors,
Table 3 provides details for total income and costs during the 2 months of the recovery period for the case study. In the case of a 30% occupancy rate, the operator would multiply by 2.5 their losses compared to a normal period, while a 50% occupancy rate would result in a 52% increase in losses. Both cases will also have to factor in the feasibility of having to increase the required resources (fleet and drivers) to provide the service.
These results affect the economic viability of the entire public transport system. It would be unsustainable during only this brief period of time, and the service needs to be provided during the entire quarantine period, as shown in
Table 3, where the overall losses would be 148% higher. The implication is that public administrations will need to increase subsidies paid to guarantee the economic viability of the transport system. As well as all the above, assuming that it will not be viable to duplicate the current fleet size, the focus of any action should not only be on the supply, but also on the demand. Times for entering work places and educational establishments can be scaled to minimize the rush hour factor that results in high vehicle occupancy on public transport systems. Only by taking measures addressing both supply and demand can the viability of public transport systems be guaranteed during the period of social distancing restrictions.


 ,
, 


