Article

Small-Scale Variation in Nitrogen Use Efficiency Parameters in Winter Wheat as Affected by N Fertilization and Tillage Intensity

1
Department of Environmental Systems Science (D-USYS), Institute of Agricultural Sciences, Swiss Federal Institute of Technology (ETH), Universitätstrasse 2, 8092 Zürich, Switzerland
2
Hermiston Agricultural Research & Extension Center, Oregon State University, 2121 South 1st Street, Hermiston, OR 97838, USA
3
Agroscope Reckenholz-Tänikon Research Station ART, Reckenholzstrasse 191, CH-8046 Zurich, Switzerland
4
School of Agricultural, Forest and Food Sciences HAFL, Bern University of Applied Sciences, Länggasse 85, 3052 Zollikofen, Switzerland
5
Agroscope, Institut des sciences en production végétale IPV, Route de Duillier 50, P.O. Box 1012, 1260 Nyon, Switzerland
6
Institute of Industrial and Forage Crops, Hellenic Agricultural Organization–“DEMETER”, 41335 Larissa, Greece
*
Author to whom correspondence should be addressed.
Sustainability 2020, 12(9), 3621; https://doi.org/10.3390/su12093621
Submission received: 26 March 2020 / Revised: 28 April 2020 / Accepted: 29 April 2020 / Published: 30 April 2020
(This article belongs to the Special Issue Suitable Agronomic Techniques for Sustainable Agriculture)

Abstract

:
Limited information exists on how tillage and nitrogen (N) fertilization affects small-scale variation in nitrogen use efficiency (NUE) and crop performance. In a two-year field study under temperate conditions, we investigated how tillage (NT, no-tillage; CT, conventional tillage) and N fertilization affected the small-scale variation in NUE and winter wheat performance (grain yield, Gw; grain protein concentration, GPC). A randomized complete block design with three replications was used. Within each tillage plot (12 × 35 m2), N rates (0, 50, 100, 150, 200, 250 kg N ha−1) were completely randomized within each of four groups of microplots (1.5 × 1.5 m2). Early-season soil mineral N (Nmin) was also monitored in both years. At rates < 150 kg N ha−1, NT was not competitive with CT in terms of Gw and NUE. Gw and aboveground plant N were not correlated with Nmin prior to application of N fertilizer. NT usually led to larger spatial heterogeneity of Nmin, Gw, and NUE. The small-scale variability of Gw, GPC, NUE, and N supply decreased with increasing N fertilization rates under both tillage systems. Significant increases in Gw and GPC were observed with increasing N rates, whereas NUE decreased slightly with increasing N rates in both NT and CT. The overall moderate spatial variation in Nmin, Gw, and NUE did not justify site-specific N fertilization in these small fields, with the exception of the stony within-plot positions, which were not responsive to rates of N > 50 kg N ha−1.

1. Introduction

Wheat is one of the world’s most important staple crops with forecast annual production of 757.4 million metric tons in 2019 contributing to global food security and providing 20% of total dietary calories and protein needs [1,2]. Therefore, a better understanding of the effects of different management practices on wheat grain yields, grain quality, and resource use efficiency are essential for sustainable production, ensuring food availability to the growing population. However, wheat yields may vary globally, locally, and sometimes even within fields to a great extent due to heterogeneity of growing conditions [3,4]. For an important food crop such as wheat, it is essential to increase the fertilizer nitrogen use efficiency in view of satisfying the growing demands and the decreased cropland [5,6]. Nevertheless, low soil nitrogen (N) availability is a common factor limiting the growth and crop production worldwide and the application of N fertilizer has become an important, cost-effective strategy used to increase crop yields in intensive agricultural systems [7]. Recent data indicate that N fertilizer use rates per unit cropland area increased by approximately 8 times since the year 1961 when IFA (International Fertilizer Industry Association) and FAO (Food and Agricultural Organization) surveys of country-level fertilizer input became available [8]. Of the total fertilizer N applied, approximately half is consumed by the three most important cereals (rice, wheat, and maize) with 50-year (1961–2010) average application rates of 69, 51, and 77 (kg ha−1), respectively [9]. As reported by Schils et al. [10], the potential for production growth of the most important cereals across Europe (wheat, barley, and maize) requires a substantial increase of the crop N uptake of about 4.8 Mt. Moreover, the average N uptake gaps, to achieve 80% of the full yield potential, are 87, 77, and 43 kg N ha−1 for wheat, barley, and maize, respectively.
The overall efficiency of applied N differs widely among climatic regions. Experiments have shown that on average only 51% of the fertilizer N applied to cereal crops was recovered by the plant tops, and average N fertilizer recoveries can be even lower when applied at high rates [11]. With conventional practices, N fertilizer recovery is less than 30%, even with the best combination of practices and it seldom reaches up to 40% in India, which includes six climatic zones from arid to tropic wet [12]. It is generally less than 50% in the tropics [13,14] and less than 70% in temperate regions, indicating that our knowledge of optimal fertilizer management of cereals in various ecosystems is still incomplete [15,16]. In Switzerland, the average yield of wheat is quite high (6094 kg ha−1) compared to the world’s average (3530 kg ha−1) [17], and the apparent recovery of N fertilizer fluctuates from 49% to 80% [18,19]. With the rising costs of N fertilizer due to a shortage of fossil fuel and the negative environmental impacts of excessive N fertilization, it is increasingly important to enhance the fertilizer N use efficiency of wheat [6,20].
Among the factors that contribute to relatively low N use efficiency (NUE) are the uniform fertilizer N application rates to spatially and/or temporarily variable landscapes [16]. Farmers generally tend to apply a fixed rate of fertilizer N to an entire wheat field, which often leads to areas of over-fertilization and under-fertilization of N, because the spatial variation in the characteristics of the soil and the microenvironment modifies crop yield potential and, thus, crop N requirement on the one hand and the mineralization of soil N on the other [21]. Soil N availability, crop N uptake, and N responses differ spatially within fields [22]. Spatially variable applications of N fertilizer may reduce the risk of environmental pollution, improve the NUE, and increase the economic returns of N fertilization [23,24], but it requires knowledge about the site-specific N requirements of crops. However, the spatial variation in crop yield, N requirement, and soil N supply has been usually investigated at large scales [25]. Very few studies have been conducted under central Europe’s farming conditions where the size of fields is often small, ranging approximately between 0.5 and 5 ha [26,27,28].
The spatial patterns of yield and the N status of crops may be due to the inherent spatial variability of soil properties [27] and to agronomic practices (tillage, seeding, crop rotation, former fertilization, and pest management), which influence many N-related soil and plant processes [29,30]. For example, different spatial patterns of maize yield have been reported for different tillage systems [31]. Different yield responses of spring wheat to N application in no-tillage (NT) and conventional tillage (CT) indicated that there must have been differences in the N supply, N availability, and NUE [29]. More than three decades of research on conservation tillage systems verified that soils under NT have an improved soil structure, resulting in less erosion and better trafficability [32,33,34]. The presence of crop residues on the soil surface in NT systems affects the water and temperature regimes. By influencing the soil temperature, tillage affects the rate of soil chemical reactions and biological activities [35]. Tillage also modifies the hydrological characteristics of the soil [36]. Therefore, the movement of agrichemicals, including nitrate, through the soil profile and processes such as N mineralization and N immobilization may lead to diverse spatial distributions of soil mineral N (Nmin) in different tillage systems [37]. This, in turn, may have an impact on the variability of crop yield and NUE [38]. In this study, the sampling of soil and plants from small adjacent field plots was used to assess and compare the spatial variability of NUE of winter wheat in two extreme tillage systems: CT, with moldboard plowing to a depth of 0.25 m and NT.
The objectives of this study were: (i) to assess the small-scale variability of Nmin at the beginning of vegetation, grain yield (Gw), grain protein concentration (GPC), and NUE of winter wheat; (ii) to determine whether early-season variability in Nmin within the field is spatially associated with Gw; and (iii) to investigate whether the spatial variability of Gw, GPC, and NUE were modified by N fertilization and tillage intensity.

2. Materials and Methods

2.1. Experimental Site and Weather Conditions

The study was conducted within a tillage experiment from 1996 to 2000 at a farm near Schafisheim (47°23′ N, 8°09′ E; 429 m above sea level) in the Swiss midlands. The data which are presented in this study were collected 20 years ago, and it was not made possible to deliver these findings earlier in the forefront of the scientific community through a peered research paper. The study provides deeper insights on small-scale farming lands, which are predominant in many areas of the world. To our knowledge, there is not a lot of literature published up to today on small scale variation in NUE as affected by tillage practices. Moreover, crop nutrition, tillage management, and other agronomic practices (i.e., crop protection) did not significantly change during these years. Furthermore, as it will be also indicated in the following paragraph, the winter wheat variety used for this study is still in the official list of recommended varieties and is popular among farmers.
The investigations were carried in a field of about 2 ha on an Orthic Luvisol [39]. The topsoil (0–30 cm) was a sandy loam (SL): 15% clay, 35% silt, 50% sand [40], rich in organic matter (3.3%), and slightly acidic, with pH (H2O) = 6.3 [41].
Long-term climatic data from meteorological station Buchs-Suhr (near Schafisheim) were obtained from the Swiss Meteorological Institute (SMI, Zurich). The climate is temperate (Cfb according to the Köppen climate classification). In the last 20 years prior to the experiments (1980–2000), the average annual mean temperature was 9.2 °C and the average annual precipitation was 1047 mm. Weather conditions were close to the long-term average more in the 1999/2000 than in the 1998/1999 growing season. Between the two growing seasons, the winter in 1998/1999 was colder (mean monthly air temperature ranged from −0.6 °C in February 1999 to 0.7 °C in January 1999) compared to 1999/2000 (mean monthly air temperature ranged from 0.5 °C in January 2000 to 4.1 °C in February 2000), which led to a strong decrease in plant density in the NT plots.

2.2. Treatments and Experimental Design

The study was based on a four-year rotation of winter wheat (Triticum aestivum L.), oilseed rape (Brassica napus L.), winter wheat and maize (Zea mays L.); white mustard (Brassica alba L.) was the cover crop between winter wheat and maize. The plots (12 × 35 m) within the 2 ha fields were arranged in a way that all four crops in the rotation were grown in parallel each year. Thus, the investigations were undertaken in the same wheat crop within the rotation (the one grown after maize) in two subsequent years.
The tillage treatments in this study were conventional tillage (CT) and no-tillage (NT). In the CT treatment, a moldboard plow was used to a depth of 0.25 m and the plots were then rototilled at a depth of 0.10 m right before to sowing with a conventional planter with double-disk openers (Kuhn Nodet Planter II, Montereau, France). In the NT plots, wheat was sown with a no-till planter with single-disc openers (John Deere ‘NT 750 A’, Deere and Co., Moline, IL, USA) directly into the dead mulch. Throughout the crop rotation, all the crop residues were left on the field; in NT, the crop residues were left on the soil surface, whereas in CT they were ploughed under. The tillage of the individual plots was the same each year.
Winter wheat cultivar ‘Runal’ (breeder: Swiss Federal Research Station for Agroecology and Agriculture FAL, Zurich, Switzerland), a high-quality variety with an intermediate yield potential [42], was sown at a seeding rate of 200 kg ha−1 (425 seeds m−2) on 9 November 1998 and at 188 kg ha−1 (400 seeds m−2) on 19 October 1999 in both CT and NT. As of 2020, ‘Runal’ is still cultivated and included in the official list of recommended varieties (Swiss Granum: List of recommended winter wheat varieties for 2020: https://www.swissgranum.ch/). The row spacing was 12.5 cm in CT and 16.6 cm in NT; the depth of seeding was 3 to 4 cm in both tillage systems. No herbicide was applied before seeding because winter wheat was sown right after the harvest of the preceding maize crop, which left the plots practically free of weeds. Other phytosanitary measures were taken as needed according to local recommendations. Because soil testing indicated large soil reserves, phosphorus (P) and potassium (K) were not applied to the plots during both growing seasons [43].
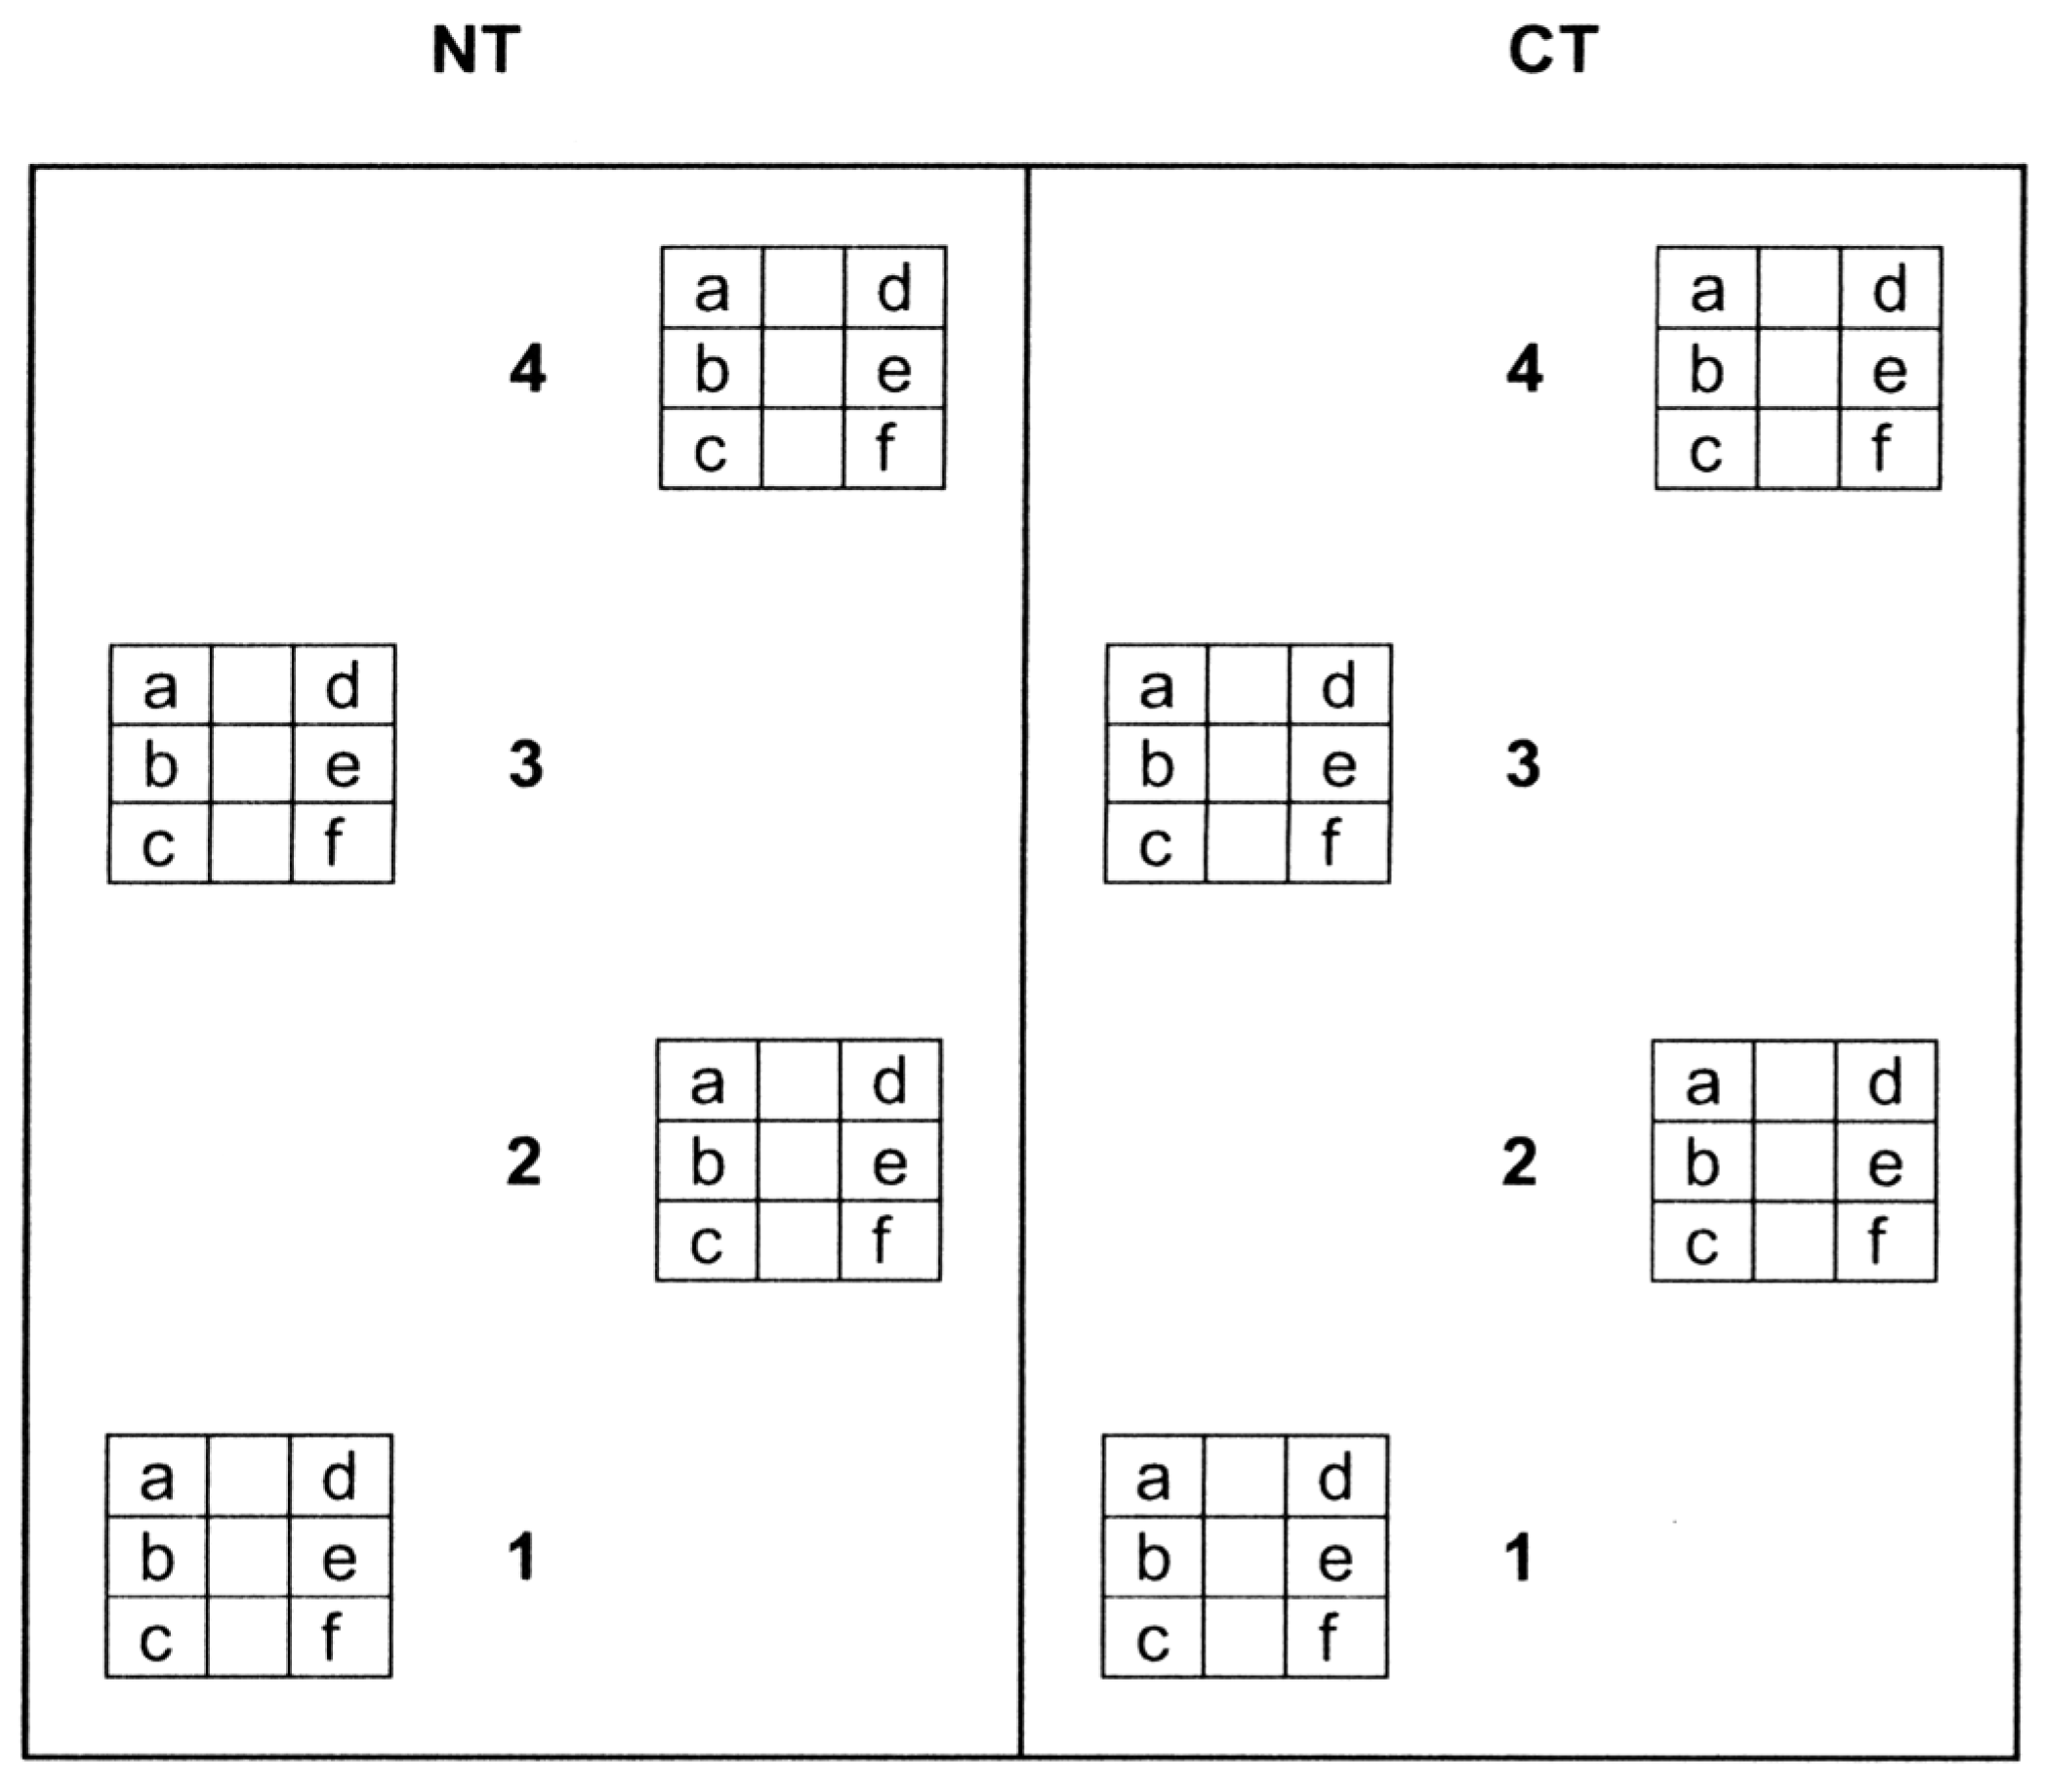
The experimental design was a randomized complete block design with three replications. The experimental factors were ‘year’, ‘tillage system’, ‘rate of N fertilization’, and ‘position in the plot’ (= microplot group). Within each plot, the levels of N fertilization were completely randomized within each of four groups of microplots (microplot size: 1.5 × 1.5 m), located about 10 m from each other, as shown in Figure 1. In total, there were 12 microplot groups (4 microplots × 3 replications) in each tillage system (NT, CT) in each year.
Nitrogen fertilizer was broadcast as ammonium nitrate (NH4NO3) at five different rates in 1999 and at six different rates in 2000. No N fertilizer was applied in the control treatment in both growing seasons. Splitting and timing of N fertilizations are provided in Table 1.

2.3. Soil and Plant Measurements

Soil samples for determining soil mineral N (Nmin) were taken in every microplot to a depth of 90 cm at the beginning of vegetation (on 13 March 1999 and on 16 March 2000) before the first N application. Just after wheat harvesting, soil samples were collected in the 0, 150, and 250 kg N ha−1 microplots to determine residual soil Nmin. Three cores per sample were taken by hand using a ‘Purckhauer’ auger (Eijkelkamp, Giesbeek, The Netherlands) and were separated according to depth (0 to 15 cm, 15 to 30 cm, 30 to 60 cm, and 60 to 90 cm). Soil samples were stored at −25 °C until analysis. Before freezing, the samples were broken up and mixed as much as possible. For the analysis, moist soil (100 g), sieved through a 2–4 mm sieve, was mixed with 100 mL of 0.01 M CaCl2 solution [45]. Extraction of moist and frozen samples by manual crushing and sieving was done to prevent changes in levels of ammonium (NH4+-N) and sometimes nitrate (NO3-N) that occur upon drying. After shaking the samples for 90 min, they were filtrated through N-free filter papers. The concentrations of NO3- N and NH4+-N in the CaCl2 extract were analyzed using a colorimetric method with an ‘Evolution 2′ autoanalyzer (Alliance Instruments, Nanterre, France). Moist soil (150 g) from each sample was dried at 65 °C to a constant weight to determine the gravimetric water content. The dry soil samples were analyzed to determine total contents of N and C with a ‘LECO CHN-1000′ autoanalyzer (LECO Corporation, St, Joseph, MI, USA).
Biomass and grain yields were determined on 1 m2 in the center of every microplot. Plants were cut about 5 cm above the soil surface on 2 August 1999 and 26 July 2000. Grains and subsamples of straw were dried at 65° C for 48 h to determine the yields of dry matter. The grain and straw samples were ground and analyzed for N content with a ‘LECO CHN-1000′ autoanalyzer. The grain protein concentration (GPC) was calculated by multiplying the grain N content by 5.7 [46]. NUE and its components were calculated according to Huggins and Pan [29]; the definitions and formulas are given in Table 2.
N supply (Ns) was estimated by taking the sum of soil mineral N (Nmin) at the beginning of vegetation (0–90 cm), mineralized N in the control (N0) plots, and applied fertilizer N (Nfer), according to the formula:
Ns = fertilizer N applied (Nfer) + [Nmin (0–90 cm) at the beginning of vegetation + mineralized N in the N0 plots].
Cumulated N mineralization in the period from the beginning of vegetation after winter to the wheat harvest was calculated by subtracting the amount of soil Nmin (0–90 cm) at the beginning of vegetation (residual inorganic soil N prior to crop growth) from the amount of plant N (total aboveground plant N at physiological maturity) and soil Nmin at the harvest (inorganic soil N at harvest) in the control plots (N0), which were not fertilized. The following formula was used:
Mineralized N in the N0 plots = (Nt, total aboveground plant N at physiological maturity + Nmin, inorganic soil N at harvest) – [Nmin (0–90 cm) at the beginning of vegetation] (all terms from control plots).
From Equations (1) and (2), it is entailed that:
Ns = Nt, total aboveground plant N at maturity + Nmin, inorganic soil N at harvest.
The terms in the above formula (Equation (3)) for estimating Ns are directly measured. It must be noted that the use of control plots to estimate Ns assumes: (i) no losses of residual available N, mineralized N, or other available N sources (fixed N and depositional N like atmospheric or irrigation) occur in the control plots; and (ii) no effect of fertilizer N on net mineralization [47]. It does not consider the ‘added N interaction’ by stimulation of root proliferation and/or N uptake efficiency, the so-called ‘priming’ effect (an increased plant N uptake as a result of the stimulation of N mineralization in the presence of N fertilizer) [48].

2.4. Statistics

Two different analysis of variance (ANOVA) models with four and three experimental factors were used—with or without the factor ‘year’ and, in both models, including the remaining factors ‘tillage system’, ‘within-plot position’, and ‘rate of N fertilization’. The factor ‘within-plot position’ was considered to be nested in the replication and tillage system. The model over the years showed significant tillage × year interactions, therefore, the results were presented separately for each experimental year. ANOVA and contrasts were calculated with the General Linear Models procedure (GLM) of SYSTAT software [49]. Differences among the levels of the experimental factors were tested with Fisher’s least significant difference test (LSD). Least-squares regression was used to fit polynomial functions to the responses of Gw, GPC, and NUE to N fertilization rates. Linear regression models were calculated to determine the relationship between Nmin on the one hand and Gw, GPC, and aboveground plant N on the other hand.

3. Results

3.1. Small-Scale Variability of Soil Nmin and Ntot at the Beginning of Vegetation

In NT, the Nmin content (0–90 cm depth) differed significantly (p ≤ 0.001) among within-plot positions in both years; in CT, a significant difference (p ≤ 0.001) was found in 2000 only, as shown in Table 3. The Nmin content in 2000 was approximately twice as high as that in 1999; the average values did not differ between the tillage systems, as shown in Table 4. The ranges of Nmin were much larger in NT than in CT, as shown in Figure 2, in both years (from about 15 to 55 kg ha−1 in 1999 and from 24 to 115 kg ha−1 in 2000 in NT). The ranges of Nmin in CT were from 14 to 43 kg ha−1 in 1999 and from 42 to 106 kg ha−1 in 2000.
The spatial variation (as indicated by the coefficient of variation, CV %) in soil N increased with soil depth, both in NT and CT; this was more pronounced for Ntot than for Nmin, as shown in Table 4. The spatial variability of Nmin and Ntot in individual soil layers was usually slightly larger in NT than in CT. In CT, the spatial variation in Nmin and Ntot was approximately the same in the soil layers 0–15 cm and 15–30 cm, whereas in NT the spatial variation in Ntot, and in 1999 also for Nmin, was larger from 15 to 30 cm than from 0 to 15 cm depth.
No correlation was detected between Nmin (0–90 cm soil depth) at the beginning of vegetation, and Gw. Nmin at the beginning of vegetation was not spatially correlated with the aboveground plant N content at harvest time (data not shown).

3.2. Small-Scale Variability of Gw and GPC

In NT, grain yield (Gw) and biomass differed significantly (p ≤ 0.001) among within-plot positions in both years; in CT, this was true only in 2000 (p ≤ 0.001). GPC varied significantly (p ≤ 0.05 and p ≤ 0.001) within-plot positions in both tillage systems in 1999 and in 2000, respectively, as shown in Table 3. Among replications, GPC showed significant differences (p ≤ 0.01) in both years only in the NT system.
The CV (%) shows that the small-scale variability of Gw decreased with increasing levels of N fertilization in both tillage systems, as shown in Table 5. In 2000, however, it decreased only from 0 to 100 kg N ha−1, whereas small-scale variation increased again from 150 kg to 250 kg N ha−1, as shown in Table 5. CVs for Gw and total biomass were higher in NT than in CT at most of the rates of N fertilization, as shown in Table 5.
GPC expressed small-scale variability to a lesser extent than Gw, as shown in Table 6. The small-scale variability of GPC also decreased with increasing rates of N fertilization in NT and CT in both years, as shown in Table 6. In 1999, the spatial variation in GPC was larger in NT, whereas in 2000, it was similar in both treatments.

3.3. Small-Scale Variability of NUE

NUE for grain yield (Gw/Ns) differed significantly among within-plot positions only in CT in 1999 (p ≤ 0.01) and in both tillage systems in 2000 (p ≤ 0.001), as shown in Table 3. In 1999, the spatial variation in NUE declined with increasing level of N fertilization, whereas in 2000 this was not the case, as shown in Table 7. Only in 1999 was the small-scale variability of NUE larger in NT than in CT; in 2000, it was similar in both tillage systems, as shown in Table 7. Considering both components of NUE, the spatial variation of the N uptake efficiency (Nt/Ns) was considerably larger than the N utilization efficiency (Gw/Nt), as shown in Table 7. The N supply (Ns) varied spatially less with increasing rate of N fertilization, as shown in Table 7. In 1999, the small-scale variability of Ns was larger in NT than in CT, as shown in Table 7. The spatial variation in N mineralized during the vegetation period in N0 plots was larger in NT than in CT in both years (data not shown). In 1999, the small-scale variability of residual Nmin in the N0 plots after the harvest was greater in NT than in CT; the amount of residual Nmin was also significantly (p ≤ 0.05) higher in NT than in CT (data not shown). However, in 2000, the amount of residual Nmin and the small-scale variability of residual Nmin were similar for both tillage systems after the harvest.

3.4. Small-Scale Variability and Year-to-Year Variation of Gw, GPC, and NUE in Response to N

In both years, Gw averaged across the tested N fertilization rates was significantly lower in NT than in CT; 1999: NT 3.47 Mg ha−1, CT 5.15 Mg ha−1 (p ≤ 0.05); 2000: NT 4.85 Mg ha−1, CT 5.0 Mg ha−1 (p ≤ 0.1) (from Table 5, statistics not shown). The Gw did not differ significantly between 1999 and 2000, but there was a significant ‘tillage × year’ interaction (p ≤ 0.01). In 1999, the yield response of CT and NT to N fertilization differed clearly, as shown by the intercept and the slope of the quadratic equation, as shown in Table 8.
The yield response in NT was almost linear and shifted to lower yields compared with CT; this was due to the suboptimum plant density in NT in 1999, as shown in Table 5. For this reason, the Gw were significantly (p ≤ 0.001) lower in 1999 for all rates of N fertilization in NT compared with CT. In 2000, the yield response curves to N fertilization had a very similar shape in both tillage systems, as shown in Figure 3; no significant differences between tillage systems were found for any of the rates of N fertilization.
Significant increases in Gw (p ≤ 0.01) were detected among N fertilization rates in 1999: 0 to 200 kg N for NT and 0 to 150 kg N for CT. In 2000, the increases in Gw were significant (p ≤ 0.01) only from 0 to 150 kg (NT) and from 0 to 100 kg N (CT). In 1999, the first derivation of the functions, as shown in Figure 3 and Table 8, revealed that the maximum Gw and maximum GPC were not achieved within the range of N fertilization (0 to 200 kg N ha−1). Hence, the range of the rates of N fertilization was increased to 250 kg N ha−1 in 2000. In 2000, the maximum Gw (5.86 Mg ha−1) of the CT plots was reached at 185 kg N ha−1, whereas in the NT plots the maximum Gw (5.60 Mg ha−1) was reached at 200 kg N ha−1. In 2000, the GPC was highest (169.3 g kg−1) at 230 kg N ha−1 in CT and at 250 kg N ha−1 in NT (168.8 g k g−1). In 1999, GPC did not reach a maximum within the range of fertilization (0 to 200 kg N ha−1) with 143.5 g kg−1 (CT) and 144.8 g kg−1 (NT), as shown in Figure 3.
In 2000, the highest NUE was reached at 90 kg N ha−1 in CT (18.7 kg kg−1), slightly decreasing to 18.4 kg kg−1 at 120 kg N ha−1, and at 75 kg N ha−1 in NT (17.6 kg kg−1), decreasing slightly to 17.1 kg kg−1 at 120 kg N ha−1. The highest NUE of 1999 was observed at 44 kg N ha−1 in CT (23 kg kg−1), decreasing slightly to 22 kg kg−1 at 120 kg N ha−1, and at 80 kg N ha−1 in NT (15.7 kg kg−1), remaining almost constant with 15.7 kg kg−1 at 120 kg N ha−1, as shown in Figure 3.
GPC did not differ significantly between NT and CT; it did, however, between 1999 and 2000 (p ≤ 0.05). GPC, averaged across the rates of N fertilization at 12 within-plot positions, was higher in 2000 (NT 148 g kg−1, CT 147 g kg−1, not significant; n.s.) than in 1999 (NT 132 g kg−1, CT 127 g kg−1, n.s.). The shape of the N response curves for GPC (polynomial equation of 3rd order) clearly indicate the dilution effect of GPC at the N fertilization level of 50 kg N ha−1 due to the increase in grain yield per kg grain N, as shown in Figure 3.
The NUE averaged across the rates of N fertilization was lower in NT (15.3 kg kg−1 in 1999 and 15.9 kg kg−1 in 2000) than in CT (21.6 kg kg−1 in 1999 and 16.7 kg kg−1 in 2000) at p ≤ 0.05 (from Table 7, statistics not shown). The NUE response curves did not differ significantly between the years.
In both years, the N response functions of Gw (quadratic response), of GPC (cubic response), and of NUE (negative quadratic response) explain a greater part of the variance of the dependent variable in CT compared with NT when fitted for the individual values of the 12 positions within the plots, as shown in Figure 3. The functions, fitted for the means of these 12 values, had uniformly high coefficients of determination in both tillage systems. This suggests that the spatial variability of the N response of these three traits is larger in NT. There were significant interactions between ‘N fertilization rate’ and ‘year’ for grain yield (p ≤ 0.001), GPC (p ≤ 0.001), and NUE (p ≤ 0.01).

4. Discussion

4.1. Small-Scale Variability of Soil Nmin as Affected by Tillage Intensity

The spatial variation in Nmin at the beginning of vegetation (mid-March 2000) was greater in NT than in CT in 2000 when the overall Nmin content was significantly higher (p ≤ 0.01) than in 1999 (mid-March 1999). This is in accordance with the results of Robertson et al. [50] who found that, in early May, the spatial variability of net N-mineralization (0–20 cm depth) in a plowed field was much smaller than in an uncultivated field when the sample intervals were small (< 15 m). The greater amount of crop residues remaining with NT may have provided available substrate for maintenance of the larger soil microbial biomass pool and the higher soil N mineralization at the start of the vegetation period [51,52]. However, Kohl and Harrach [53], who studied the temporal and spatial variability of nitrate concentration in the soil solution (20–150 cm depth) in NT and CT as measured in bare soil at small scales, found contrasting results. In the topsoil (20 cm depth), the concentration and coefficient of variation of NO3-N were higher in CT than in NT from January to May, with the exception of March (beginning of vegetation), when the concentration and variation of NO3-N was similar in both systems. Kohl and Harrach [53] concluded that N mineralization was greater in CT than in NT and that the greater variation in soil Nmin may be due to the fact that the crop residuals were mixed very heterogeneously in the topsoil as a result of plowing. Similarly, Gałka et al. [54], who studied the long-term intensive cultivation (variable plowing) effects on the differentiation of soil properties in a relatively small experimental field (0.1 ha), concluded that current spatial differentiation of the physical and chemical soil properties (i.e., higher total N) did not result from primary soil-forming factors but from the different intensity of previous cultivation (higher level of plowing) in the individual sections of the field.
In our plots, the spatial variation in Nmin at the beginning of vegetation increased with depth in both CT and NT, as shown in Table 3. Small-scale variation in residual Nmin after the harvest of unfertilized plots decreased with soil depth in 1999 and increased across the soil profile of both tillage systems in 2000 (data not shown). In two other studies, the spatial variation in NO3-N in bare soil in spring [53] and under maize in June [55] decreased in CT but not in NT with increasing depth.
In our study, Nmin in the 60–90 cm soil layer at the beginning of vegetation (middle of March) was clearly higher in NT than in CT in both years. Accordingly, Kohl and Harrach [53] found that the spatial variation in nitrate concentration was always considerably higher in the subsoil (60 cm) of the NT plots than of the CT plots, which shows the effects of macropore flow. Haberle et al. [56] found coefficient of variation as the measure of the variability of nitrate N in topsoil and subsoil (0–30 and 30–60 cm) ranged between 18%–39% and 20%–37%, respectively. It was mostly the same or slightly greater in subsoil than in topsoil in respective years. Compared with CT, the small-scale distribution of soil nitrate, in June from 0–150 cm depth at 30 cm intervals was reported to be more random horizontally and vertically in untilled maize plots, continuously planted with maize and under the same tillage system for five years [55]. The content of soil Nmin varies in both dimensions, spatially and temporally. In our study, the small-scale variability of Nmin was larger after the harvest (data not shown) than at the beginning of vegetation (spring). In investigations by Goovaerts and Chiang [57], the spatial variation in potentially mineralizable N was higher in October (autumn) than in spring. Because of the high variation in potentially mineralizable N over very short distances (< 1 m), the differences in the measurements from April to October were due not only to temporal but also to spatial variation. A significant amount of fine scale variation of net N mineralization at 1.5 m (in autumn) and 4.5 m (in spring) was found in the study by Córdova et al. [38]. However, this variation was consistent in time, making sampling for N mineralization possible in either season (autumn or spring), directing spatial sampling strategies for available N and/or for monitoring purposes.

4.2. Relationship between Gw and Soil Nmin at the Beginning of Vegetation

Based on the coefficients of determination (R2) of the calculated linear regressions, the spatial variability of soil Nmin at the beginning of vegetation does not explain the variability of Gw, as a greater within-plot variation of Gw in NT compared with CT was found in 1999 when the spatial variability of Nmin was similar in both tillage systems. However, in 2000 too, we did not find a spatial relationship between Gw and Nmin (R2 ≤ 0.00 for NT and CT in both years). Bauer et al. [58] detected a spatial relationship (R2 = 0.49) between the biomass of a winter wheat cover crop in mid-May, grown after maize at 10 locations, and the amount of soil inorganic N (0–90 cm profile) plus wheat N determined in mid-March.
Variations in the Gw of winter wheat did not seem to be related to the different levels of pre-plant residual mineral N and mineralized N in the soil (0–150 cm) [21]. In a two-year investigation, Scharpf (1977) [45] demonstrated a close relationship in 1975 (R2 = 0.67) and 1976 (R2 = 0.58) between soil mineral N from 0 to 100 cm depth at the beginning of vegetation (March) and the grain yield of winter wheat in unfertilized plots. The ranges of Nmin values (≥ 120 kg Nmin ha−1) among the 114 different fields in Scharpf’s study were much larger compared with our study (29–90 kg Nmin ha−1) and included different soil types in contrast to our field with one type of soil only. A study of small-scale variability of soil properties and wheat yield revealed a higher correlation of wheat grain yield with organic matter content (r2 = 0.45) than with soil mineral N content (r2 = 0.18) collected at the end of October (0–15 cm depth) before planting wheat [59]. Mahmoudjafari et al. [60] indicated that the potential mineralization of soil organic matter is difficult to estimate because the mineralization rate is a function of soil temperature and water content, both of which can vary spatially, independent of the content of soil organic matter. Similarly, Blankenau et al. [61] argue that net N mineralization is site-specific and affected by weather conditions and amount of N applied in the fertilized plots. There are several problems related to using the spatial variability of the content of soil Nmin as a basis of the recommendations of N fertilization, e.g., high required sampling density, high temporal fluctuation of Nmin, and high costs of analyses. Even with sampling distances of 30 m, relevant spatial patterns of Nmin may be missed, so that the site-specific demand for N fertilizer cannot be predicted with sufficient accuracy [62,63,64].

4.3. Small-Scale Variability of Gw as Affected by Tillage Intensity

The large small-scale variation in Gw and biomass in NT in 1999 was due primarily to the poor and spatially heterogeneous establishment of the seedlings after a severe winter. In humid-temperate conditions, a considerable proportion (22%) of wheat yield variability can be explained by variables related to the climatic conditions by the heading stage as indicated from a 50-year long-term field experiment (1967–2016) in Switzerland [65]. The CT plants showed greater resistance to injury in winter and plant density, as shown in Table 5, and, consequently, Gw and biomass varied to a lesser extent than in NT. Similar results were reported by Brennan et al. [66], where the reduced tillage system is more susceptible to poorer establishment, and subsequently reduced NUE and Gw, in seasons with high rainfall quantities following sowing. NT systems appear less suitable under humid conditions where higher yields are observed in CT [67,68]. Plant density (plants m−2 before tillering) was a significant covariate (p ≤ 0.05) for Gw, and small-scale variability of plant density was twice as great in NT than in CT, as shown in Table 5. The greater CVs, as shown in Table 5, and the ranges of Gw and biomass in NT compared with CT in both years suggest a tendency towards greater spatial variation in yield in the NT system. In a study by Cassel et al. [31], chisel plowing to 0.27 m depth at tine intervals of 30 cm reduced small-scale variability of the maize yield compared with two shallow tillage operations. Chisel plowing uniformly removed the tillage pan constraint, which was of varying thickness, density, and hardness, and chisel plowing provided a more uniform rooting medium; variability for the chisel treatment was random [31].

4.4. Small-Scale Variability of Gw as Affected by Rate of N Fertilization

In the first growing season, the increasing rate of N fertilization clearly reduced the small-scale variation in Gw. The largest small-scale variability of Gw was found in the unfertilized control plots in both years. Unfortunately, there is limited literature on the effects of N fertilization on the small-scale variation in grain yield, but there is some information on large-scale variation [28]. Crain et al. [69] also report that little work has been done in winter wheat (Triticum aestivum L.) to determine the amount and scale of spatial variability that exists in grain yields. However, they concluded that in order to obtain the most benefit from precision farming in winter wheat, field management at a 1 m scale or less would provide the best resolution to account for spatial variability. The size of fertilizer micro plots in our study (1.5 × 1.5 m) challenges the above mentioned findings. On the large scale in a study by Pennock et al. [70], increasing the rate of N fertilization did not reduce the variability of the grain yield of spring wheat. Mulla et al. [71] found a slight reduction in the variation in grain yield of winter wheat under a spatially variable application of N fertilizer compared with uniform N fertilization at large scales; reducing N fertilization was possible without reducing grain yield. The variability of the grain yield of individual maize plants within a plot was inversely related to soil N fertility—the higher the levels of fertilizer N, the lower the yield variability [72]. Schmidt et al. [73] reported significant large-scale variability in the response of the grain yield of maize to increasing N rates among in-field locations, which represents the range in the content of organic matter in the soil within the field.

4.5. Small-Scale Variability of GPC as Affected by Tillage Intensity and Rate of N Fertilization

Grain N concentration is an important quality parameter in the processing and trading of bread wheat and malting barley. Grain N concentration of malting barley was spatially variable in each of four years, ranging from 1.2% to 2.7%; moreover, as with yield, the pattern of variability changed each year [74]. In our investigation, the extent of spatial variation in the GPC was similar under NT and CT, with the CV ranging from 3.3% to 8.3%. Similarly, Ditsch and Grove [75] found that the grain N concentration of winter wheat was not influenced by tillage in any season. Variation in the GPC decreased with the increasing rate of N fertilization in our study. Pennock et al. [70] detected the same reaction for spring wheat at a large scale.

4.6. Small-Scale Variability of NUE as Affected by Tillage Intensity and Rate of N Fertilization

The spatial variability of NUE in 1999 was remarkably higher under NT than under CT due to a greater variation in Gw and N supply, as shown in Table 5 and Table 7. Spatial variability of N supply within a field is usually the result of a combination of different initial amounts of mineral N in the soil (Nmin in spring), in homogeneous patterns of applying N fertilizer and variable rates of net mineralization during the growing season [76]. The small-scale variation in NUE decreased with increasing rate of N fertilization; this was also valid for the variation in N supply, as shown in Table 7. In a large-scale study by Fiez et al. [23], the NUE of winter wheat varied greatly depending on the landscape location, and the variation in NUE did not decrease with increasing rates of N fertilization. In their two-year study, the variation in NUE was most associated with differences in N uptake efficiency, although the N utilization efficiency also contributed to the variation. This was also the case in our study at small scales in both tillage systems.

4.7. Response of Gw to N Fertilization as Affected by Tillage System

A severe winter in the first growing season (1999) affected plant growth in the NT system stronger than in the CT system, resulting in a lower plant density before tillering in NT compared with CT. Consequently, Gw and biomass were significantly lower in NT than CT at all rates of N fertilization. That was not the case in the second growing season (2000), when the yields were similar in both systems confirming the results by Brennan et al. [66], who reported that in a cooler Atlantic climate, reduced tillage establishment systems can be used to produce similar winter wheat yields to CT systems providing weather conditions at establishment are favorable. In North Carolina (USA), the tillage system had a significant impact on the initial plant density, with the average NT plant stand being 8.3% lower than in the CT system, but the Gw of winter wheat (fertilized at 90 kg N ha−1) was not affected by tillage [77]. On silt loam in the State of Washington (550 mm annual precipitation), the yield of NT spring wheat (fertilized at 0 to 168 kg N ha−1) was 17%–40% lower than in CT with moldboard plowing [29]. No-till or minimum-till systems sometimes produce lower Gw because of a reduced availability of N [78]. Lopez-Bellido et al. [79] observed significantly higher Gw of spring wheat under CT than NT under rainfed Mediterranean conditions, but NT systems may have potential advantages over conventional systems under certain soil, climate, and management conditions [67,68]. More recent studies, for instance, indicate that NT systems exhibit similar or higher crop yields than CT in crops grown under rainfed dry conditions [68,80]. Our results agree with those of other researchers [29,78,79], who also detected significant ‘year × tillage’ and ‘year × N rate’ interactions for the Gw of wheat. A three-year tillage experiment revealed a lower Gw of winter wheat in one year in the CT plots compared to the NT plots; grain yields were higher for two years in the CT plots than in the NT plots [78]. The results of that study suggest that yearly differences in the amount and distribution of precipitation, soil temperature, and plant phenology affected the grain yield under both tillage systems.

4.8. Response of GPC to N Fertilization as Affected by Tillage System

Our results show that there are no differences in GPC between tillage systems except in the N0 plots and at the lowest rate of N fertilization (50 kg N ha−1), at which the protein concentration was significantly higher in NT than in CT, as shown in Table 6. Accordingly, Lopez-Bellido et al. [79] found a higher protein concentration and better bread-making quality of wheat in CT than in NT. The factor most influencing the quality of wheat is the rate of N fertilization; the effect of N fertilization is governed by the annual weather conditions and by the residual mineral N present in the soil [79]. During our study there was considerable year-to-year variation in the weather at the experimental sites, resulting in significant differences in soil Nmin (p ≤ 0.01) at the beginning of vegetation and in the GPC (p ≤ 0.05) between the years. In our experiment, significant increases in the GPC were found under both NT and CT at rates of 50 to 200 kg N ha−1; from 0 to 50 kg N ha−1 the GPC decreased due to a dilution effect, the so-called ‘Piper–Steenbjerg’ effect [81]. Accordingly, Lopez-Bellido et al. [79] reported that the GPC rose with increasing rates of N fertilization between 50, 100, and 150 kg N ha−1 in each tillage system. In our study, the GPC was very high at elevated levels of N fertilization, reaching 169 g kg−1 in 2000, as shown in Table 6.

4.9. Response of NUE to N Fertilization as Affected by Tillage System

A severe winter in the first growing season, and generally lower Gw in NT compared with CT at all levels of N fertilization indicated that differences in NUE existed between tillage systems. In a cooler Atlantic environment in Ireland, CT had the most consistent winter wheat yields and NUE as compared to reduced tillage (RT) at five levels of fertilizer N (0, 140, 180, 220, and 260 kg N ha−1). CT had a significantly higher mean grain yield over the three years of experimentation, but the effect of tillage varied between years [66]. This is in accordance with our findings, where in both experimental years, Gw was stable under CT but was more variable under NT due to a lower plant density after the severe winter in 1999. Plant density was a significant covariate (p ≤ 0.05) for Gw and NUE in 1999, indicating that it had a major impact on these traits. In 1999, the N supply contributed to the differences in NUE between tillage systems because N supply was significantly lower at each rate of N fertilization in NT than in CT, as shown in Table 7. After a mild winter in 2000, the NUE in NT was lower than in CT at 50 and 100 kg N ha−1, probably due to the greater immobilization of N in NT [82]. The NUE of spring wheat was significantly greater in CT than in NT at 0, 56, 112, and 168 kg N ha−1 [29]. A lower N efficiency was found in NT due to the reduced availability of N compared with CT; higher rates of N are required to recover as much N from the soil in NT as in CT [83]. In our study, the NUE decreased with higher rates of N fertilization in both years, while there were highly significant differences in NUE between the two tillage systems in 1999 only. These results support those of Huggins and Pan [29]. Sowers et al. [84] showed that a decrease in NUE with increasing N supply was associated with a reduction in N utilization and N availability efficiencies, but the efficiency of N uptake was not related to a decreased N use. Similarly, as N fertilizer rate was increased, winter wheat NUE decreased and ranged from 14.6 to 62.4 kg grain (85% dry matter; DM) kg N ha−1 in a cool Atlantic climate in Ireland [66].
When Gw, GPC, and NUE were averaged over all N treatments, as shown in Table 3, significant small-scale differences in productivity among within-plot positions were observed in both tillage systems, even though the total contents of nitrogen (Ntot) and carbon (Ctot) in the topsoil (data not shown) did not vary significantly among within-plot positions. Under both tillage systems, the Gw responded weakly to N fertilization in some stony within-plot positions; this increased the small-scale variability of the N response curves for Gw and NUE. The spatial variation in the N response curves for Gw and NUE was markedly larger in NT than in CT in 1999 because the growth of winter wheat was more sensitive to the extreme climate in winter under NT than under CT. The knowledge of spatial variation in the N response for grain yield is essential in order to improve the predictions of the spatial response of the crop to fertilizer inputs, which is the basis of varying the rate of N fertilization [70,85].

5. Conclusions

Efficient use of N fertilizers will become a key driver for sustainable agricultural systems in the future. N losses from the soil–plant system lower the nitrogen use efficiency (NUE) and are not sustainable for economic and ecological reasons. The results indicated that at low rates of N fertilization (below 150 kg N ha−1), no-tillage (NT) showed a significantly lower NUE than conventional tillage (CT) in both years of this study. Given the increasing needs for N fertilizer inputs to manage yield improvements, more understanding of the interactions with N availability and any additional benefits associated with NT is required. In our study, the yield response to N fertilizer and, consequently, NUE varied considerably at small scales under both NT and CT. Because small-scale variability of NUE was larger in NT than in CT, it is increasingly important to distribute crop residues and N fertilizer homogeneously on the soil surface in NT systems. The spatial variability of N uptake efficiency was greater than that of N utilization efficiency in our study. Hence, it is important to learn more about the variation of the N uptake efficiency within a field to improve the overall NUE. As shown in our study, not all the within-field positions were responsive to higher rates of N fertilization. Crop models dealing with the response of yield to applied N may be useful to determine new recommendations for the rate of N and to predict the wheat yield based on yield maps and their interpretation for site-specific N management. Site-specific crop management takes into account soil and crop requirements as they vary in time and space within a field and aims at enhancing NUE. However, the maximum advantages of site-specific management of N will not be realized until we improve our understanding of the causes of variability of plant-available N in different soil and crop management systems within and among growing seasons at the landscape scale.

Author Contributions

All authors contributed substantially to the work reported in this paper. Conceptualization, P.S. and W.R.; methodology, P.S., W.R., and R.-M.H.L.; investigation, R.-M.H.L. and B.S.; data curation, R.Q., B.S., C.N., and J.M.H.; writing—original draft preparation, R.-M.H.L., W.R., and R.Q.; writing—review and editing, C.N., B.S., J.M.H., R.Q., and W.R.; supervision, P.S. and W.R.; project administration, P.S.; funding acquisition, P.S. All authors have read and agreed to the published version of the manuscript.

Funding

This research received no external funding.

Acknowledgments

The authors would like to thank Käthi Sigrist, Elisabeth Mayer, Marianne Wettstein-Bättig, and Theres Rösch for their excellent technical assistance in the laboratory, and Dr. Hans-Rudolf Roth for statistical support.

Conflicts of Interest

The authors declare no conflict of interest.

References

  1. Senapati, N.; Semenov, M.A. Assessing yield gap in high productive countries by designing wheat ideotypes. Sci. Rep. 2019, 9, 5516. [Google Scholar] [CrossRef] [PubMed]
  2. FAO (Food and Agriculture Organization of the United Nations). Crop Prospects and Food Situation. GIEWS—Global Information and Early Warning System on Food and Agriculture; Trade and Markets Division: Rome, Italy, 2019; Available online: http://www.fao.org/3/ca3696en/ca3696en.pdf (accessed on 4 June 2019).
  3. Döring, T.F.; Reckling, M. Detecting global trends of cereal yield stability by adjusting the coefficient of variation. Eur. J. Agron. 2018, 99, 30–36. [Google Scholar] [CrossRef]
  4. Maestrini, B.; Basso, B. Predicting spatial patterns of within-field crop yield variability. Field Crops Res. 2018, 219, 106–112. [Google Scholar] [CrossRef]
  5. Spiertz, J.H.J.; Ewert, F. Crop production and resource use to meet the growing demand for food, feed and fuel: Opportunities and constraints. NJAS Wagening. J. Life Sci. 2009, 56, 281–300. [Google Scholar] [CrossRef] [Green Version]
  6. Rütting, T.; Aronsson, H.; Delin, S. Efficient use of nitrogen in agriculture. Nutr. Cycl. Agroecosyst. 2018, 110, 1–5. [Google Scholar] [CrossRef] [Green Version]
  7. Ladha, J.K.; Pathak, H.; Krupnik, T.J.; Six, J.; van Kessel, C. Efficiency of fertilizer nitrogen in cereal production: Retrospects and prospects. Adv. Agron. 2005, 87, 85–156. [Google Scholar] [CrossRef]
  8. Lu, C.; Tian, H. Global nitrogen and phosphorus fertilizer use for agriculture production in the past half century: Shifted hot spots and nutrient imbalance. Earth Syst. Sci. Data 2017, 9, 181–192. [Google Scholar] [CrossRef] [Green Version]
  9. Ladha, J.K.; Tirol-Padre, A.; Reddy, C.K.; Cassman, K.G.; Verma, S.; Powlson, D.S.; van Kessel, C.; Richter, D.B.; Chakraborty, D.; Pathak, H. Global nitrogen budgets in cereals: A 50-year assessment for maize, rice, and wheat production systems. Sci. Rep. 2016, 6, 19355. [Google Scholar] [CrossRef] [Green Version]
  10. Schils, R.; Olesen, J.E.; Kersebaum, K.; Rijk, B.; Oberforster, M.; Kalyada, V.; Khitrykau, M.; Gobin, A.; Kirchev, H.; Manolova, V.; et al. Cereal yield gaps across Europe. Eur. J. Agron. 2018, 101, 109–120. [Google Scholar] [CrossRef]
  11. Chien, S.H.; Prochnow, L.I.; Cantarella, H. Recent developments of fertilizer production and use to improve nutrient efficiency and minimize environmental impacts. Adv. Agron. 2009, 102, 267–322. [Google Scholar] [CrossRef]
  12. Dwivedi, B.S.; Singh, V.K.; Meena, M.C.; Dey, A.; Datta, S.P. Integrated nutrient management for enhancing nitrogen use efficiency. Indian J. Fertil. 2016, 12, 62–71. [Google Scholar]
  13. Baligar, V.C.; Bennett, O.L. Outlook on fertilizer use efficiency in the tropics. Fertil. Res. 1986, 10, 83–96. [Google Scholar] [CrossRef]
  14. Agegnehu, G.; Amede, T. Integrated soil fertility and plant nutrient management in tropical agro-ecosystems: A review. Pedosphere 2017, 27, 662–680. [Google Scholar] [CrossRef]
  15. Malhi, S.S.; Grant, C.A.; Johnston, A.M.; Gill, K.S. Nitrogen fertilization management for no-till cereal production in the Canadian great plains: A review. Soil Till. Res. 2001, 60, 101–122. [Google Scholar] [CrossRef]
  16. Sharma, L.K.; Bali, S.K. A review of methods to improve nitrogen use efficiency in agriculture. Sustainability 2018, 10, 51. [Google Scholar] [CrossRef] [Green Version]
  17. FAO (Food and Agriculture Organization of the United Nations). FAOSTAT 2017. Rome, Italy. 2017. Available online: http://www.fao.org/faostat/en/#data/QC (accessed on 23 January 2019).
  18. Bänziger, M.; Feil, B.; Schmid, J.E.; Stamp, P. Utilization of late-applied fertilizer nitrogen by spring wheat genotypes. Eur. J. Agron. 1994, 3, 63–69. [Google Scholar] [CrossRef]
  19. Noulas, C.; Stamp, P.; Soldati, A.; Liedgens, M. Nitrogen use efficiency of spring wheat genotypes under field and lysimeter conditions. J. Agron. Crop Sci. 2004, 190, 111–118. [Google Scholar] [CrossRef]
  20. Raun, W.R.; Solie, J.B.; Johnson, G.V.; Stone, M.L.; Mullen, R.W.; Freeman, K.W.; Thomason, W.E.; Lukina, E.V. Improving nitrogen use efficiency in cereal grain production with optical sensing and variable rate application. Agron. J. 2002, 94, 815–820. [Google Scholar] [CrossRef] [Green Version]
  21. Fiez, T.E.; Miller, B.C.; Pan, W.L. Assessment of spatially variable nitrogen fertilizer management in winter wheat. J. Prod. Agric. 1994, 7, 86–93. [Google Scholar] [CrossRef]
  22. Inman, D.; Khosla, R.; Westfall, D.G.; Reich, R. Nitrogen uptake across site specific management zones in irrigated corn production systems. Agron. J. 2005, 97, 169–176. [Google Scholar] [CrossRef]
  23. Fiez, T.E.; Pan, W.L.; Miller, B.C. Nitrogen use efficiency of winter wheat among landscape positions. Soil Sci. Soc. Am. J. 1995, 59, 1666–1671. [Google Scholar] [CrossRef]
  24. Mamo, M.; Malzer, G.L.; Mulla, D.J.; Huggins, D.R.; Strock, J. Spatial and temporal variation in economically optimum nitrogen rate for corn. Agron. J. 2003, 95, 958–964. [Google Scholar] [CrossRef] [Green Version]
  25. Sadler, E.J.; Busscher, W.J.; Bauer, P.J.; Karlen, D.L. Spatial scale requirements for precision farming: A case study in the Southeastern USA. Agron. J. 1998, 90, 191–197. [Google Scholar] [CrossRef] [Green Version]
  26. Funk, R.; Maidl, F.X. Heterogeneity of yield formation of winter wheat in fields of the Tertiarhugelland (Upper Bavaria) considering site-specific crop management. Pflanzenbauwissenschaften 1997, 1, 117–126. [Google Scholar]
  27. Usowicz, B.; Lipiec, J. Spatial variability of soil properties and cereal yield in a cultivated field on sandy soil. Soil Till. Res. 2017, 174, 241–250. [Google Scholar] [CrossRef]
  28. Hausherr-Lüder, R.M.; Qin, R.; Richner, W.; Stamp, P.; Noulas, C. Spatial variability of selected soil properties and its impact on the grain yield of oats (Avena sativa L.) in small fields. J. Plant Nutr. 2018, 41, 2446–2469. [Google Scholar] [CrossRef]
  29. Huggins, D.R.; Pan, W.L. Nitrogen efficiency component analysis: An evaluation of cropping system differences in productivity. Agron. J. 1993, 85, 898–905. [Google Scholar] [CrossRef]
  30. Kravchenko, A.N.; Robertson, G.P.; Thelen, K.D.; Harwood, R.R. Management, topographical, and weather effects on spatial variability of crop grain yields. Agron. J. 2005, 97, 514–523. [Google Scholar] [CrossRef] [Green Version]
  31. Cassel, D.K.; Upchurch, D.R.; Anderson, S.H. Using regionalized variables to estimate field variability of corn yield for four tillage regimes. Soil Sci. Soc. Am. J. 1986, 52, 222–228. [Google Scholar] [CrossRef]
  32. Kumar, S.; Kadono, A.; Lal, R.; Dick, W. Long-term tillage and crop rotations for 47–49 years influences hydrological properties of two soils in Ohio. Soil Sci. Soc. Am. J. 2012, 76, 2195–2207. [Google Scholar] [CrossRef]
  33. Kumar, S.; Kadono, A.; Lal, R.; Dick, W. Long-term no-till impacts on organic carbon and properties of two contrasting soils and corn yields in Ohio. Soil Sci. Soc. Am. J. 2012, 76, 1798–1809. [Google Scholar] [CrossRef] [Green Version]
  34. Singh, A.; Phogat, V.K.; Dahiya, R.; Batra, S.D. Impact of long-term zero till wheat on soil physical properties and wheat productivity under rice–wheat cropping system. Soil Till. Res. 2014, 140, 98–105. [Google Scholar] [CrossRef]
  35. Qin, R.; Noulas, C.; Herrera, J.M. Morphology and distribution of wheat and maize roots as affected by tillage systems and soil physical parameters in temperate climates: An overview. Arch. Agron. Soil Sci. 2018, 64, 747–762. [Google Scholar] [CrossRef]
  36. Tsegaye, T.; Hill, R.L. Intensive tillage effects on spatial variability of soil physical properties. Soil Sci. 1998, 163, 143–154. [Google Scholar] [CrossRef]
  37. Patni, N.K.; Masse, L.; Jui, P.Y. Groundwater quality under conventional and no-tillage: I. Nitrate, electrical conductivity and pH. J. Environ. Qual. 1998, 27, 869–877. [Google Scholar] [CrossRef]
  38. Córdova, C.; Barrera, J.A.; Magna, C. Spatial variation of nitrogen mineralization as a guide for variable application of nitrogen fertilizer to cereal crops. Nutr. Cycl. Agroecosyst. 2018, 110, 83–88. [Google Scholar] [CrossRef]
  39. WRB (World Reference Base for Soil Resources). A Framework for International Classification, Correlation and Communication; World Soil Resources Report 103; International Union of Soil Sciences, FAO: Rome, Italy, 2006. [Google Scholar]
  40. Gee, G.W.; Bauder, J.W. Particle-size analysis. In Methods of Soil Analysis: Part. 1–Physical and Mineralogical Methods; Soil Society of America: Madison, WI, USA, 1986; pp. 383–411. [Google Scholar]
  41. McLean, E.O. Soil pH and lime requirement. In Methods of Soil Analysis: Part 2–Chemical and Microbiological Properties; America Society Agronomy: Madison, WI, USA, 1982; pp. 199–224. [Google Scholar]
  42. Courvoisier, N.; Häner, L.L.; Bertossa, M.; Thévoz, E.; Anders, M.; Stoll, P.; Weisflog, T.; Dugon, J.; Graf, B.; Hofer, M. Liste der empfohlenen getreidesorten für die ernte 2018. Agrar. Schweiz 2017, 8, 1–8. [Google Scholar]
  43. Walther, U.; Ryser, J.P.; Flisch, R. Grundlagen für die Dungung im Acker-und Futterbau (GRUDAF). (Basics for fertilization in arable and fodder production). Agrarforschung 2001, 8, 1–80. (In German) [Google Scholar]
  44. Lancashire, P.D.; Bleiholder, H.; Van den Boom, T.; Langelüddeke, P.; Strauss, R.; Weber, E.; Witzenberger, A. A uniform decimal code for growth stages of crops and weeds. Ann. Appl. Biol. 1991, 119, 561–601. [Google Scholar] [CrossRef]
  45. Scharpf, H.C. Der Mineralstickstoffgehalt des Bodens als Massstab für den Stickstoffdüngerbedarf [The Mineral Nitrogen Content of the Soil as a Measure of the Nitrogen Fertilizer Requirement]. Ph.D. Thesis, Technischen Universität Hannover, Hannover, Germany, 1977. [Google Scholar]
  46. Grundy, A.C.; Boatman, N.D.; Froud-Williams, R.J. Effects of herbicide and nitrogen fertilizer application on grain yield and quality of wheat and barley. J. Agric. Sci. 1996, 126, 379–385. [Google Scholar] [CrossRef]
  47. Fiez, T.E.; Miller, B.C.; Pan, W.L. Winter wheat yield and grain protein across varied landscape positions. Agron. J. 1994, 86, 1026–1032. [Google Scholar] [CrossRef]
  48. Jenkinson, D.S.; Fox, R.H.; Rayner, J.H. Interactions between fertilizer nitrogen and soil nitrogen-the so-called ‘priming’ effect. J. Soil Sci. 1985, 36, 425–444. [Google Scholar] [CrossRef]
  49. Systat Software, Inc. SYSTAT for Windows (Version 10); Systat Software, Inc.: San Jose, CA, USA, 2000. [Google Scholar]
  50. Robertson, G.P.; Crum, J.R.; Ellis, B.G. The spatial variability of soil resources following long-term disturbance. Oecologia 1993, 96, 451–456. [Google Scholar] [CrossRef] [PubMed]
  51. Salinas-Garcia, J.R.; Hons, F.M.; Matocha, J.E. Long-term effects of tillage and fertilization on soil organic matter dynamics. Soil Sci. Soc. Am. J. 1997, 61, 152–159. [Google Scholar] [CrossRef]
  52. Rieger, S.; Richner, W.; Streit, B.; Frossard, E.; Liedgens, M. Growth, yield, and yield components of winter wheat and the effects of tillage intensity, preceding crops, and N fertilization. Eur. J. Agron. 2008, 28, 405–411. [Google Scholar] [CrossRef]
  53. Kohl, R.; Harrach, T. Zeitliche und räumliche Variabilität der Nitratkonzentration in der Bodenlösung in einem langjährigen Bodenbearbeitungsversuch [Long-term tillage effects on the variations of nitrate in the soil water]. Z. Kulturtechn. Landentw. 1991, 32, 80–87. [Google Scholar]
  54. Gałka, B.; Kabała, C.; Karczewska, A.; Sowiński, J. Variability of soil properties in an intensively cultivated experimental field. Soil Sci. Ann. 2016, 67, 10–16. [Google Scholar] [CrossRef] [Green Version]
  55. Mohanty, B.P.; Kanwar, R.S. Spatial variability of residual nitrate-nitrogen under two tillage systems in central Iowa: A composite three-dimensional resistant and exploratory approach. Water Resour. Res. 1994, 30, 237–251. [Google Scholar] [CrossRef]
  56. Haberle, J.; Kroulík, M.; Svoboda, P.; Lipavský, J.; Krejčová, J.; Cerhanová, D. The spatial variability of mineral nitrogen content in topsoil and subsoil. Plant Soil Environ. 2004, 50, 425–433. [Google Scholar] [CrossRef] [Green Version]
  57. Goovaerts, P.; Chiang, C.N. Spatial and temporal relationships between potentially mineralizable N and selected soil properties in a small fallow plot. Pedologie 1992, 41, 21–37. [Google Scholar]
  58. Bauer, P.J.; Sadler, E.J.; Busscher, W.J. Spatial analysis of biomass and N accumulation of a winter wheat cover crop grown after a drought-stressed corn crop in the SE coastal plain. J. Soil Water Conserv. 1998, 53, 259–262. [Google Scholar]
  59. Bhatti, A.U.; Bakhsh, A.; Afzal, M.; Gurmani, A.H. Spatial variability of soil properties and wheat yields in an irrigated field. Commun. Soil Sci. Plant Anal. 1999, 30, 1279–1290. [Google Scholar] [CrossRef]
  60. Mahmoudjafari, M.; Kluitenberg, G.J.; Havlin, J.L.; Sisson, J.B.; Schwab, A.P. Spatial variability of nitrogen mineralization at the field scale. Soil Sci. Soc. Am. J. 1997, 61, 1214–1221. [Google Scholar] [CrossRef]
  61. Blankenau, K.; Olfs, H.W.; Kuhlmann, H. Effect of microbial nitrogen immobilization during the growth period on the availability of nitrogen fertilizer for winter cereals. Biol. Fertil. Soils 2000, 32, 157–165. [Google Scholar] [CrossRef]
  62. Haneklaus, S.; Schroeder, D.; Schnug, E. Decision making strategies for fertilizer use in precision agriculture. In Proceedings of the Fourth International Conference on Precision Agriculture; Robert, P.C., Rust, R.H., Larson, W.E., Eds.; ASA, CSSA, SSSA: St. Paul, MN, USA, 1999; pp. 1785–1796. [Google Scholar]
  63. Haneklaus, S.; Schnug, E. Site specific nutrient management—Objectives, current status and future research needs. In Handbook of Precision Agriculture—Principles and Applications; Srinivasan, A., Ed.; CRC Press: Boca Raton, FL, USA, 2006; pp. 91–151. [Google Scholar]
  64. Schmidt, J.P.; Dellinger, A.E.; Beegle, D.B. Nitrogen recommendations for corn: An on-the-go sensor compared with current recommendation methods. Agron. J. 2009, 101, 916–924. [Google Scholar] [CrossRef]
  65. De Sanginés Cárcer, P.; Sinaj, S.; Santonja, M.; Fossati, D.; Jeangros, B. Long-term effects of crop succession, soil tillage and climate on wheat yield and soil properties. Soil Till. Res. 2019, 190, 209–219. [Google Scholar] [CrossRef]
  66. Brennan, J.; Hackett, R.; McCabe, T.; Grant, J.; Fortune, R.A.; Forristal, P.D. The effect of tillage system and residue management on grain yield and nitrogen use efficiency in winter wheat in a cool Atlantic climate. Eur. J. Agron. 2014, 54, 61–69. [Google Scholar] [CrossRef]
  67. Martínez, E.; Fuentes, J.P.; Silva, P.; Valle, S.; Acevedo, E. Soil physical properties and wheat root growth as affected by no-tillage and conventional tillage systems in a Mediterranean environment of Chile. Soil Till. Res. 2008, 99, 232–244. [Google Scholar] [CrossRef]
  68. Pittelkow, C.M.; Linquist, B.A.; Lundy, M.E.; Liang, X.; van Groenigen, K.J.; Lee, J.; van Gestel, N.; Six, J.; Venterea, R.T.; van Kessel, C. When does no-till yield more? A global meta-analysis. Field Crops Res. 2015, 183, 156–168. [Google Scholar] [CrossRef] [Green Version]
  69. Crain, J.L.; Waldschmidt, K.M.; Raun, W.R. Small-Scale Spatial Variability in Winter Wheat Production. Commun. Soil Sci. Plant Anal. 2013, 44, 2830–2838. [Google Scholar] [CrossRef]
  70. Pennock, D.J.; Walley, F.L.; Solohub, M.P.; Hnatowich, G. Yield response of wheat and canola to a topographically based variable rate fertilization program in Saskatchewan. In Proceedings of the Fourth International Conference on Precision Agriculture; Robert, P.C., Rust, R.H., Larson, W.E., Eds.; ASA, CSSA, SSSA: St. Paul, MN, USA, 1999; pp. 797–805. [Google Scholar]
  71. Mulla, D.J.; Bhatti, A.U.; Hammond, M.W.; Benson, J.A. A comparison of winter wheat yield and quality under uniform versus spatially variable fertilizer management. Agric. Ecosyst. Environ. 1992, 38, 301–311. [Google Scholar] [CrossRef]
  72. Ma, B.L.; Dwyer, L.M. Within plot variability in available soil mineral nitrogen in relation to leaf greenness and yield. Commun. Soil Sci. Plant Anal. 1999, 30, 1919–1928. [Google Scholar] [CrossRef]
  73. Schmidt, J.P.; DeJoia, A.J.; Ferguson, R.B.; Taylor, R.K.; Young, R.K.; Havlin, J.L. Corn yield response to nitrogen at multiple in-field locations. Agron. J. 2002, 94, 798–806. [Google Scholar] [CrossRef]
  74. Stafford, J.V. An investigation into the within-field spatial variability of grain quality. Precis. Agric. 1999, 99, 353–364. [Google Scholar]
  75. Ditsch, D.C.; Grove, J.H. Influence of tillage on plant populations, disease incidence, and grain yield of two soft red winter wheat cultivars. J. Prod. Agric. 1991, 4, 360–365. [Google Scholar] [CrossRef]
  76. Van Noordwijk, M.; Wadman, W.P. Effects of spatial variability of nitrogen supply on environmentally acceptable nitrogen fertilizer application rates to arable crops. NJAS Wagening. J. Agric. Sci. 1992, 40, 51–72. [Google Scholar]
  77. Weisz, R.; Bowman, D.T. Influence of tillage system on soft red winter wheat cultivar selection. J. Prod. Agric. 1999, 12, 415–418. [Google Scholar] [CrossRef]
  78. Rao, S.C.; Dao, T.H. Fertilizer placement and tillage effects of nitrogen assimilation by wheat. Agron. J. 1992, 84, 1028–1032. [Google Scholar] [CrossRef]
  79. Lopez-Bellido, L.; Lopez-Bellido, R.J.; Castillo, J.E.; Lopez-Bellido, F.J. Effects of long-term tillage, crop rotation and nitrogen fertilization on bread-making quality of hard red spring wheat. Field Crops Res. 2001, 72, 197–210. [Google Scholar] [CrossRef]
  80. Taner, A.; Arisoy, R.Z.; Kaya, Y.; Gültekin, I.; Partigöç, F. The effects of various tillage systems on grain yield, quality parameters and energy indices in winter wheat production under the rainfed conditions. Fresenius Environ. Bull. 2015, 24, 1463–1473. [Google Scholar]
  81. Wikström, F. A theoretical explanation of the Piper-Steenbjerg effect. Plant Cell Environ. 1994, 17, 1053–1060. [Google Scholar] [CrossRef]
  82. Rice, C.W.; Smith, M.S. Short-term immobilisation of fertilizer nitrogen at the surface of no-till and plowed soils. Soil Sci. Soc. Am. J. 1984, 48, 295–297. [Google Scholar] [CrossRef]
  83. Bandel, V.A.; Dzienia, S.; Stanford, G.; Legg, J.O. N behavior under no-till vs conventional com culture. I. First year results using unlabeled N fertilizer. Agron. J. 1975, 67, 782–786. [Google Scholar] [CrossRef]
  84. Sowers, K.E.; Pan, W.L.; Miller, B.C.; Smith, J.L. Nitrogen use efficiency of split nitrogen applications in soft white winter wheat. Agron. J. 1994, 86, 942–948. [Google Scholar] [CrossRef]
  85. Wong, M.T.F.; Asseng, S. Determining the causes of spatial and temporal variability of wheat yields at sub-field scale using a new method of upscaling a crop model. Plant Soil 2006, 283, 203–215. [Google Scholar] [CrossRef]
Figure 1. Scheme of one replication with two adjacent tillage plots; NT = no-tillage and CT = conventional tillage. The numbers 1 to 4 stand for the microplot groups, which were considered to be within-plot positions; the letters ‘a’ to ‘f ’ correspond to the microplots. The levels of N (0, 50, 100, 150, 200, and 250 kg N ha−1) were randomly assigned to the microplots ‘a’ to ‘f ’. In total, there were 12 randomized N-rate experiments (4 microplots × 3 replications) for each tillage system in each year.
Sustainability 12 03621 g001
Figure 2. Variation of soil mineral Nmin (in 0–90 cm depth) across all microplots at the start of the vegetation period, before the first application of N fertilizer in conventionally tilled (CT) and non-tilled (NT) winter wheat plots in two years. 1999, n = 60; 2000, n = 72. Mean, dotted line; median, solid line.
Sustainability 12 03621 g002
Figure 3. N-response functions of grain yield, grain protein concentration, and N-efficiency of grain yield for conventionally tilled (CT) and untilled (NT) winter wheat in two years, calculated for values from 12 within-plot positions. Vertical bars represent 95% confidence intervals of these values. 1)R2 values in parentheses originate from the calculation of response functions for trait means across within-plot positions.
Sustainability 12 03621 g003
Table 1. Levels of N fertilization with splitting of the total N fertilizer rates and timing of N applications.
N Fertilization Level (kg N ha−1)
Growth stage050100150200250
BBCH stage 2110306090 2120 2150 2
BBCH stage 31 101020304050
BBCH stage 51 101020304050
1 According to Lancashire et al. [44]; BBCH coding system; Biologische Bundesanstalt Bundessortenamt und CHemische Industrie: BBCH stage 21 = leaf development to tillering; BBCH stage 31 = beginning of stem elongation; BBCH stage 51 = beginning of heading. 2 Split into two applications.
Table 2. Definition and calculation of N use efficiency (NUE) and its components (all in kg kg−1) according to Huggins and Pan [29].
NUE ParameterRatioDescription
N use efficiency (NUE)Gw/NsGrain yield (Gw) produced per unit of N supply (Ns)
N uptake efficiency Nt/NsTotal aboveground plant N content (Nt) per unit of N supply (Ns)
N utilization efficiency Gw/Nt Grain yield (Gw) produced per unit of total aboveground plant N (Nt)
Gw = grain yield; Ns = N supply; Nt = total aboveground plant N content at physiological maturity.
Table 3. ANOVA for the effect of ‘Tillage’ (NT = no-tillage, CT = conventional tillage), ‘Within-plot position’ (4 groups of microplots per plot), and five (1999) and six (2000) ‘N-fertilization levels’ (Nfer) on soil and plant parameters: soil Nmin (kg ha−1) at the beginning of vegetation (0–90 cm), grain yield (Gw) (Mg ha−1), grain protein concentration (GPC) (g kg−1), grain N yield (Ngr) (kg ha−1), aboveground plant N uptake (Nt) (kg ha−1), N supply (Ns) (kg ha−1), NUE for grain yield (Gw/Ns) (kg kg−1), nitrogen uptake efficiency (Nt/Ns) (kg kg−1), and nitrogen utilization efficiency (Gw/Nt) (kg kg−1).
Source of VariationdfNminGwGPCNgrNtNsGw/NsNt/NsGw/Nt
1999
Tillage1ns*ns***ns**ns
Replication2nsnsnsnsnsnsns
Error a2
Within-plot position18**********************
Nfer4ns**********************
Nfer × Tillage4nsns***nsns*ns*
Pooled error88
R20.710.910.850.920.920.990.770.720.78
CV (%)17.313.14.312.514.113.814.312.812.4
2000
Tillage1nsnsnsnsns*nsns
Replication2ns***********
Error a2
Within plot position18***************************
Nfer5ns************************
Nfer × Tillage5nsnsnsnsnsnsnsnsns
Pooled error110
R20.670.850.880.880.910.980.840.750.92
CV (%)15.810.54.911.412.113.415.213.38.1
†, *, **, ***, Significant at the 0.1, 0.05, 0.01, and 0.001 probability levels, respectively; ns, not significant.
Table 4. Means and, in parentheses, coefficients of variation (CV %) of soil mineral N (Nmin) and total soil N (Ntot) averaged over all microplots at the start of vegetation in different soil layers (0–90 cm) in conventionally tilled (CT) and non-tilled (NT) winter wheat plots in two years. 1999, n = 60; 2000, n = 72.
19992000
Nmin (kg ha−1)NTCTpNTCTp
0–15 (cm)9.6(28.3)6.8(33.0)ns20.6(28.8)17.0(16.2)ns
15–307.0(33.9)6.2(30.9)ns16.2(26.3)18.7(17.6)ns
30–6010.2(35.6)7.7(35.3)ns22.0(48.8)24.3(35.2)ns
60–908.7(40.2)7.2(46.1)ns15.9(49.7)11.6(45.2)ns
0–9035.6(23.3)27.7(25.6)ns74.8(29.5)71.6(16.9)ns
Ntot (g kg−1)NTCTpNTCTp
0–15 (cm)2.2(17.0)1.8(17.7)2.3(9.3)2.0(9.8)
15–301.4(26.6)1.7(19.9)ns1.7(18.5)2.0(12.6)ns
30–60No samples analyzed1.1(32.2)1.3(25.4)ns
60–900.8(32.2)0.8(34.9)ns
†, Significant at the 0.1 probability level; ns, not significant.
Table 5. Means and, in parentheses, coefficients of variation (CV %) of grain yield (Gw), total aboveground biomass (both on dry matter basis), plant density before tillering (plants m−2), and ear density at harvest (ears m−2) of winter wheat as influenced by tillage intensity (CT = conventional tillage, NT = no-tillage) and N fertilization rate (kg ha−1) in 2 years. Values are means across 12 within-plot positions (n = 12).
Gw (Mg ha−1)Total Biomass (Mg ha−1)Plant dens. (Plants m−2)Ear Density (Ears m−2)
N RateCTNTpCTNTpCTNTpCTNTp
1999
03.33(22.1)1.81(38.7)***9.62(15.0)5.55(28.5)***71(14)38(36)***277(17)173(34)***
504.57(7.4)2.78(25.4)***11.83(7.4)7.64(19.6)***69(15)49(31)***337(8)234(21)***
1005.10(8.6)3.53(26.3)***13.45(11.7)9.12(18.5)***66(12)53(25)***365(11)286(20)***
1506.32(8.5)4.27(23.9)***15.51(9.0)10.90(19.7)***70(13)45(44)***442(9)323(24)***
2006.41(12.0)4.93(21.2)***15.64(12.5)12.17(18.7)***69(18)38(27)***449(16)357(20)***
2000
03.05(22.4)3.22(20.3)ns6.69(18.5)7.17(19.1)ns343(13)310(18)ns
504.69(7.7)4.38(14.8)ns10.22(9.5)9.77(14.7)ns403(16)372(10)ns
1005.25(10.9)5.02(10.3)ns11.77(11.9)11.57(11.7)nsNot assessed434(15)425(20)ns
1505.55(12.3)5.58(14.3)ns12.85(12.4)13.48(14.4)ns448(22)470(13)ns
2005.83(14.9)5.29(18.0)*13.48(12.5)12.72(18.3)ns465(17)481(11)ns
2505.62(15.3)5.60(21.8)ns14.42(16.7)14.12(20.5)ns472(12)494(17)ns
* and *** are significant at the 0.05 and 0.001 probability levels, respectively; ns, not significant.
Table 6. Means and, in parentheses, coefficients of variation (CV %) of grain protein concentration (GPC) (g kg−1), grain N yield (Ngr) (kg ha−1), and aboveground plant N uptake (Nt) (kg ha−1) of winter wheat as influenced by tillage intensity (CT = conventional tillage, NT = no-tillage) and N fertilization rate in two years. Values are means across 12 within-plot positions (n = 12).
GPC (g kg−1)Ngr (kg ha−1)Nt (kg ha−1)
N RateCTNTpCTNTpCTNTp
1999
0119(5.3)132(8.3)***68.9(19.5)41.7(39.9)***97.6(18.1)63.5(34.5)***
50115(6.7)122(7.5)**92.3(10.1)59.0(24.8)***124.7(10.4)83.5(21.9)***
100122(5.8)124(7.7)ns108.6(7.4)76.5(26.4)***150.8(8.8)109.4(26.5)***
150137(4.7)136(7.3)ns151.4(10.9)101.8(24.3)***208.2(10.8)153.0(24.7)***
200143(3.7)144(4.0)ns161.0(11.9)125.2(21.5)***225.5(11.8)186.3(21.3)***
2000
0129(8.1)129(6.8)ns69.3(27.1)73.5(24.5)ns84.9(26.7)91.8(24.3)ns
50124(8.1)131(7.2)*102.1(12.7)101.1(18.7)ns125.6(15.0)124.5(18.6)ns
100141(6.4)142(5.1)ns129.4(11.1)125.2(11.7)ns161.0(12.9)157.8(13.7)ns
150154(5.6)153(5.0)ns149.9(11.1)150.1(15.9)ns193.2(11.3)199.6(16.0)ns
200166(3.3)163(5.1)ns169.0(13.1)150.7(17.0)**225.5(12.0)204.0(13.7)*
250168(3.9)169(6.1)ns166.1(16.5)164.0(18.3)ns249.9(17.6)245.3(17.8)ns
*, **, *** Significant at the 0.05, 0.01, and 0.001 probability levels, respectively; ns, not significant.
Table 7. Means and, in parentheses, coefficients of variation (CV %) of nitrogen use efficiency (NUE) for grain yield (Gw/Ns), N uptake efficiency (Nt/Ns), N utilization efficiency (Gw/Nt), and N supply (Ns) for winter wheat as influenced by tillage intensity (CT = conventional tillage, NT = no-tillage) and N fertilization rate (kg ha−1) in two years. Values are means across 12 within-plot positions (n = 12).
Gw/Ns (kg kg −1)Nt/Ns (kg kg −1)Gw/Nt (kg kg −1)N Supply (Ns) (kg ha−1)
N RateCTNTpCTNTpCTNTpCTNTp
1999
023.1(18.6)14.5(38.8)***0.68(12.4)0.50(25.2)***34.0(9.1)28.0(21.3)***145.2(16.3)129.3(31.7)***
5023.6 (13.0)15.9(32.0)***0.64(13.4)0.47(22.0)***36.8(7.8)33.2(14.5)**196.2(13.2)182.7(21.7)***
10020.9(14.9)15.5(24.2)***0.62(10.8)0.48(17.9)***33.9(8.3)32.5(13.4)ns246.5(10.1)230.2(17.2)***
15021.6(15.9)15.5(23.4)***0.71(17.1)0.55(21.1)***30.4(4.1)28.1(13.8)*295.8(9.5)277.7(15.1)***
20018.5(15.5)15.1(23.5)**0.65(15.2)0.57(22.0)*28.5(5.2)26.6(7.0)348.0(8.0)329.4(13.3)***
2000
016.2(19.1)16.5(19.1)ns0.45(22.9)0.47(20.9)ns36.3(8.1)35.5(6.5)ns191.1(21.9)197.3(18.3)ns
5020.4(20.1)18.5(21.6)*0.54(22.2)0.52(22.3)ns37.9(10.0)35.5(7.3)**237.0(17.4)242.2(16.1)ns
10018.5(18.3)17.4(15.5)0.57(16.4)0.54(15.6)ns32.8(9.3)32.0(7.6)ns287.8(13.8)293.8(13.7)ns
15016.6(18.3)16.5(18.4)ns0.58(17.3)0.58(16.7)ns28.8(7.5)28.2(8.9)ns340.5(12.8)344.1(11.8)ns
20015.4(20.2)13.6(21.8)*0.59(16.6)0.52(15.4)**25.9(8.5)25.8(8.3)ns384.3(10.0)391.0(8.9)ns
25012.9(20.4)13.0(28.8)ns0.57(20.4)0.57(23.2)ns22.7(9.3)22.7(9.6)ns439.4(9.5)437.7(12.1)ns
†, *, **, *** Significant at the 0.1, 0.05, 0.01, and 0.001 probability levels, respectively; ns, not significant.
Table 8. Equations of fertilizer N-response curves for winter wheat grain yield (Gw), grain protein concentration (GPC), and nitrogen use efficiency (NUE) for grain yield (Gw/Ns) as affected by tillage intensity (CT = conventional tillage, NT = no-tillage) across 12 within-plot positions in two years.
YearGw (Mg ha−1)GPC (g kg−1)Gw/Ns (kg kg −1)
1999NTy = 1.83 + 0.019 x − 1.78 e−5 x2y = 132 − 0.42 x + 4.6 e−3 x2 − 1.1 e−5 x3y = 14.7+ 0.02 x − 9.1 e−5 x2
CTy = 3.33 + 0.025 x − 4.59 e−5 x2y = 119 − 0.28 x + 4.5 e−3 x2 − 1.2 e−5 x3y = 23.2 − 6.9 e−4 x − 1.1 e−4 x2
2000NTy = 3.29 + 0.023 x − 5.76 e−5 x2y = 129 − 0.03 x + 2.0 e−3 x2 − 5.1 e−6 x3y = 17.1 + 0.02 x − 1.4 e−4 x2
CTy = 3.19 + 0.028 x − 7.41 e−5 x2y = 128 − 0.21 x + 4.3 e−3 x2 − 1.1 e−5 x3y = 17.2 + 0.04 x − 2.2 e−4 x2

