Article

Development of a Decision Support Model Based on Machine Learning for Applying Greenhouse Gas Reduction Technology

Department of Architectural Engineering, Hanyang University, 55 Hanyangdaehak-ro, Sangnok-gu, Ansan 15588, Korea
*
Author to whom correspondence should be addressed.
Sustainability 2020, 12(9), 3582; https://doi.org/10.3390/su12093582
Submission received: 28 February 2020 / Revised: 22 March 2020 / Accepted: 22 April 2020 / Published: 28 April 2020
(This article belongs to the Section Sustainable Engineering and Science)

Abstract

:
Multiple nations have implemented policies for greenhouse gas (GHG) reduction since the 21st Conference of Parties (COP 21) at the United Nations Framework Convention on Climate Change (UNFCCC) in 2015. In this convention, participants voluntarily agreed to a new climate regime that aimed to decrease GHG emissions. Subsequently, a reduction in GHG emissions with specific reduction technologies (renewable energy) to decrease energy consumption has become a necessity and not a choice. With the launch of the Korean Emissions Trading Scheme (K-ETS) in 2015, Korea has certified and financed GHG reduction projects to decrease emissions. To help the user make informed decisions for economic and environmental benefits from the use of renewable energy, an assessment model was developed. This study establishes a simple assessment method (SAM), an assessment database (DB) of 1199 GHG reduction technologies implemented in Korea, and a machine learning-based GHG reduction technology assessment model (GRTM). Additionally, we make suggestions on how to evaluate economic benefits, which can be obtained in conjunction with the environmental benefits of GHG reduction technology. Finally, we validate the applicability of the assessment model on a public building in Korea.

1. Introduction

After the adoption of the Kyoto Protocol at the United Nations Framework Convention on Climate Change in 1997, many countries globally, including Korea, have made considerable efforts to reduce greenhouse gas (GHG) emissions. In particular, the energy efficiency of buildings has been emphasized both in Korea and abroad, and many countries are strengthening building energy efficiency policies by regulating building design standards, promoting green retrofits, and mandating zero-energy buildings [1]. To successfully reduce GHG emissions across the country, led by the public sector, Korea included a ‘robust implementation system for a new climate regime’ in its 100 policy tasks, that required public institutions to reduce GHG emissions [2]. As a result, starting in 2020, any newly constructed building owned by public institutions is obligated to implement zero energy and make a 30% reduction in baseline emissions (the mean GHG emissions of 2007, 2008, and 2009) by 2030 [3]. However, a lack of expertise and understanding presents a serious challenge to the implementation of this system and is the primary reason for stronger policies not being as effective as intended.
Several studies have been conducted to establish energy reduction policies or analyze the effect of GHG emissions reductions from the use of renewable energy. Moreover, using the Emissions Trading System (ETS), a system designed to support GHG reductions, public institutions have voluntarily conducted external GHG reduction projects, certified their emission reductions, and obtained economic benefits from emissions trading [4]. Previous studies on the efficiency and control of GHGs have developed a GHG emissions prediction system that identifies factors contributing to variations in emissions along with an emissions assessment control system, which compares different buildings based on the developed prediction model. Notably, Chae (2017) used a data mining technique to boost the renewable energy market and compared GHG emissions to select an optimal building for remodeling [5]. Jang (2018) predicted energy production from real-time solar power generation data based on machine learning [6]. Nakane (2018) reviewed a reduction in energy consumption by replacing ordinary lights with LED lights and analyzed the effect on GHG emission reductions. Singh (2015) proposed GHG reduction guidelines for the 2030 GHG emissions outlook as part of eco-friendly policy support [7,8]. Further analysis on the effect of renewables on energy reduction is necessary. Additionally, national policies, along with economic and environmental decision-making for renewable energy, must be modified based on the results of a comprehensive assessment of energy consumption characteristics in buildings.
After the World Economic Forum in Davos, Switzerland, in January 2016, the idea of a fourth Industrial Revolution has become a contentious issue worldwide. The fourth Industrial Revolution refers to a consumer-tailored economy based on tech automation and is an era where the world is understood through artificial intelligence (AI) [9]. AI refers to a technology that analyzes data through visualization, machine learning, and data mining to find better solutions. In AI, machine learning is a technique that reads vast amounts of data, finds an algorithm, and predicts changes. In the field of environmental architecture, there are a growing number of cases that apply machine learning to a prediction system for economic and environmental benefits. When comparing the predictive power between models that apply a traditional statistical technique and models that utilize a machine learning technique, various studies have shown that the model using machine learning had a higher level of predictive power [10].
Therefore, in this study, we propose an optimal machine learning-based model for GHG reduction projects with a high level of predictive power that uses actual renewable energy sources and cases of external GHG reduction projects. We believe that this model is superior to high-cost, low-efficiency methods such as energy simulation. Through this work, we aim to help select projects with the most significant economic and environmental benefits when compared to the actual energy consumption of an existing building. This can be achieved by considering the energy production in GHG reduction projects that encompass renewable energy, installation cost, efficiency, and energy consumption by use and source, all of which affect emission reductions. To develop the model, we analyzed 1199 cases and 21,411 data of renewable energy sources established by local governments in Korea as well as external GHG reduction projects. We built a DB of certified GHG emission reductions (Korean Offset Credit (KOC)) based on the use of renewable energy, which we then used as a baseline to establish a machine learning-based model to support decision making for GHG reduction projects. To analyze the predictive power of the established model, we used principal component analysis (PCA), selected gradient boosting regression tree (GBRT), support vector machine (SVM), and deep neural network (DNN) machine learning algorithms optimized for the baseline data established in this study. We also validated the predictive power of machine learning techniques by comparing their predictive power with the multiple regression model. Unlike previous studies that have only compared predictive power between different models, this study reviews the applicability of machine learning to GHG reduction technologies by analyzing calculated numerical values.

2. Construction of the SAM

In this study, essential factors for an integrated assessment system were analyzed. To develop this system, an evaluation DB and model were created. To implement each model, a reduced GHG emissions evaluation method using eco-friendly technology and DBs was also established. Based on the developed DB, we ascertained the optimal model using machine learning techniques and reviewed the applicability of the developed DB and optimal model while identifying economic and environmental benefits.

2.1. Analysis of Target and Data Collection

The Korean government subsidizes certain portions of installation costs to help spread the adoption of renewable energy. In response, businesses have been introducing government-subsidized renewable energy sources such as solar power, solar thermal energy, and geothermal energy, along with efficient technologies including high-efficiency lighting, LED lighting, and eco-friendly vehicles [11]. As reduced energy consumption in eco-friendly vehicles can be converted into economic benefits, this study includes eco-friendly vehicles in GHG reduction technologies. We defined the introduction of renewable energy and high-efficiency equipment as ‘GHG reduction technologies’. These technologies are recognized as certified emission reductions in the ETS.
A public institution that conducts greenhouse gas reduction technology business converts Korean Offset Credit (KOC) to Korean Credit Unit (KCU) and trades for about 19 USD for 1 tonCO2-eq.
In this study, a method for calculating the amount of energy reduction and offset emissions by greenhouse gas reduction technology was proposed and a database was established to convert it into economic value. The raw data constructed by the method were used to develop a model for selecting greenhouse gas reduction technologies using machine learning.
Table 1 shows the status used as basic data in this study of renewable energy reported from 2015 to 2018. Our study established evaluation databases for GHG reduction technologies. Out of 1199 projects, solar power accounted for the highest number of projects at 436 (36%), followed by high-efficiency lighting (LED) at 194 (16%). It is easier to install and maintain high-efficiency lighting and solar power for buildings that are currently in operation, which has made these technologies the preferred option for such buildings. However; solar power and high-efficiency lighting (LED) accounted for 69% of the total project cost, which was 236 million USD. This suggests that these preferred GHG reduction projects are not very efficient in comparison to their project cost.

2.2. Calculation Method for GHG Reduction

The methods used to calculate emission reduction from GHG technology include a direct calculation using variables, and another using statistical data [12]. To calculate the certified emission reductions for a specific GHG reduction technology, the amount of energy produced or reduced by the technology must first be determined. In our study, we proposed a direct estimation of energy production and reduction according to the application of GHG reduction technology. The results were used as basic data of the evaluation DB.
The method used to calculate the amount of energy produced along with certified GHG emission reductions (KOC) is shown in Table 2.
Solar power refers to a method of power generation that directly converts solar energy into electrical energy using the photoelectric effect. Annual electricity production from solar power can be calculated using capacity, the number of installed systems, electricity use rate, and operating time as coefficients [13].
Solar thermal energy systems collect solar energy to heat or pre-heat water and are often used as an energy source of water heating. The annual amount of energy produced by solar thermal collectors can be calculated by considering the installed area of the collectors, the number of households with collectors, the total reduction from the energy source, and the number of operating days. Geothermal energy refers to energy in the ground, including hot water and stones located deep underground.
It is used as a source of energy for cooling and heating in buildings. We calculated the energy production for solar power, solar thermal energy, and geothermal energy by applying operating time and electricity use rate to the installed capacity of these sources.
Rooftop greening energy reduction was calculated using its area and reduced electricity per unit area after the project.
Table 3 shows the daily storage application factors for each fuel to calculate energy production and savings through greenhouse gas reduction technology.
The efficiency of the equipment among the calculations of the daily storage application factors was calculated using the statistical estimates provided by the Greenhouse Gas Reduction Plan Establishment Guideline of the Ministry of Environment and Renewable Energy Introduction Guidelines of National Agency for Administrative City Construction. When the energy production of greenhouse gas reduction technology is not monitored, the daily storage application factor was calculated by considering the load factor, the average daily operating time, and the geothermal performance factor (GFC).
When electricity is used as the energy source for heating and cooling energy of a building, the geothermal performance factor (GFC) is calculated in consideration of the load factor, the average daily operating time, and the geothermal heating performance coefficient, and the unit conversion factor is 860 (Mcal/MWh) was applied [14,15].
The GFC of cooling energy was calculated by considering the geothermal heating performance coefficient and the geothermal cooling performance coefficient. For the SFC, the daily storage amount of the solar heat collector, it was calculated by applying the daily solar radiation, heat collector efficiency, and the same unit conversion factor as the GFC. To evaluate high-efficiency equipment in projects certified by the ETS as emission reductions for public institutions, we divided external GHG reduction projects that utilized high-efficiency equipment by high-efficiency lighting, LED streetlight installation, and rooftop greening [16]. For high-efficiency equipment such as rooftop greening, high-efficiency lighting, LED street light installation, electric vehicles, and natural gas vehicles, the amount of energy reduced was calculated by comparing energy consumption before and after the project. The energy consumption of high-efficiency lighting and LED street light installations was calculated using electricity consumption, the number of installed lights, and the light-off time. Based on the Lighting Equipment Supply and Utilization Survey Report prepared by the Ministry of Trade, Industry, and Energy and the Korea Energy Agency, high-efficiency lighting is 5.3 h and LED streetlight installation is 10 h for light-off time [17].
GHG reductions were calculated by applying GHG emission factors for each energy source to the results of energy production and reductions. To establish the standard environmental assessment DB for GHG reduction projects, our study converted the amount of energy produced and reduced by the GHG reduction technology into GHG emission reductions while developing an assessment database with GHG emissions as the basic unit.

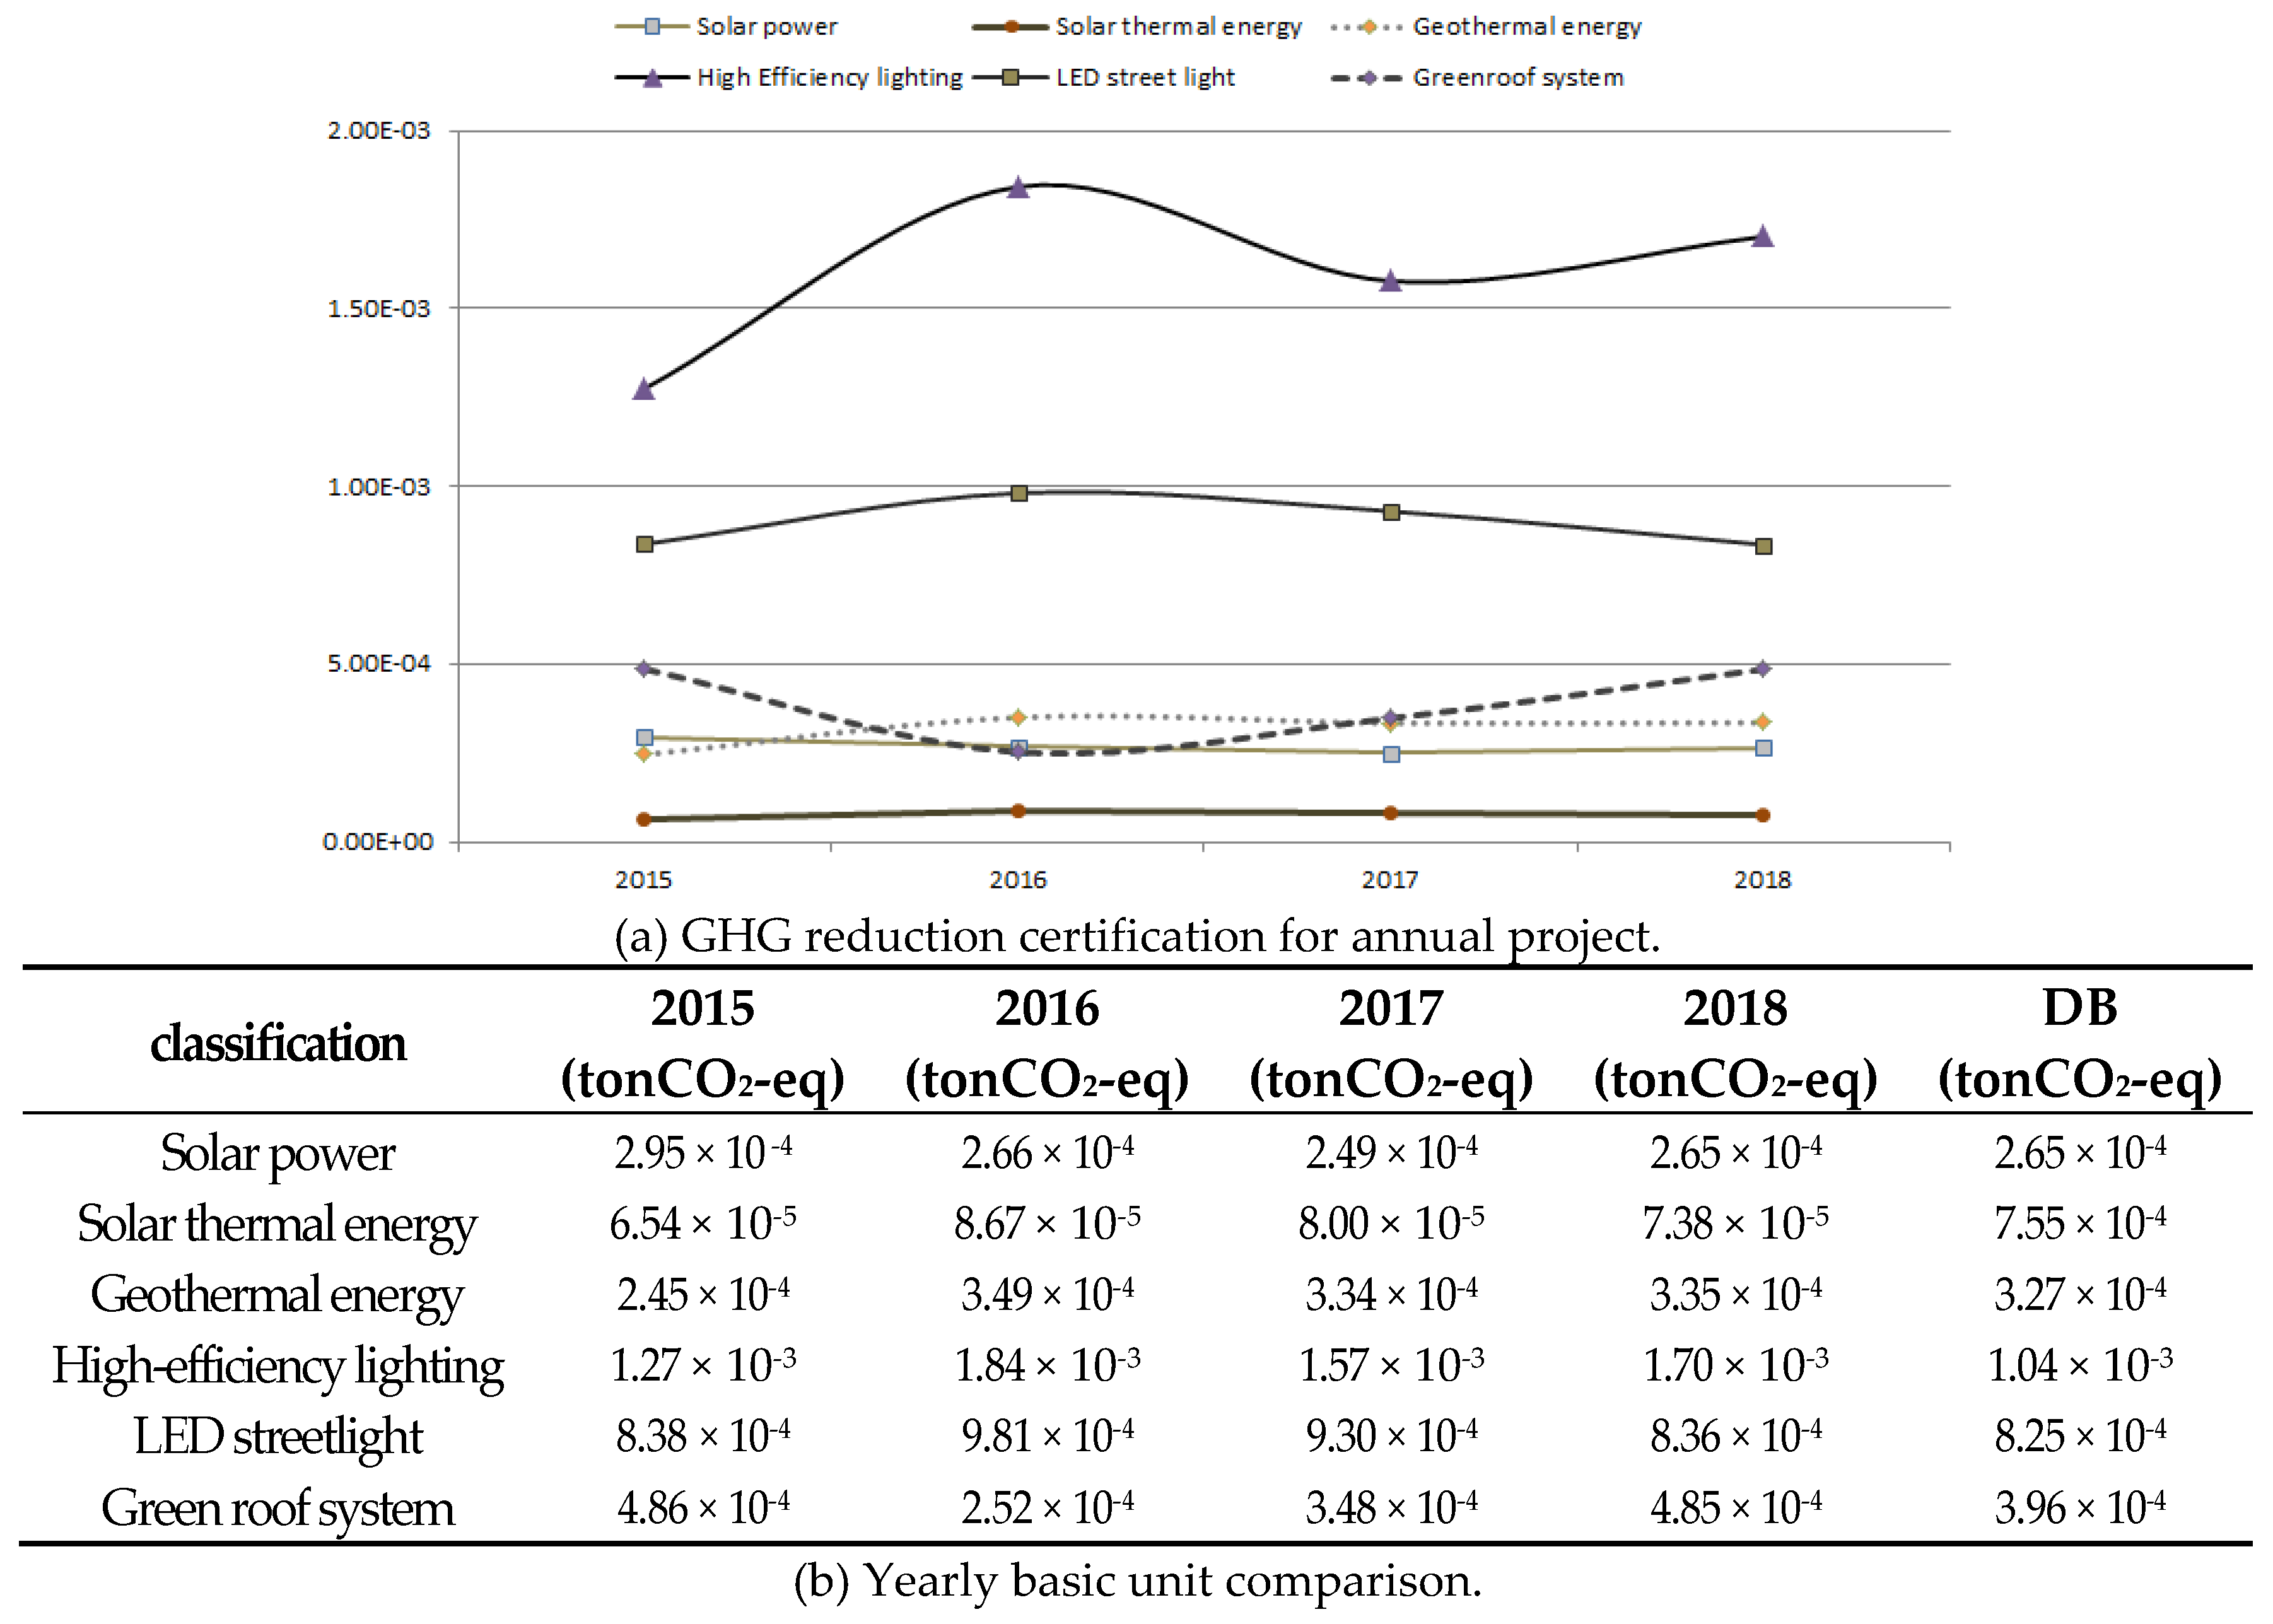
2.3. Construction of the GHG Reduction Assessment DB

Our GHG reduction technology assessment DB can be used to help make effective investment decisions in GHG reduction technologies. A GHG technology environmental evaluation DB was established based on the GHG reduction project undertaken by 18 regional and 225 local governments in Korea. Using our estimation method, certified GHG emission reductions (KOC) were calculated for 1199 GHG reduction technologies. Basic unit data for certified emission reductions were established by calculating the certified GHG emissions for each project and using the GHG reduction cost for each project as the basic unit. Since K-ETS stipulates a period of 5 years for the greenhouse gas reduction technology business, the construction cost was based on the total sum of the installation cost of the GHG reduction technology along with the maintenance costs for five years [4]. The construction cost was based on the total sum of the installation cost of the GHG reduction technology along with the maintenance costs for five years. The evaluation DB was based on the construction cost of the reduction technology and the weighted average value of the reduction allowance DB, and the top 10% of the raw data was removed for a conservative calculation of the reduction allowance. To construct the evaluation DB, the weighted average value was used for the construction cost of the reduction technology and the reduction certification data. The top 10% of the raw data was removed to calculate a conservative estimate of the reduction allowance [18].
Table 4 shows the standard database for certified emission reductions by energy use and source in buildings.
To quantitatively analyze the energy reduction by renewable energy in buildings, the reduction effect by an energy source such as electricity or city gas and the offset effect by energy use such as cooling, heating, water heating, lighting, and ventilation must be evaluated. Our study applied the offset rate of GHG reduction technologies identified from the Energy Consumption Survey, which surveys all buildings consuming 2000 TOE (ton of oil equivalent) or more of energy, and established the offset basic unit DB for the energy use and source of each GHG reduction technology 2000 TOE (ton of oil equivalent). The TOE is a unit that compares various energy units with the value converted into the heat value of oil based on the heat value of all energy sources. 1TOE is equivalent to 10 million kcal [19].
According to the Energy Consumption Survey, solar power generates power through the photovoltaic effect, where the carrier is excited inside the material, and this energy source can be applied for many uses (heating, cooling, water heating, ventilation, and lighting).
Solar thermal energy can replace water heating and reduce city gas and heat usage. Currently, city gas accounts for 92% of water heating and 8% of heat usage. It also accounts for 50% of cooling and heating energy, along with 41% of electricity usage. Geothermal energy can reduce the total energy used for cooling and heating.
In terms of GHG reduction performance, a basic unit comparison showed that high-efficiency lighting had the highest reduction with 1.0472E-03 tCO2-eq/dollar, followed by LED streetlight installation with 8.25040E-04 tCO2-eq/dollar, green roof system with 3.96676E-04 tCO2-eq/dollar, solar power with 2.65158E-04 tCO2-eq/dollar, and geothermal energy with 1.86473E-04 tCO2-eq/dollar. While we identified the most cost-effective project in GHG reductions, it is worth considering the energy consumption patterns and the installed environment of a GHG reduction technology in a building. Based on the assessment results of GHG emissions by energy source or use, a DB assessment can be made for economic and environmental benefits in GHG reduction projects, and the GHG emissions reductions in public buildings can be easily determined.

3. Material and Methods

3.1. Analysis Target and Method Setting

Based on the established basic unit data of GHG reduction technologies, we selected modeling techniques used for supervised learning in machine learning and conducted an analysis. While there are many modeling techniques for this type of learning, our study selected GBRT, SVM, and DNN techniques, which were used to develop prediction models in previous studies in Korea and abroad [20]. To identify phenomena represented by collected data and any issues, we conducted exploratory data analysis (EDA) and data preprocessing. When examining data from various angles, these processes can help discover various patterns we may not have found when defining the problem. They can also aid in revising an existing hypothesis or setting up a new hypothesis.
We analyzed and categorized the types and characteristics of factors affecting the performance of GHG reduction technology. To analyze the prediction model, we defined the independent and dependent variables, as seen in Table 5.
The relationship between the independent variable and the dependent variable is shown in Equation (1).
The GHG reduction project, project cost, and project period are independent variables, and the certified emission reduction (KOC) is set as a dependent variable. In addition, the greenhouse gas reduction target amount and greenhouse gas emission information of buildings affecting the selection of the greenhouse gas reduction technology were set as moderator variables.
K O C = G H G   r e d u c t i o n   t e c h n o l o g y ( k g C O 2 e q / U S D ) × P r o j e c t   c o s t ( U S D ) × P e r i o d ( y ) × 1000
First, we excluded missing information in the independent and dependent variables. We then used a box plot to remove statistical outliers. The box plot is a method that visually organizes a five-number summary (minimum, first quartile, median, third quartile, and maximum) in a graph, which represents data in order [21]. In statistics, an outlier is defined as less than the first quartile minus 1.5 x the interquartile range (IQR), or higher than the third quartile plus 1.5 x the IQR [22]. The first quartile refers to the number for which 25% of values in the data set are smaller, and the third quartile refers to the number for which 75% of values in the data set are smaller.
Next, 70% (839) of the preprocessed big data for GHG reduction technology projects were used as training data. Thirty percent (360) of these projects were used as test data. It is necessary to validate any generalization error in the learned models before choosing the final machine learning model. Subsequently, k-fold cross-validation was applied by equally partitioning training data into k = 10, and k-1 of the partitioned data was used as training data. The other “1 data” was used to repeat the performance of the model k = 10 times [23].
To improve the learning rate of the model and decrease the possibility of falling into local optimum, data were regularized for certified emission reductions and target emissions of GHG reduction technologies. We intended to standardize the data range between 0 and 1. However, it is not easy to analyze different data ranges such as data between 100 and 200, data between −10 and 10, and data between −100 and 300. To overcome this issue, data are usually standardized into a range of 0 to 1 [24]. We standardized GHG reduction technology DB in this study using a range of 0 to 1. Machine learning is a series of steps that maximizes existing data to extract and test the characteristics of data depending on the environment while optimizing and developing the data. This process is divided into supervised learning and unsupervised learning depending on whether the dependent variable, i.e., expected output of the learned data, is included [25]. Supervised learning uses sample data, which knows the answer, turns it into a machine learning model, and identifies predicted values or types when new data is given. As previously stated, the purpose of this study is to develop a machine learning-based GHG reduction project prediction model. Because the data we collected included the expected output, GHG emission reductions and modeling techniques used for supervised learning were selected to conduct our analysis.
GBRT is one of the ensemble techniques that brings together several decision trees to make a strong model and can be used for both regression analysis and classification modeling. It is also possible to create sequential trees by fixing errors in decision trees. Due to its strength, GBRT is often used when the interpretive power of the final model is more critical in supervised learning problems. Equation (2) expresses the GBRT algorithm used in this model. It is the initial model consisting only of constant terms: x is the explanatory variable, Y is the dependent variable, and L(y, F(x)) is the differentiable loss function. As in Equation (3), calculations are performed by repeating the pseudo residual M times. After fitting the base learner hm(x) into the pseudo residual calculated from Equation (3), γ m in Equation (4) is calculated. The residual is updated in Equation (5). Then, the process from Equation (2) to Equation (5) is repeated M times [26].
F 0 ( x ) = a r g m i n γ i = 1 n L ( y i , γ )
γ i m = [ L ( y i , F ( x i ) ) F ( x i ) ] F ( x ) = F m 1 ( x )
γ m = a r g m i n γ i = 1 n L ( y i , F m 1 ( x i ) + γ h m ( x i ) )
γ m ( x ) = F m 1 ( x ) + γ m h m ( x )
SVM is a machine learning method suggested by Vapnik (1996) and can be used to solve classification or regression problems. Unlike other typical machine learning techniques based on empirical risk minimization, SVM can minimize an upper bound of generalization error based on structural risk minimization. SVM can mitigate problems like overfitting or local optimum by applying the penalty term [27]. When learning data paired with the input and output like ( x 1 , y 1 ) , , ( x m , y m ) |   x i R n are given, the linear regression of SVM seeks to minimize w in f ( x ) = w , x + b . Equation (6) must be optimized to achieve this. Sometimes, the solution in Equation (6) cannot be obtained. To solve this issue, it is possible to introduce the slack variables ξ i and ξ i and convert them as in Equations (6) and (7). When learning data paired with the input and output like ( x 1 , y 1 ) , , ( x m , y m ) | x i R n are given, the linear regression of SVM seeks to minimize w in f ( x ) = w , x + b . Equation (6) must be optimized to achieve this. Sometimes, the solution in Equation (6) cannot be obtained. To solve this issue, it is possible to introduce the slack variables ξ i and ξ i and convert them as in Equations (6) and (7). In Equation (7), the constant C is the penalty for the estimated error and determined as a number greater than 0. When C is higher, the error is minimized while the level of generalization decreases. When C is lower, the error increases while the level of generalization increases. Hence, the performance of the SVM model is determined by the selection of C. Equation (8) is an ϵ -intensitive loss function, which means that any error smaller than ϵ will be ignored. Equation (6) can solve optimization problems by introducing the Lagrange multiplier and identifying the solution that maximizes the multiplier [28].
Minimize   1 2   | | w | | 2   subject   to   { y i w , x i b ϵ w , x i + b y i ϵ
1 2   | | w | | 2 + C i = 1 m ( ξ i + ξ i )   subject   to   { y i w , x i b ϵ + ξ i w , x i + b y i ϵ + ξ i ξ i , ξ i 0
| ξ | ε = { 0   i f   | ξ | ϵ | ξ | ε   o t h e r w i s e
DNN is an artificial neural network (ANN) with multiple hidden layers between the input and output layers and includes the deep belief network (DBN) suggested by Hinton et al. (2006) and the denoising autoencoder proposed by Vincent et al. (2008) [29]. Because DNN is a type of artificial neural network, it can learn various non-linear relationships. DNN has solved many issues in ANN such as overfitting and the loss of slope values by using dropout, rectified linear unit (ReLU), batch normalization, and initialization. It is used as a key model in deep learning [30]. DNN is designed as a feedforward neural network, and is a supervised learning technique that optimizes the model while updating the weight of each node in the neural network with the backpropagation algorithm. Recently, the recurrent neural network (RNN) has also been successfully applied to the layer learning structure. The restricted Boltzmann machine (RBM) is a method that sets initial values in a neural network with multiple hidden layers. He et al. (2015) and Glorot and Bengio (2010) recently suggested a method with better performance and simpler initial values than RBM [31,32].

3.2. Results of Machine Learning Algorithm

We built an optimal GHG reduction technology model based on machine learning for the GHG reduction technology DB established in our study. The PCA of the standard DB, GBRT, SVM, and DNN were selected as the algorithms to analyze the standard DB. To compare and validate the predictive power of the model, the mean absolute error (MAE) and root mean squared error (RMSE) were used to compare the analytical results of each algorithm and to identify the optimal model. Python 3.8.0, an open-source machine learning analytics tool, was used for preprocessing analytics data, conducting PCA, and developing the machine learning-based GHG reduction technology prediction model to establish the optimal mode and Pandas, Keras, and Scikit-learn libraries were used for machine learning analysis [33].
The important hyperparameter in GBRT is the learning rate (Ir), which controls the extent to which the number of trees and the error in previous trees should be corrected. The learning rate was defined as 0.1 to determine the optimal GBRT model, and we determined the final model by changing the number of trees (shown in Figure 1). When the number of trees increases, the MAE and RMSE decrease. The final models were determined to be 200 trees and 300 trees, as these models exhibited the lowest MAE and RMSE.
To optimize the SVM model, it is necessary to determine C, a hyperparameter that controls penalty for an error in the kernel function, γ , which is related to the impact and extent of training data, and ϵ , which is related to the allowable error rate. Figure 2 shows the conformity results for SVM. The radial basis function (RBF) kernel was applied as the kernel function. While changing C, γ , and ϵ , we determined a model that minimized the MAE and RMSE of data validated by k-fold cross-validation as the final SVM model. In the parameter where γ = 0.2 and ϵ = 0.01 , the predictive power was mostly outstanding. The models where γ = 0.2 and ϵ = 0.01 and where C was 2 were selected as the final models, and data were applied from cross-validation.
To optimize DNN, it is necessary to determine the input, number of hidden layers, activation function, optimizer for weights, test epoch, batch, and dropout to prevent overfitting. Our study used 30 inputs, 1 output, 3 hidden layers, 200 tests, a batch size of 50, ReLU as the activation function, the Adam algorithm as the optimizer, and a dropout of 20%. While changing the number of nodes in the hidden layers, we determined the model that minimized the MAE and RMSE of data validated by k-fold cross-validation as the final model. The results of our DNN analysis showed that an increasing number of nodes in the hidden layers tended to decrease the MAE and RMSE; however, these were shown to increase if the number of nodes exceeded 300. Hence, the models with a number of nodes equal to 400-400-400 and 450-450-450 were selected as the final models.

4. Results

4.1. SAM Verification

The yearly basic unit and evaluation DB of external reduction projects implemented from 2016 to 2018 were used as basic data and were compared to verify the reliability of the constructed evaluation DB. As a result of the yearly comparison, the basic unit change of external reduction project from 2015 to 2018 was insignificant. However, in the case of high-efficiency lighting replacement, the average annual increase/decrease rate was approximately 18%. This is because the number of projects was smaller than that of other projects, and the number of data points was also small. The differences between annual unit data and evaluation DB, solar power, solar thermal energy, geothermal energy, wind power, high-efficiency lighting, LED street light installation, and rooftop greening were calculated to be 4.31%, 9.07%, 9.05%, 52.7%, 16.92%, and 23.38%, respectively. In the high-efficiency lighting replacement project with a high increase/decrease rate by year, we confirmed that the difference between evaluation DB numbers was also high.

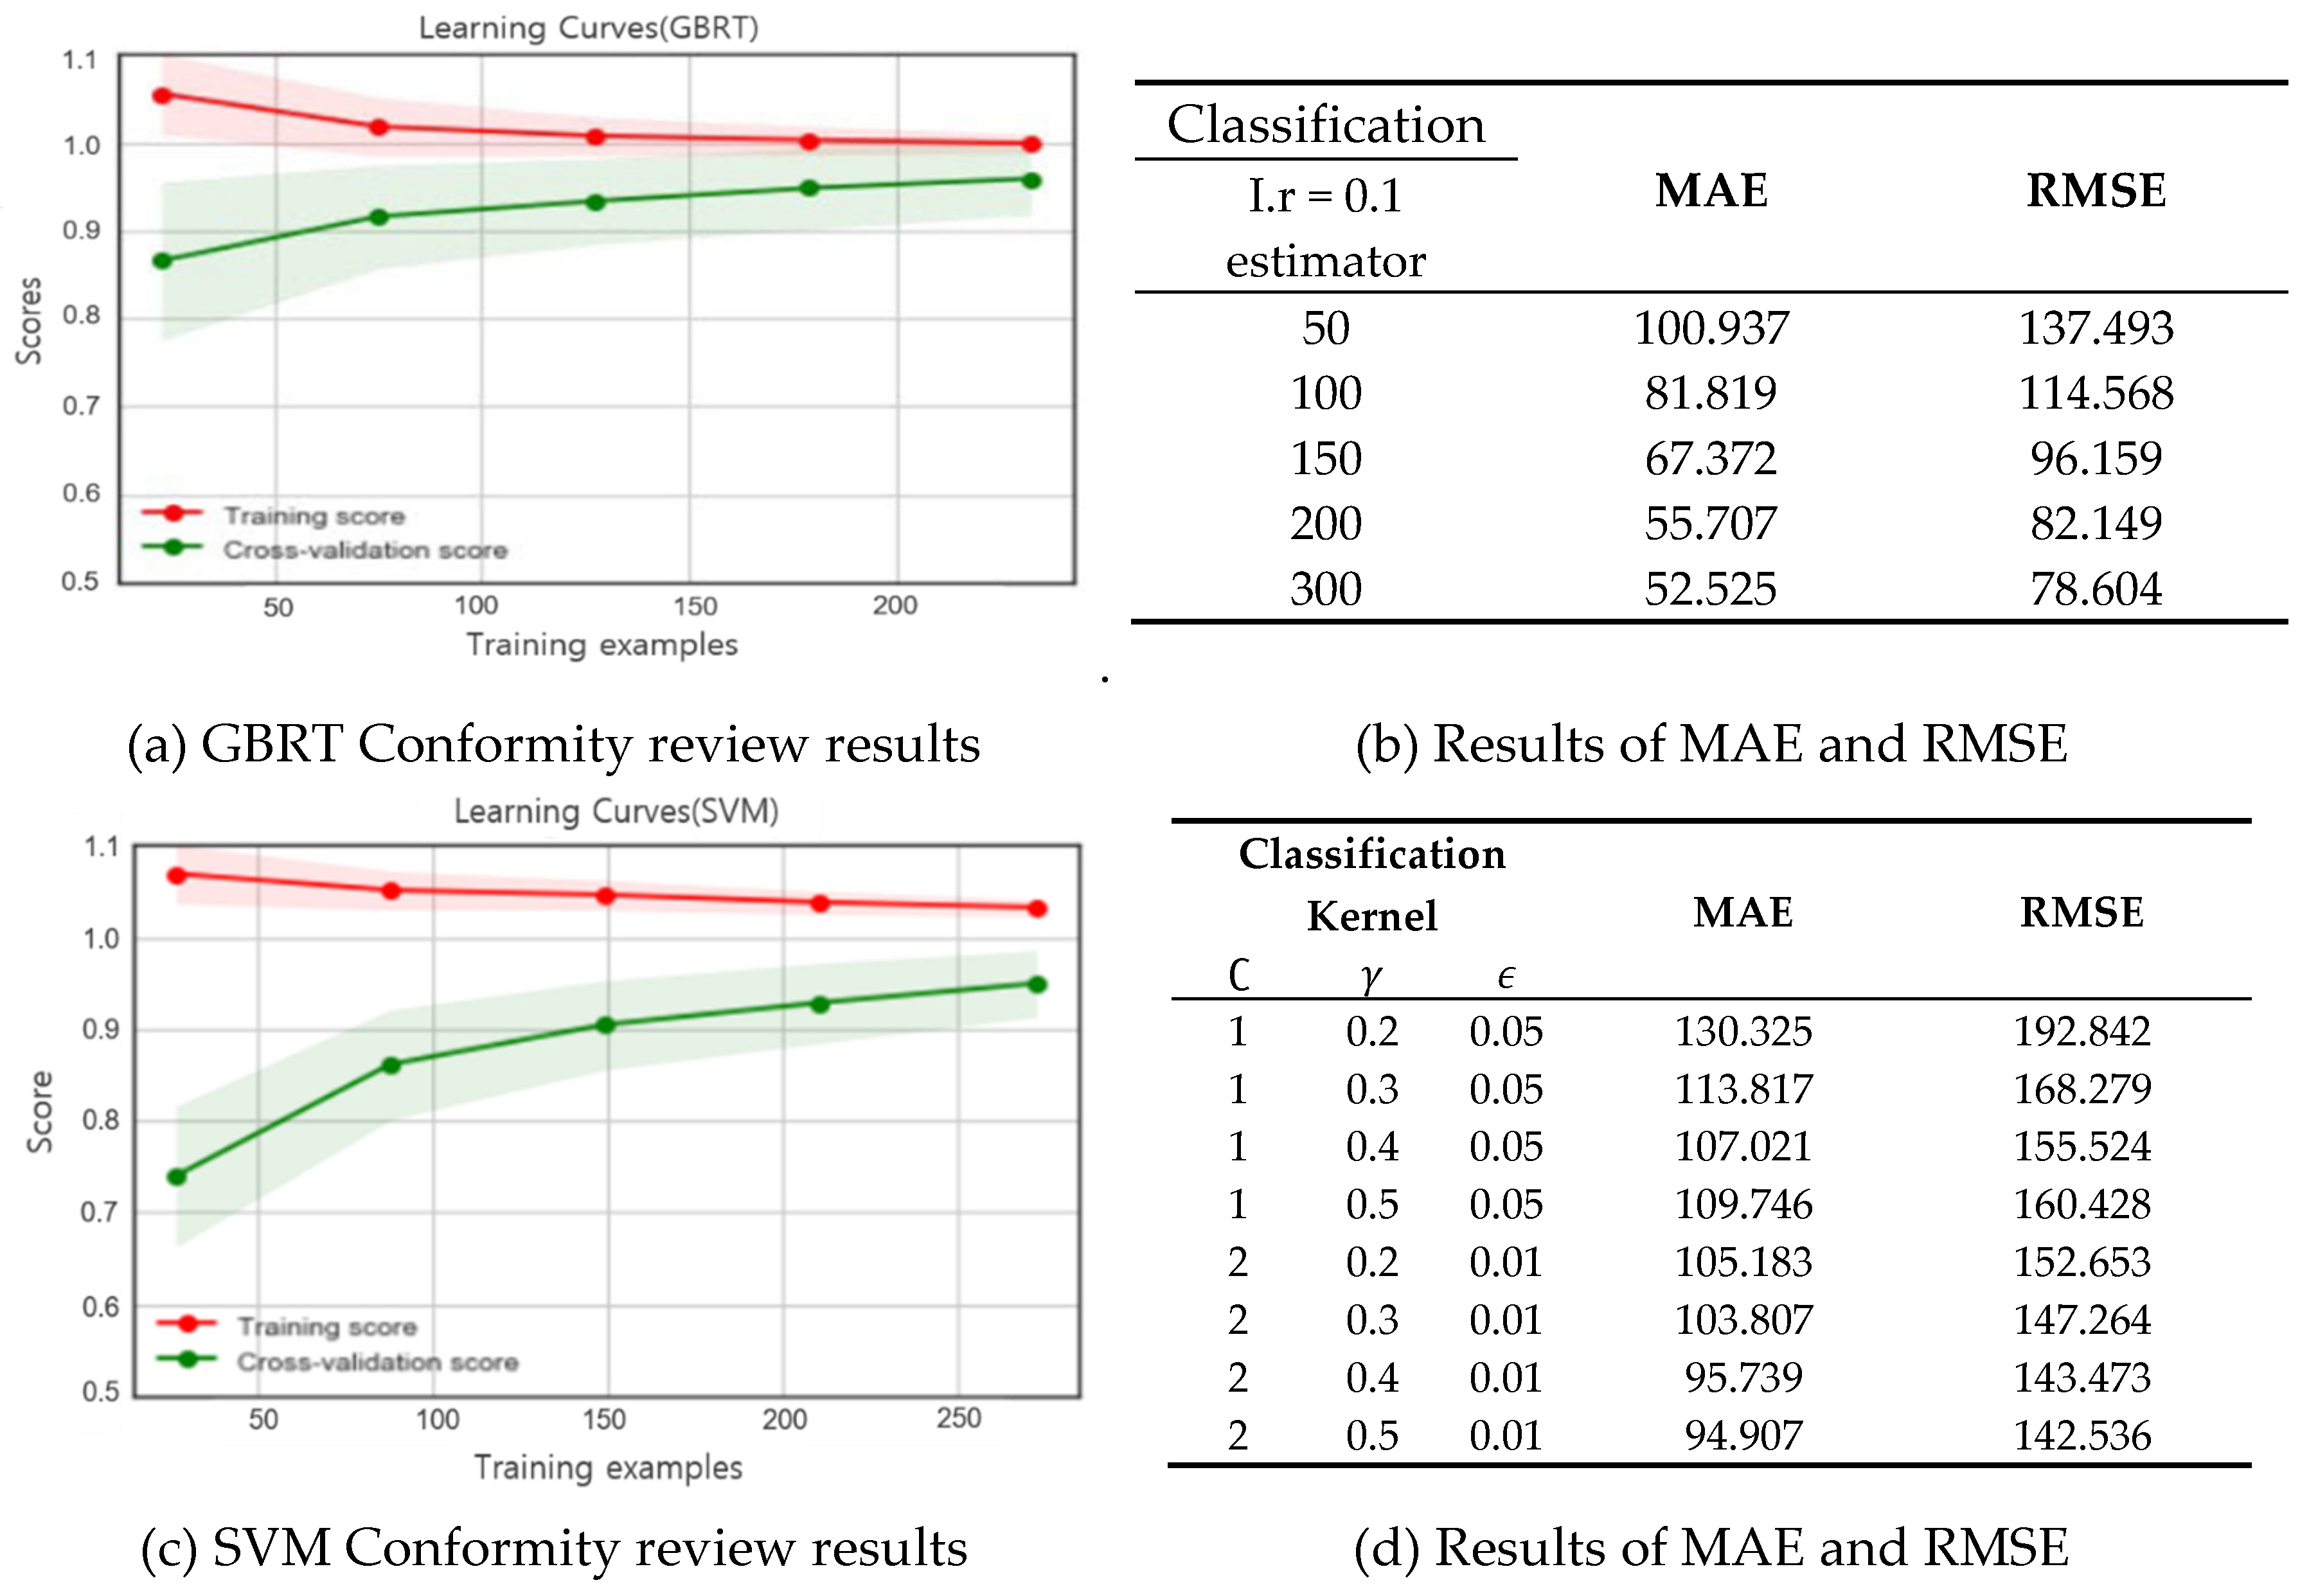
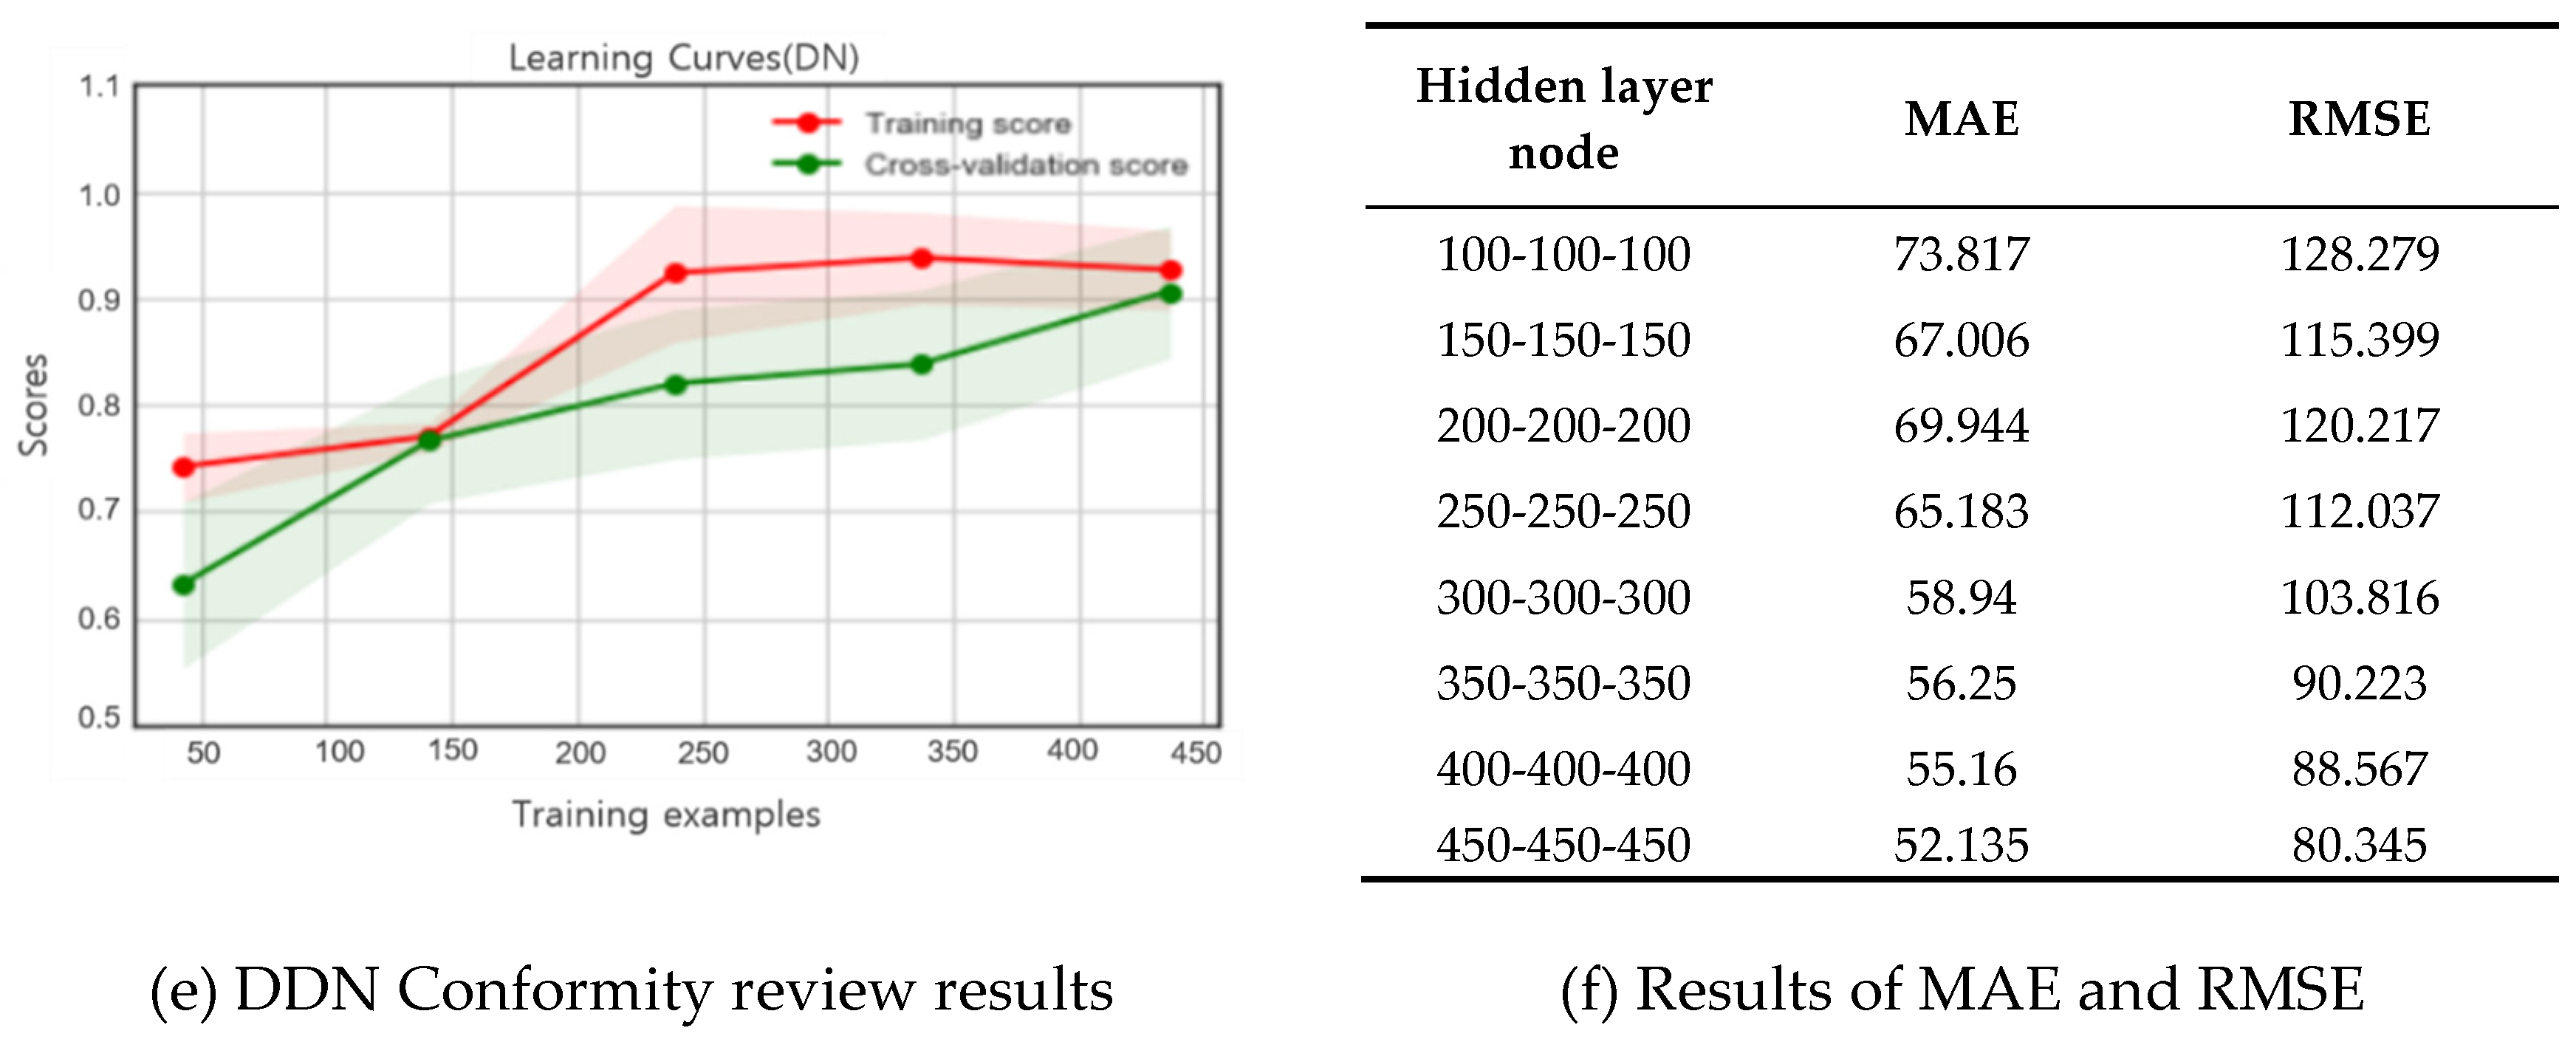
4.2. Optimal Model (GRTM) Determination

Table 6 shows the conformity of each model to the final model. Among other machine learning techniques, the MAE and RMSE of the DNN model were 98.032 and 147.378, respectively. These numbers were the lowest among the three machine learning models, and the predictive power of the DNN model was found to be the highest. In addition, we conducted a multiple regression analysis (MRA), which was the existing parameter model and was based on the standard DB. The MAE and RMSE of the MRA were 121.892 and 177.494, respectively, which was higher than other machine learning models. The predictive power of the MRA was considered the lowest amongst all models. While SVM and GBRT exhibited a slightly higher MAE and RMSE than DNN, the MAE and RMSE of these models were similar to those of DNN. Hence, the predictive power of GBRT, SVM, and DNN can be considered to be mostly similar to one another. Because the machine learning techniques exhibited some difference between the MAE and RMSE of validated data and test data, overfitting was likely occurring. SVM, which displayed the largest difference in the MAE and RMSE between validated data and test data, was found to have a higher level of overfitting. DNN was shown to have the lowest level of overfitting. For the GHG reduction projects DB established in this study, DNN was selected as the optimal model amongst all machine learning techniques.

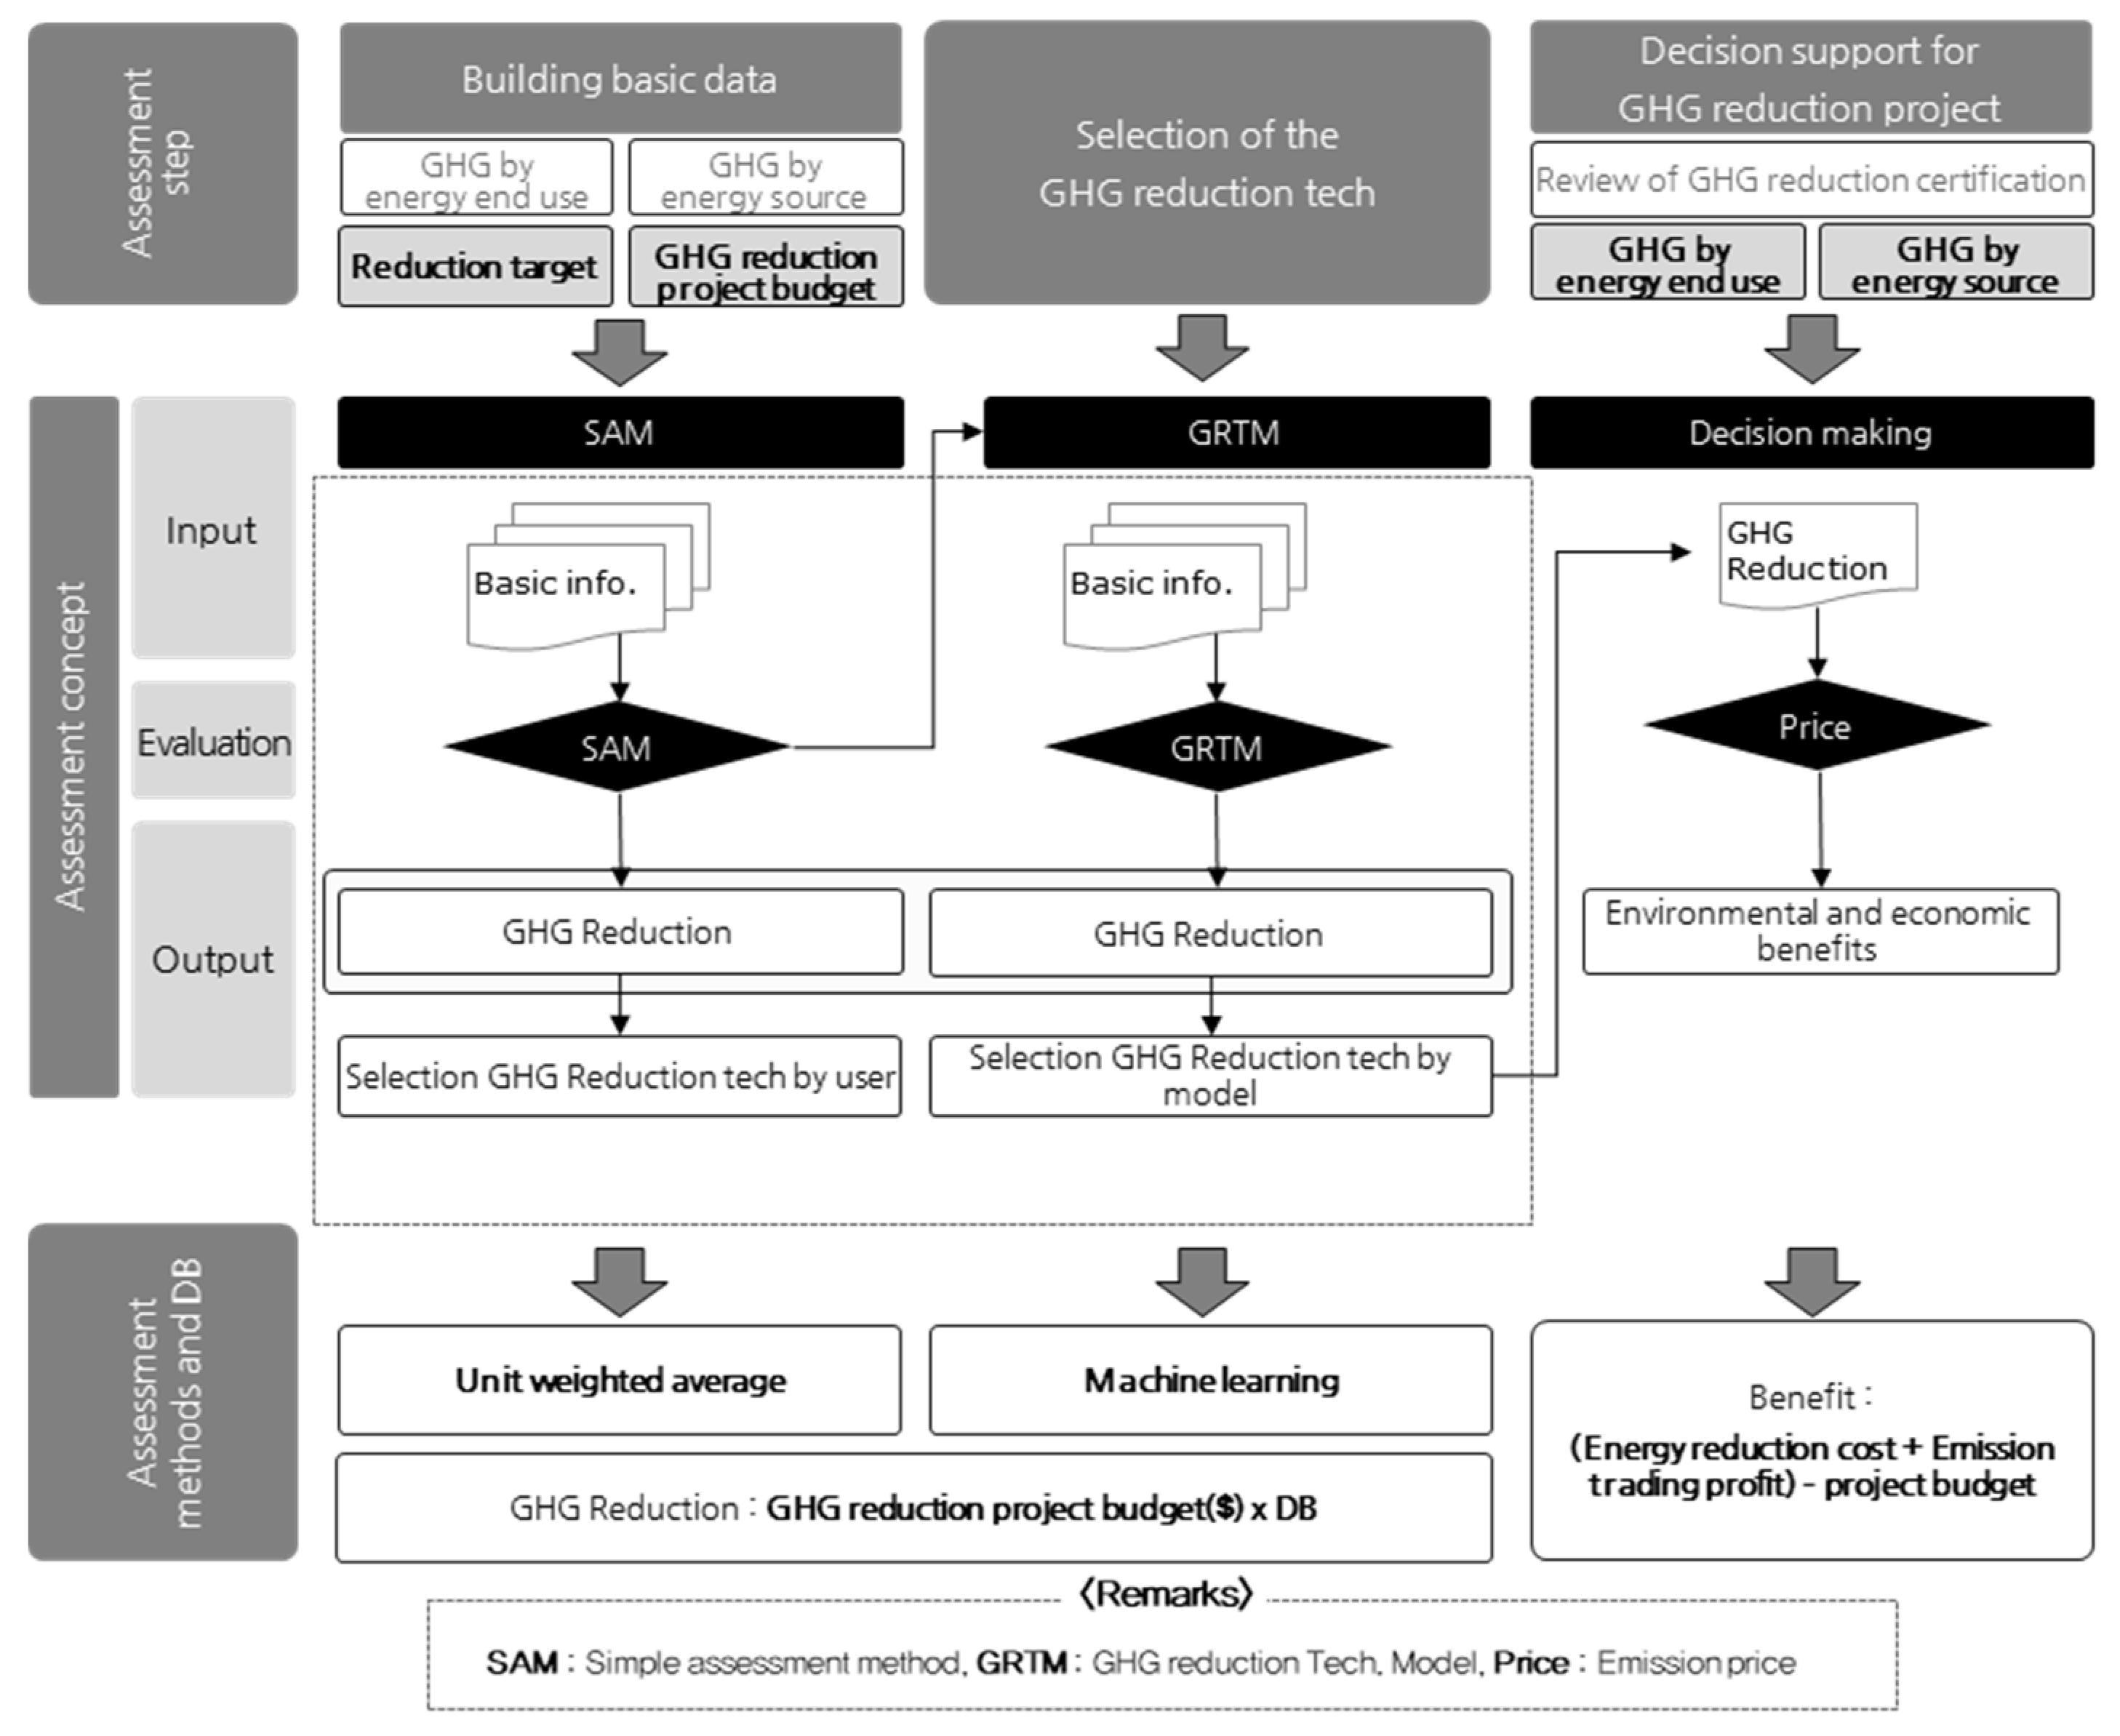
4.3. Establishment of the Assessment Oncept

Figure 3 shows our suggestion on how to use the developed GHG reduction technology model for conducting an assessment.
Based on the aforementioned requisite elements, an integrated assessment system concept consisting of a simple assessment method (SAM) and GHG reduction technology assessment model (GRTM) was established. The SAM was defined as an evaluation method for GHG reduction.
The GRTM was developed in this study using only limited information from energy uses such as heating, cooling, water heating, lighting, ventilation, electricity, and city gas. It can be used to suggest a GHG reduction technology, which allows the user to obtain the maximum efficiency at the minimum cost based on the results of the SAM.

4.4. Case Study

To examine the applicability of the optimal GHG reduction technology model established by DNN and the standard database of GHG reduction projects and demonstrate how GRTM can be utilized, we used SAM and GRTM to evaluate GHG reduction technologies and select the optimal technologies. Table 7 shows an overview of each building selected for the case study.

4.4.1. Evaluation Method

We identified optimal GHG reduction projects based on GHG emissions by energy use and source, GHG target emissions, and project budget information of the building. Additionally, we analyzed the economic benefits based on certified GHG emission reductions (KOC) from GHG reduction projects that could be obtained from the ETS. Projects based on the machine learning-based DNN model evaluation results of GRTM were compared using the standard database for the SAM established in this study, and a study was conducted for three cases, as seen in Figure 4. In Case 1, we used the standard database established in our study, entered the emissions from the building along with other basic information, set the energy consumption of the building by energy use and the target emission reductions as 15% of the existing emissions, and identified the GHG reduction technologies that satisfied these parameters. In Case 2, we used the budget, floor area, and GHG emissions by energy source as input data in the GRTM, which is a machine learning-based model developed in this study. Additionally, we identified certified GHG emission reductions (KOC) and optimal GHG reduction projects. In Case 3, we compared the results of Case 1 and Case 2 and analyzed the economic benefits that could be obtained from GHG reduction projects under the K-ETS. The building selected for the case study is a public facility owned by Seoul with a floor area of 77,191 m2.
It utilizes electricity, city gas, heat, and energy while producing 2136.842-tonCO2-eq, 268.912 -ton CO2-eq, and 86.681-ton CO2-eq in GHG emissions from various sources. Its total GHG emission equals 2492.435-ton CO2-eq. The GHG target emission used for this case study is 2134-ton CO2-eq (Table 8).

4.4.2. Evaluation Result

Figure 5 shows the evaluation results. In Case 1, Evaluation 1 selected the projects satisfying the GHG target emissions of the building with regards to heating, cooling, lighting, ventilation, and water. The highest effect on reducing GHG emissions was seen in heating, cooling, and lighting. Case 1, Evaluation 2 selected the projects that met the GHG target emissions of the building for electricity, city gas, and heat consumption. The highest effect on GHG emissions reduction was observed for electricity.
Case 1, Evaluation 1 applied geothermal energy, solar power, high-efficiency lighting, LED streetlight installation, and rooftop greening as GHG reduction technologies for heating, cooling, and lighting. The budget for these technologies to reach their target emissions of 358-ton CO2-eq was calculated to be 570,000 USD.
Case 1, Evaluation 2 applied GHG reduction technologies to reduce electricity consumption, and the budget was determined to be 308,000 USD. In descending order from highest to lowest, the proportions of selected GHG reduction technologies included high-efficiency lighting, LED street light installation, rooftop greening, and geothermal energy, which was excluded for reducing electricity consumption. Geothermal heat has an excellent effect on cooling and heating, but was excluded from this case because it was targeted for greenhouse gas reduction technologies that produce or reduce power.
Case 1 reflects the subjective opinion of the evaluator, and the applicability of the evaluation result is inferior. In addition, the environment of the building is not substantially considered, and this is a disadvantage. Case 2 shows the optimal GHG reduction projects identified by GRTM. Unlike Case 1, the budget assumed that GHG reduction technologies would be installed in the building. This case is considered to be the optimal GHG reduction technology project based on data analysis when considering the total floor area of buildings, energy use, and consumption by the relevant energy source. Certified GHG emission reductions (KOC), which consider the characteristics of a building and can be obtained within the total budget of 200,000 USD, were confirmed to be 111-ton CO2-eq. The results of the GRTM suggest a distribution of 48-ton CO2-eq in high-efficiency lighting, 53-ton CO2-eq in solar power, and 10-ton CO2-eq in geothermal energy. From these results, the building in this case study has the potential for GHG emission reductions in heating, cooling, and lighting. These are derived from the area, consumption by energy use and source, and budget information of the building.
A limitation of Case 1 is that its results may vary depending on the evaluation scenario and the competence of the evaluator. However, if the GRTM is used as in Case 2, it would be possible to select the GHG reduction technologies which consider the allocated budget and the characteristics of the building (Table 9).
Case 3 presented a calculation of economic benefits from emission reductions and the K-ETS based on GHG reduction technologies along with certified GHG emission reductions (KOC) identified by the GRTM. Currently, the K-ETS accepts certified GHG emission reductions (KOC) from the GHG reduction technologies of businesses or public institutions as permits [34].
Additionally, energy consumption reduced by the GHG reduction technology can be converted into the price.
The building we evaluated can reduce 111-ton CO2-eq by using high-efficiency lighting, solar power, and geothermal energy, which were identified from the GRTM. Under the K-ETS, permits are traded for 19 USD per 1-ton CO2-eq, and the Certified GHG emission reductions (KOC) are converted to Korean Credit Unit (KCU), which is an offsetting credit, enabling trading of emissions.
The evaluated building can be worth 2109 USD through emissions trading.
The price of energy consumption by energy source is calculated differently depending on the country or region. To estimate economic benefits from the K-ETS, our study calculated the price of energy consumption in accordance with the energy price calculation criteria in Korea. Based on the medical facility discount criteria in Korea for non-residential buildings in Seoul, 1 TJ of electricity was calculated to cost 24,000 USD, 1 TJ of city gas in Seoul was 11,800 USD, and 1 TJ of heat energy in winter in Seoul was 8,643,625 USD. We determined that the building could save 51,978 USD in one year by applying GHG reduction technologies. When a service life of five years is applied, the reduced cost is estimated to be approximately 250,000 USD. When the reduced cost from participating in the K-ETS is added, the economic benefits of the building reach 262,000 USD. After the budget of 200,000 USD is deducted from this amount, a net benefit of 62,000 USD is obtained. However, these benefits do not include labor and maintenance costs.

5. Discussion

This study was conducted to develop a machine learning-based prediction model for GHG emission reductions and to suggest an effective method of controlling GHG emissions based on a comparison of predictive power. Most of our study analyzed statistics as well as the effect of renewable energy on energy reductions. However, a GHG control scheme like ETS and a tool that supports decision-making for GHG emissions amongst non-experts must be developed. We developed the SAM and GRTM to identify optimal GHG reduction technologies and support efficient GHG emissions control when considering the energy consumption patterns and environment of a building. The SAM is a database designed to evaluate the certified emission reductions with the floor area of a building and to target emissions for GHG reduction technology. The SAM allows non-experts to evaluate GHG emissions quickly and select GHG reduction technologies based on the results. Furthermore, we used machine learning to analyze a vast amount of data in the SAM and develop the GRTM prediction model.
The GRTM calculates GHG reductions of the evaluated building more accurately than the SAM. The GRTM can consider GHG reduction technology projects implemented by all local governments in Korea. For the GRTM, we considered external GHG reduction projects such as eco-friendly vehicles and LED streetlight installation as well as renewable energy installed directly into the building, such as solar power and geothermal energy. We determined that the predictive power of the GRTM was better than that of the MRA. This is because the machine learning technique, a non-parameter model, more accurately reflects non-linear characteristics in the data.
A variety of factors help differentiate this study from previous studies. First, our study applied DNN, a more advanced deep learning model than the artificial neural network, to GHG reduction technologies, and analyzed SVM and the ensemble model GBRT. While previous studies have only compared the predictive power between models, this study reviewed the applicability of machine learning by analyzing economic and environmental benefits from GHG reduction technologies identified by machine learning techniques.

6. Conclusions

This study used various machine learning techniques and compared predictive power between models by estimating GHG reduction technologies. This work is significant because it helps evaluate the applicability of machine learning in estimating the economic and environmental benefits from GHG reduction technologies. The results of our study are summarized as follows:
  • By reviewing 1199 GHG reduction technology projects implemented by the local government of Korea, we suggested a method to estimate the amount of energy reduced and produced while proposing a method for certified GHG emission reductions (KOC). Using 1199 GHG reduction technology projects, we established the SAM, which is a GHG reduction technology assessment DB.
  • To consider the energy consumption patterns and environments of a building, the SAM was established to evaluate the GHG emissions reduction effect amongst different energy uses and sources. These included heating, cooling, lighting, ventilation, and water heating, along with energy sources such as electricity, city gas, and heat.
  • Based on the baseline data of SAM, we used machine learning techniques (GBRT, SVM, and DNN) to develop the GRTM, a model that supports decision-making for GHG reduction technologies.
  • The comparison of predictive power between the three machine learning techniques showed that DNN had the highest predictive power as it had the lowest MAE and RMSE at 53.135 and 80.604. By contrast, SVM had the lowest predictive power with an MAE and RMSE of 94.907 and 142.536, respectively. Because the MAE and RMSE of these three techniques were similar, their predictive powers were also considered to be similar.
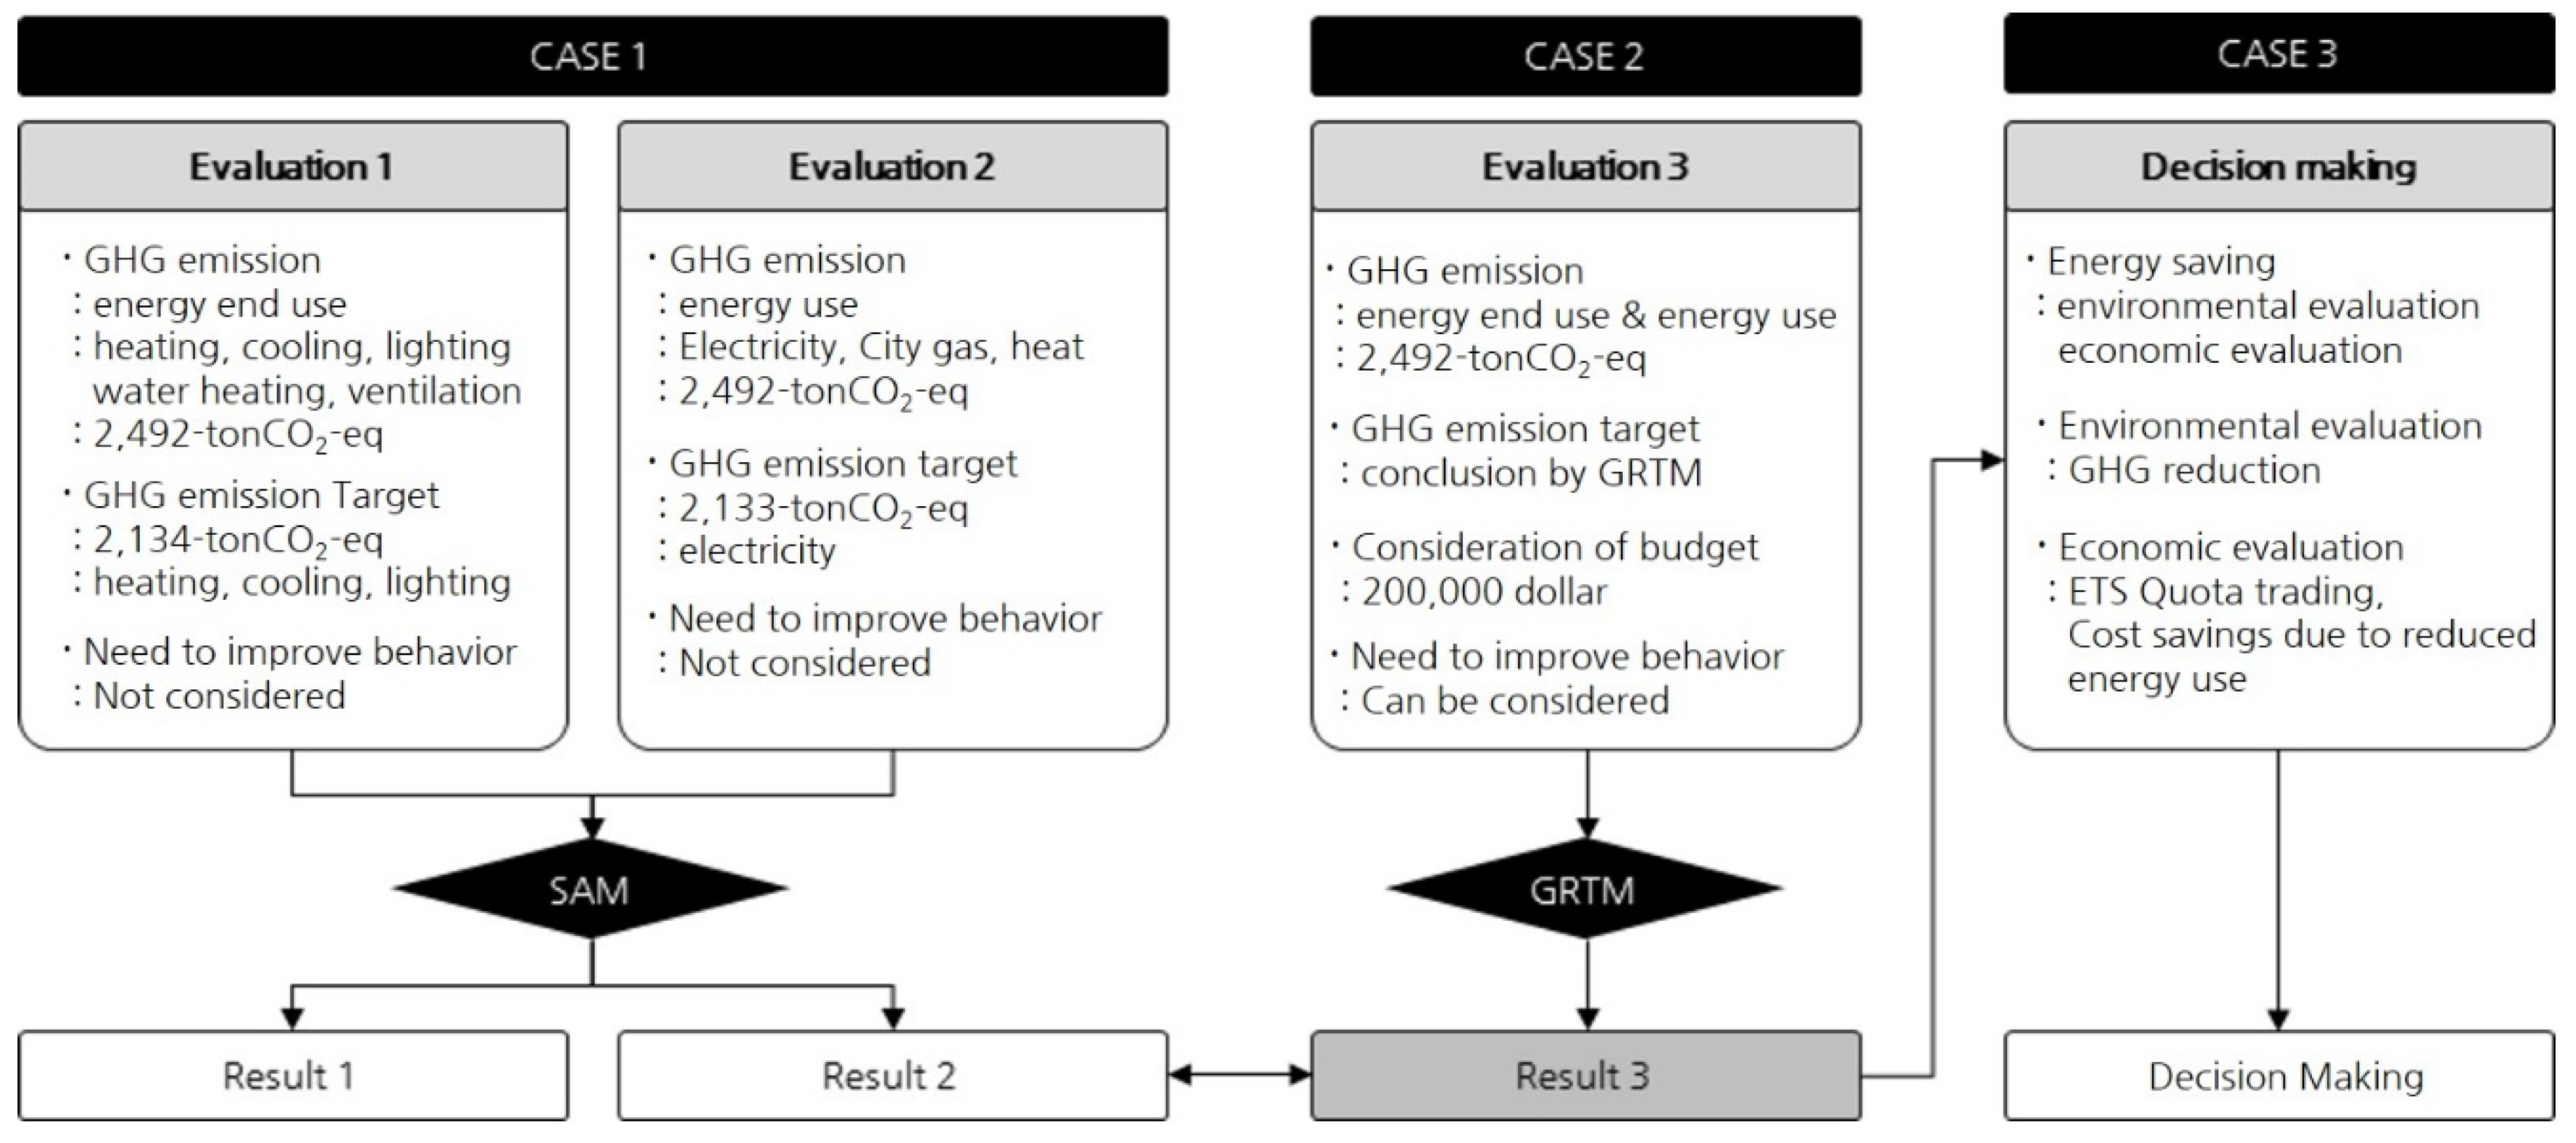
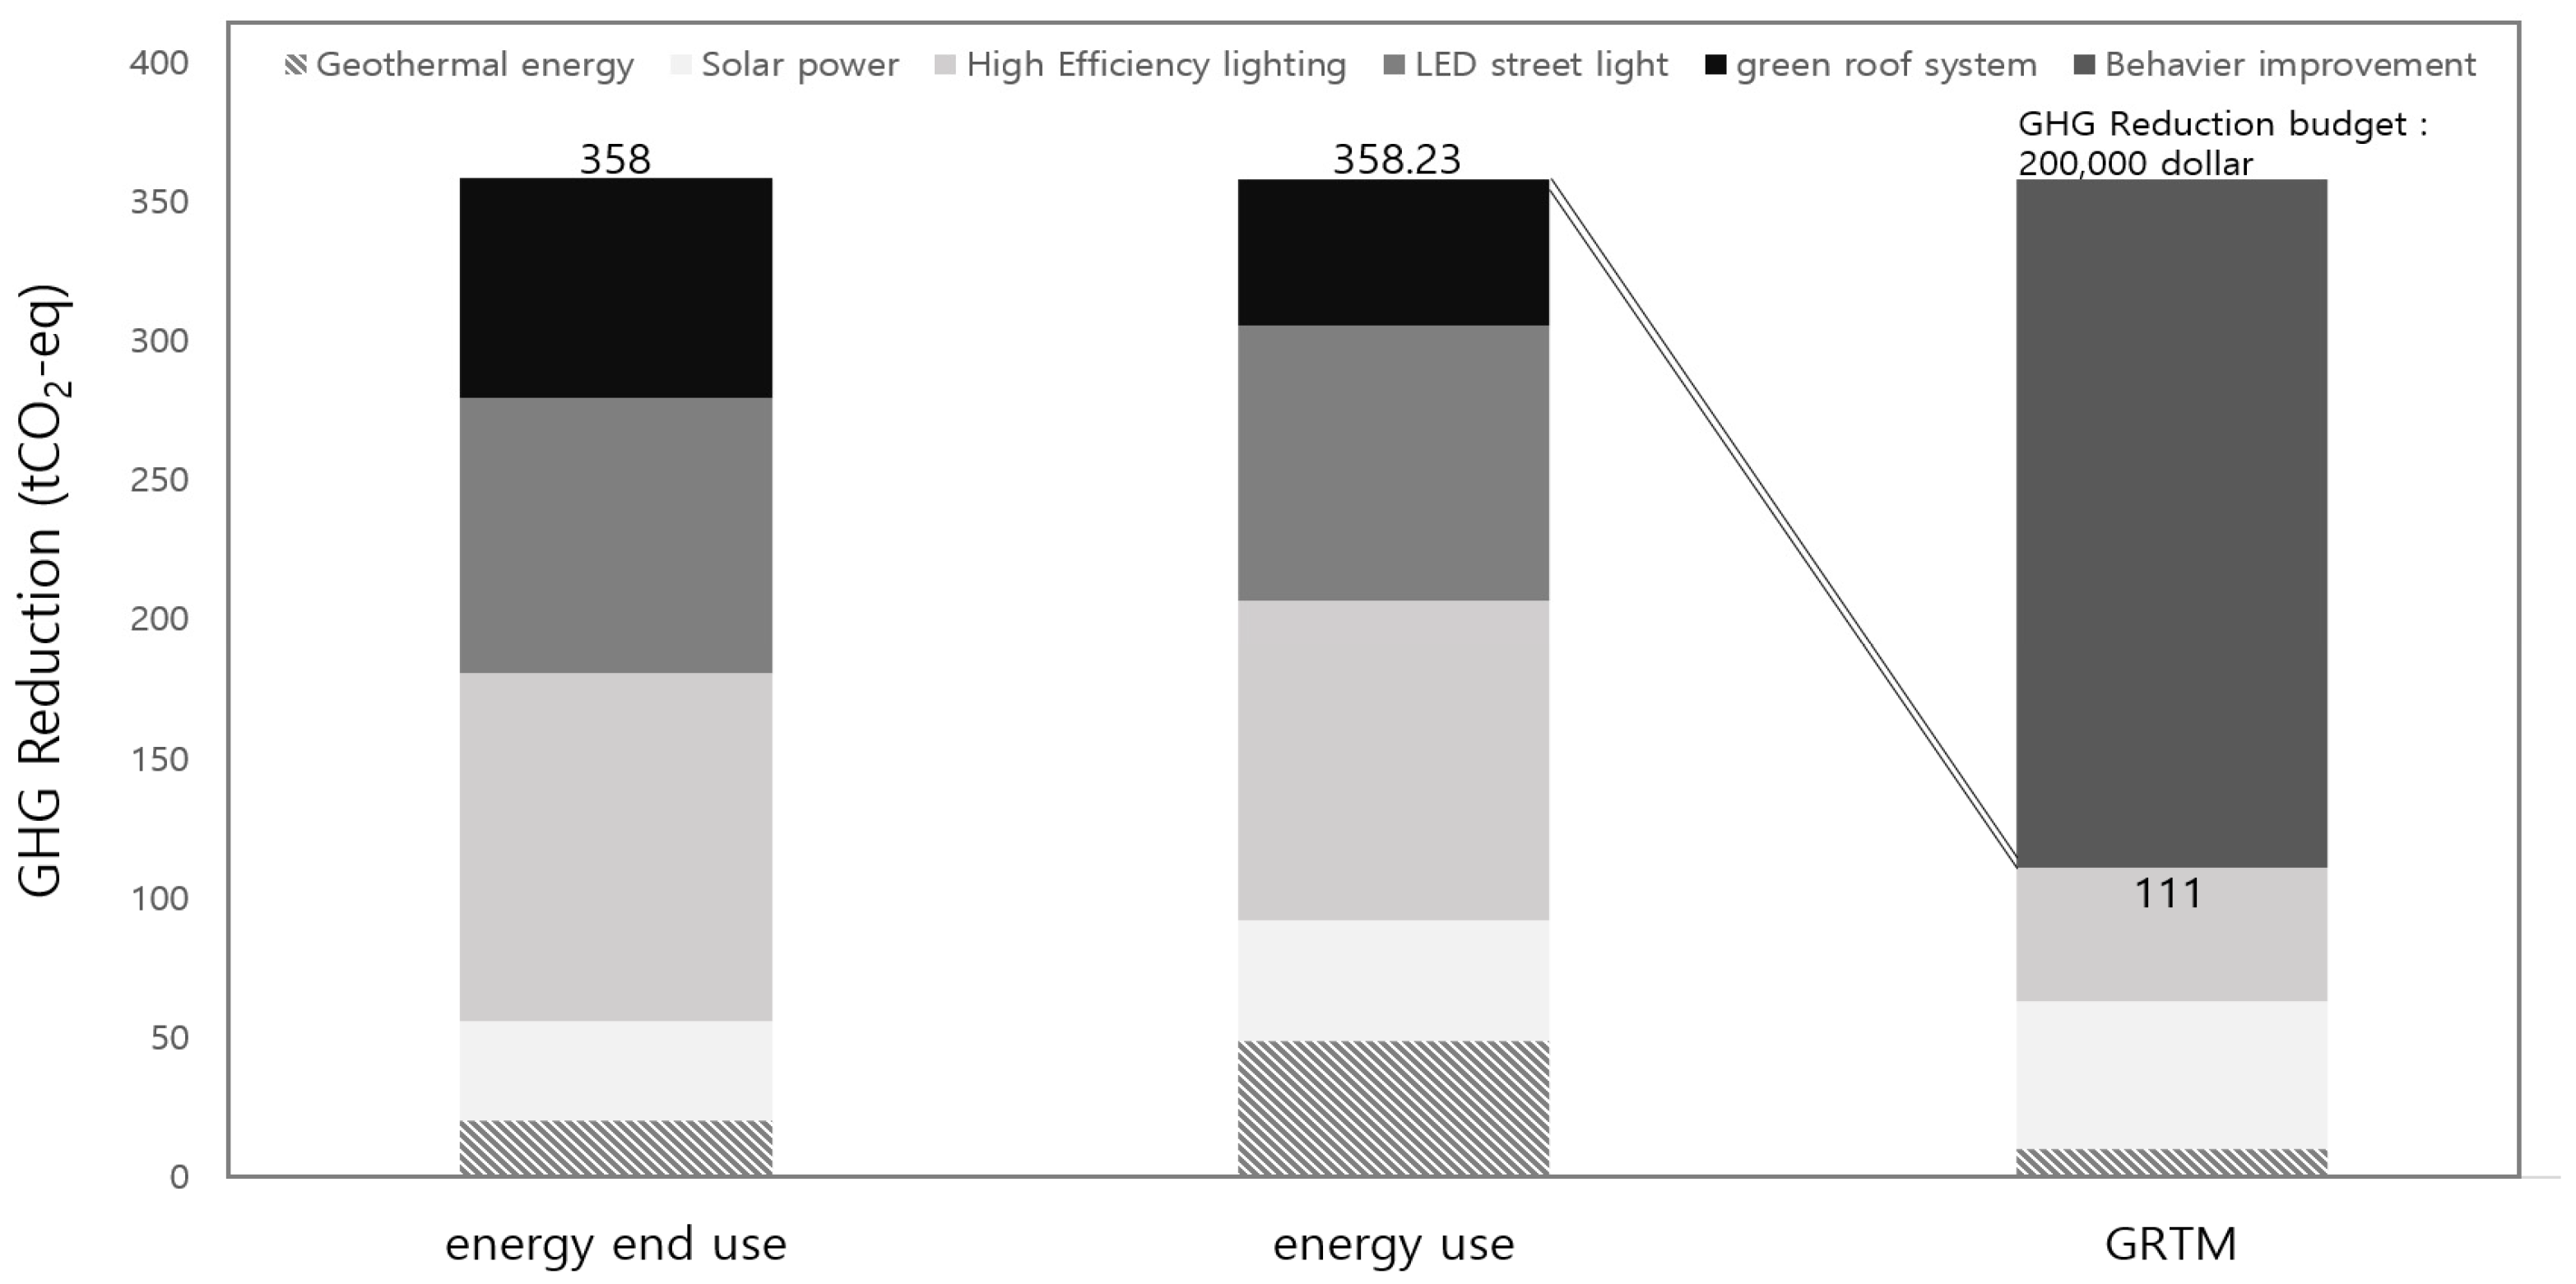
  • We confirmed the applicability of the SAM and GRTM using a case study on selected GHG reduction technologies, including SAM and GRTM. As the GHG emission reductions of 358-ton CO2-eq were included excessively, we confirmed the applicability of GRTM when considering the budget and energy consumption patterns of a building by bigdata, which contains 21,411 data from 1199 projectsand identifying the optimal GHG reduction technologies that could reduce 111-ton CO2-eq. These technologies specifically included high-efficiency lighting, solar power, and geothermal energy.

Author Contributions

Conceptualization, S.L. and S.T.; methodology, S.L.; software, S.L.; validation, S.L. and S.T.; formal analysis, S.L.; resources, S.L.; data curation, S.L.; writing—original draft preparation, S.L. and S.T.; writing—review and editing, S.L. and S.T.; visualization, S.L. and S.T.; supervision, S.T.; project administration, S.T. All authors have read and agreed to the published version of the manuscript.

Funding

This research was supported by Basic Science Research Program through the National Research Foundation of Korea(NRF) funded by the Ministry of Education, Science and Technology (No.2018R1D1A1A09083678) and supported by the National Research Foundation of Korea (NRF) grant funded by the Korea government (MSIT) (No. 2015R1A5A1037548).

Acknowledgments

The authors are grateful to the anonymous reviewers for their insightful and helpful comments to improve the manuscript.

Conflicts of Interest

The authors declare no conflict of interest.

References

  1. Korea Energy Agency. 2018 Korea Energy Agency Handbook; Korea Energy Agency: Ulsan, Korea, 2018. [Google Scholar]
  2. Ministry of Environment. A Report on Korean-Sustainable Development Goals(K-SDGs); Ministry of Environment: Sejong, Korea, 2019.
  3. Ministry of Environment. Act on The Allocation and Trading of Greenhouse-Gas Emission Permits, Enforcement Date 26 July 2017; Ministry of Environment: Sejong, Korea, 2017.
  4. Ministry of Environment. Guidelines for Feasibility Assessment and Certification of External Projects; Ministry of Environment: Sejong, Korea, 2018.
  5. Chae, M.S. Selection Model for Optimal Target Building for Green Remodeling Using Data-Mining Techniques: Focused on Multi-Family Housing Complex. Master’s Thesis, Yonsei University, Seoul, Korea, June 2017. [Google Scholar]
  6. Jang, B.G.; Lee, S.J. Prediction and optimization modeling using machine learning algorithm for renewable energy. Inst. Electr. Inf. Eng. 2018, 6, 1477–1480. [Google Scholar]
  7. Nakano, R.; Zusman, E.; Nugroho, S.; Kaswanto, R.; Arifin, N.; Munandar, A.; Arifin, H.S.; Muchtar, M.; Gomi, K.; Fujita, T. Determinants of energy savings in Indonesia: The case of LED lighting in Bogor. Sustain. Cities Soc. 2018, 42, 184–193. [Google Scholar] [CrossRef]
  8. Singh, D.; Basu, C.; Meinhardt-Wollweber, M.; Roth, B.W. LEDs for energy efficient greenhouse lighting. Renew. Sustain. Energy Rev. 2015, 49, 139–147. [Google Scholar] [CrossRef] [Green Version]
  9. Bottou, L.; Curtis, F.; Nocedal, J. Optimization methods for large-scale machine learning. SIAM Rev. 2018, 60, 223–311. [Google Scholar] [CrossRef]
  10. Jordan, M.I.; Mitchell, T.M. Machine learning: Trends, perspectives, and prospects. Science 2015, 349, 255–260. [Google Scholar] [CrossRef] [PubMed]
  11. Korea Energy Agency. Guidance for Clean Development Mechanism; Korea Energy Agency: Ulsan, Korea, 2018. [Google Scholar]
  12. Ministry of Environment. Guidance for Greenhouse Gas Energy Target Management System; Ministry of Environment: Sejong, Korea, 2017.
  13. Peng, J.; Lu, L.; Yang, H. Review on life cycle assessment of energy payback and greenhouse gas emission of solar photovoltaic systems. Renew. Sustain. Energy Rev. 2013, 19, 255–274. [Google Scholar] [CrossRef]
  14. Ministry of Environment. Guideline for Greenhouse Gas Reduction Plan Establishment; Ministry of Environment: Sejong, Korea, 2011.
  15. National Agency for Administrative City Construction. Renewable Energy Introduction Guidelines; National Agency for Administrative City Construction: Sejong, Korea, 2017.
  16. Lacirignola, M.; Meany, B.H.; Padey, P.; Blanc, I. A simplified model for the estimation of life-cycle greenhouse gas emissions of enhanced geothermal systems. Geotherm. Energy 2014, 2, 1–19. [Google Scholar] [CrossRef] [Green Version]
  17. Ministry of Trade, Industry and Energy. Lighting Equipment Supply and Utilization Survey Report; Ministry of Trade, Industry and Energy: Sejong, Korea, 2008.
  18. Roh, S.; Tae, S. An integrated assessment system for managing life cycle CO2 emissions of a building. Renew. Sustain. Energy Rev. 2017, 73, 265–275. [Google Scholar] [CrossRef]
  19. Ministry of Trade, Industry and Energy. Energy Consumption Survey; Ministry of Trade, Industry and Energy: Sejong, Korea, 2017.
  20. Rezaei-Hachesu, P.; Ahmadi, M.; Alizadeh, S.; Sadoughi, F. Use of data mining techniques to determine and predict length of stay of cardiac patients. Healthc. Inform. Res. 2013, 19, 121–129. [Google Scholar] [CrossRef] [PubMed]
  21. Williamson, D.F.; Parker, R.A.; Kendrick, J.S. The box plot: A simple visual method to interpret data. Ann. Intern. Med. 1989, 110, 916–921. [Google Scholar] [CrossRef] [PubMed]
  22. Nghiep, N.; Al, C. Predicting housing value: A comparison of multiple regression analysis and artificial neural networks. J. Real Estate 2001, 22, 313–336. [Google Scholar]
  23. Smola, A.J.; Schölkopf, B. A tutorial on support vector regression. Stat. Comput. 2004, 14, 199–222. [Google Scholar] [CrossRef] [Green Version]
  24. Tay, D.P.; Ho, D.K. Artificial intelligence and the mass appraisal of residential apartments. J. Prop. Valuat. Invest. 1992, 10, 525–540. [Google Scholar] [CrossRef]
  25. Morton, A.; Marzban, E.; Giannoulis, G.; Patel, A.; Aparasu, R.R.; Kakadiaris, I. A comparison of supervised machine learning techniques for predicting short-term in-hospital length of stay among diabetic patients. In Proceedings of the 2014 13th International Conference on Machine Learning and Applications, Detroit, MI, USA, 3–6 December 2014; pp. 428–431. [Google Scholar]
  26. Yang, C.-S.; Wei, C.-P.; Yuan, C.-C.; Schoung, J.-Y. Predicting the length of hospital stay of burn patients: Comparisons of prediction accuracy among different clinical stages. Decis. Support. Syst. 2010, 50, 325–335. [Google Scholar] [CrossRef]
  27. Vapnik, V. The Nature of Statistical Learing Theory; Springer: Berlin, Germany, 1996. [Google Scholar]
  28. Drucker, H.; Burges, C.J.C.; Kaufman, L.; Smola, A.; Vapnik, V. Support Vector Regression Machines. In Advances in Neural Information Processing Systems; MIT Press: Cambridge, MA, USA, 1997; Volume 9, pp. 155–161. [Google Scholar]
  29. Hinton, G.E.; Osindero, S.; Teh, Y.-W. A fast learning algorithm for deep belief nets. Neural Comput. 2006, 18, 1527–1554. [Google Scholar] [CrossRef] [PubMed]
  30. Aloqaily, M.; Otoum, S.; Al Ridhawi, I.; Jararweh, Y. An intrusion detection system for connected vehicles in smart cities. Ad Hoc Netw. 2019, 90, 101842. [Google Scholar] [CrossRef]
  31. He, K.; Zhang, X.; Ren, S.; Sun, J. Delving deep into rectifiers: Surpassing human-level performance on imagenet classification. In Proceedings of the IEEE International Conference on Computer Vision, Santiago, Chile, 7–13 December 2015; pp. 1026–1034. [Google Scholar]
  32. Glorot, X.; Bordes, A.; Bengio, Y. Deep sparse rectier neural networks. In Proceedings of the 14th International Conference on Artificial Intelligence and Statistics, Ft. Lauderdale, FL, USA, 11–13 April 2011; pp. 315–323. [Google Scholar]
  33. Wang, W.; Lu, Y. Analysis of the Mean Absolute Error (MAE) and the Root Mean Square Error (RMSE) in assessing rounding model. In Proceedings of the IOP Conference Series: Materials Science and Engineering; IOP Publishing: Bristol, UK, 2018; Volume 324, p. 012049. [Google Scholar]
  34. Korea Exchange, Emissions Market Information Platform. Available online: http://ets.krx.co.kr/contents/ETS/03/03010000/ETS03010000.jsp (accessed on 19 January 2020).
Figure 1. Simple assessment method (SAM) verification.
Sustainability 12 03582 g001
Figure 2. Selecting the best machine learning model.
Sustainability 12 03582 g002aSustainability 12 03582 g002b
Figure 3. Evaluation framework of the GHG reduction technology model.
Sustainability 12 03582 g003
Figure 4. Scenario for this case study.
Sustainability 12 03582 g004
Figure 5. Case study results.
Sustainability 12 03582 g005
Table 1. Status of greenhouse gas (GHG) reduction technology projects.
GHG Reduction TechnologyNumber of Projects
(EA)
Project Cost
(US dollar)
ClassificationTotal 1199236,906,821
Renewable EnergySolar power436(36%)150,647,045(63%)
High Efficiency lighting194(16%)14,679,372(6%)
Solar thermal energy123(10%)19,505,391(8%)
Geothermal energy113(9%)30,524,104(12%)
High
Efficiency
equipment
LED streetlight installation123(10%)19,589,325(8%)
Green roof system18(1.5%)1,208,019(0.5%)
Electric vehicle139(11%)680,700(0.2%)
Natural gas Vehicle54(4%)72,865(0.03%)
Table 2. Method for calculating GHG reduction certification.
ClassificationGHG Reduction TechnologyCalculation Method
Renewable EnergySolar powerProduction
(E)
E(kWh) = ∑ [Ci × Ni × ŋi × hi]
· Ci: Capacity (kW/unit)
· Ni: Number
· ŋi: Power utilization rate per installation (i) (%)
· Hi: Renewable energy(i) operating hour
Solar thermal energyProduction
(FCi)
FCi (m3) = ∑ [SC × Ni × SFCi × Di]
· FCi: Energy saving by heat source i
· SC: Area of installed solar thermal collectors (m2/household)
· Ni: Number of households using the heat source i
· SFCi: Daily energy reduction by heat source i per installed area (m3/(m2žday)
· Di: Number of operating days after using the heat source i
Geothermal energyHeat and Cooling source reduction
FCi
FCi(m3, kWh) = (C × Ni × GFCHi × Di + C× Ni × GFCCi)
· C: Installed capacity of the geothermal energy system after the project (RT/unit)
· Ni: Number of households using the heat source i
· GFCHi: Energy reduction by the alternative heating source i (m3/(RTžday)
· Di: Number of operating days after using the heat source i
· GFCCi: Energy reduction by the alternative cooling source i (kWh/RTžday)
High-efficiency
equipment
High-efficiency lightingPower saving
(ΔE)
ΔE(kWh) = EPJ,C,i × K/(1KNi × hi/1000
· EPJ,C,i: Electricity consumption of the light i after replacement (W/unit)
· K: Energy efficiency saved by the project
· Ni: Number of installed lights for electricity consumption i
· hi: Light-off time (period calculated for energy reduction × light-off hours: 365dž 5.3h)
LED streetlight installationΔE(kWh) = ∑ (EBL,iEPJ,i) × Ni × hi/1000
· EBL,i: Electricity consumption by streetlights before the projects(W/unit)
· EPJ,i: Electricity consumption by LED streetlights after the project (W/unit)
· Ni: Number of installed streetlights for electricity consumption i after the project
· hi: Light-off time (period calculated for energy reduction × light-off hours: 365d ž 10h)
Green roof systemΔ E(kWh) = A × PF × D
· A: Area of rooftop greening after the project (m2)
· PF: Reduced electricity per day and unit area (0.083 kWh/(m2žday)
· D: Number of days in the GHG reduction project
Table 3. Daily storage coefficient applied by fuel.
ClassificationEnergy TypeEnergy UnitValueUnit
GFC*ElectricitykWh7.33kWh/(RT∙day)
City gas(LNG)m30.6598m3/(RT∙day)
Diesell0.7455l/(RT∙day)
Kerosenel0.754l/(RT∙day)
GFC**ElectricitykWh0.275kWh/(RT∙day)
City gas(LNG)m30.0248m3/(RT∙day)
SFC***ElectricitykWh0.9003kWh/(m2∙day)
City gas(LNG)m30.081m3/(m2∙day)
Diesell0.0916l/(m2∙day)
Kerosenel0.0926l/(m2∙day)
PF****Green roof system0.083kwh/(m2∙day)
*GFCH,i (when i is fossil fuel)
3.320 ( M J / M c a l ) × L o a d   f a c t o r × A v e r a g e   d a i l y   d r i v i n g   h o u r s × ( 1 1 / P e r f o r m a n c e   c o e f f i c i e n t ) × 4.168 ( M J / M c a l ) / n e t   c a l o r i f i c   v a l u e   o f   h e a t   s o u r c e   i  
*GFCH,i (when i electricity)
3.320 ( M J / M c a l ) × L o a d   f a c t o r × A v e r a g e   d a i l y   d r i v i n g   h o u r s × ( 1 1 / P e r f o r m a n c e   c o e f f i c i e n t ) / 860 ( M c a l / M W h ) × 1000
**GFCC,i (when i is fossil fuel)
3.320 ( M J / M c a l ) × L o a d   f a c t o r × A v e r a g e   d a i l y   d r i v i n g   h o u r s × ( 1 / C o o l i n g   p e r f o r m a n c e   c o e f f i c i e n t 1 / G e o t h e r m a l   c o o l i n g   p e r f o r m a n c e   c o e f f i c i e n t ) × 4.168 ( M J / M c a l ) / n e t   c a l o r i f i c   v a l u e   o f   h e a t   s o u r c e   i
**GFCC,i (when i electricity)
3.320 ( M J / M c a l ) × L o a d   f a c t o r × A v e r a g e   d a i l y   d r i v i n g   h o u r s × ( 1 / C o o l i n g   p e r f o r m a n c e   c o e f f i c i e n t 1 / G e o t h e r m a l   c o o l i n g   p e r f o r m a n c e   c o e f f i c i e n t ) / 860 ( M c a l / M W h ) × 1000
***SFCi (when i is fossil fuel)
D a i l y   i n s o l a t i o n ( M c a l / m 2 / d ) × H e a t   c o l l e c t o r   e f f i c i e n c y × H e a t   p r o d u c t i o n   d a t e ( d / 365 ) × 4.168 ( M J / M c a l ) / n e t   c a l o r i f i c   v a l u e   o f   h e a t   s o u r c e   i / 365
***SFCi (when i electricity)
D a i l y   i n s o l a t i o n ( M c a l / m 2 / d ) × H e a t   c o l l e c t o r   e f f i c i e n c y × H e a t   p r o d u c t i o n   d a t e ( d / 365 ) / 860 ( M c a l / M W h ) / 1000 / 365
****PF
0.338 ( k W h / m 2 · d a y ) × 90 ( d a y ) × 365 ( d a y / y r )
Table 4. Assessment database (DB) for reduction certification with GHG reduction technology.
ClassificationSolar PowerSolar Thermal EnergyGeothermal EnergyHigh Efficiency LightingLED Street LightGreen Roof System
GHG
Reduction
2.651 × 10−47.555 × 10−51.864 × 10−41.047 × 10−38.250 × 10−43.966 × 10−4
Heating9.512 × 10−5-1.733 × 10⁻⁴--1.423 × 10⁻⁴
Cooling6.562 × 10−5-1.317 × 10⁻⁵--9.817 × 10⁻⁵
Water heating2.701 × 10−57.555 × 10⁻⁵---4.041 × 10⁻⁵
Lighting4.391 × 10−5--1.047 × 10−38.250 × 10−46.569 × 10⁻⁵
Ventilation3.347 × 10−5----5.008 × 10⁻⁵
Electricity2.651 × 10−4-9.323 × 10−51.047 × 10−38.250 × 10−43.966 × 10−4
City gas-6.950 × 10−57.645 × 10−5---
Heat-6.044 × 10−51.491 × 10−5---
-: No baseline data
Table 5. Definitions of GHG reduction technology variables.
VariableVariableDescriptionUnitType of Variable
Independent
Variable
Type of projectSolar powerkgCO2-eq/USDNominal
Solar thermal energy
Geothermal energy
Wind power
High-efficiency lighting
LED streetlight installation
Electric vehicle
Natural gas vehicle
Hybrid vehicle
Green roof system
Project cost-USDContinuous
Project period5yYearContinuous
Moderator
variable
GHG emissionsCooling, heating, water heating, lighting, ventilation, electricity, city gas, heattonCO2-eqContinuous
Target emissions-tonCO2-eqContinuous
Dependent variableCertified emission reductions
(KOC)
-tonCO2-eqContinuous
-: Unchecked items.
Table 6. Model determination for selection as GHG reduction project.
ClassificationCross-ValidationTestAcc(%)Primary Superparameters by Model
MAERMSEMAERMSE
MRA--121.892177.49484.3
GBRT55.70782.149102.925148.99689.4estimators = 200
52.52578.604103.101149.08588.6estimators = 300
SVM95.739143.473112.191163.90791.5 = 2, γ = 0.4 ϵ = 0.01
94.907142.536110.896154.65492.5 = 2, γ = 0.5 ϵ = 0.01
DNN55.1681.075101.057147.73994.2400-400-400
52.13578.34598.032147.37895.1450-450-450
-: no baseline data.
Table 7. Overview of the evaluated building.
Building NameS city Medical Center
Floor area77,191 m2
Zoning districtMedical zone
PurposeState-owned medical facility
StructureReinforced concrete structure
Number of buildings1
Heating systemLocal heating
Service life5 y
Emission reportheating, cooling, lighting, ventilation, water heating
electricity, city gas, heat
Budget200,000 USD
Table 8. Energy consumption and greenhouse gas emissions of the evaluated building.
ClassificationEnergy End UseGreenhouse Gas Emission (tonCO2-eq)-
Electricity(kWh)4,583,0352136.842
City gas(m3)39,624268.912
Heat(GJ)725986.681
Table 9. Reduction costs by GHG reduction technology. Currency: US dollar.
GHG Reduction TechnologyEnergy UseUnitCost
Budget−200,000
High Efficiency lightingElectricity1.09TJ26,190
Solar powerElectricity0.98TJ23,719
Geothermal energyCity gas0.38TJ2000
Heat0.000008TJ69

