Article

Multi-Technical Flexibility Retrofit Planning of Thermal Power Units Considering High Penetration Variable Renewable Energy: The Case of China

1
State Key Laboratory of Alternate Electrical Power System with Renewable Energy Sources, North China Electric Power University, Baoding 071003, China
2
Department of Electrical Engineering, North China Electric Power University, Baoding 071003, China
*
Authors to whom correspondence should be addressed.
Sustainability 2020, 12(9), 3543; https://doi.org/10.3390/su12093543
Submission received: 8 April 2020 / Revised: 23 April 2020 / Accepted: 24 April 2020 / Published: 27 April 2020
(This article belongs to the Section Energy Sustainability)

Abstract

:
High penetration variable renewable energy introduces flexibility issues to the power system. For countries with coal as their main energy source, retrofitting existing thermal power units is one of the most realistic and feasible measures to improve power system flexibility. Multiple retrofit options will almost certainly be available for each individual power plant—all with distinct investment costs and performance implications. Therefore, this paper develops a multi-technical flexibility retrofit planning model to inform investment decisions of thermal power units in the short term. The model is formulated as a mix linear programming, with the goal of minimizing the systems overall investment and operational costs. In particular, a linear formulation is proposed to solve the coupling problem of retrofitting and operating, and take account of the changes in various units’ operational parameters after retrofit. The correctness and effectiveness of the proposed models are verified by a case study through a modified IEEE-30 bus system. The results demonstrate that it is necessary to consider the complementariness of multiple technologies between units. Besides, the proposed model could minimize the overall system investment and operational costs, and provide advice to planners and power generation companies.

1. Introduction

The abundant, low-cost variable renewable energy (VRE) represented by wind and solar energy resources is driving the low-carbon transformation of power systems [1]. However, in order to respond the variability of VRE, systems require sufficient and various flexible resources to solve the VRE curtailment problem. There are many potential sources of flexibility, including cross-border energy trading [2], demand-side management [3], storage technologies [4], and flexible operation of conventional generation technologies [5]. Among them, conventional generation is currently the dominant source of system flexibility, especially for countries (such as China and Poland) with a very high share of inflexible thermal power units (TPUs). Therefore, retrofitting existing TPUs is one of the most realistic and feasible measures for those countries to improve power system flexibility and increase the system value of VRE [6].
Generally, a flexibility retrofit may involve the modernization or upgrade of multiple subsystems of the unit’s body, or new construction of other auxiliary equipment [7]. Due to the high heat demand for district heating in the winter season, the minimum load level of combined heat and power (CHP) units is very high (usually higher than 60% in China). The retrofits of CHP units are mainly proposed to decouple heat-power operation by upgrading the body of steam turbine or using auxiliary equipment, like thermal storage [8] and electric boilers [9]. Additionally, the retrofits of condensing power-only (CPO) units typically need a more systematic retrofitting of both boiler and turbine parts. On the one hand, the minimum load of a boiler depends on its combustion stability. The flame stability is poor at low load, which is prone to fire extinguishing accidents and reduces the unit’s operating safety. The main retrofit technologies mainly focus on the fuel supply and boiler system, including oxygen-enriched combustion [10], plasma stable combustion [11], and indirect firing technology [7]. On the other hand, the emission limit is another key factor restricting the low load operation of the boiler. It is necessary to ensure the normal operation of denitration systems, dust collectors, and desulfurization systems during low load operation [12].
Regarding the economic decision-making for TPU retrofitting, Na et al. addressed the profit maximizing issues under an assumption of perfect competition, and introduced marginal cost and marginal revenue theories to solve the optimization problems [6]. Barbara and Reinhard developed an investment decision tool based on the real options approach, and conducted a case study on a lignite power plant in Germany [13]. The analysis showed that if the subsidies are sufficient, it is possible to profit through flexibility retrofit. However, some limitations can be observed. First, the proposed results are just based on a specific power plant, and do not consider the other TPUs’ retrofitting, which will lead to a huge uncertainty of profit in future. Second, methods may not be able to capture certain changes in system flexibility that are relevant at operational timescales, or account for the real-life impact of chronological decision making on power system operation.
Recently, to accurately simulate the actual operation of power system, many researches have tried coupling capacity expansion models (CExMs) and production cost models (PCMs). Jonghe et al. proposed a static linear investment model to optimize the generation portfolios [14]. This work demonstrates that the defects of traditional CExMs (without consider flexibility constraints) may cause the unit commitment (UC) model to have no feasible solution and significant VRE curtailment [15]. However, this coupling increases complexity of the model, which becomes computationally intractable for long-term planning [16]. To overcome those problem, Palmintier B S and Meus et al. proposed a clustered UC (CUC) model [17,18]. This model replaced the traditional UC binary decision variables with the integer decision to optimize a group of units rather than an individual unit, after aggregating units with similar operational characteristics in adjacent geographical areas. MA and Belderbos et al. embedded a UC model into the problem of unit investment and construction decision-making, and selected several representative weeks to simplify the calculation of the problem [19,20].
In one hand, just like CExMs, an investment decision tool is also needed to optimize TPUs’ flexibility retrofit deployment to achieve a least-cost, reliable, flexible power system. On the other hand, unlike CExMs, to optimize new generation investment for long-term strategy, a flexibility retrofit planning (FRP) is the complement and improvement for previous CExMs decisions [21]. Specifically, flexibility retrofits are deployed in the existing TPUs, which changes multiple operating parameters of TPUs, such as minimum generation level, ramp rates, start-up times, part-load efficiency, etc. What’s more, the FRP model faces coupling problems of decision-making on retrofitting and operating. The international energy agency (IEA) proposed a multi-step iteration approach to evaluate all the feasible retrofit options [22]. However, when the number of units’ retrofit options is large, this iteration method is computationally intractable. Li et al. presented a retrofit planning model and used benders decomposition algorithm to solve large-scale optimization problem [23]. However, this model ignored a lot of actual operational details of TPUs, and couldn’t simulate the least-cost economic dispatch of the power system subject to physical constraints of generators and the transmission network accurately. More importantly, as shown in Section 2, there is a wealth of technical options (with distinct investment intensity) to enhance the flexibility of each TPU, which is not considered in this model.
In summary, in order to address the above problems, a multi-technical FRP model is proposed in this paper. The main contributions of this paper are summarized as follows:
  • A multi-technical FRP model is proposed to minimize the overall investment and operational costs of the system. This model takes into account various feasible retrofit options and changes in multiple operating parameters of TPUs after retrofitting, providing assistance to planning departments and power generation companies.
  • A linear formulating method is proposed to solve the coupling problems of decision-making on retrofitting and operating, and a mixed integer programming model is established to facilitate the use of commercial solvers such as cplex or gurobi.
  • The effectiveness of the proposed approach is verified through a modified IEEE-30 bus system. Furthermore, the correctness and sensitivity of the model under several scenarios are analyzed and discussed.
The rest of the paper is organized as follows: In Section 2, taking China as an example, the different and various technical options of flexibility retrofit are reviewed. In Section 3, a flexibility retrofit planning model is presented. In Section 4, a case study is presented to verify the effectiveness and correctness of the proposed approach under different scenarios. Section 5 highlights concluding remarks and future works.

2. Flexibility Retrofit Options of TPUs

The goal of retrofitting 220 GW of TPU capacity was codified into China’s 13th Five-Year Plan for the power sector [24]. Moreover, a total of 22 pilot flexibility retrofit projects, including 46 TPUs, were identified by the National Energy Administration of China. Among those projects, there are about six technologies widely used, including turbine bypass heating (TBH), low pressure cylinder zero output (LPCZO), high back pressure heating (HBPH), electrode boiler (EB), solid electric thermal storage (SETS), and heat storage tank (HST). Taking a 350 MW unit (with minimum load of 180 MW) as an example, the technical effect (minimum load reduction) and investment costs of the above technologies are compared in Figure 1.
As shown in Figure 1, EB, SETS and HST technologies can reduce the minimum load by 70~180 MW and do not involve major retrofitting of steam turbine, but their investment costs are too high, about $4.3~28.6 million. The other three technologies modify or upgrade the steam turbine body, and decrease the share of power energy and increase heat energy for external heating. Particularly, the LPCZO and EB technologies not only have a better performance, but also have lower investment costs.
However, due to the differences in geographical location, actual conditions and functional positioning, not all of these retrofit options will necessarily be essential or appropriate for each TPU [25]. The above six feasible technologies may not be applicable to other TPUs or don’t have similar retrofit performance and investment in other 350 MW TPUs. For example, related to local geographic space and land cost of power plants, EB technology may have different economic benefits among TPUs. Therefore, the planning department should cooperate with the power generation companies (PGCs) to explore all the feasible retrofit options and investment costs of each TPU, and then use a multi-technical FPR model to make decision on retrofits deployment of TPUs, as shown in Figure 2.
Assume all the feasible retrofit technologies of unit i have been collected and evaluated, denoted by a set Hi. The retrofitting investment cost for unit i, C i r e t , can be expressed by Equation (1):
C i r e t = h H i C i , h r e t · y i , h
where C i , h r e t is the investment cost for unit i under retrofit technology h, and y i , h is the decision variable for unit i adopting technology h, constrained by Equation (2):
h H i y i , h = 1
Equation (2) represents the logic of the unit i can have only one option from Hi applied, and it should be noted that the option of not retrofitting (h = 0) is also one of the elements of Hi.

3. Multi-Technical FRP Model

To solve the coupling decision on retrofitting and operating in the planning model, a multi-technical FRP (M-FRP) model is constructed.

3.1. Objective Function

The objective function of the M-FRP model aims to minimize total retrofit investment costs and operational system costs which consist of the generation costs C i , t g e n , start-up costs C i , t s t a r t , shut-down costs C i , t s t o p , and costs of VRE and load curtailment C t c u r .
min F = p P ω p { t T p i I ( C i , t g e n + C i , t s t a r t + C i , t s t o p ) + t T p C t c u r } + i I C i r e t
where P is the set of representative periods (e.g., days, weeks); ω p is the weight of the representative period p; Tp is the time series set of the representative period p; and I is the set of all the TPUs.
1.   Power generation costs.
The generation costs depend on many factors such as the local price of the fuel and cost of carbon emissions. The cost curve is generally expressed as a quadratic function, which can be approximated by multiple linear intervals [26]. However, this method drastically increases the running time, not appropriate to the long-term planning model. Therefore, the non-linear cost curve is linearized in Equation (4):
C i , t g e n = h H i ( N C i , h · u i , h , t + M C i , h · g i , h , t ) ,     i I , t T p
where u i , h , t is the on/off status of unit i at time t under technology h (For the sake of brevity, similar subscripts are not explained in detail below); g i , h , t is the generation output above the minimum output; and N C i , h and M C i , h are the generation cost at minimum output and marginal generation cost.
2.   Start-up cost and Shut-down cost.
The start-up costs are related to the off-line time of the unit, and generally divided into hot start, warm start, and cold start status [27]. However, similar to the generation cost, we simplify the formulation of start-up and shut-down costs, considering only one state.
C i , t s t a r t = h H i S U C i , h · v i , h , t , i I , t T p
C i , t s t o p = h H i S D C i , h · z i , h , t , i I , t T p
where v i , h , t and z i , h , t are binary variables of start-up and shut-down state. S U C i , h and S D C i , h are start-up and shut-down costs.
3.   Curtailment cost.
C t c u r = V C C · n N r c n , t + L C C · n N l c n , t ,     t T p
where N is the set of nodes; r c n , t and r c n , t are VRE and load curtailment of node n at time t; VCC and LCC are curtailment cost of VRE and load, respectively.
4.   Retrofit investment cost.
The retrofit investment cost of each unit is shown in Equations (1) and (2). In order to compare with operational system costs, we adopt the equivalent annuity method [28] to annualize the investment cost of retrofits. Equation (1) is replaced by Equation (8):
C i r e t = h H i C i , h r e t · y i , h · r · ( 1 + r ) q ( 1 + r ) q 1 ,     i I
where r is the interest rate and q is the amortization period.

3.2. Constraints

The constraints of the M-FRP model consist of market clearing constraint, reserve constraint, curtailment constraint, and flexibility constraints. Flexibility constraints include generation output limits, ramping limits, and minimum online/offline times.
1.   Market clearing constraint.
i I A n , i h H i g e n i , h , t + R E n , t r c n , t = D n , t l c n , t , n N , t T p
where A n , i is linking matrix of unit i to node n; R E n , t and D n , t are VRE generation output and electricity demand of node n at time t.
2.   Reserve requirement constraint.
i I h H i P ¯ i , h · u i , h , t + ( 1 λ ) · n N R E n , t ( 1 + δ ) · n N D n , t     , t T p
where P ¯ i , h is the maximum output of unit i under technology h; λ and δ are reserve coefficients of VRE and load.
3.   Curtailment constraints.
0 v c n , t R E ¯ n , t , n N , t T p
0 l c n , t D n , t , n N , t T p
where R E ¯ n , t is available generation from VRE of node n at time t.
4.   Generation output limits.
0 g i , h , t ( P ¯ i , h P _ i , h ) · u i , h , t ( P ¯ i , h S U i , h ) · v i , h , t ( P ¯ i , h S D i , h ) · z i , h , t + 1 , i I , t T p
g e n i , h , t = g i , h , t + P _ i , h · u i , h , t , i I , t T p
0 g e n i , h , t P ¯ i , h · y i , h , i I , t T p
where S U i , h and S D i , h are the maximum start-up and shut-down rate [29] of unit i under technology h; P _ i , h is the generation minimum output of unit i under technology h. Equation (15) links the two decision components in M-FRP (retrofitting and operating), with a coupling constraint imposing the condition that only units that have been retrofitted can generate.
5.   Ramping limits.
The allowable thermal stress for thick-walled components and the allowable unsymmetrical deformations limit the ramp rate. For coal-fired TPUs, the storage behavior of the steam generator, the quality of fuel used for combustion (which has a direct effect on temperature variation), and the time lag between coal milling and turbine response can also act as limiting factors.
g e n i , h , t g e n i , h , t 1 R U i , h · u i , h , t + ( S U i , h R U i , h ) · v i , h , t , i I , t T p
g e n i , h , t 1 g e n i , h , t R D i , h · u i , h , t 1 + ( S D i , h R D i , h ) · z i , h , t , i I , t T p
where R U i , h and R D i , h are the maximum ramp-up and ramp-down rate of unit i under technology h.
6.   Minimum online and offline times constraints.
Generally, the frequent start-up and shut-down of the boiler will put greater thermal stress on plant components, thereby reducing their lifetime. Therefore, units’ start-up and shut-down are constrained by minimum online and offline times.
u i , h , t t = t + 1 M U T i , h t v i , h , t , i I , t T p
1 u i , h , t t = t + 1 M D T i , h t z i , h , t , i I , t T p
where M U T i , h and M D T i , h are the minimum online and offline times of unit i under technology h.
7.   Network constraint.
Compared with CExMs, flexibility retrofit is a near-term strategy, and the grid structure does not undergo major changes. Namely, the M-FRP model is based on the existing power network. A DC power constraint [27] of the electricity grid is implemented, as shown in Equations (20) and (21).
P l max P l , t P l max , l L , t T p
P l , t = n N I G l n · P i , t n N L G l n · D n , t , l L , t T p
where L is the set of transmission lines; NI is the set of unit nodes; NL is the set of load nodes; P l , t is the power flow through line l at time t; P l max is the maximum power flow through transmission line l; and G l n is the network transfer factors.
8.   Retrofit target constraints.
According to the China’s 13th Five-Year Plan, the retrofit target is to reduce a total of 4600 MW of units’ minimum output [24]. The target is denoted by θ , as shown in Equation (22).
i I h H i ( P _ i , 0 P _ i , h ) · y i , h θ
where P _ i , 0 is the generation minimum output of unit i before retrofitting.
9.   Variable constraints.
u i , h , t 1 u i , h , t + v i , h , t z i , h , t = 0 , i I , t T p
u i , h , t , v i , h , t , z i , h , t , y i , h { 0 , 1 } , i I , h H i , t T p
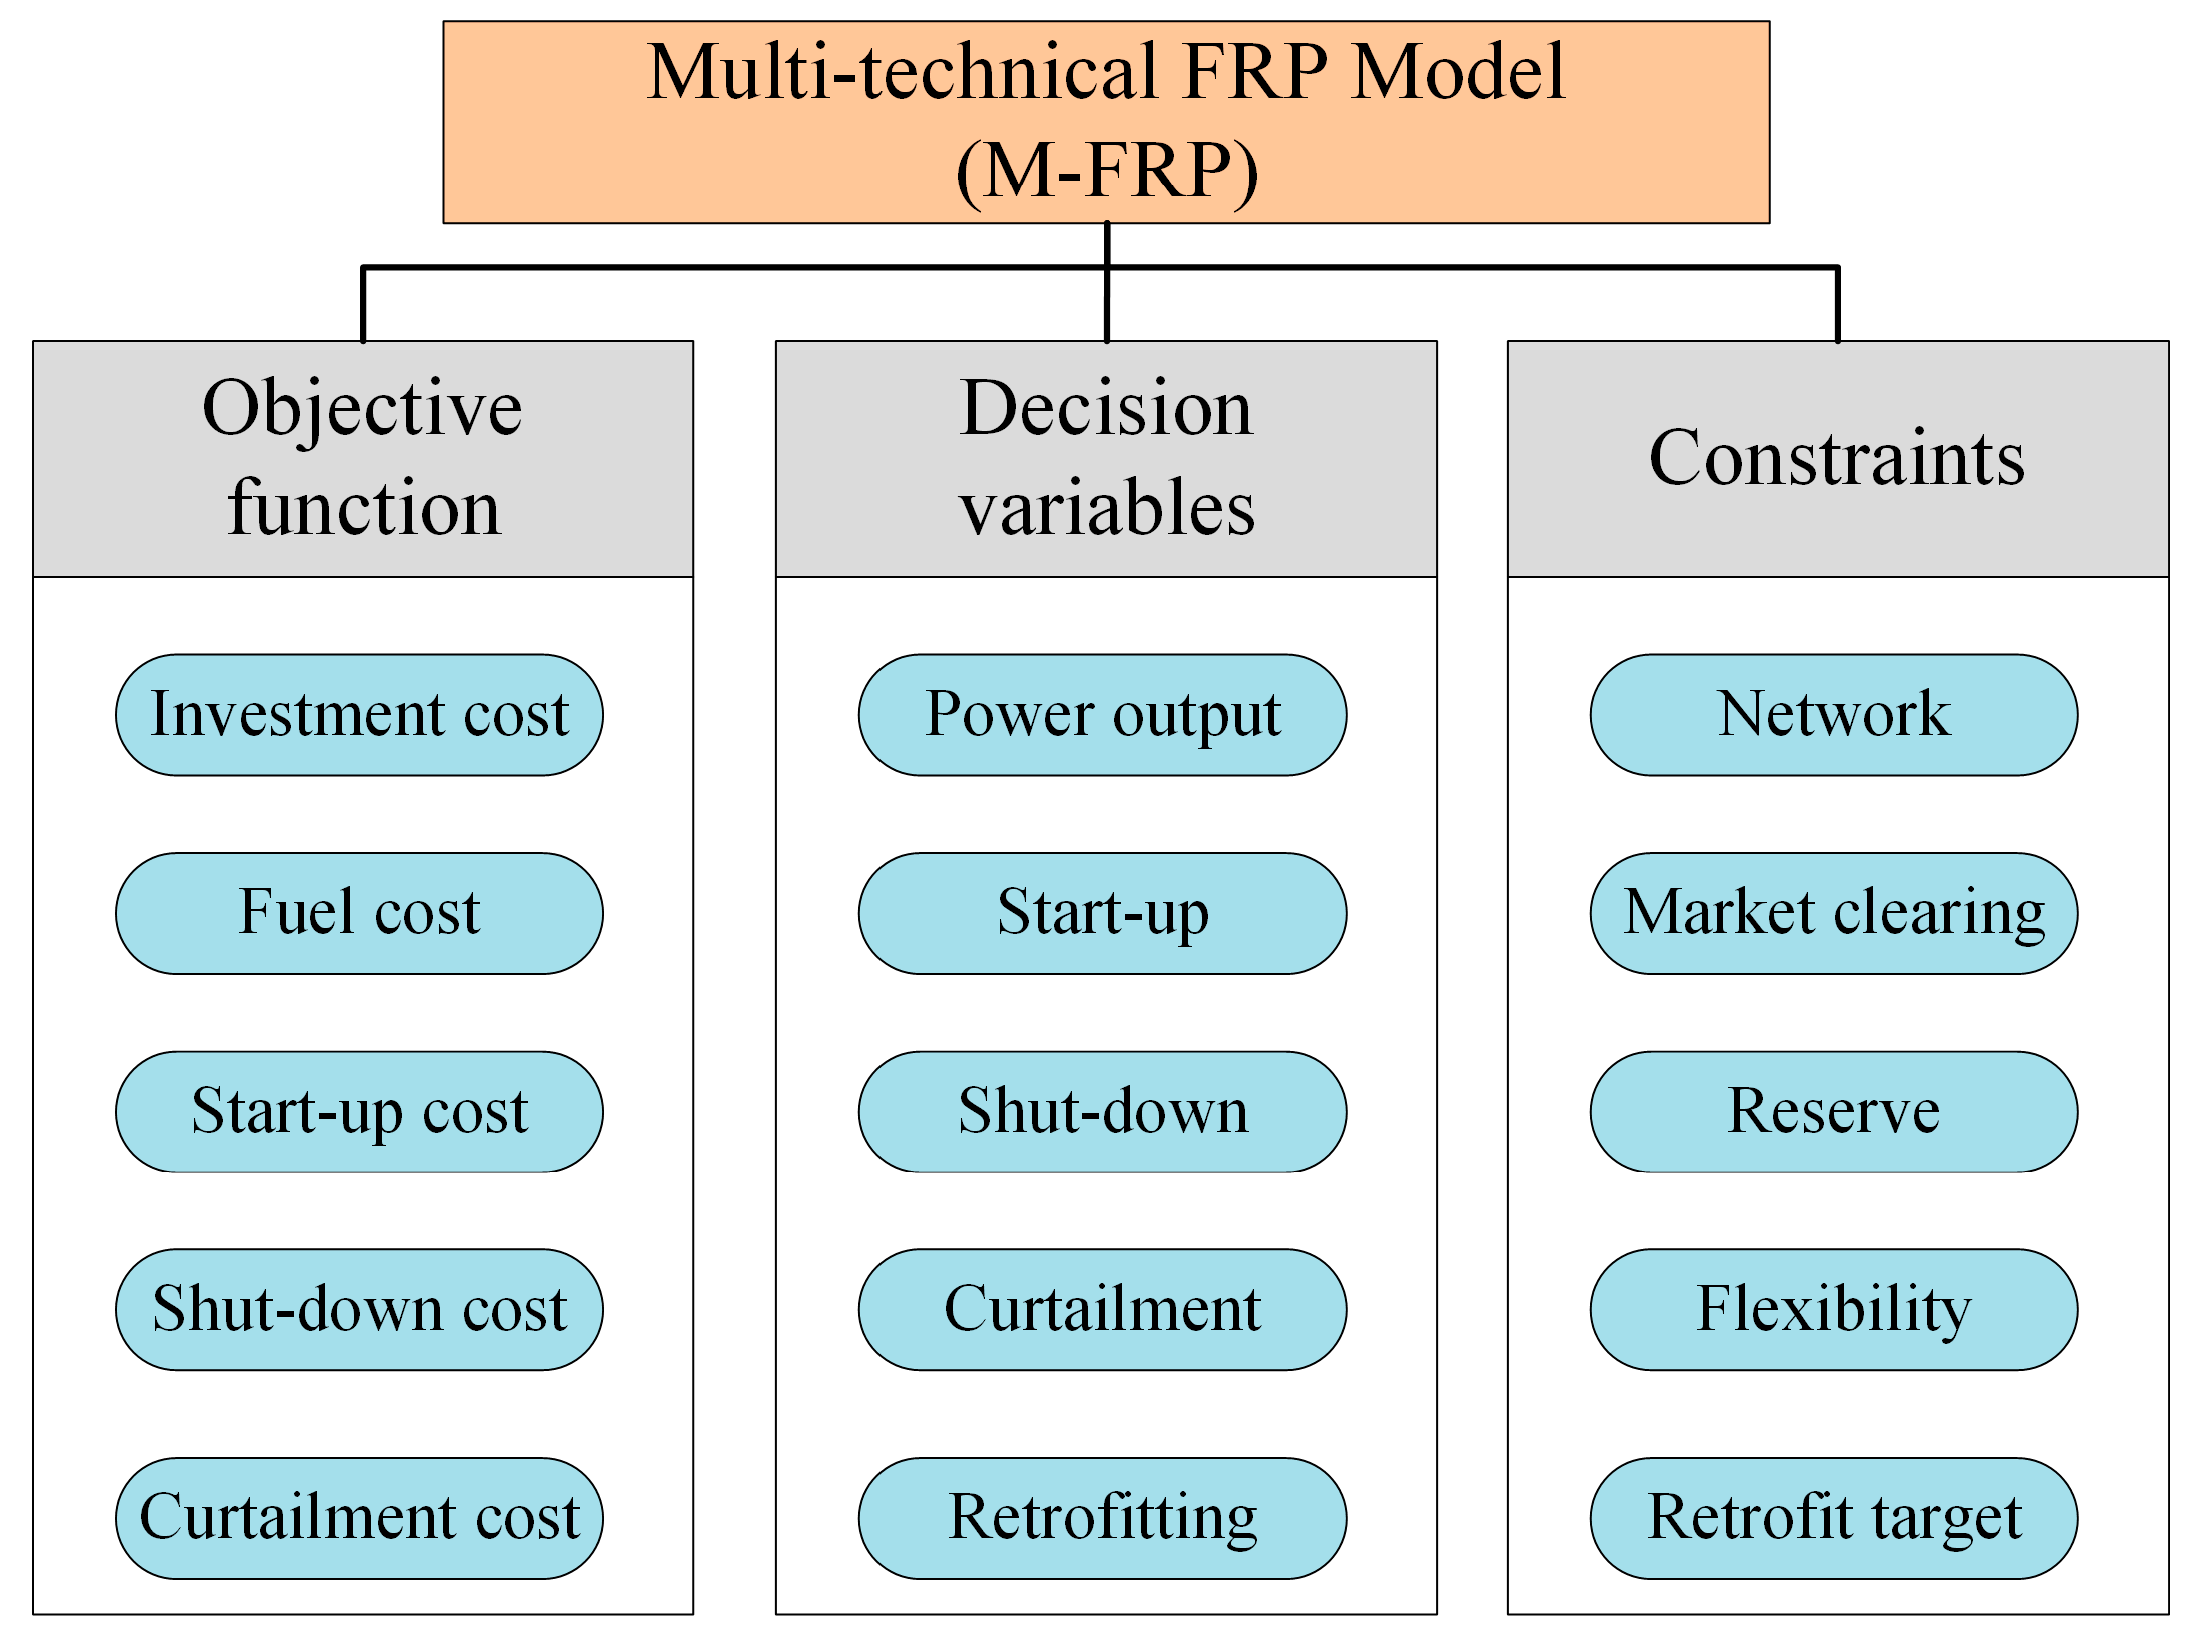
The proposed M-FRP model is formulated as a mix linear programming, including four types of binary variables, which is convenient for the use of commercial solvers. The framework of the M-FRP model is shown in Figure 3.

4. Case Study

This section tests and verifies the effectiveness of the proposed approach. Detailed data are shown in Section 4.1, and the correctness and sensitivity of the proposed model under several scenarios are analyzed and discussed in Section 4.2, Section 4.3 and Section 4.4.

4.1. Dataset

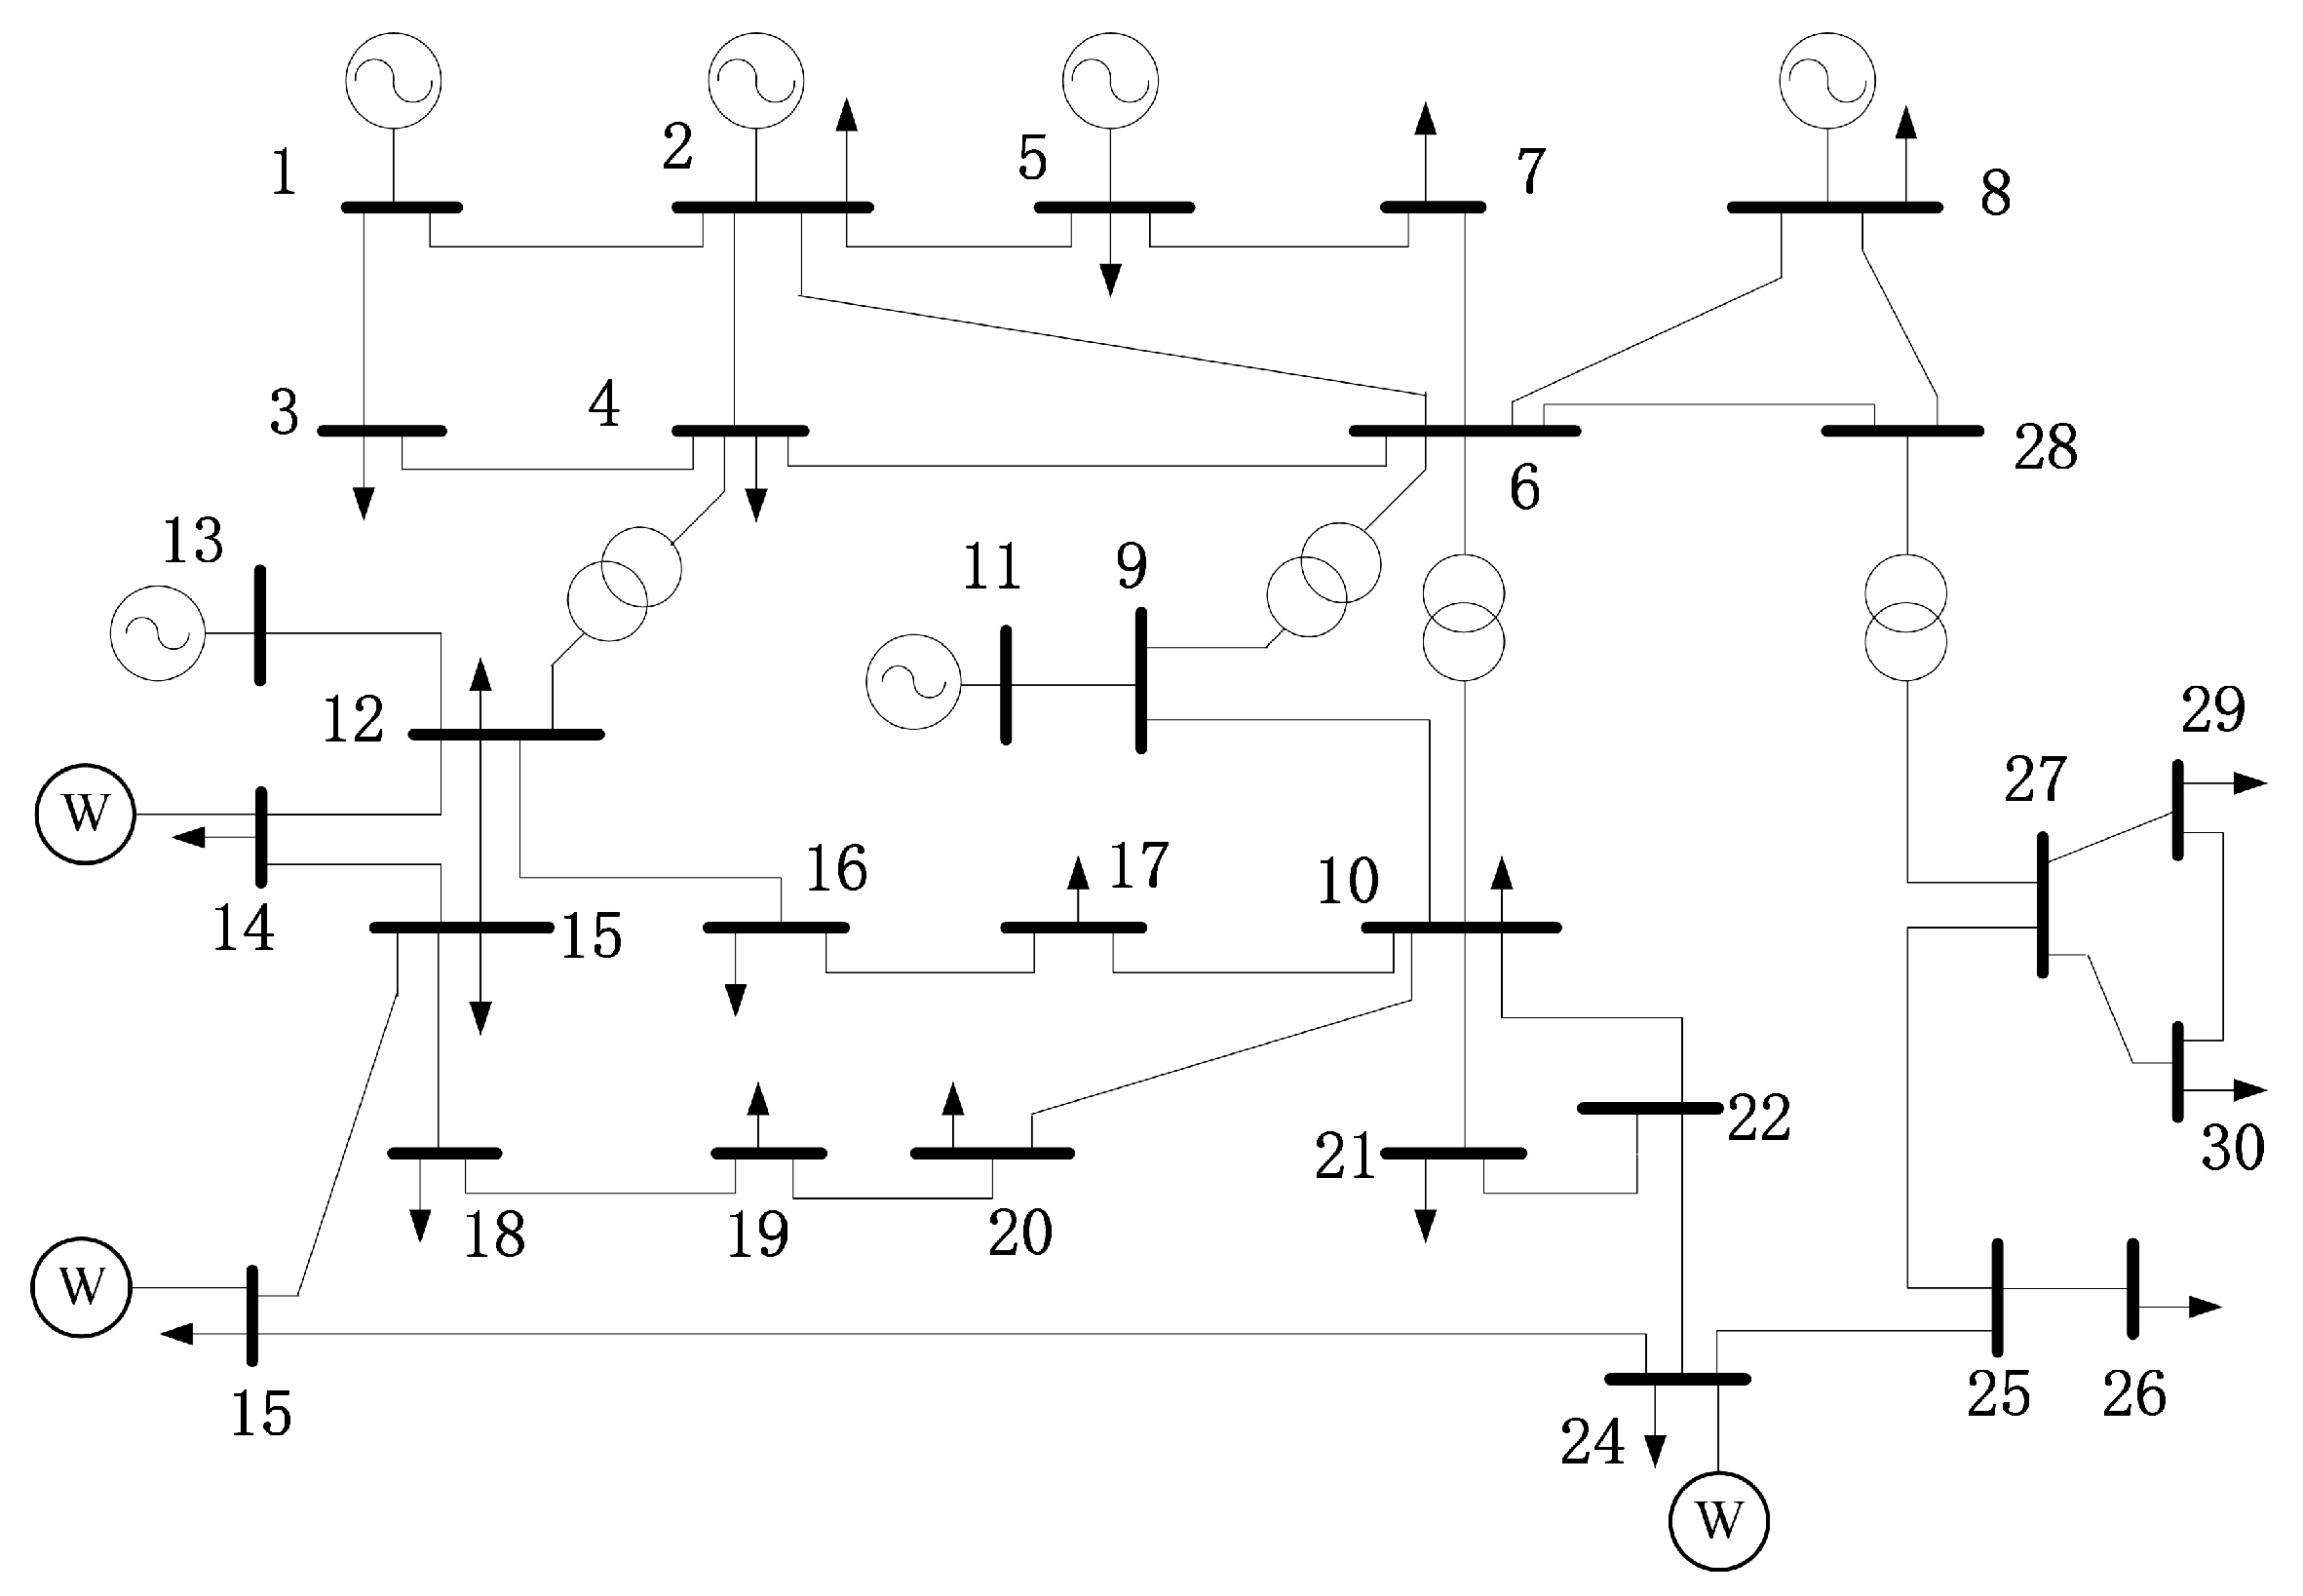
The test system is based on a modified IEEE-30 Bus system [30], as depicted in Figure A1. The installed capacity of TPUs was 1850 MW, including 6 units, and belonged to 3 different PGCs respectively, as presented in Table 1. The operating parameters of each unit after being retrofitted with various technologies are shown in Table A1.
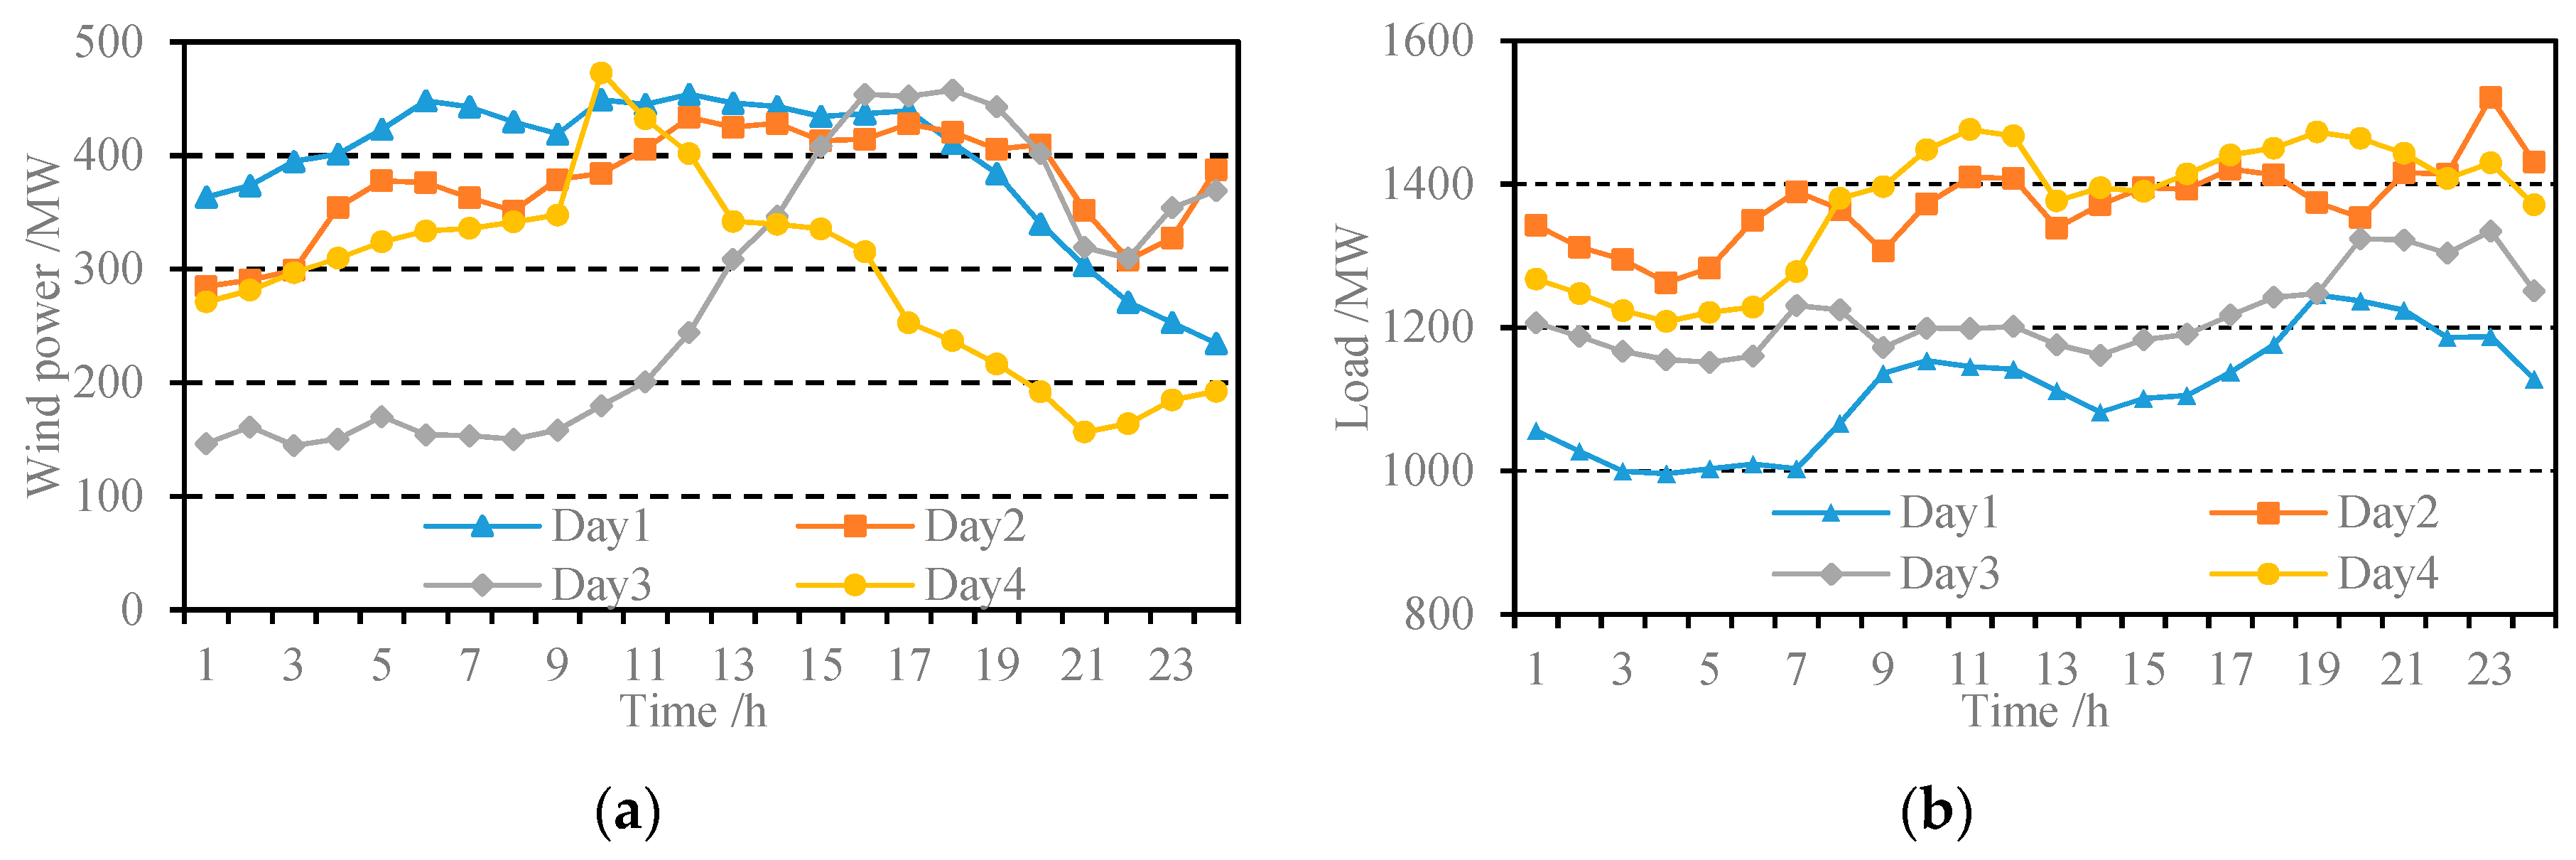
The peak electricity demand was 1800 MW, and the installed capacity of wind power was 700 MW (containing 3 wind farms, located at Buses 14, 15 and 24, respectively). The load and VRE power profiles were scaled from a province’s 2017 data in China. By using the cluster method proposed in Reference [31], we selected 4 representative days to simulate one full year, as shown in Figure 4. After clustering, the weight (based on 365 days a year) of each representative day was 52, 66, 78 and 169, respectively. To accommodate more VRE, the penalties on VRE and load curtailment were set at $500/MW and $1000/MW.

4.2. The Impact of Multiple Technical Retrofit Options

Li et al. presented a single-technical FRP (S-FRP) model to make decision on retrofit deployment [23]. This model didn’t account for the multiple retrofit options and just considered the changes of minimum output and ramp rate parameters of unit. In order to illustrate the advantage of the proposed method, the S-FRP and M-FRP models are compared in Section 4.2.1 and Section 4.2.2.

4.2.1. Comparison of Retrofit Decisions

The retrofit target of the system was set as 240 MW. Considering that S-FRP model just makes decisions on whether units should be retrofitted or not, we assume PGCs just consider adopting the least investment retrofit option of each unit, as shown in Table 2.
In order to explore the impact of changes in multiple operating parameters, we also propose a new retrofit strategy (named “M-LIO”), based on M-FRP model. The “M-LIO” strategy only considers the minimum investment option of each unit in Table 2, which is different from the M-FRP strategy. Comparison of retrofitting decisions under three retrofit strategies is shown in Table 3.
By comparing S-FRP and M-LIO strategies, we can see that the retrofit decisions of G4, G5, and G6 are different, which means the changes of multi-operation parameters may affect the retrofit decisions of the entire system. More importantly, it can be observed from Table 3 that the proposed M-FRP method has the lowest number of retrofitted units among three strategies, in which G5 and G6 adopt the other options not listed in Table 2. If the PGCs just adopt the minimum investment options of their units, the retrofitting decision of the entire system may be suboptimal.

4.2.2. Comparison of System Costs

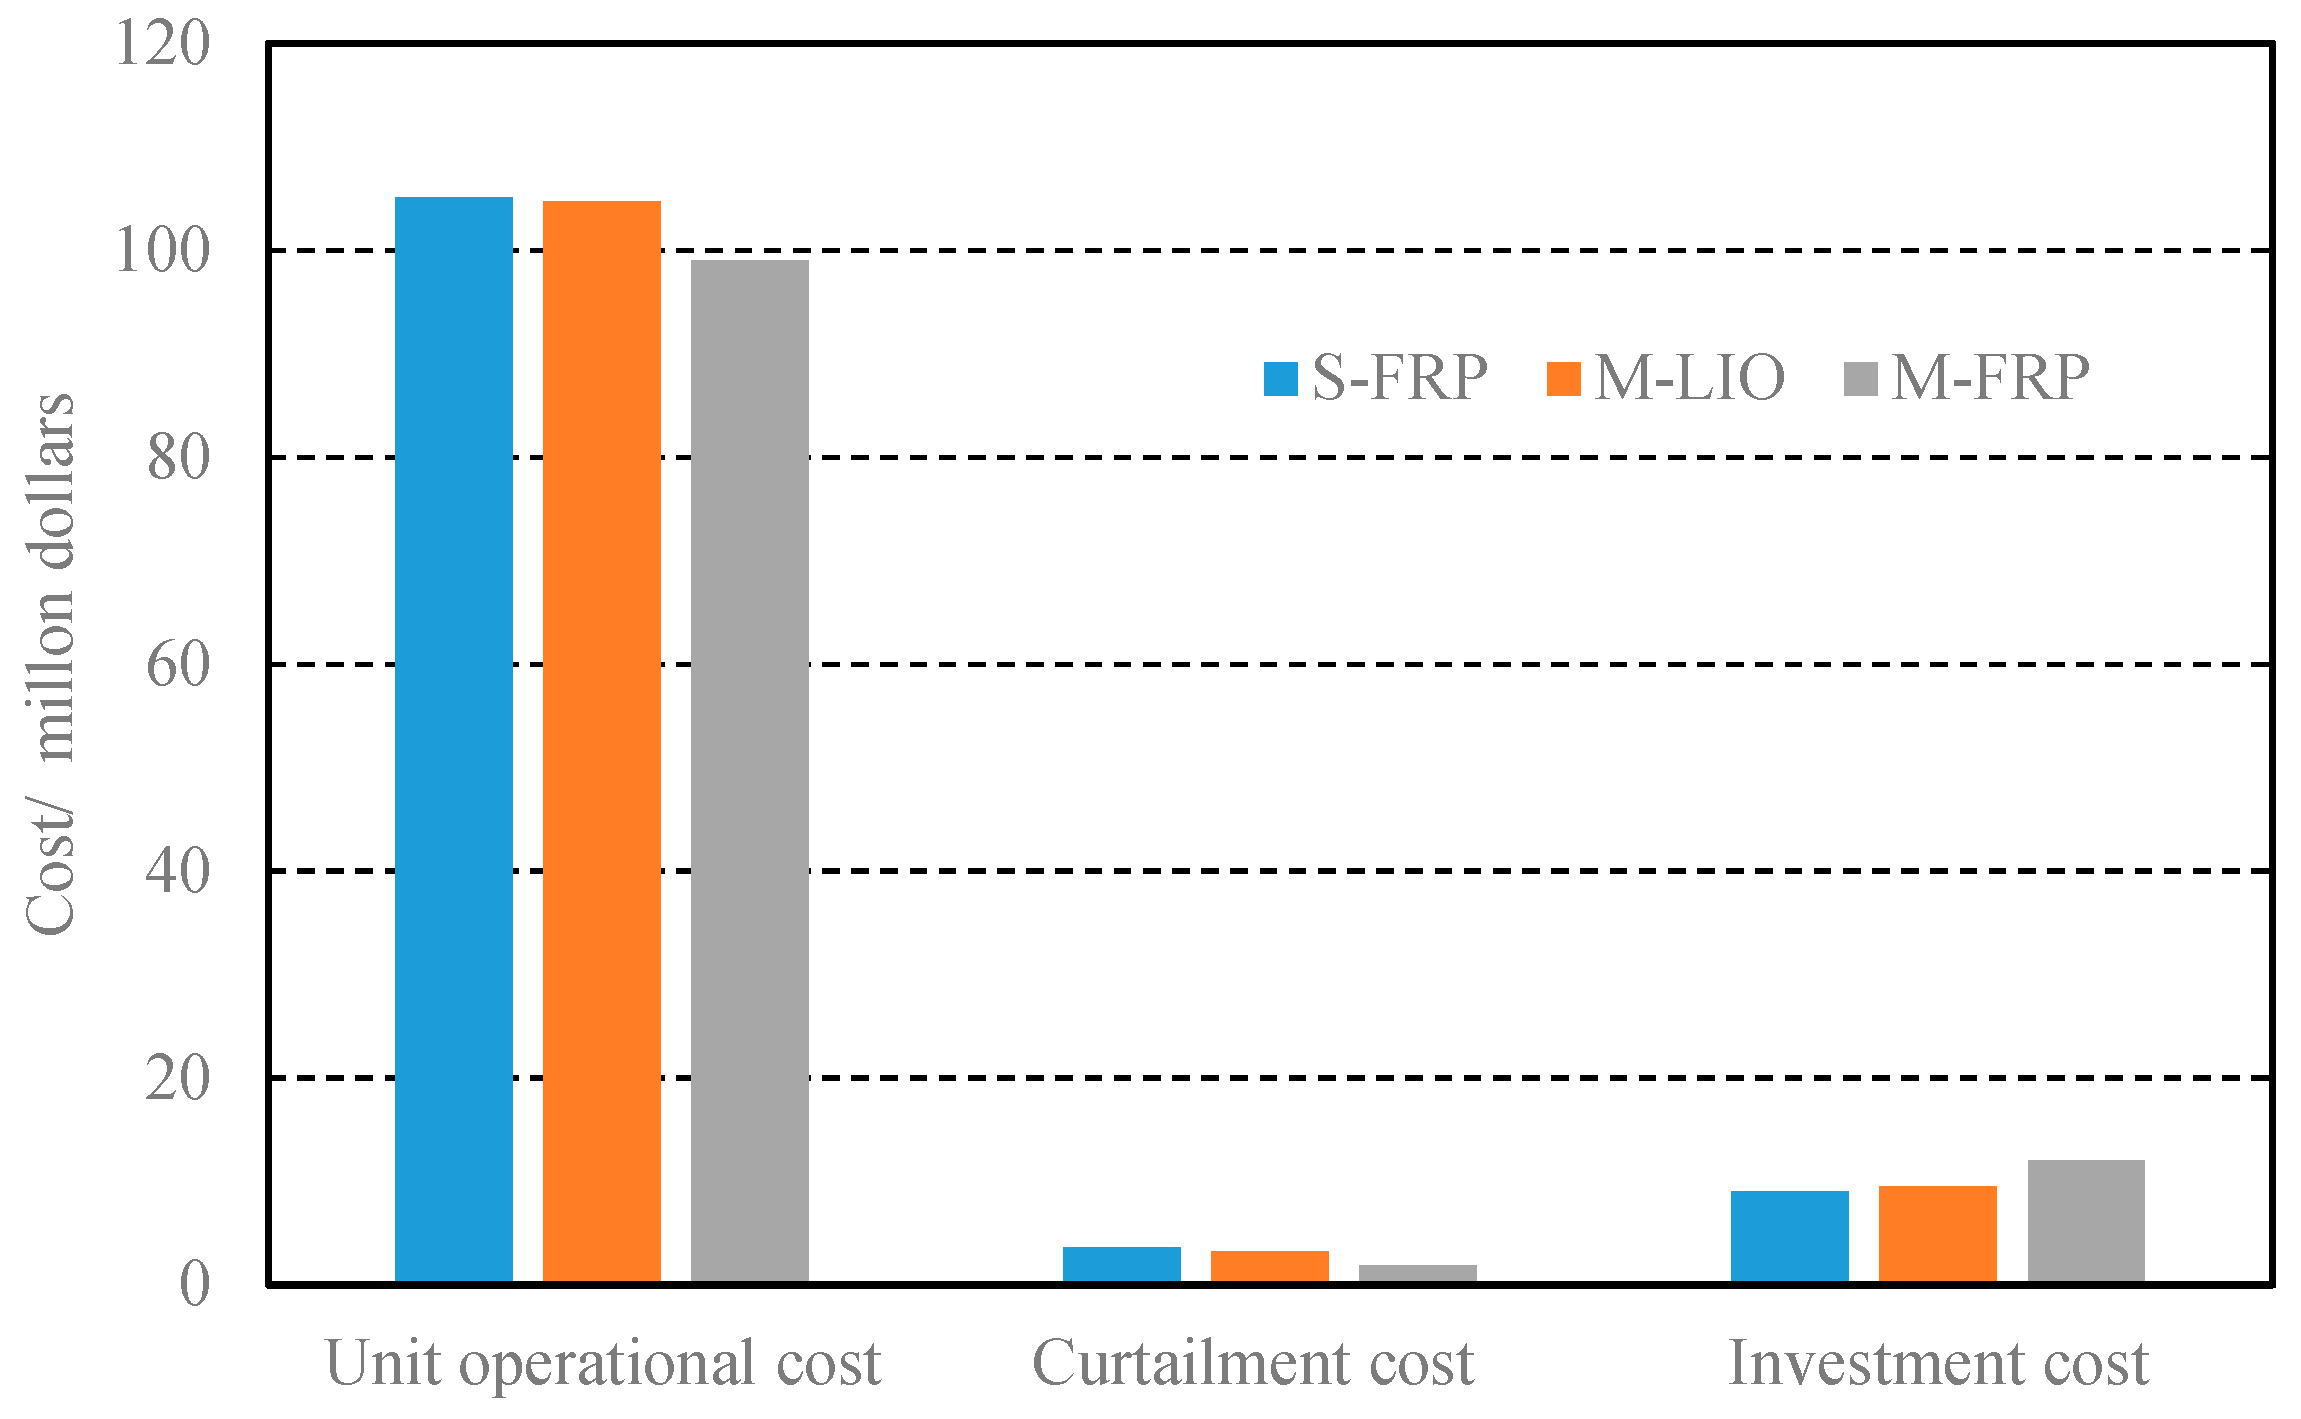
The unit operational costs (power generation cost plus start-up and shut-down cost of unit), curtailment costs, and investment costs of three strategies are compared in Figure 5.
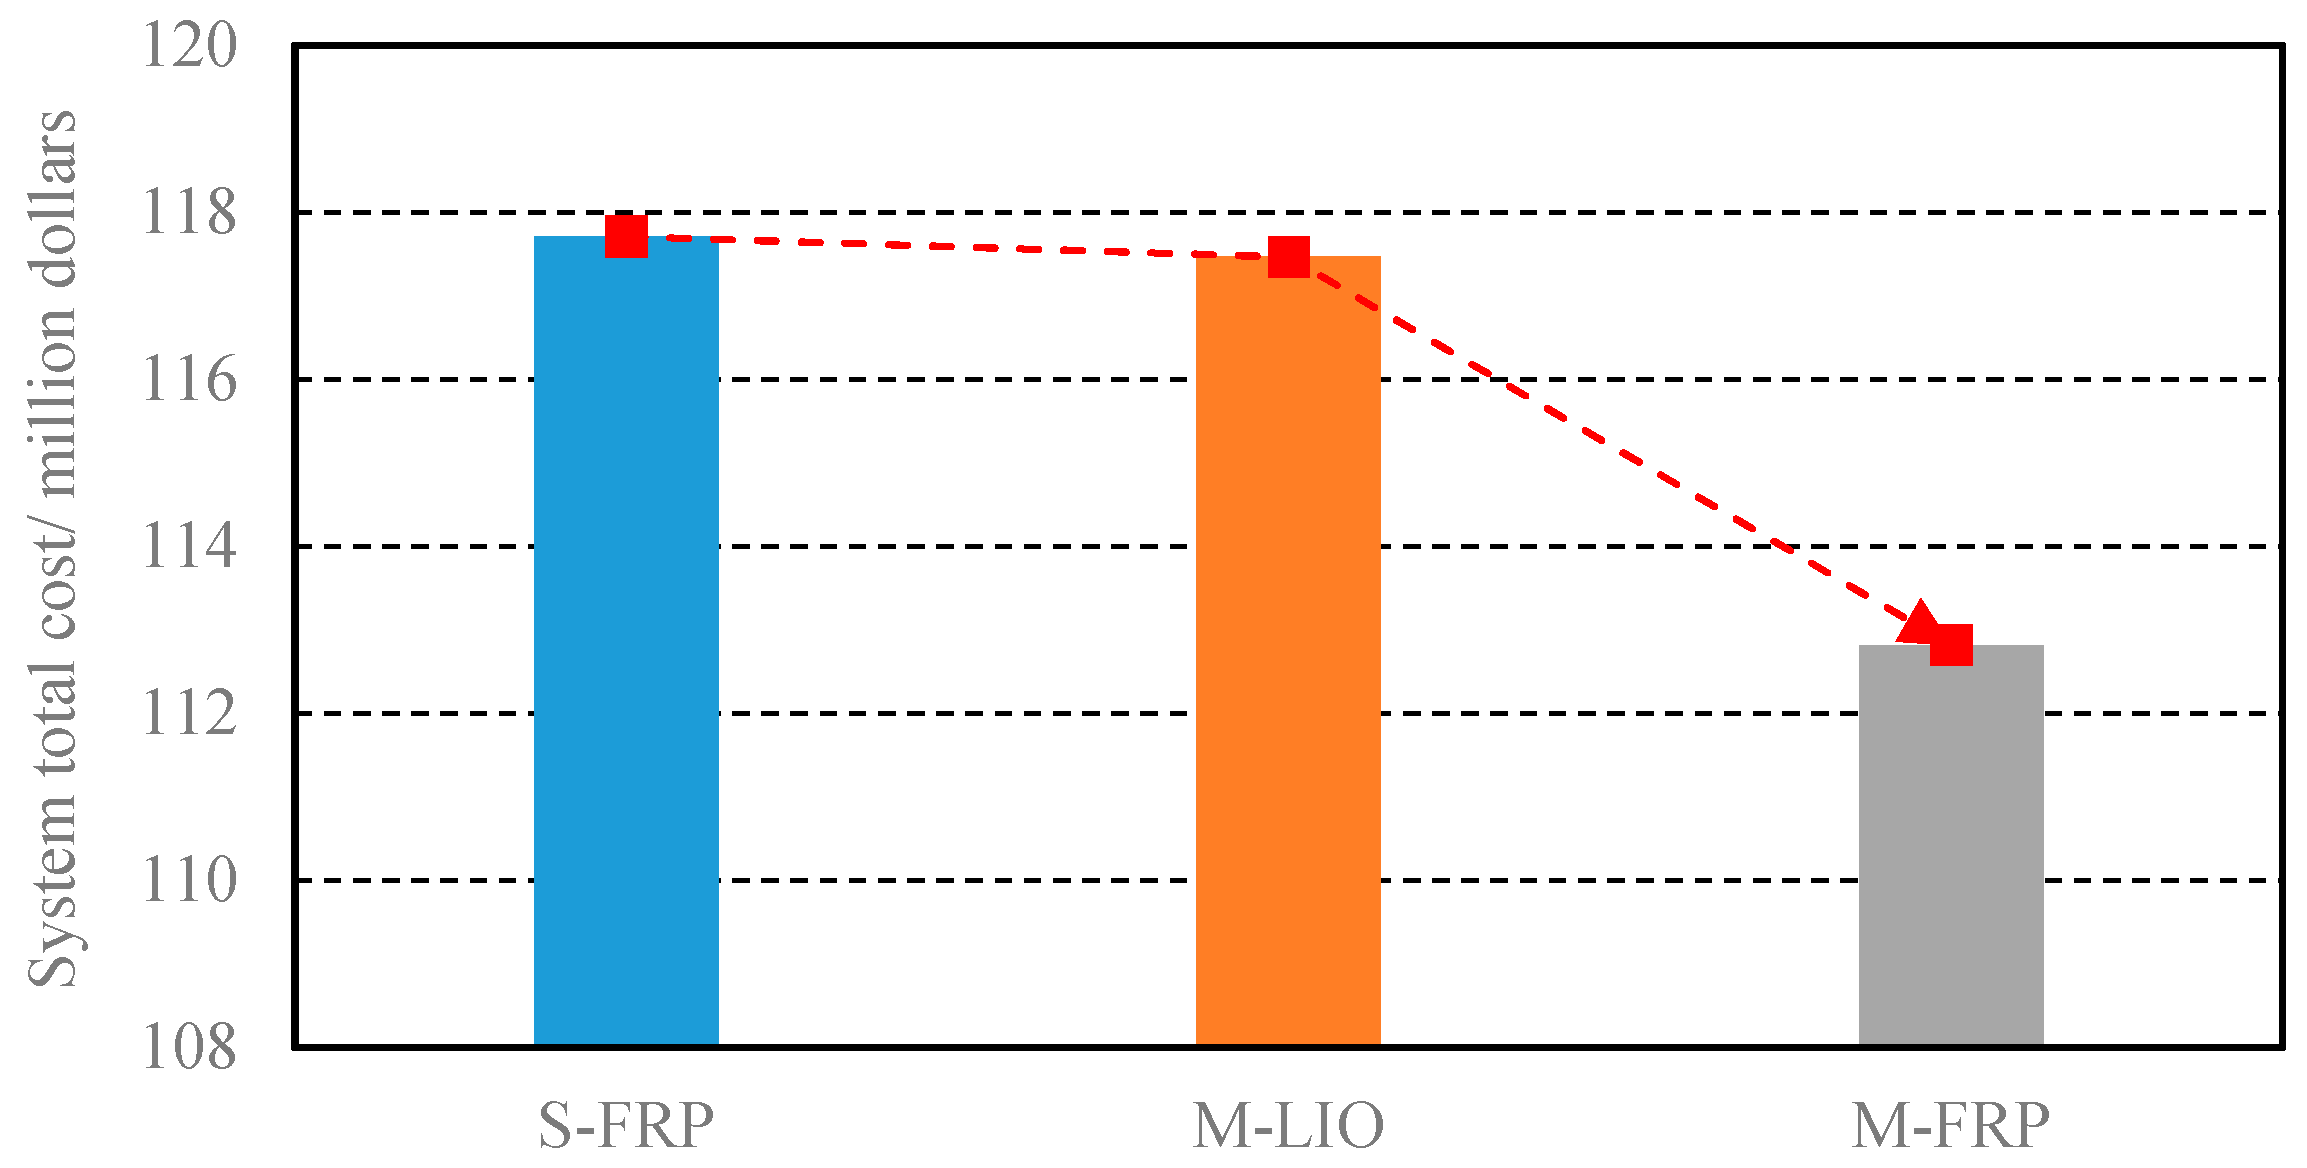
As can be observed from Figure 5, the unit operational cost and curtailment cost under M-LIO were lower than S-FRP slightly. The M-FRP strategy had the least curtailment cost and unit operational cost among three strategies, but its investment cost was the highest. The system total costs (unit operational cost plus curtailment cost and investment cost) of three strategies are compared in Figure 6. Several findings can be summarized as follows. First, the proposed M-FRP method achieved the least system cost compared to S-FRP and M-LIO. This finding verifies that it is more economical to consider the multiple technologies of the units when deploying retrofits. Second, there were little differences of total system costs between M-LIO and S-FRP (the cost of S-FRP is relatively higher), which means minimum output and ramping rate parameters may be the dominant parameters in the retrofits planning. Furthermore, compared to the M-LIO strategy, it seems that considering multiple retrofit options may reduce the total system cost more. However, limited by computation, the selected representative periods were relatively short, and can’t simulate the long-term chronological operation of TPUs. Hence, due to the defects of the planning method of representative periods, it is hard to determine whether the other operating parameters (especially, the parameters related to unit start-up or shut-down) are more important in retrofit planning models.

4.3. The Impact of Quota System for Retrofits Deployment

According to the author’s investigation, some regions in China may adopt a quota system (not officially reported) to deploy flexibility retrofits of units. Under the quota system, the retrofit target is allocated to the PGCs based on some related indicators. For example, the “proportion of installed capacity” indicator (denoted by CAP) is considered in this paper, as follows:
Q k = θ · C k / k K C k
where Q k is the retrofit task assigned to PGC k; C k is the total installed capacity of PGC k; and K is the set of all the PGCs. Hence, PGCs with higher installed capacity in the system will have higher assigned retrofit tasks.
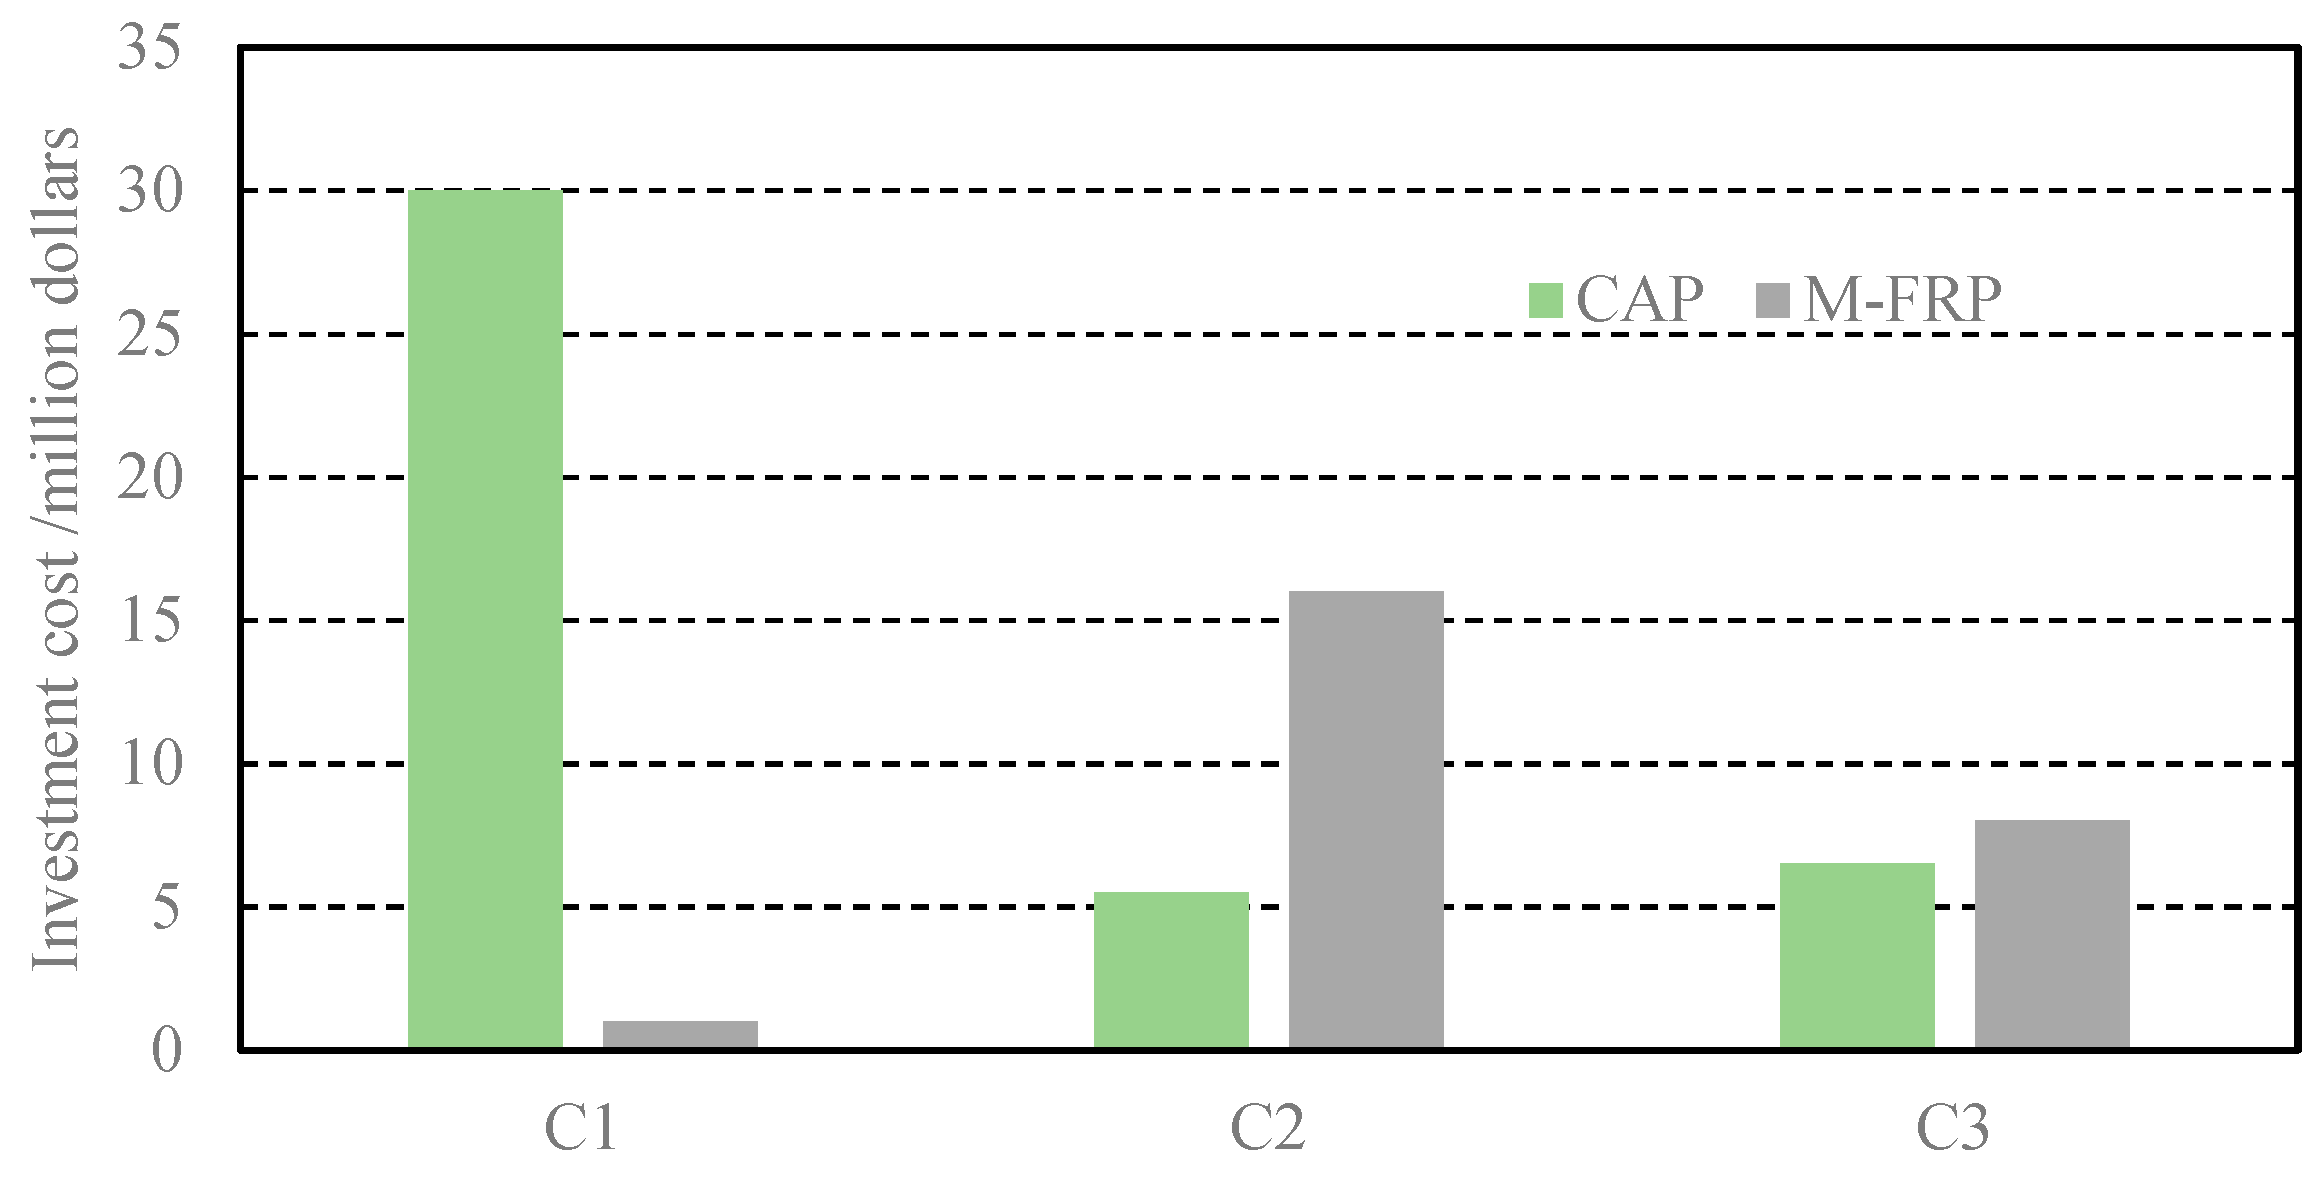
When the retrofit target of the system is set as 400 MW, the retrofit tasks assigned to C1, C2 and C3, are 162 MW, 119 MW and 119 MW respectively. The PGCs need to comprehensively analyze and evaluate the characteristics of their units, and then complete the retrofit tasks in the most economical way. However, the total system cost of the CAP strategy is higher than M-FRP by about $40 million. There are mainly two reasons why the CAP strategy is uneconomical. First, the CAP strategy ignores the minimum output ratio of the unit. If the unit’s minimum output levels of units of a PGC are very low, there is no need to allocate more retrofit tasks to this PGC. Second, as shown in Figure 7, the quota system may cause some PGCs to invest a lot of money to complete the retrofit task, thereby increasing the total investment cost of all the system.
In addition, when the retrofit target of the system is set as 400 MW, even if an M-FRP strategy is adopted, the system operational cost will also increase more than before the retrofitting, which is largely caused by the excessively high retrofits target, as shown in Figure 8.
As we can observe from Figure 8, the operating cost of the system first decreases and then increases as the retrofit target increases. When the system retrofit target exceeds 120 MW, the system operational cost is higher than no retrofits. Therefore, the system planning department should reasonably set the system retrofit target to ensure the economic operation of the system.

4.4. Comparison before and after Retrofitting

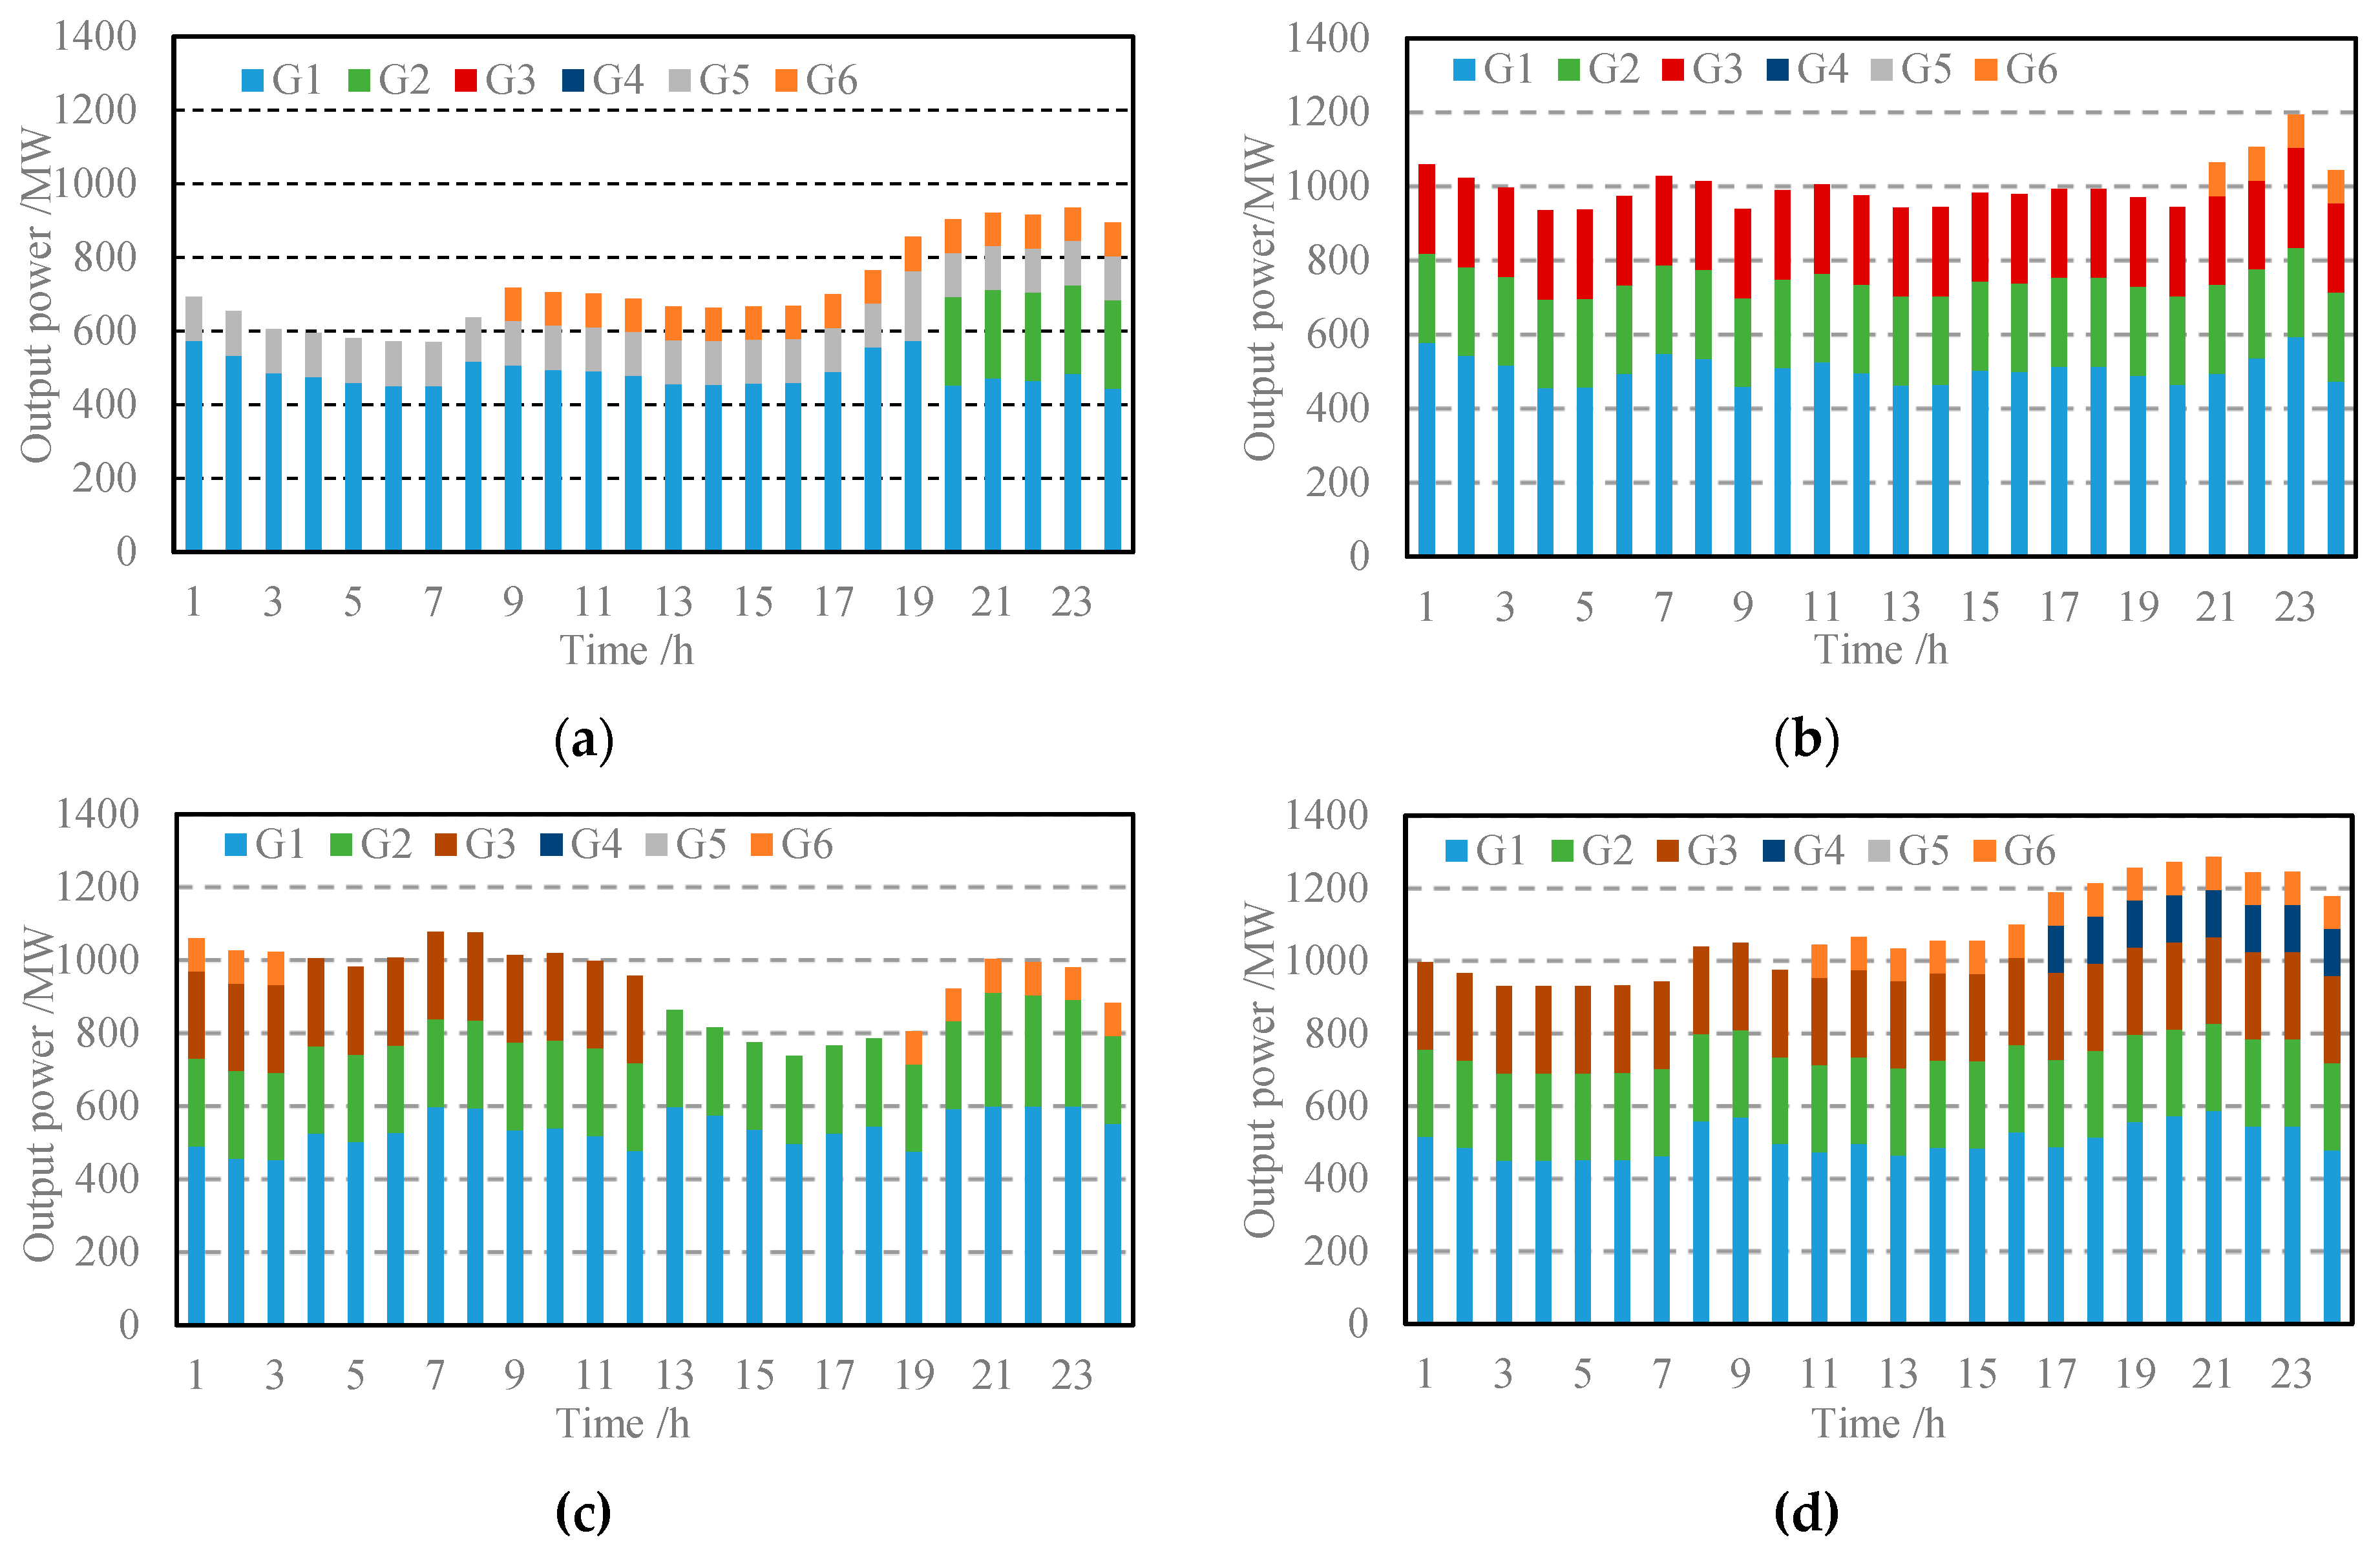
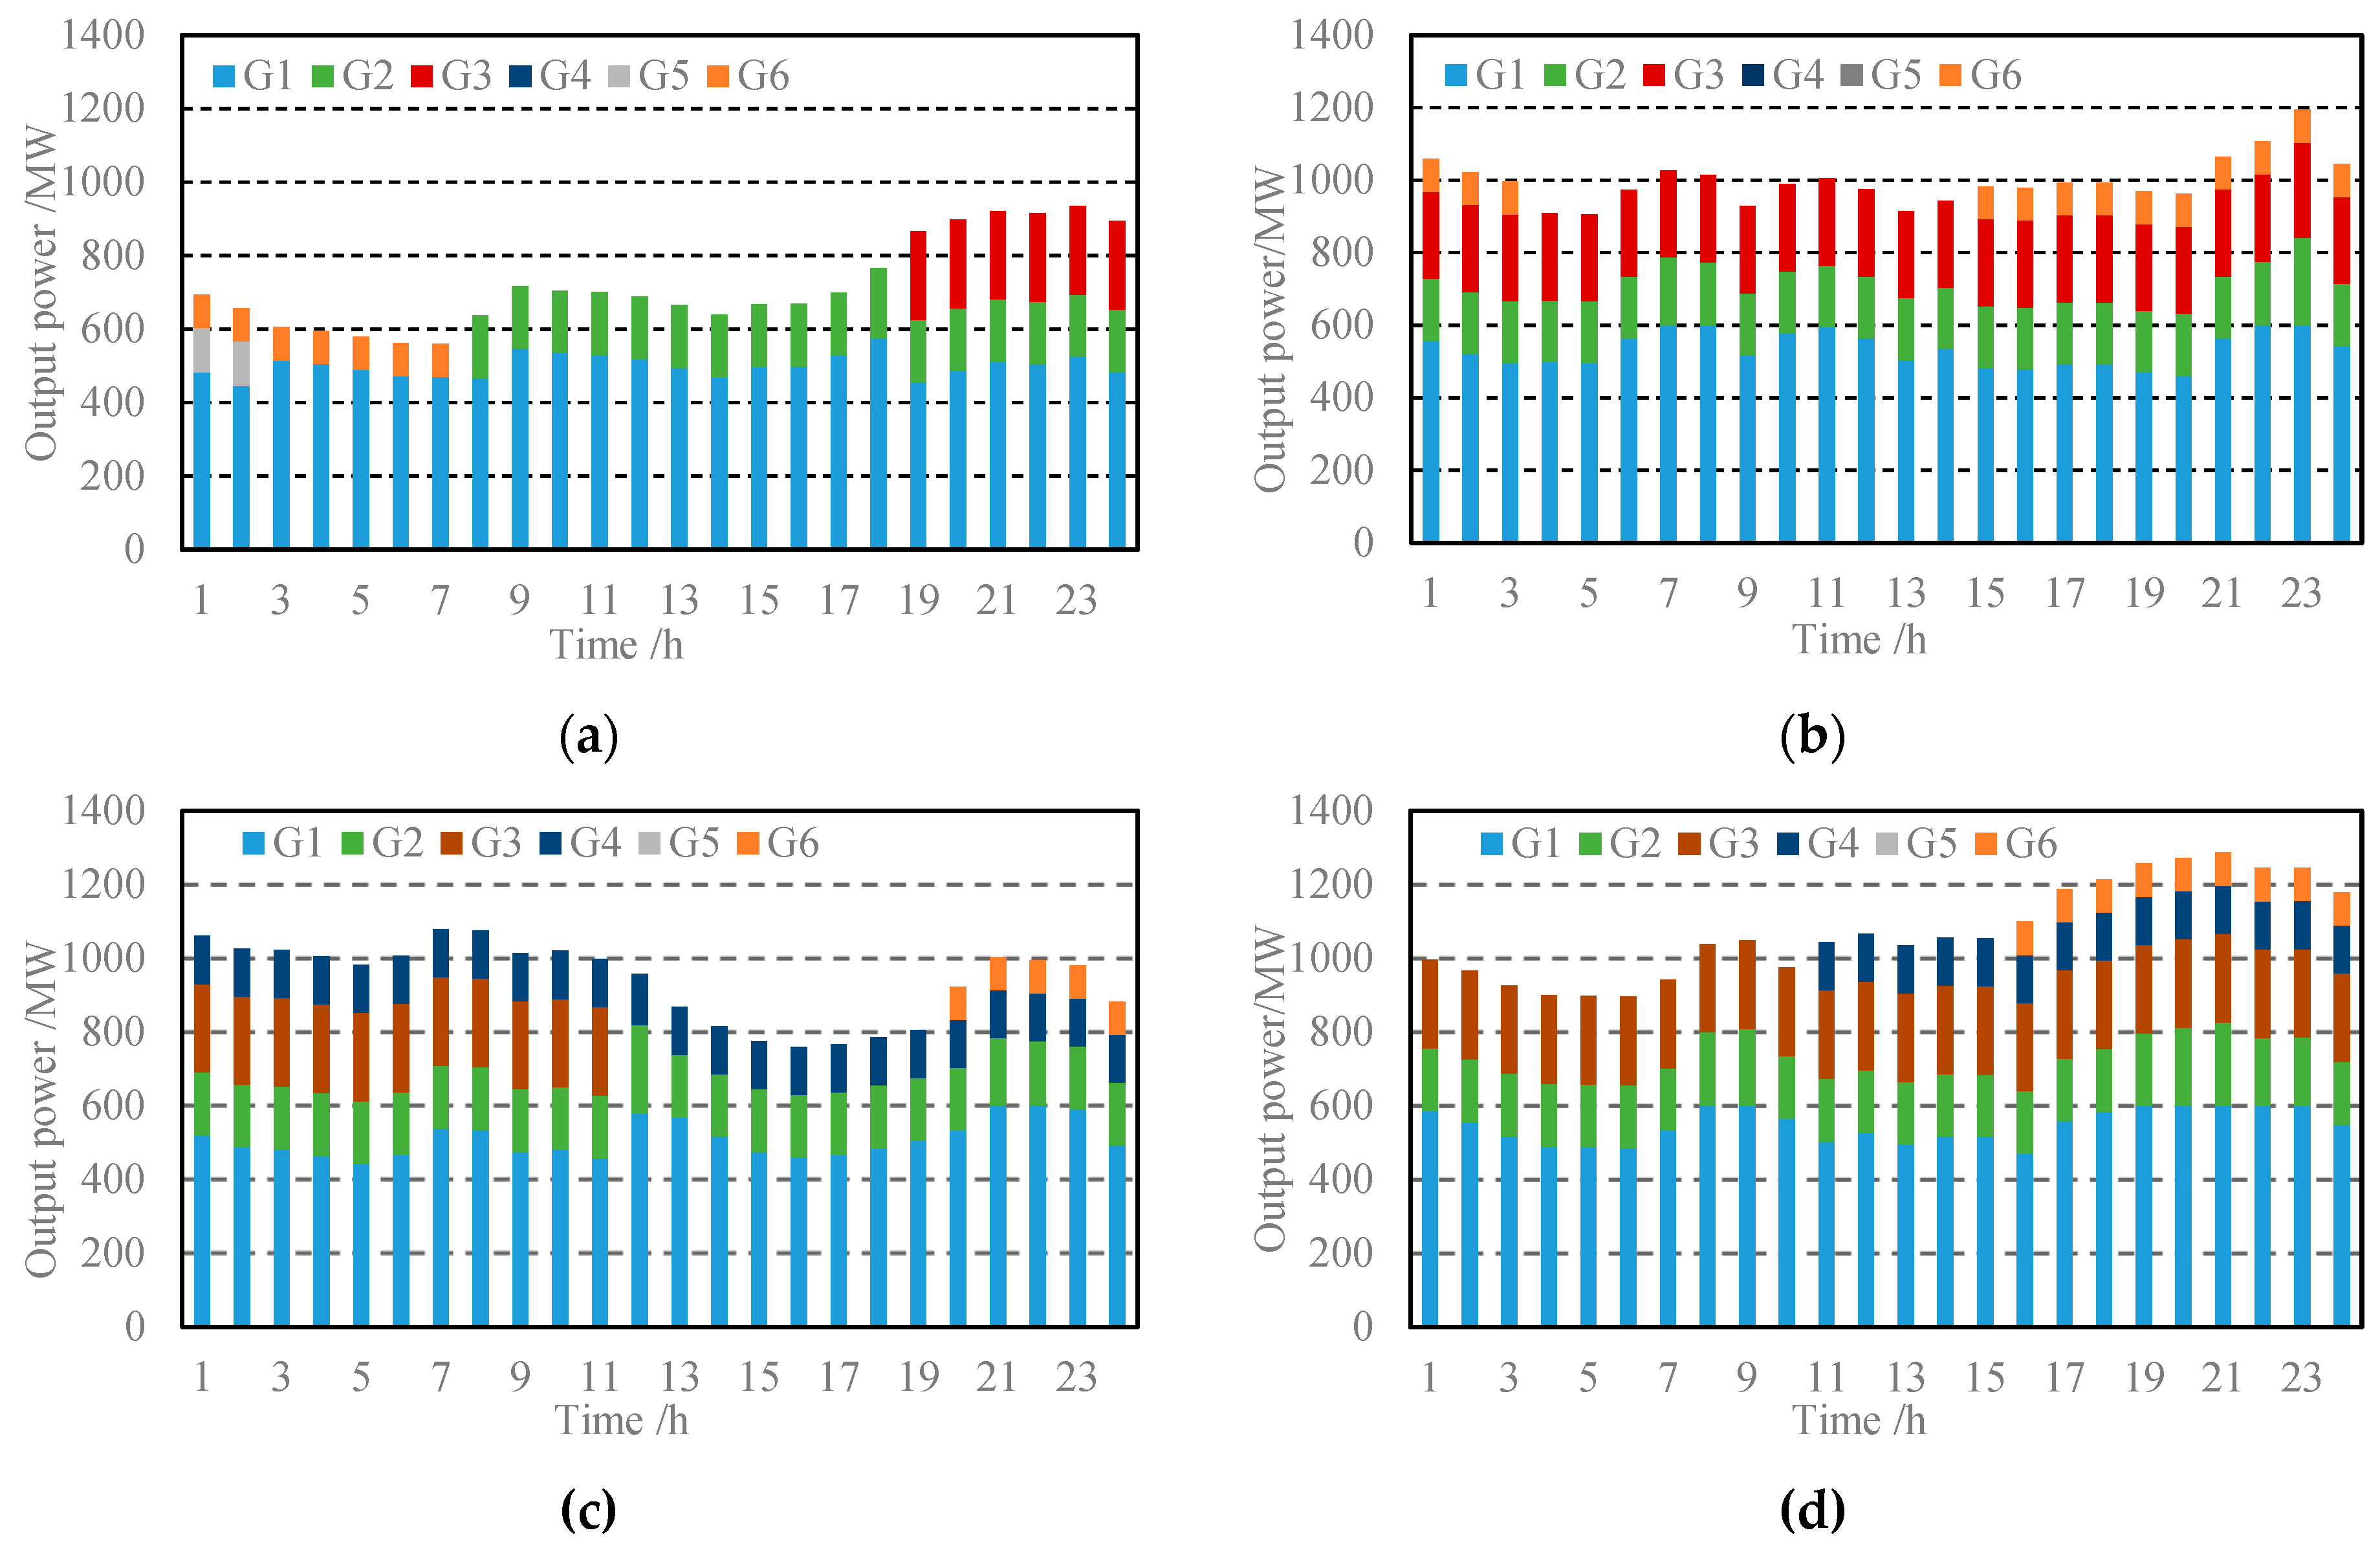
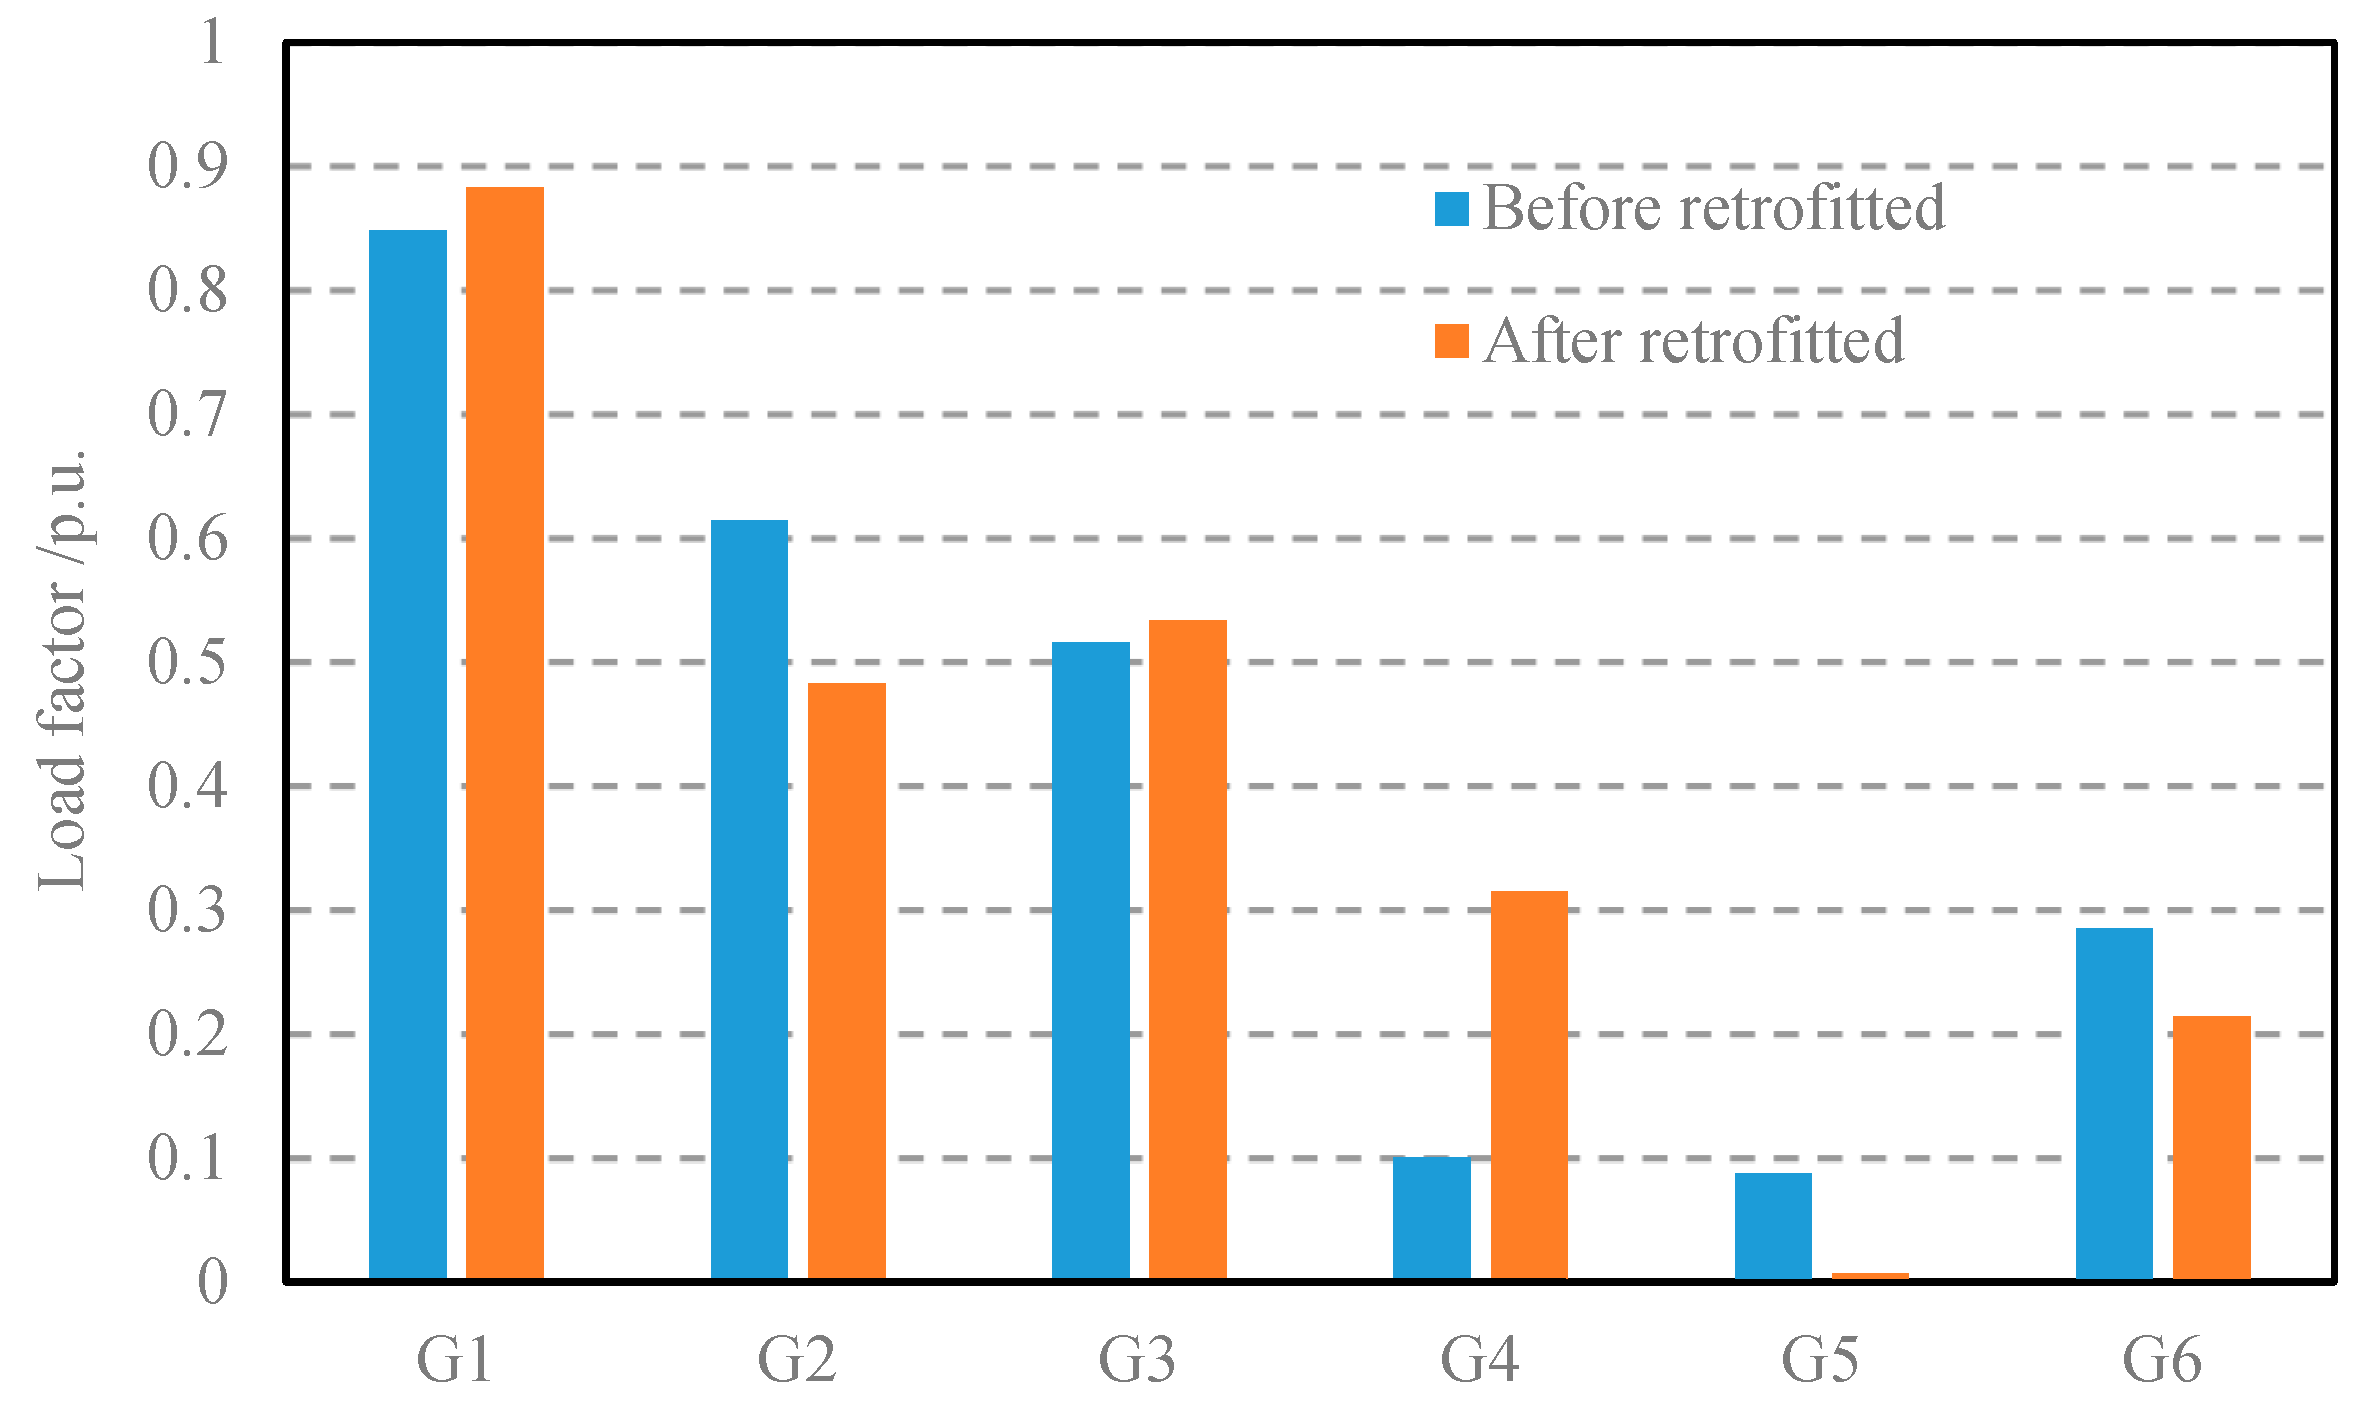
When a unit is retrofitted, the roles of all the units in the system may be changed. The retrofit target is set as 40 MW, and the power output changes of the six units on four representative days are shown in Figure A2 and Figure A3, respectively. After retrofitting, G1 still undertakes the base load among four representative days. Although only the G2 is retrofitted, the operations of the other units are also affected. The annual load factors of the six units before and after retrofitting are shown in Figure 9.
The annual load factors of G1 and G3 increase slightly, while G6 and G5 decrease obviously. Among them, the biggest changes are G2 and G4. It is assumed that since G2 and G4 do not belong to the same PGC, and subsidies are insufficient, the retrofit enthusiasm of G2 units will be very low. Therefore, in order to ensure that the plan can be implemented, it is necessary to ensure that the subsidies for the retrofitted units are sufficient.

5. Conclusions

With the large-scale VRE integration, traditional TPUs are facing the role transformation from electricity providers to service providers. The flexibility retrofit of TPUs is an important measure in the transition phase of power system decarbonization. Therefore, this paper proposed a multi-technical flexibility retrofit planning model, which considered various feasible retrofit options of each TPU and multiple parameters’ changes after retrofitting, to minimize the overall investment and operational costs of the system. The effectiveness of the proposed model was verified by a case study based on a modified IEEE-30 bus system. The following conclusions are obtained:
  • Compared with single-option retrofit deployment, considering multiple technical retrofit options can reduce the system total cost and increase the accommodation of VRE. In addition, the planners need to comprehensively evaluate the complementarity of multiple technologies between units and reasonably set retrofitted target.
  • Multiple parameter changes may affect the retrofit decision. Among them, the minimum output and ramping rate parameters may be the dominant factors affecting the retrofit deployment.
  • When a unit is retrofitted, the roles of all the units in the system may be changed. Therefore, in order to ensure that the plan can be implemented, it is essential to ensure that the subsidies for the retrofitted units are sufficient.
  • The proposed linear formulating method, which solved the coupling problems of decision-making on retrofitting and operating, could be integrated in other countries’ CExMs to provide guidance on the investment of various flexible resources to assist the VRE integration.
Future work possibilities are as follows. First, the retrofit deployment involves the game of multiple investment entities in the electricity and auxiliary service (e.g., down-regulation market in China) market. It is necessary to take account of game behavior in the decision-making model. Second, exploring the impact of flexibility retrofit on carbon emissions of power system.

Author Contributions

J.L. and T.G. conceived and designed the experiments; Y.W. performed the experiments; S.X. analyzed the data; T.G. and Y.W. wrote the paper; Y.L. provided the data. All authors have read and agreed to the published version of the manuscript.

Funding

This work was supported by the Nature Science Foundation of China (51607068) and the Fundamental Research Funds for the Central Universities (No. 2017XS114).

Conflicts of Interest

The authors declare no conflict of interest.

Appendix A

Figure A1. The modified IEEE-30 Bus system.
Sustainability 12 03543 g0a1
Table A1. The operating parameters of six thermal power units with different retrofits technologies.
UnitOption P ¯   ( MW ) P _   ( MW ) MUT/MDTRU/RDSUCSDCNCMCSU/SDInvestment Cost ($)
(h)(MW/h)($)($)($)($/MW)(MW/h)
G116002401015037,40318,702765.836.9245021,000,000
G12600180920035,43417,717725.1134.246030,000,000
G2135017087025,00012,500909.3240.22702,000,000
G2235013589025,00012,500957.1842.322656,000,000
G233500811025,00012,500957.1842.3226520,000,000
G3135018089025,00012,5001056.0640.422654,000,000
G32350140810025,00012,5001010.2638.422802,500,000
G412006065020,00010,0001251.244.351605,000,000
G42200065020,00010,0001251.244.3516010,000,000
G432008065020,00010,0001251.244.351603,500,000
G512005567020,00010,0001362.243.341604,000,000
G52200067020,00010,0001362.243.341608,000,000
G532008567020,00010,0001362.243.341604,500,000
G611506046010,00050001360.4944.281201,500,000
G621504546010,00050001292.5642.061301,000,000
Figure A2. The units’ output power of different representative days before retrofit. (a) Representative day1; (b) representative day 2; (c) representative day 3; (d) representative day 4.
Sustainability 12 03543 g0a2
Figure A3. The units’ output power of different representative days after retrofit. (a) Representative day1; (b) representative day 2; (c) representative day 3; (d) representative day 4.
Sustainability 12 03543 g0a3

References

  1. International Energy Agency. Harnessing Variable Renewables; International Energy Agency: Paris, France, 2011; pp. 43–50. [Google Scholar]
  2. Ahmadi-Khatir, A.; Conejo, J.; Cherkaoui, R. Multi-area energy and reserve dispatch under wind uncertainty and equipment failures. IEEE Trans. Power Syst. 2013, 28, 4373–4383. [Google Scholar] [CrossRef]
  3. Wang, F.; Li, K.; Liu, C.; Mi, Z.; Shafie-Khah, M.; Catalão, J. Synchronous pattern matching principle-based residential demand response baseline estimation: Mechanism analysis and approach description. IEEE Trans. Smart Grid 2018, 9, 6972–6985. [Google Scholar] [CrossRef]
  4. Raventós, O.; Bartels, J. Evaluation of temporal complexity reduction techniques applied to storage expansion planning in power system models. Energies 2020, 13, 988. [Google Scholar] [CrossRef] [Green Version]
  5. Na, C.; Pan, H.; Zhu, Y.; Yuan, J.; Ding, L.; Yu, J. The Flexible Operation of Coal Power and Its Renewable Integration Potential in China. Sustainability 2019, 11, 4424. [Google Scholar] [CrossRef] [Green Version]
  6. Na, C.; Yuan, J.; Zhu, Y.; Xue, L. Economic Decision-Making for Coal Power Flexibility Retrofitting and Compensation in China. Sustainability 2018, 10, 348. [Google Scholar] [CrossRef] [Green Version]
  7. Agora Energiewende. Flexibility in Thermal Power Plants—With a Focus on Existing Coal-Fired Power Plants; Agora Energiewende: Berlin, Germany, 2017. [Google Scholar]
  8. Gong, X.; Li, F.; Sun, B.; Liu, D. Collaborative optimization of multi-energy complementary combined cooling, heating, and power systems considering schedulable loads. Energies 2020, 13, 918. [Google Scholar] [CrossRef] [Green Version]
  9. Teng, Y.; Sun, P.; Leng, O.; Chen, Z.; Zhou, G. Optimal operation strategy for combined heat and power system based on solid electric thermal storage boiler and thermal inertia. IEEE Access 2019, 7, 180761–180770. [Google Scholar] [CrossRef]
  10. Yin, C.; Yan, J. Oxy-fuel combustion of pulverized fuels: Combustion fundamentals and modeling. Appl. Energy 2016, 162, 742–762. [Google Scholar] [CrossRef]
  11. Nerijus, S.; Andrius, T.; Liutauras, M.; Rolandas, P.; Kęstutis, Z.; Raminta, S. A sustainable approach for plasma reforming of tail biogas for onsite syngas production during lean combustion operation. Energy Convers. Manag. 2020, 209, 112617. [Google Scholar]
  12. National Renewable Energy Laboratory. Cost-Benefit Analysis of Flexibility Retrofits for Coal and Gas-Fueled Power Plants; National Renewable Energy Laboratory: Golden, CO, USA, 2013.
  13. Barbara, G.; Reinhard, M. Evaluating the enhanced flexibility of lignite-fired power plants: A real options analysis. Energy Convers. Manag. 2018, 177, 737–749. [Google Scholar]
  14. Jonghe, C.; Delarue, E.; Belmans, R. Determining optimal electricity technology mix with high level of wind power penetration. Appl. Energy 2011, 88, 2231–2238. [Google Scholar] [CrossRef] [Green Version]
  15. Steven, S. Power System Economics: Designing Markets for Electricity; Wiley: New York, NY, USA, 2002. [Google Scholar]
  16. Poncelet, K.; Delarue, E.; Six, D. Impact of the level of temporal and operational detail in energy-system planning models. Appl. Energy 2016, 162, 631–643. [Google Scholar] [CrossRef] [Green Version]
  17. Palmintier, B.S.; Webster, M.D. Heterogeneous unit clustering for efficient operational flexibility modeling. IEEE Trans. Power Syst. 2014, 29, 1089–1098. [Google Scholar] [CrossRef]
  18. Meus, J.; Poncelet, K.; Delarue, E. Applicability of a clustered unit commitment model in power system modeling. IEEE Trans. Power Syst. 2017, 33, 2195–2204. [Google Scholar] [CrossRef] [Green Version]
  19. MA, J.; Silva, V.; Belhomme, R. Evaluating and planning flexibility in sustainable power systems. IEEE Trans. Sustain. Energy 2013, 4, 200–209. [Google Scholar] [CrossRef] [Green Version]
  20. Belderbos, A.; Delarue, E. Accounting for flexibility in power system planning with renewables. Int. J. Electr. Power Energy Syst. 2015, 71, 33–41. [Google Scholar] [CrossRef] [Green Version]
  21. International Energy Agency. The Power of Transformation: Wind, Sun and the Economics of Flexible Power Systems; International Energy Agency: Paris, France, 2014. [Google Scholar]
  22. International Energy Agency. Status of Power System Transformation 2018; International Energy Agency: Paris, France, 2018. [Google Scholar]
  23. Xingmei, L.; Zhiming, Z.; Jie, Y. Flexibility reformation planning of thermal power units with large-scale integration of wind power. Autom. Electr. Power Syst. 2019, 43, 51–57. [Google Scholar]
  24. National Development and Reform Commission (NDRC). China 13th Renewable Energy Development Five-Year Plan (2016–2020); NDRC: Beijing, China, 2016.
  25. IEA Clean Coal Centre. Increasing the Flexibility of Coal-Fired Power Plants; IEA Clean Coal Centre: London, UK, 2014. [Google Scholar]
  26. Carrion, M.; Arroyo, J.A. A computationally efficient mixed-integer linear formulation for the thermal unit commitment problem. IEEE Trans. Power Syst. 2006, 21, 1371–1378. [Google Scholar] [CrossRef]
  27. Frangioni, A.; Gentile, C.; Lacalandra, F. Tighter approximated MILP formulations for unit commitment problems. IEEE Trans Power Syst. 2008, 24, 105–113. [Google Scholar] [CrossRef] [Green Version]
  28. Elisa, L.; Lorenzo, P. Cycles optimization: The equivalent annuity and the NPV approaches. Int. J. Prod. Econ. 2001, 69, 65–83. [Google Scholar]
  29. Morales-Espana, G.; Ramos, A.; Garcia-Gonzalez, J. An MIP Formulation for joint market-clearing of energy and reserves based on ramp scheduling. IEEE Trans. Power Syst. 2014, 29, 476–488. [Google Scholar] [CrossRef]
  30. Bahrami, S.; Wong, V. Security-constrained unit commitment for AC-DC grids with generation and load uncertainty. IEEE Trans. Power Syst. 2018, 33, 2717–2731. [Google Scholar] [CrossRef]
  31. Liu, Y.; Sioshansi, R.; Conejo, A.J. Hierarchical clustering to find representative operating periods for capacity-expansion modeling. IEEE Trans. Power Syst. 2018, 33, 3029–3039. [Google Scholar] [CrossRef]
Figure 1. Comparison of the effect and investment costs of different technologies.
Sustainability 12 03543 g001
Figure 2. Schematic diagram of multi-technical flexibility retrofit deployment.
Sustainability 12 03543 g002
Figure 3. Framework of the multi-technical flexibility retrofit planning (M-FRP) model.
Sustainability 12 03543 g003
Figure 4. Load and wind power profiles of 4 representative days. (a) Wind power profiles; (b) load profiles.
Sustainability 12 03543 g004
Figure 5. Comparison of system costs of three strategies.
Sustainability 12 03543 g005
Figure 6. Comparison of system total costs of three strategies.
Sustainability 12 03543 g006
Figure 7. Comparison of investment costs between CAP and M-FRP.
Sustainability 12 03543 g007
Figure 8. Comparison of system costs under different retrofits task.
Sustainability 12 03543 g008
Figure 9. Comparison of units’ annual load factors before and after retrofits.
Sustainability 12 03543 g009
Table 1. Operating parameters of 6 thermal power units before retrofits.
Unit NameBus No.PGCs P ¯ (MW) P _ (MW)MUT/MDT 1 (h)RU/RD (MW/h)SUC ($)SDC ($)NC ($)MC ($/MW)SU/SD (MW/h)
G11C16003801012039,37219,686806.1138.87440
G22C235020087025,00012,500957.1842.32265
G35C335018088025,00012,5001056.0640.42265
G48C220012065020,00010,0001251.244.35160
G511C320015067020,00010,0001362.243.34160
G613C115010044010,00050001360.4944.28120
1 “MUT” and “MDT”, indicate the minimum online and offline times of units, respectively, which are abbreviations of units’ operating parameters, MUTi,h and MDTi,h. The same goes for other abbreviations.
Table 2. The least investment option of each unit.
Unit NameG1G2G3G4G5G6
Option No.112312
Table 3. Comparison of retrofitting decisions under three retrofit strategies.
StrategiesG1G2G3G4G5G6
S_FRP0 112302
M_LIO012012
M-FRP002021
1 The number “0” indicates that the unit will not be retrofitted.