Article

A Study on the Relationship between Land Use Change and Water Quality of the Mitidja Watershed in Algeria Based on GIS and RS

1
National and Local Joint Engineering Laboratory of Municipal Sewage Resource Utilization Technology, Jiangsu Key Laboratory of Environmental Science and Engineering, School of Environmental Science and Engineering, Suzhou University of Science and Technology, Suzhou 215009, China
2
State Key Laboratory of Resources and Environmental Information Systems, Institute of Geographical Sciences and Natural Resources Research, Chinese Academy of Sciences, Beijing 100101, China
3
School of Environmental Science and Engineering, Tianjin University, Tianjin 300350, China
*
Author to whom correspondence should be addressed.
Sustainability 2020, 12(9), 3510; https://doi.org/10.3390/su12093510
Submission received: 16 March 2020 / Revised: 18 April 2020 / Accepted: 21 April 2020 / Published: 25 April 2020
(This article belongs to the Special Issue Sustainable Water Quality Management in the Changing Environment)

Abstract

:
Many catchments in northern Algeria, including the coastal Mitidja Basin in the north central part of the country have been negatively affected by the deterioration of water quality in recent years. This study aims to discover the relationship between land use change and its impact on water quality in the coastal Mitidja river basin. Based on the data of land use and water quality in 2000, 2010 and 2017, the relationship between land use change and surface water quality index in the Mitidja Watershed was discussed through GIS and statistical analysis. The results show that the physical and chemical properties of the Mitidja river basin have obvious spatial heterogeneity. The water quality of upstream was better than that of downstream. There was a significant spatial relationship between the eight water quality indicators and three land use types, including urban residential land, agricultural land and vegetation. In most cases, settlements and agricultural land are the dominant factors leading to river pollution, and higher vegetation coverage helps to improve water quality. The regression model revealed that percentage of urban settlement area was a predictor for NH4-N, BOD5, COD, SS, PO4-P, DO and pH, while vegetation was a predictor for NO3-N. The analysis also showed that during this period, urban settlement areas increased sharply, which has a significant impact on water quality variables. Agricultural land only had a significant positive correlation with PO4-P. The results provide an effective way to evaluate river water quality, control water pollution and land use management by landscape pattern.

1. Introduction

Land use cover change (LUCC) and biosphere aspects of hydrological cycle (BAHC) are two core types of research of the International Geosphere-Biosphere Program (IGBP). Research on the environmental effect of LUCC has become the breakthrough point of regional sustainable development. Due to the accelerating process of urbanization and the unrestricted spread of urban boundaries, land use has changed greatly, which has attracted people’s attention to the impact of natural resources, especially the quality and quantity of water resources [1,2,3]. The land use change tends to strengthen the soil erosion and affect all the links of the hydrological cycle to aggravate the non-point source pollution in the watershed [1,4,5]. Therefore, revealing the relationship between land use change and water quality is of great significance to watershed protection.
Relevant studies have shown that there is a significant correlation between land use and water quality [6,7,8]. The land use related to human activities and economic conditions are positively correlated with the concentration of water pollutants. Water quality is better in undeveloped areas, such as natural woodlands. However, the impacts of land use type on water quality are not completely uniform [9]. The complex interaction of land use type, landform and social culture in the study area may jointly affect the local water quality. In general, nitrogen, phosphorus and other pollutants in river water are mainly affected by agricultural land. Organic and heavy metal pollution is mainly affected by industry and urban land use [8,10,11,12]. Especially in developing countries of Africa, due to backward economy and treatment facilities, improper land use practice is more likely to lead to deterioration of water quality and threaten local sustainable development. Therefore, assessment of the relationship between land use and water quality is critical, as it helps in the formulation of comprehensive management strategies and policies to reduce the adverse effects of land use on water quality.
The combination of water quality assessment method and spatial analysis tool greatly enhanced the visualization of the research results [6,13]. Therefore, more and more scholars have studied the correlation and scale effect between land use and water quality using geospatial information technology such as remote sensing (RS), geographical information system (GIS) and multivariate analysis methods to construct regression models [10,11,12]. However, there are lack research on the relationship between land use and water quality based on multi-scale and different time phases. In the study, monitoring datasets between 2000 and 2017 were used, concerning 10 water quality parameters collected by the National Agency of Hydrological Resources (ANRH) of Algeria in the 7 water quality monitoring stations, which cover the main rivers and reservoirs in Mitidja watershed including 7 catchments. Simultaneously, the present research utilized medium resolution Landsat-5 Thematic Mapper (TM) 2000, Landsat-7 Enhanced Thematic Matter (ETM+) 2010 and Landsat 8 OLI 2017 images for preparing land use analysis, obtained from the United State Geological Survey (USGS) website. The objective of this study is to explore the relationship between land use change and water quality between 2000 and 2017, via GIS, RS and other spatial analysis tools and statistical tools such as SPSS, and to determine the main sources of pollutants at the sub-catchment scale in the Mitidja Basin.

2. Materials and Methods
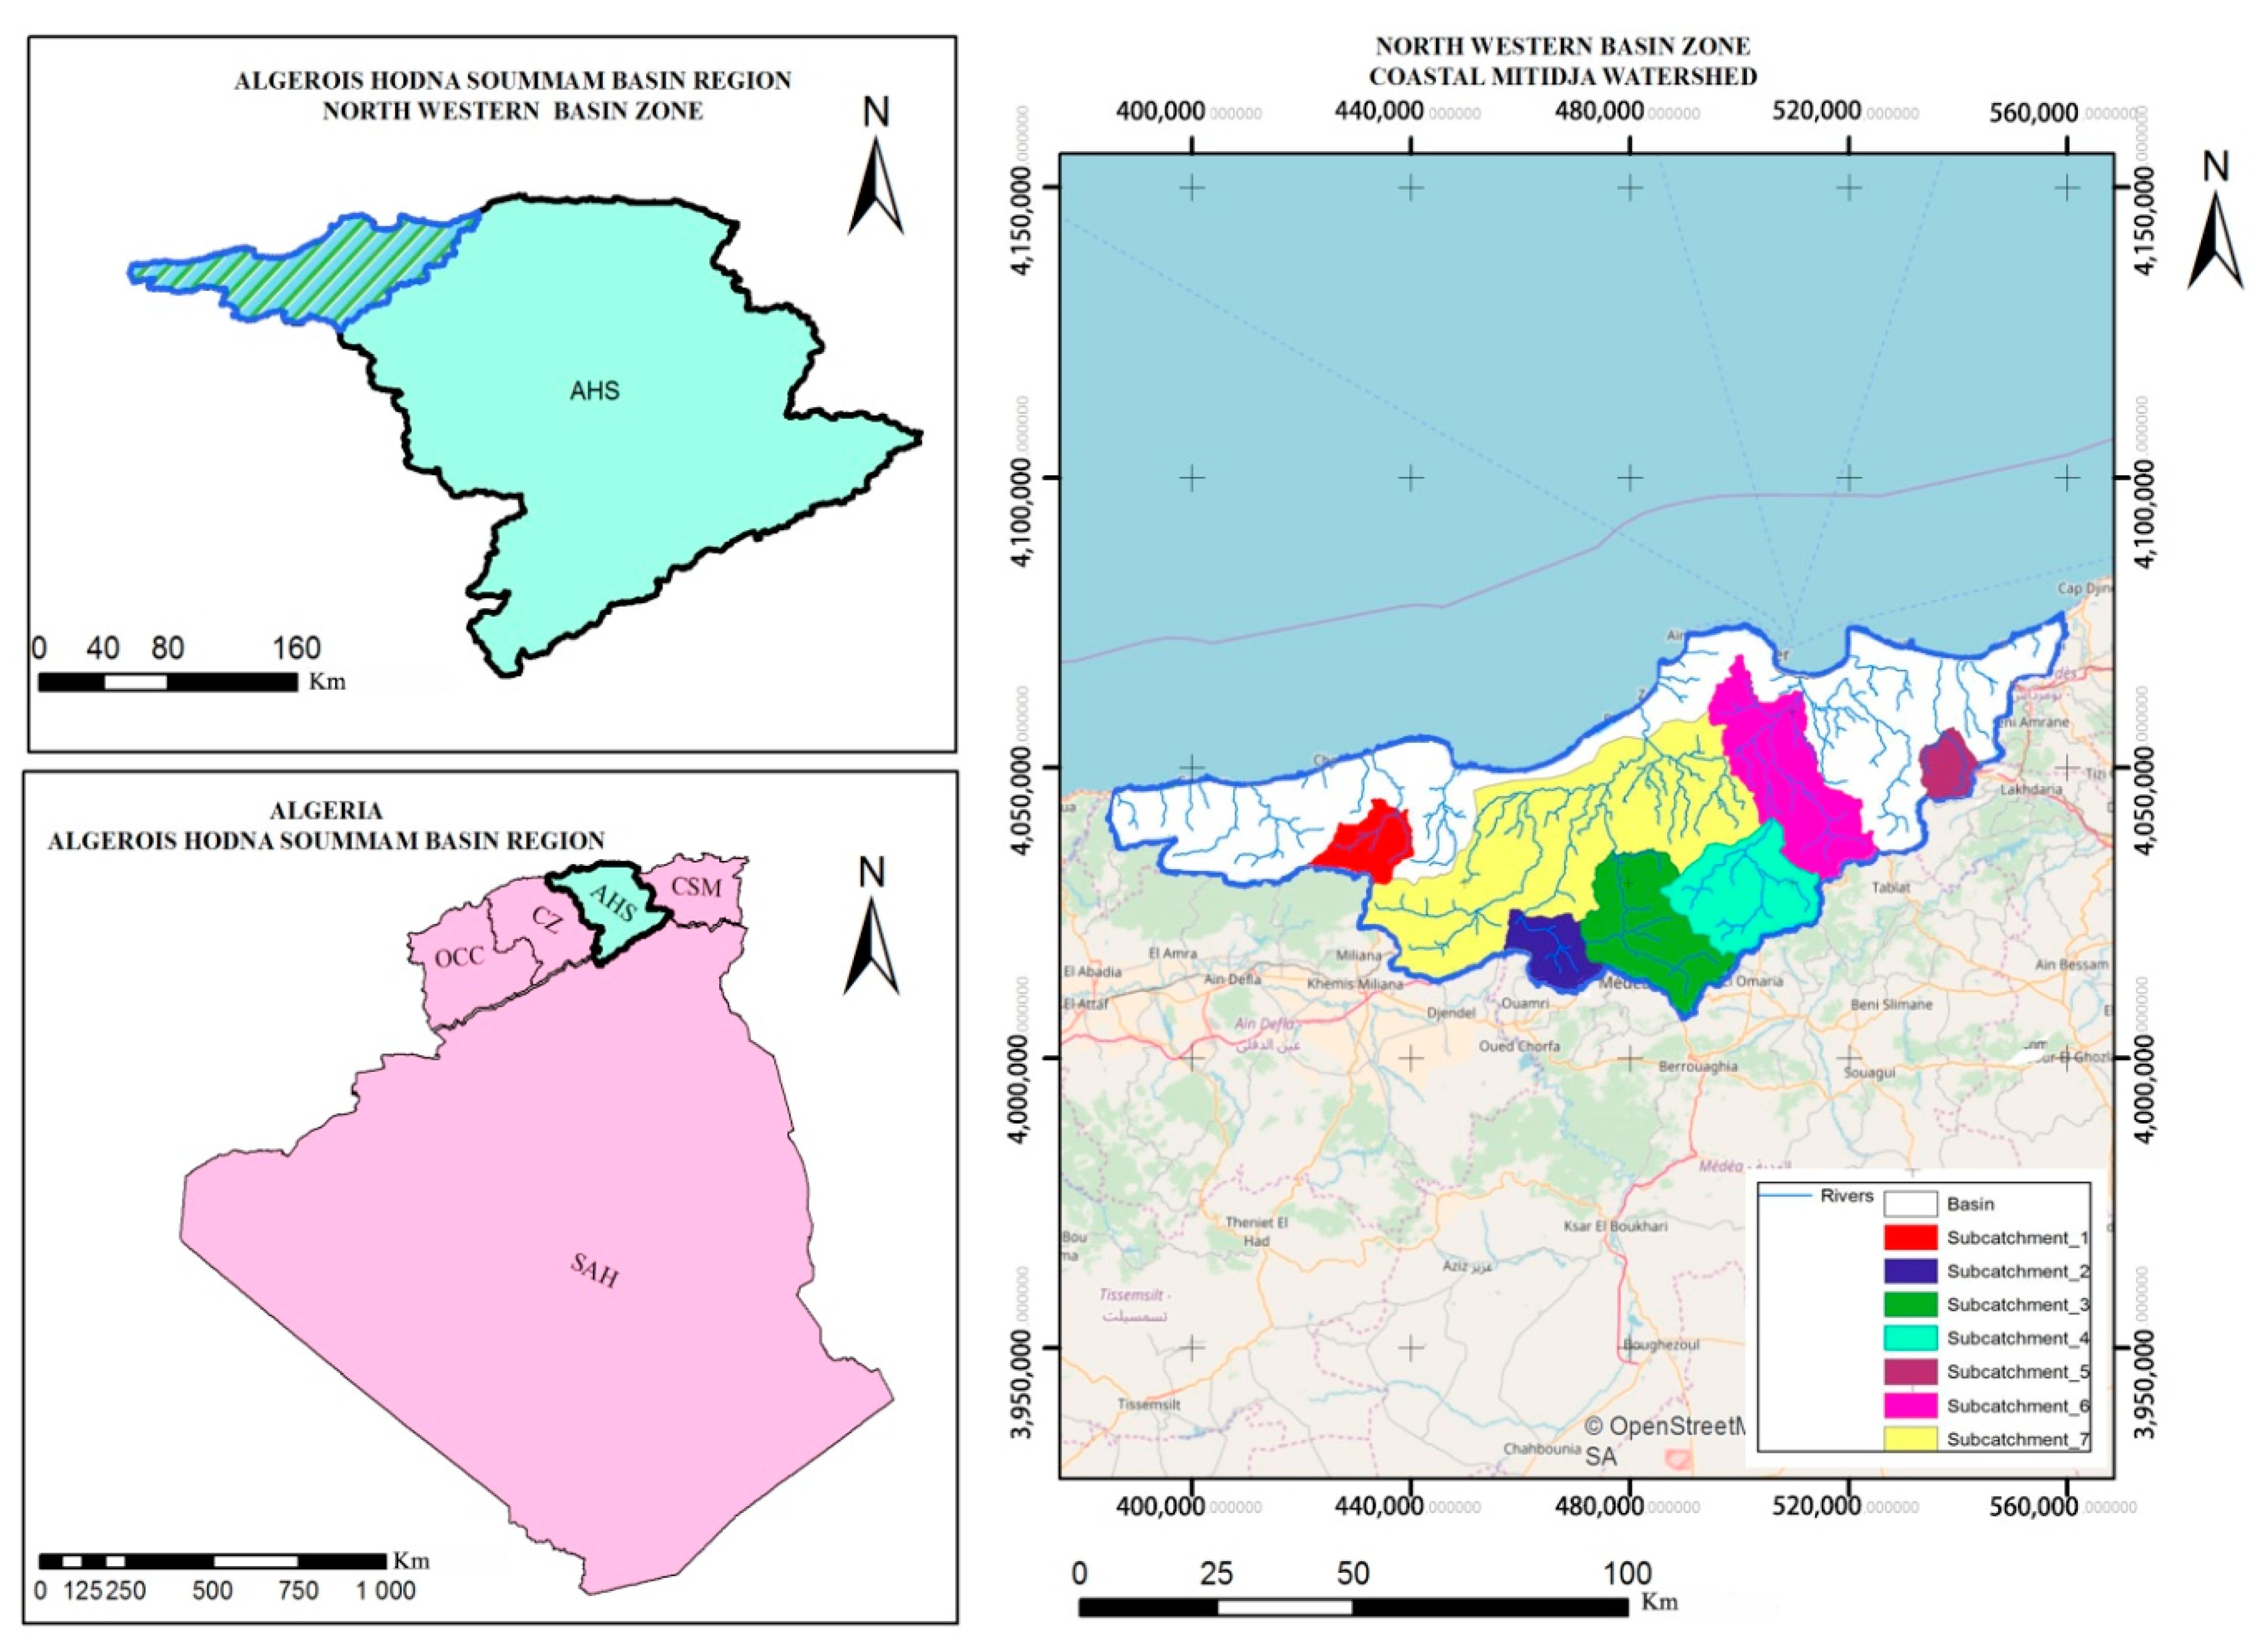
2.1. Study Area

The Mitidja Basin covers metropolitan Algiers capital city and its surrounding areas in the northern central part of the country (Figure 1). The northern border of the region is surrounded by the Mediterranean Sea. The watershed has a total catchment area of approximately 5400 km2. The Mitidja drainage basin locates 36°33′47.89″–36°50′42.89″N latitude and 2°57′58.75″–2°55′08.61″E longitude. The district mainly consists of six cities: Algiers, Blida, Tipaza, Boumerdès, Médéa and Ain Defla. Catchment area contains a mixed topography of steep and plain slopes, altitude ranges from approximately 1650 m above mean sea level and decreases unevenly to the sea level at the estuary mouth in the north, except for a large relatively flat area in the middle of the catchment. The study area belongs to the Mediterranean climate, with oceanic influence, resulting in mild and wet winters and warm and dry summers. The average annual rainfall in the Mitidja Basin between 2000 and 2012 was 825 mm, with 80% of the rainfall coming from the rainy season. The Mitidja Basin has a dense drainage network system. Two main river courses originate from the steep mountain rainforests of Atlas Blidien, El Harrach and Mazafran River. Municipal and rural wastewater, agricultural and industrial water from the cities of Algiers and Brida is discharged into the sea through these rivers. Rivers are loaded with pollution from both point and non-point sources as they flow into the sea. The Bouroumi, Keddara and Boukourdane are three main reservoirs located in the upstream southern section of the Mitidja river basin with capacities of 181.86, 142.81 and 105 million m3, respectively. Forest land area accounts for more than 28% of the total basin area, and is mainly distributed in the higher elevation areas, while agricultural land is concentrated in the lower elevation areas. Urban areas are mostly situated along the coastline. From the city of Algiers to the rest of the state, urbanization has generally declined. Because of the fertile soil, the basin is an important agricultural production base. Agricultural land occupies a relatively large area, reaching 30.1%, and the main agricultural products are wheat, vegetables and oranges. Industries mainly include petrochemical and medicine-based. The area is also a popular tourist destination, known for its beautiful planted cats and resorts.
Located in north-central Algeria, the Mitidja Basin is an important pillar of local economic development. In the past two decades, the region’s rivers have been seriously polluted due to urbanization and industrialization. Water quality is an important index to evaluate regional sustainable development, which is mainly influenced by human activities and natural processes. The source of water pollution mainly depends on the land use type of the basin [11]. The main causes of water pollution in the Mitidja Basin include the lack of governance of industrial and domestic sewage, the improper location of factory construction, the excessive use of chemical fertilizers and the lack of integrated watershed management. This paper would explore the relationship between land use patterns and water quality of different catchments, hoping to provide a scientific basis for water pollution control and land resource management in the basin.

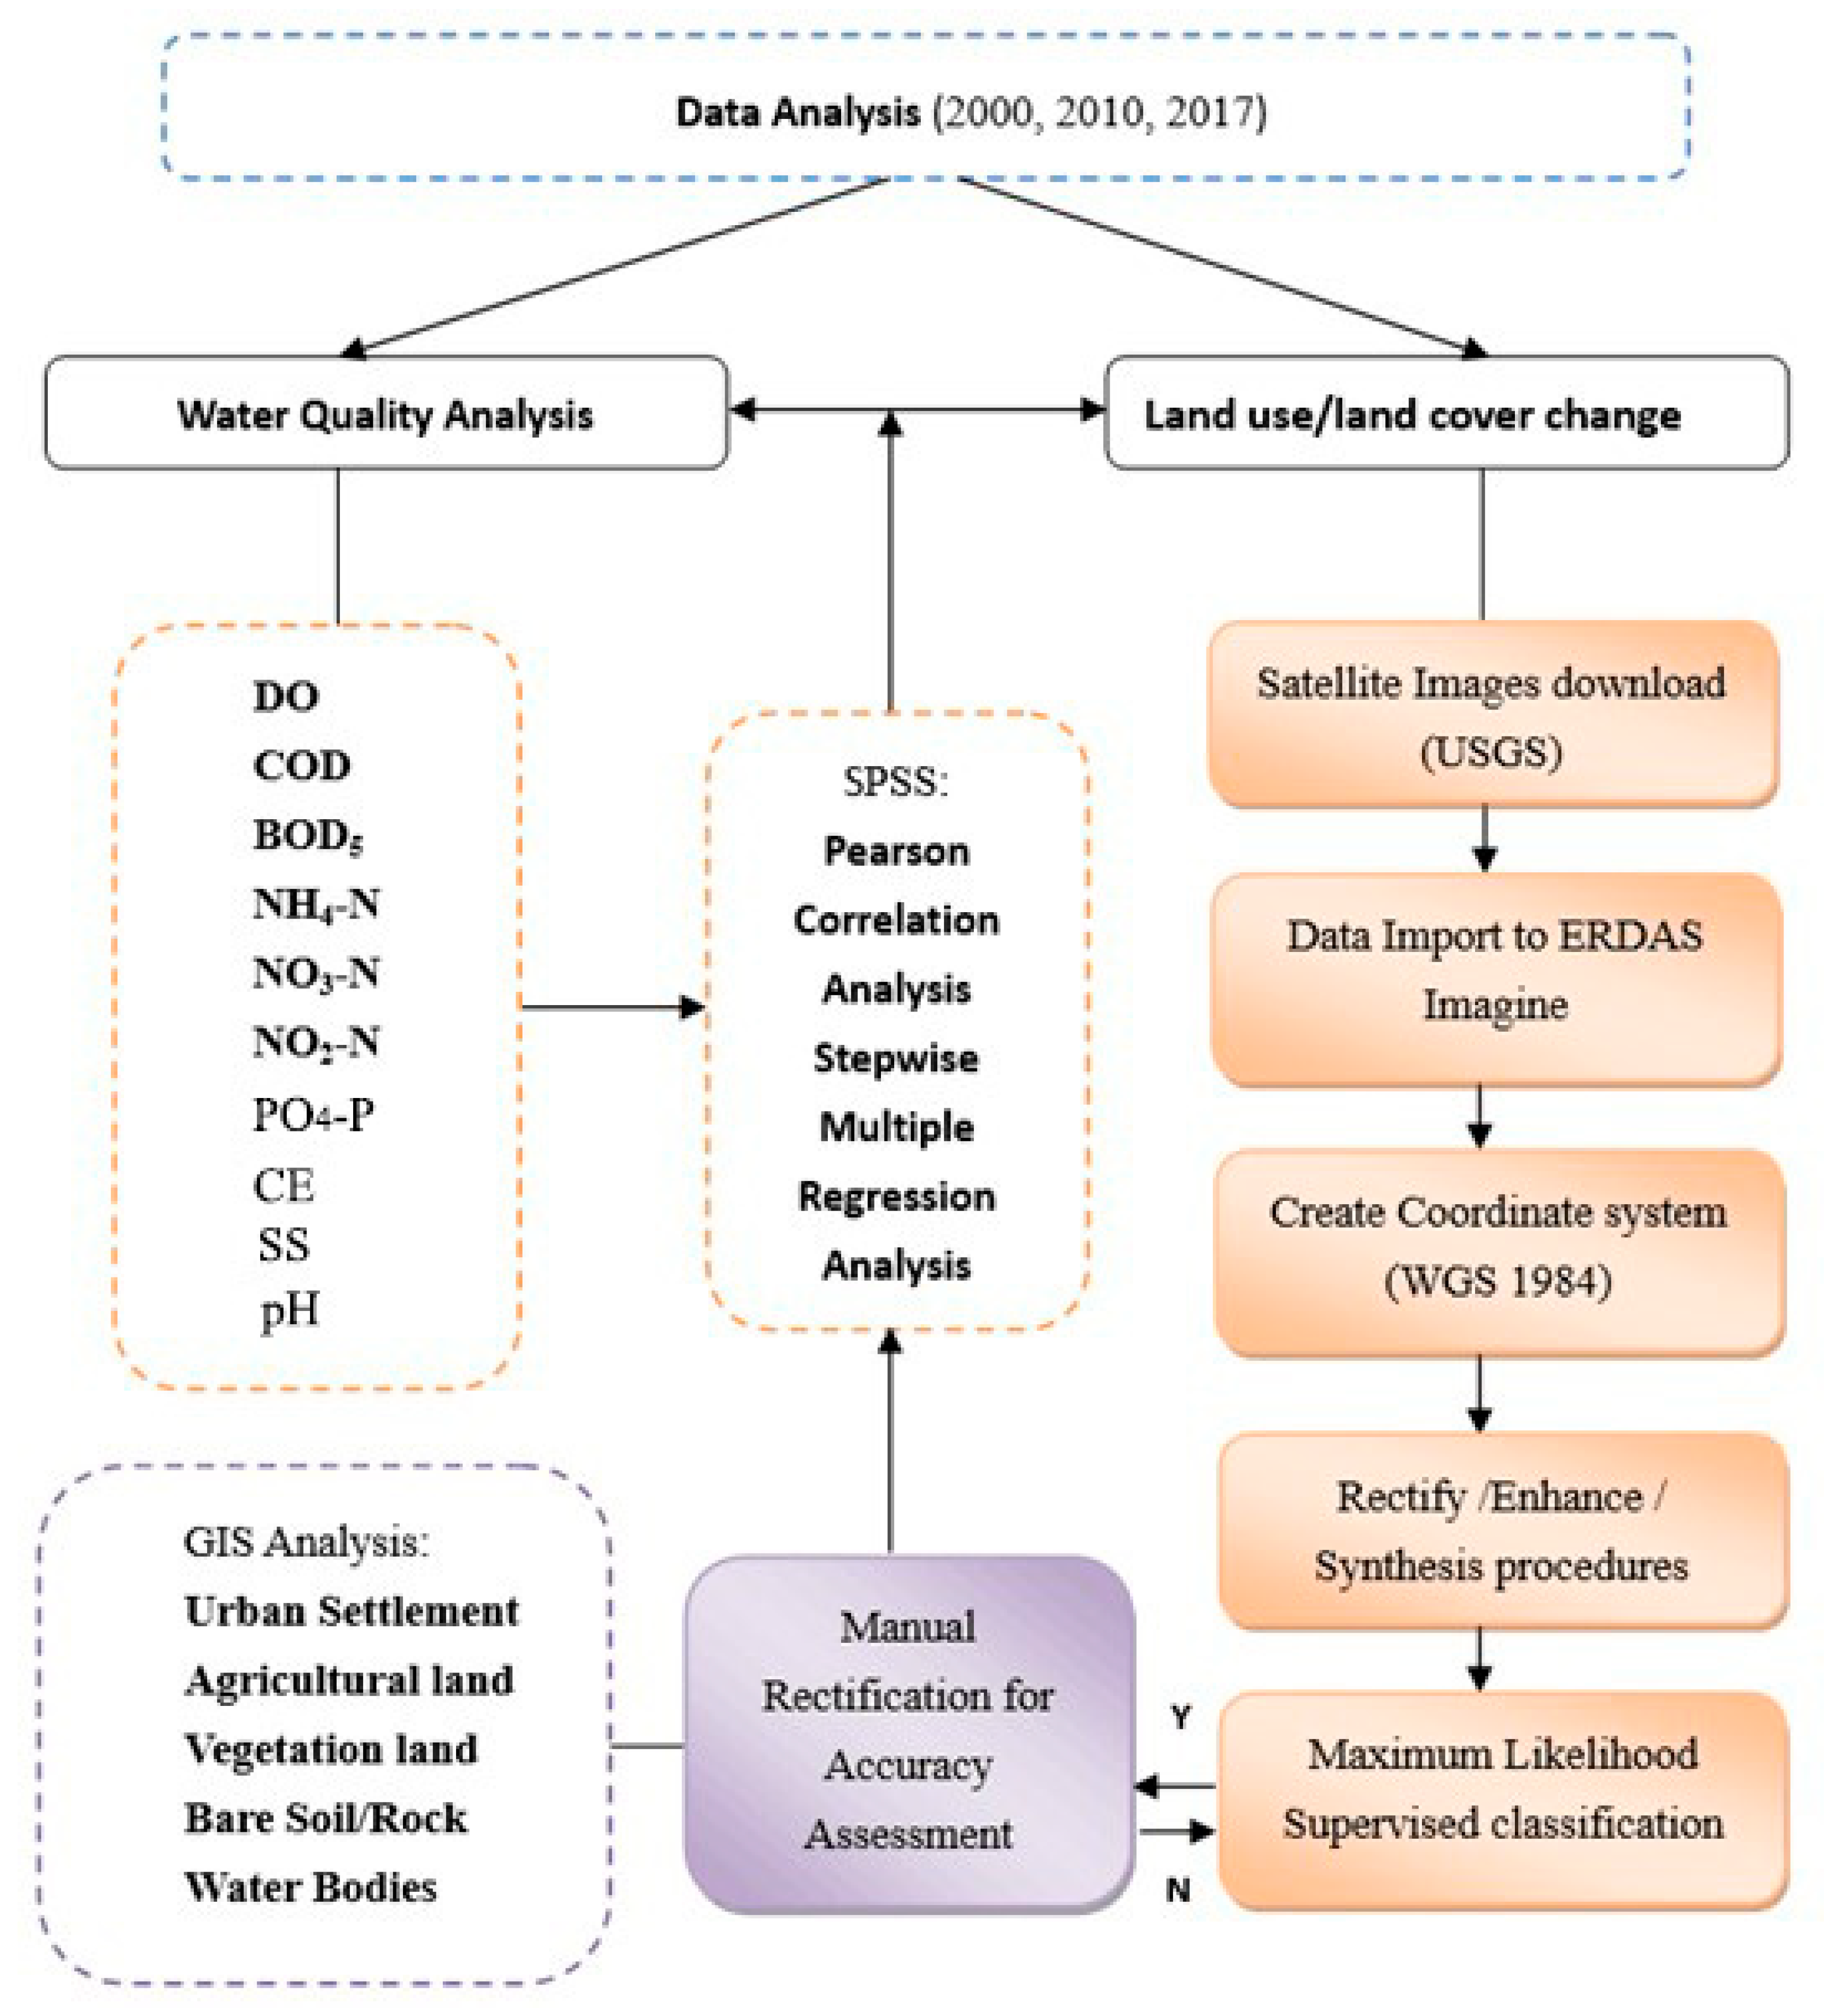
2.2. Data Sources and Methodology

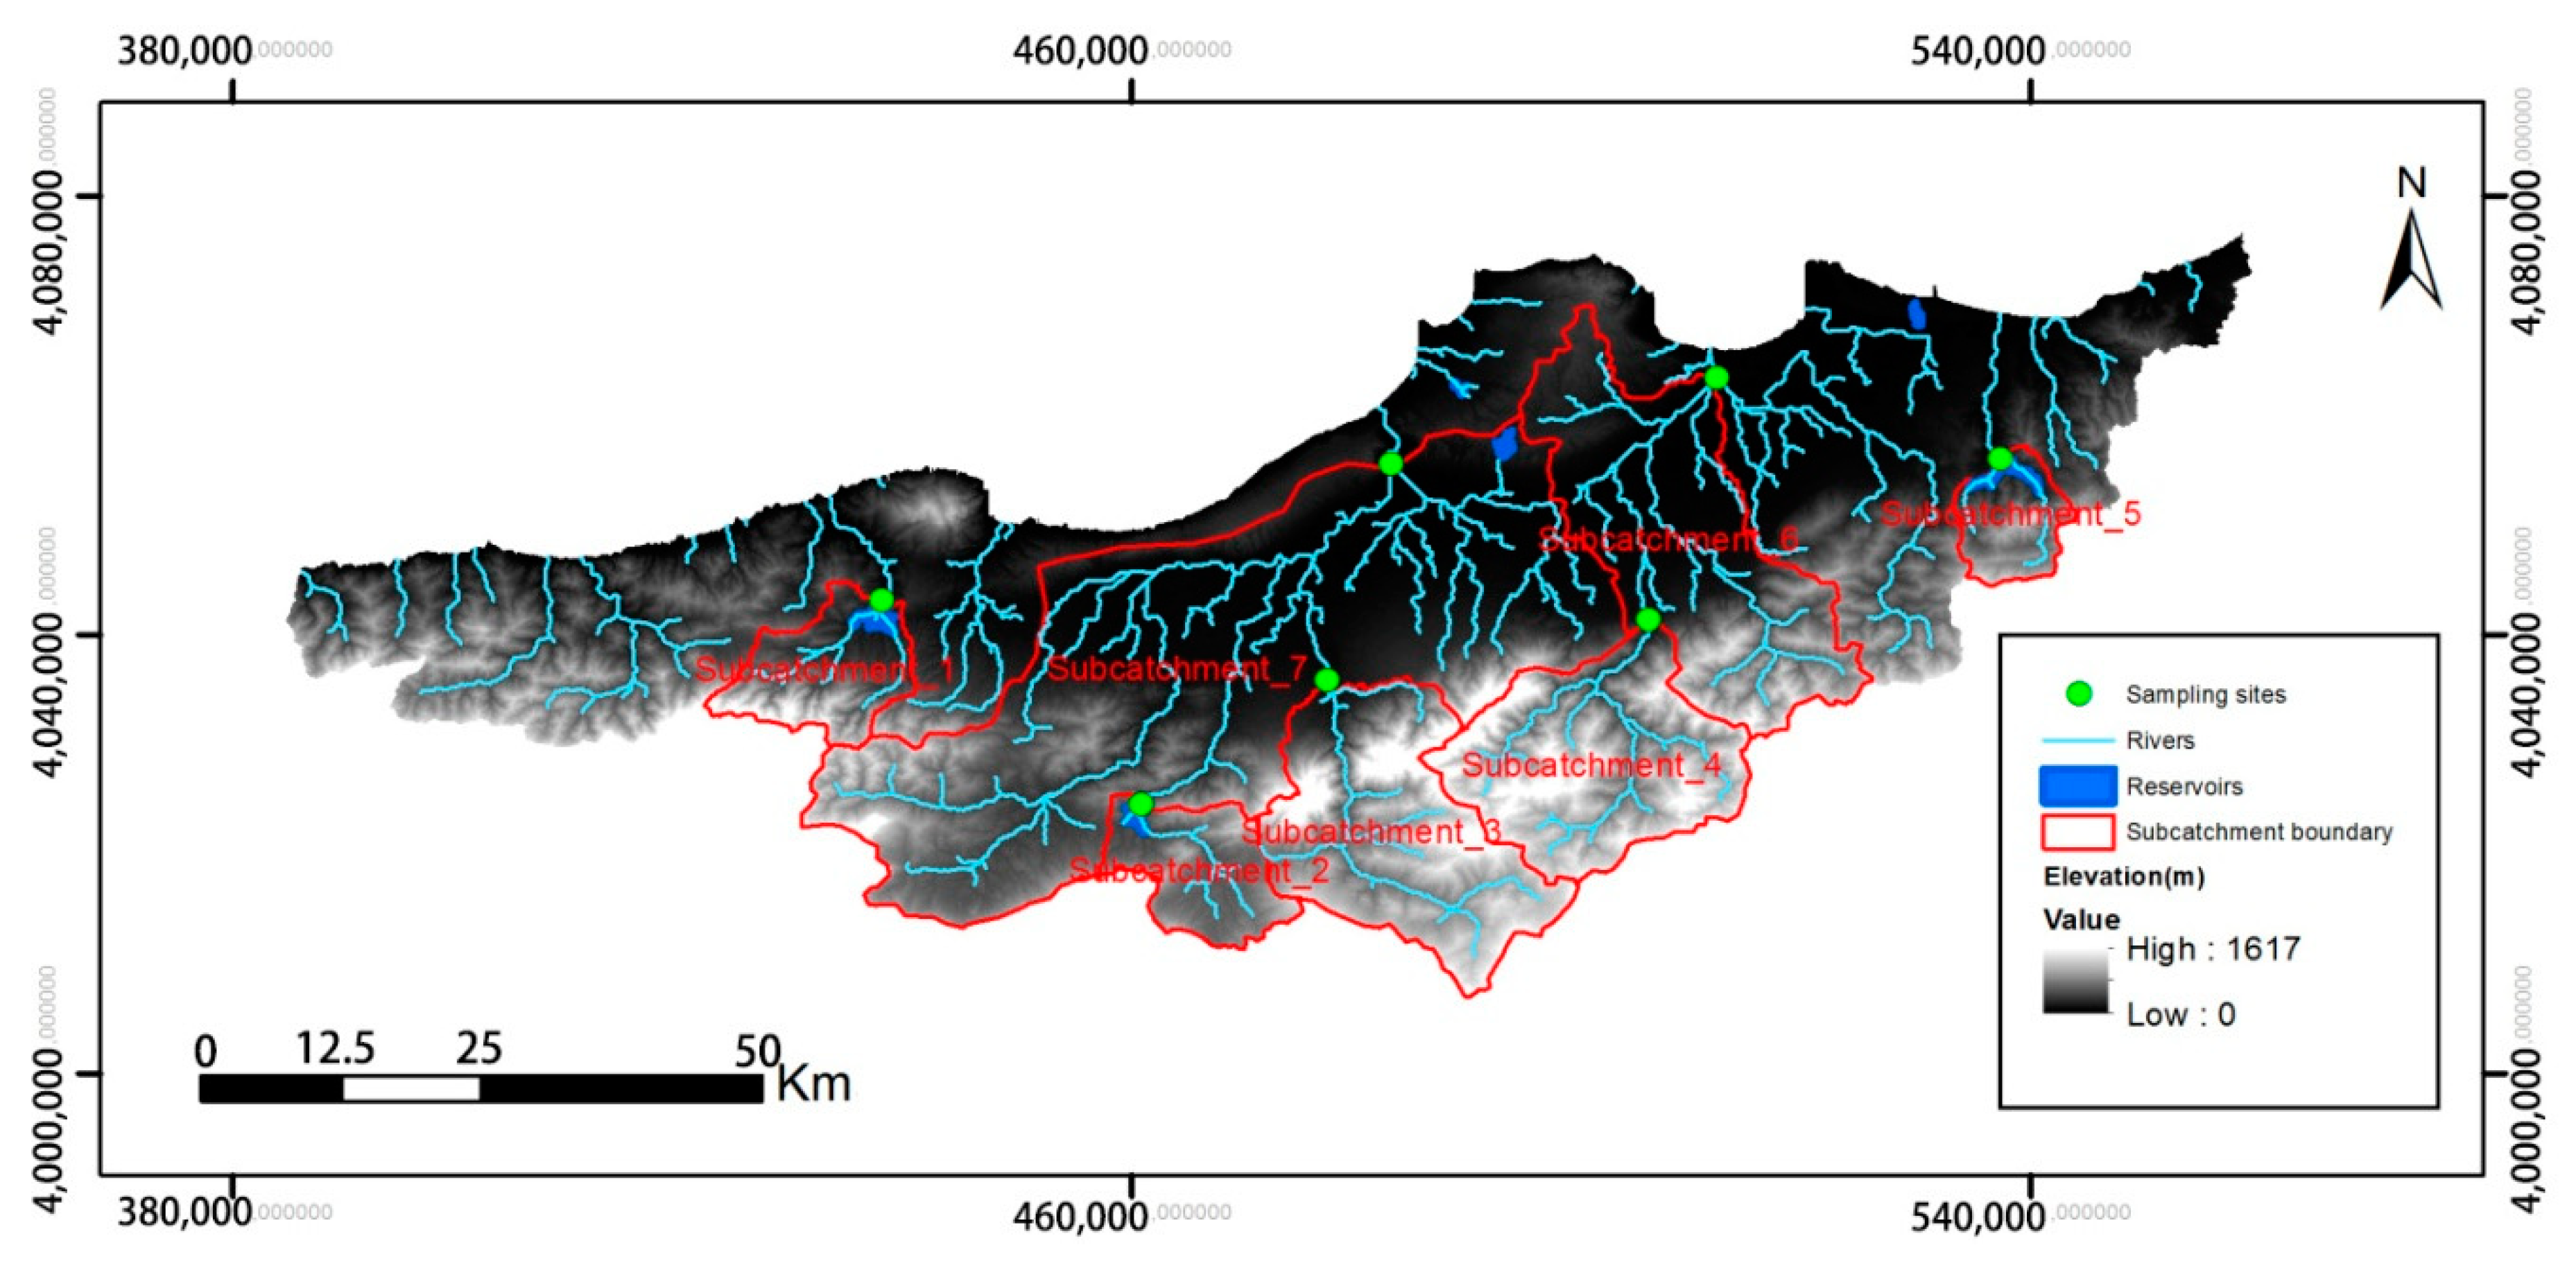
2.2.1. Sample Sites and Water Quality

Water quality data were obtained from ANRH, which collects surface water samples every month and analyzes them with standard methods. In this study, we only selected data from 7 monitoring stations which comprises 10 water quality parameters. The network of monitoring stations covers a wide range of river basins and surface water types, including reservoirs and major rivers. These seven water quality stations (Figure 2) were chosen based on the anthropogenic activities within the sub-catchment like agriculture, settlements and industrial on the local water quality and to their continuity in measurement at all selected water quality monitoring stations for years that correspond with the land use/land cover classifications 2000, 2010 and 2017. Each of the land uses affect different parameters, which may have potential impacts on both aquatic organisms and people, who depend on the water.
The ten water quality indicators selected include DO, BOD5, COD, pH, SS, CE, NH4-N, NO3-N, NO2-N and PO4-P.

2.2.2. Image Data, Preprocessing and Classification

In this study, medium-resolution Landsat time-series data sets between 2000 and 2017 were selected to extract land use and land cover change information in the Mitidja Basin. All data were obtained through bulk order from the freely available Landsat Level 1 Data Products (USGS) website (http://glovis.usgs.gov). Mainly depending on image quality [13] (ensuring consistency and error minimization, the images, which had less than 10% cloud cover, etc. Generally, the quality of the image is better in summer and autumn than spring and winter), the following images were captured on Worldwide Reference System (WRS) flight paths 196/Row 34/35 through the satellite sensor (Table 1). It is necessary to preprocess the remote sensing image before the land use information is extracted by supervision and classification, which can more accurately obtain the relationship between image data and biophysical phenomena [14,15]. Due to the difference of Sensor between Landsat 8 and others, Pseudocolor synthesis plan was implemented in different band composite (Table 1). ERDAS imagine 9.2 was used to preprocess the data and the image was geo-referencing, mask processing and sub-setting based on Area of Interest (AOI). The steps of the training sample area are as follows:
(1) Choose a training area
a) From the ERDAS main interface, open the viewer window and the classification template editor. Click the classifier icon in the ERDAS icon panel toolbar, select the classification → signature editor menu, open the classification template editor signature editor to select samples and select the AOI menu item → select Tools menu to open the AOI tool panel.
b) Click on the Icon, observe remote sensing image.
Select the water area, draw a polygon AOI and add it to the training area sample. Select multiple water bodies. In the signature Editor Dialog box, click Icon to load the AOI area of the polygon you just created into the signature taxonomy. In the board, repeat this way to get the water body1 training area below.
c) Merge classification templates. A few AOIs are collected and templates are generated, respectively for water body. These templates are combined so that the classification template has comprehensive characteristics of multiple areas. In the signature Editor Dialog box, select all the signatures of this class, and then click the merge icon. The new template of the combination is generated, and the original multiple signatures are deleted.
d) In the same way, find out agriculture land, forest land, urban settlement and other training areas.
(2) Classification template evaluation: evaluate whether the selected training area samples are typical and whether the discrimination function established by the training area samples is effective. From the overall percentage of classification error, if the error matrix value > 85%, the accuracy of the classification template meets the requirements.
The Maximum Likelihood (ML) method assumes that each statistical value is normally distributed in each band, and calculates the probability that a given pixel belongs to a specific category. Each pixel is classified into the category with the greatest possibility. This kind of classification algorithm is more complex than others, but the effect is often better, so it is more general. Supervised classification of ML was adopted using 5 land use/cover categories in terms of the information from field visits, Google Earth images and available old maps of the area. The land cover categories were agriculture, settlements, bare, vegetation, water bodies and soil/rocks. (Table 2 and Figure 3).
The uncertainty of land cover product data are unavoidable. At present, spatial analysis software, such as ArcGIS and ERADS, has developed many technical methods to deal with uncertainty. Precision assessment is the most important step in water resource modeling by integrating remote sensing data into GIS. Since the period of this study is between 2000 and 2017, this paper makes comprehensive use of global positioning system (GPS) and classified images of historical years, such as high-resolution Google earth images and old maps, to ensure that the classified images of remote sensing images are consistent with the field data of land use/land cover change.

2.2.3. GIS Analysis

GIS spatial analysis was used to establish the relationship between the sampling point as the water quality variable and the land use variable in the basin through watershed division; then the relationship between land use and water quality index was quantitatively analyzed. The water quality of the sampling site is mainly affected by the natural environment and human activities in the upstream drainage area. The water quality data of the sampling points can be used to represent the water quality of the basin, and the water flow characteristics of the basin can be obtained according to the digital elevation model (DEM) [16].
It took six DEM files to cover the entire basin. The hydrology under spatial analyst tool was used for hydroprocessing operations which included: First, the DEM data were processed with the depressed-filling tool in the hydrological module of ArcGIS software. Secondly, calculate the flow direction and water accumulation. Then, by setting different thresholds, the raster calculator is used to extracting the river network. By comparing with the river system diagram, the most suitable threshold size is determined to be 1500, which could generate the nearest approach to the actual river system; followed by snapping of pour points operations. Each sampling point was used as a pour point for the seven sub-catchment delineations and finally, watersheds were automatically delineated using the Basin command found under hydrology tools. The ratios of land use types in the 7 sub-catchments were also computed in the tools provided by the ArcGIS (Figure 3). For the main process of data analysis, see Figure 4.

2.2.4. Statistical Analysis

To quantify the relationship between land use and water quality indexes, this paper establishes the relationship between water quality variables for point locations and land use variables for areas through watershed division based on the GIS platform. According to the percentages of five land use types and the annual average concentration of water quality indicators in 2017, the Pearson correlation coefficient was used to test the correlation between land use types and water quality parameters. p < 0.01 and p < 0.05 were considered statistically significant differences (2-tailed).
For there is a certain relationship between pollution loading and composition of the land uses in the sub-catchment zone, if we know the role of different land use combinations, it is possible to improve water quality by taking corresponding measures. Considering this, the paper uses a regression analysis method to predict the impact of land use types on water quality variables. In order to determine the land use combination of water quality assessment, the reverse step-by-step method and p values stepwise regression method is used to gradually remove the unimportant independent variables from the model [17].
In addition, in order to calculate the temporal change relationship between water quality and land use, we also studied the temporal change of water quality parameter concentration between 2000 and 2017. The mean change percentage of land use area in the basin between 2000 and 2017 was analyzed by the Pearson correlation coefficient and the mean water quality index, and the intensity and significance of the relationship between land use and water quality parameters were tested. All statistics were performed by SPSS.

3. Results

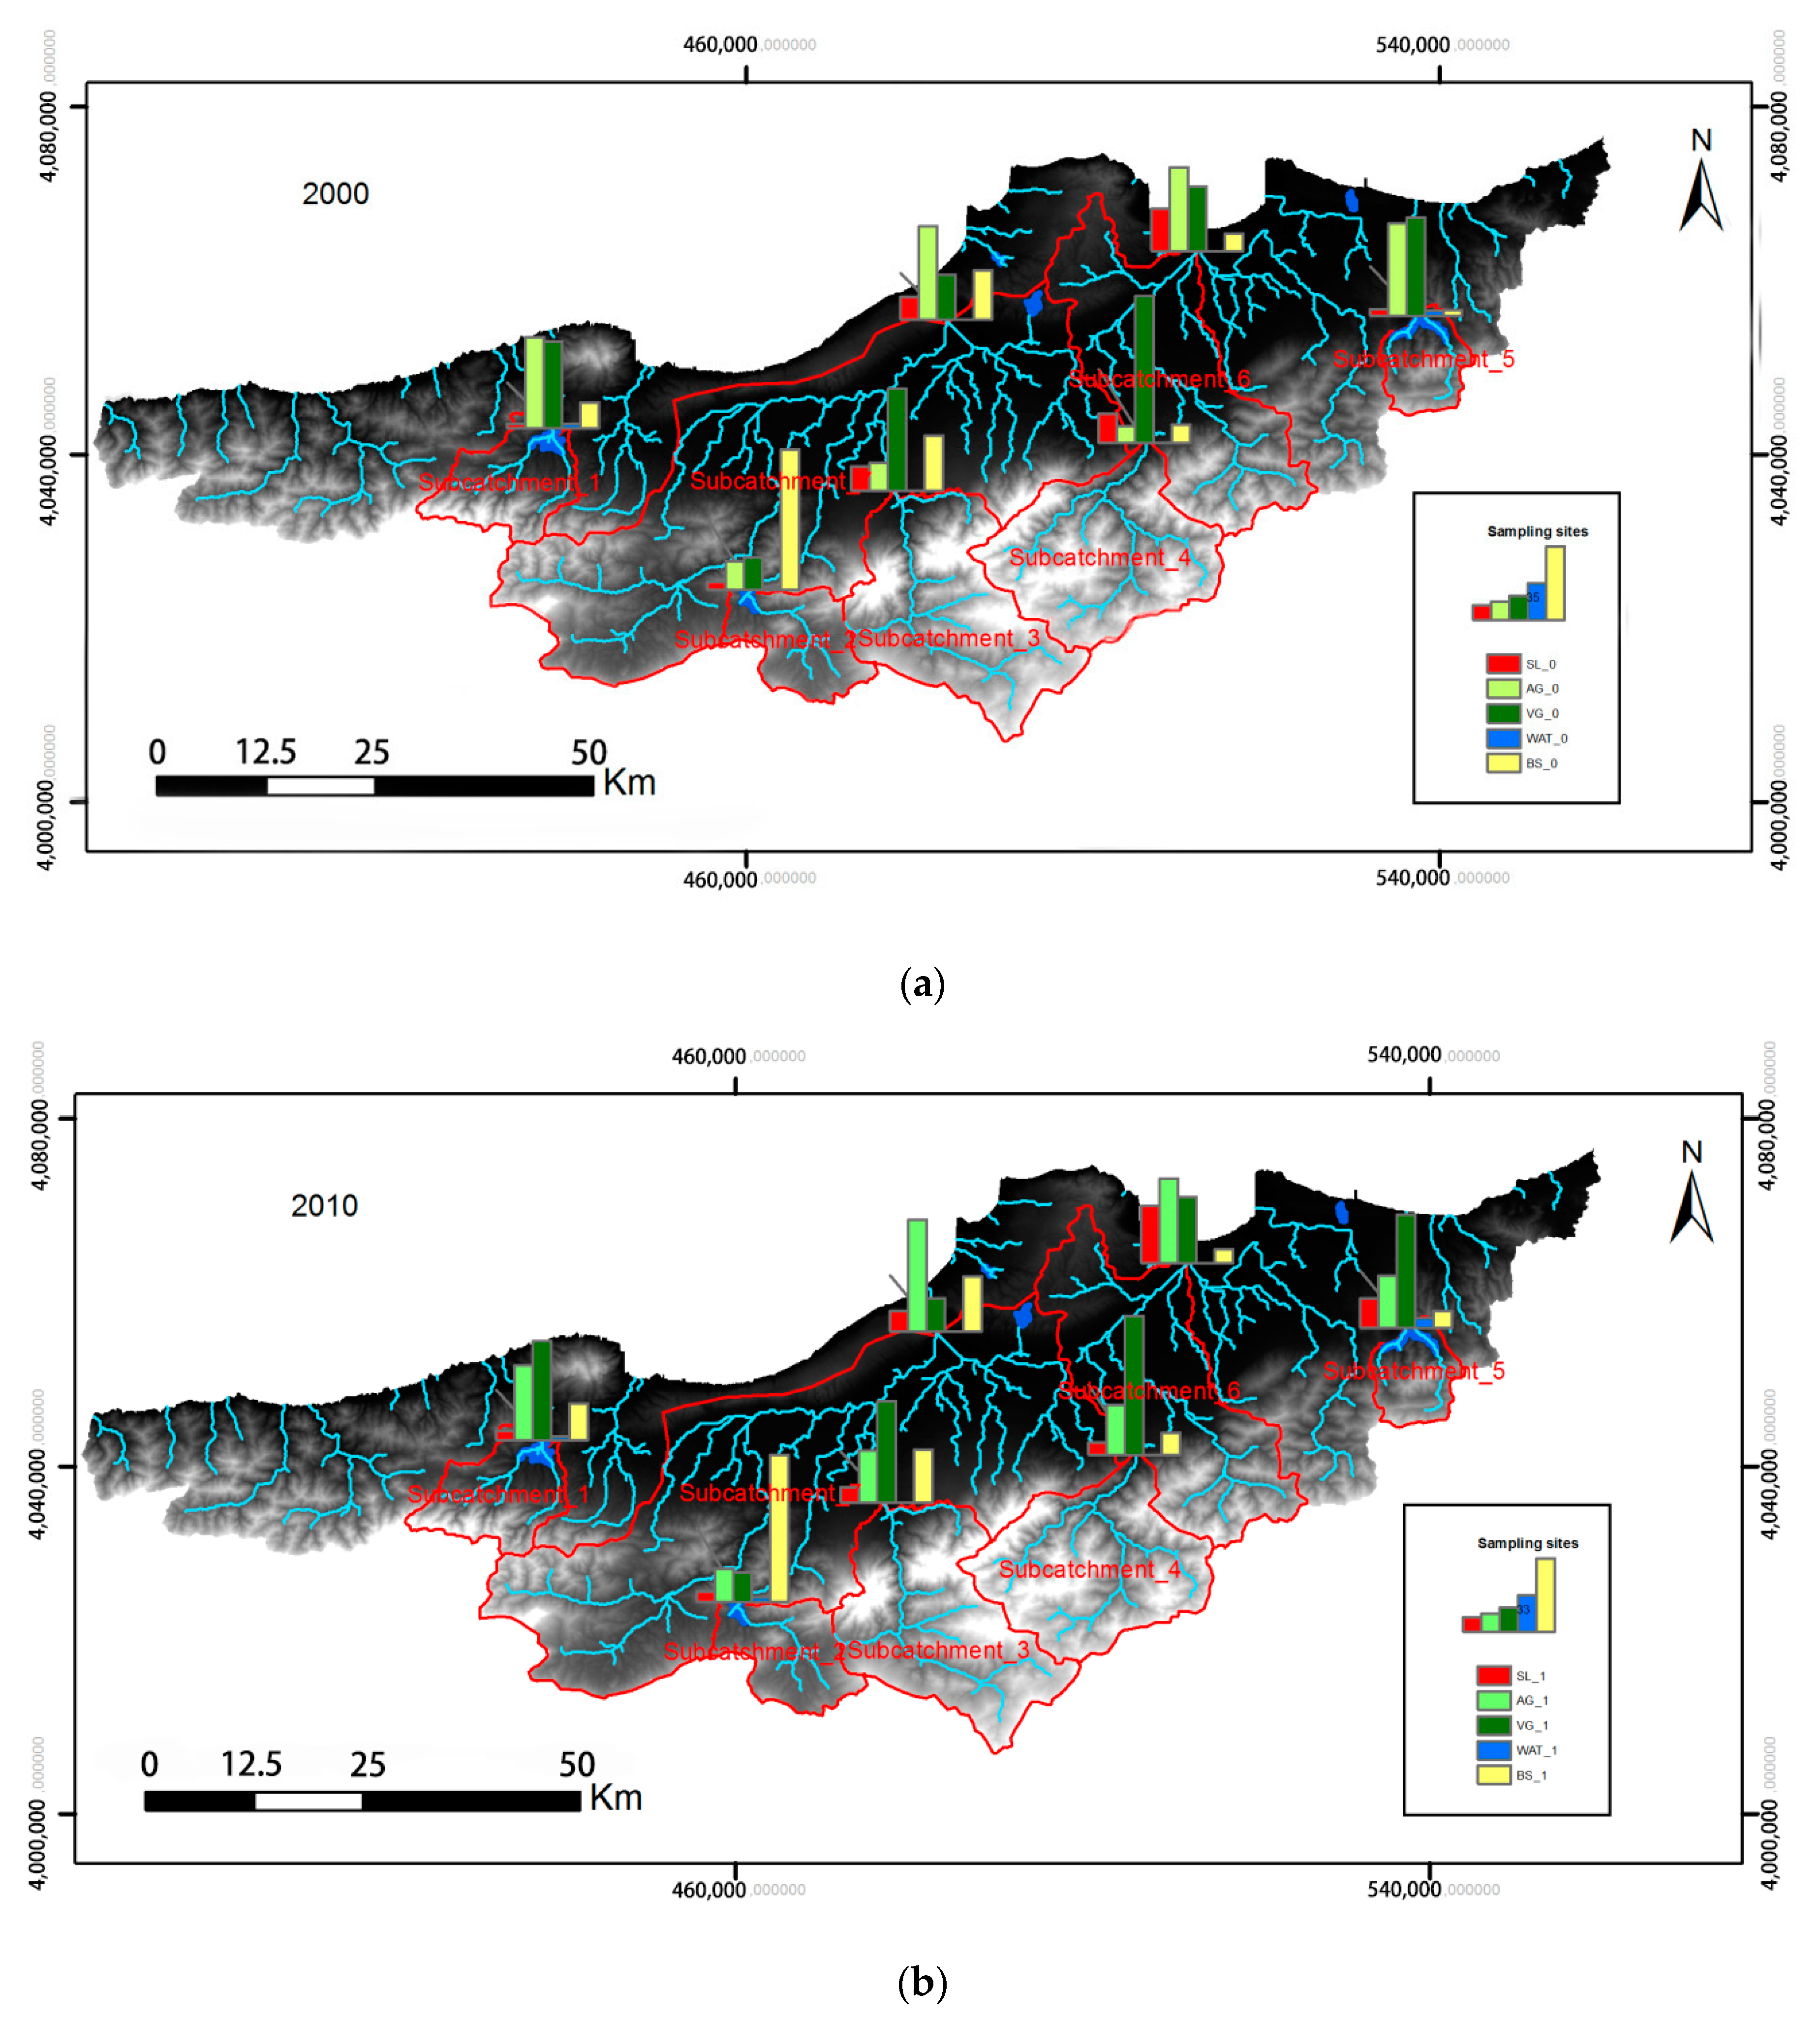
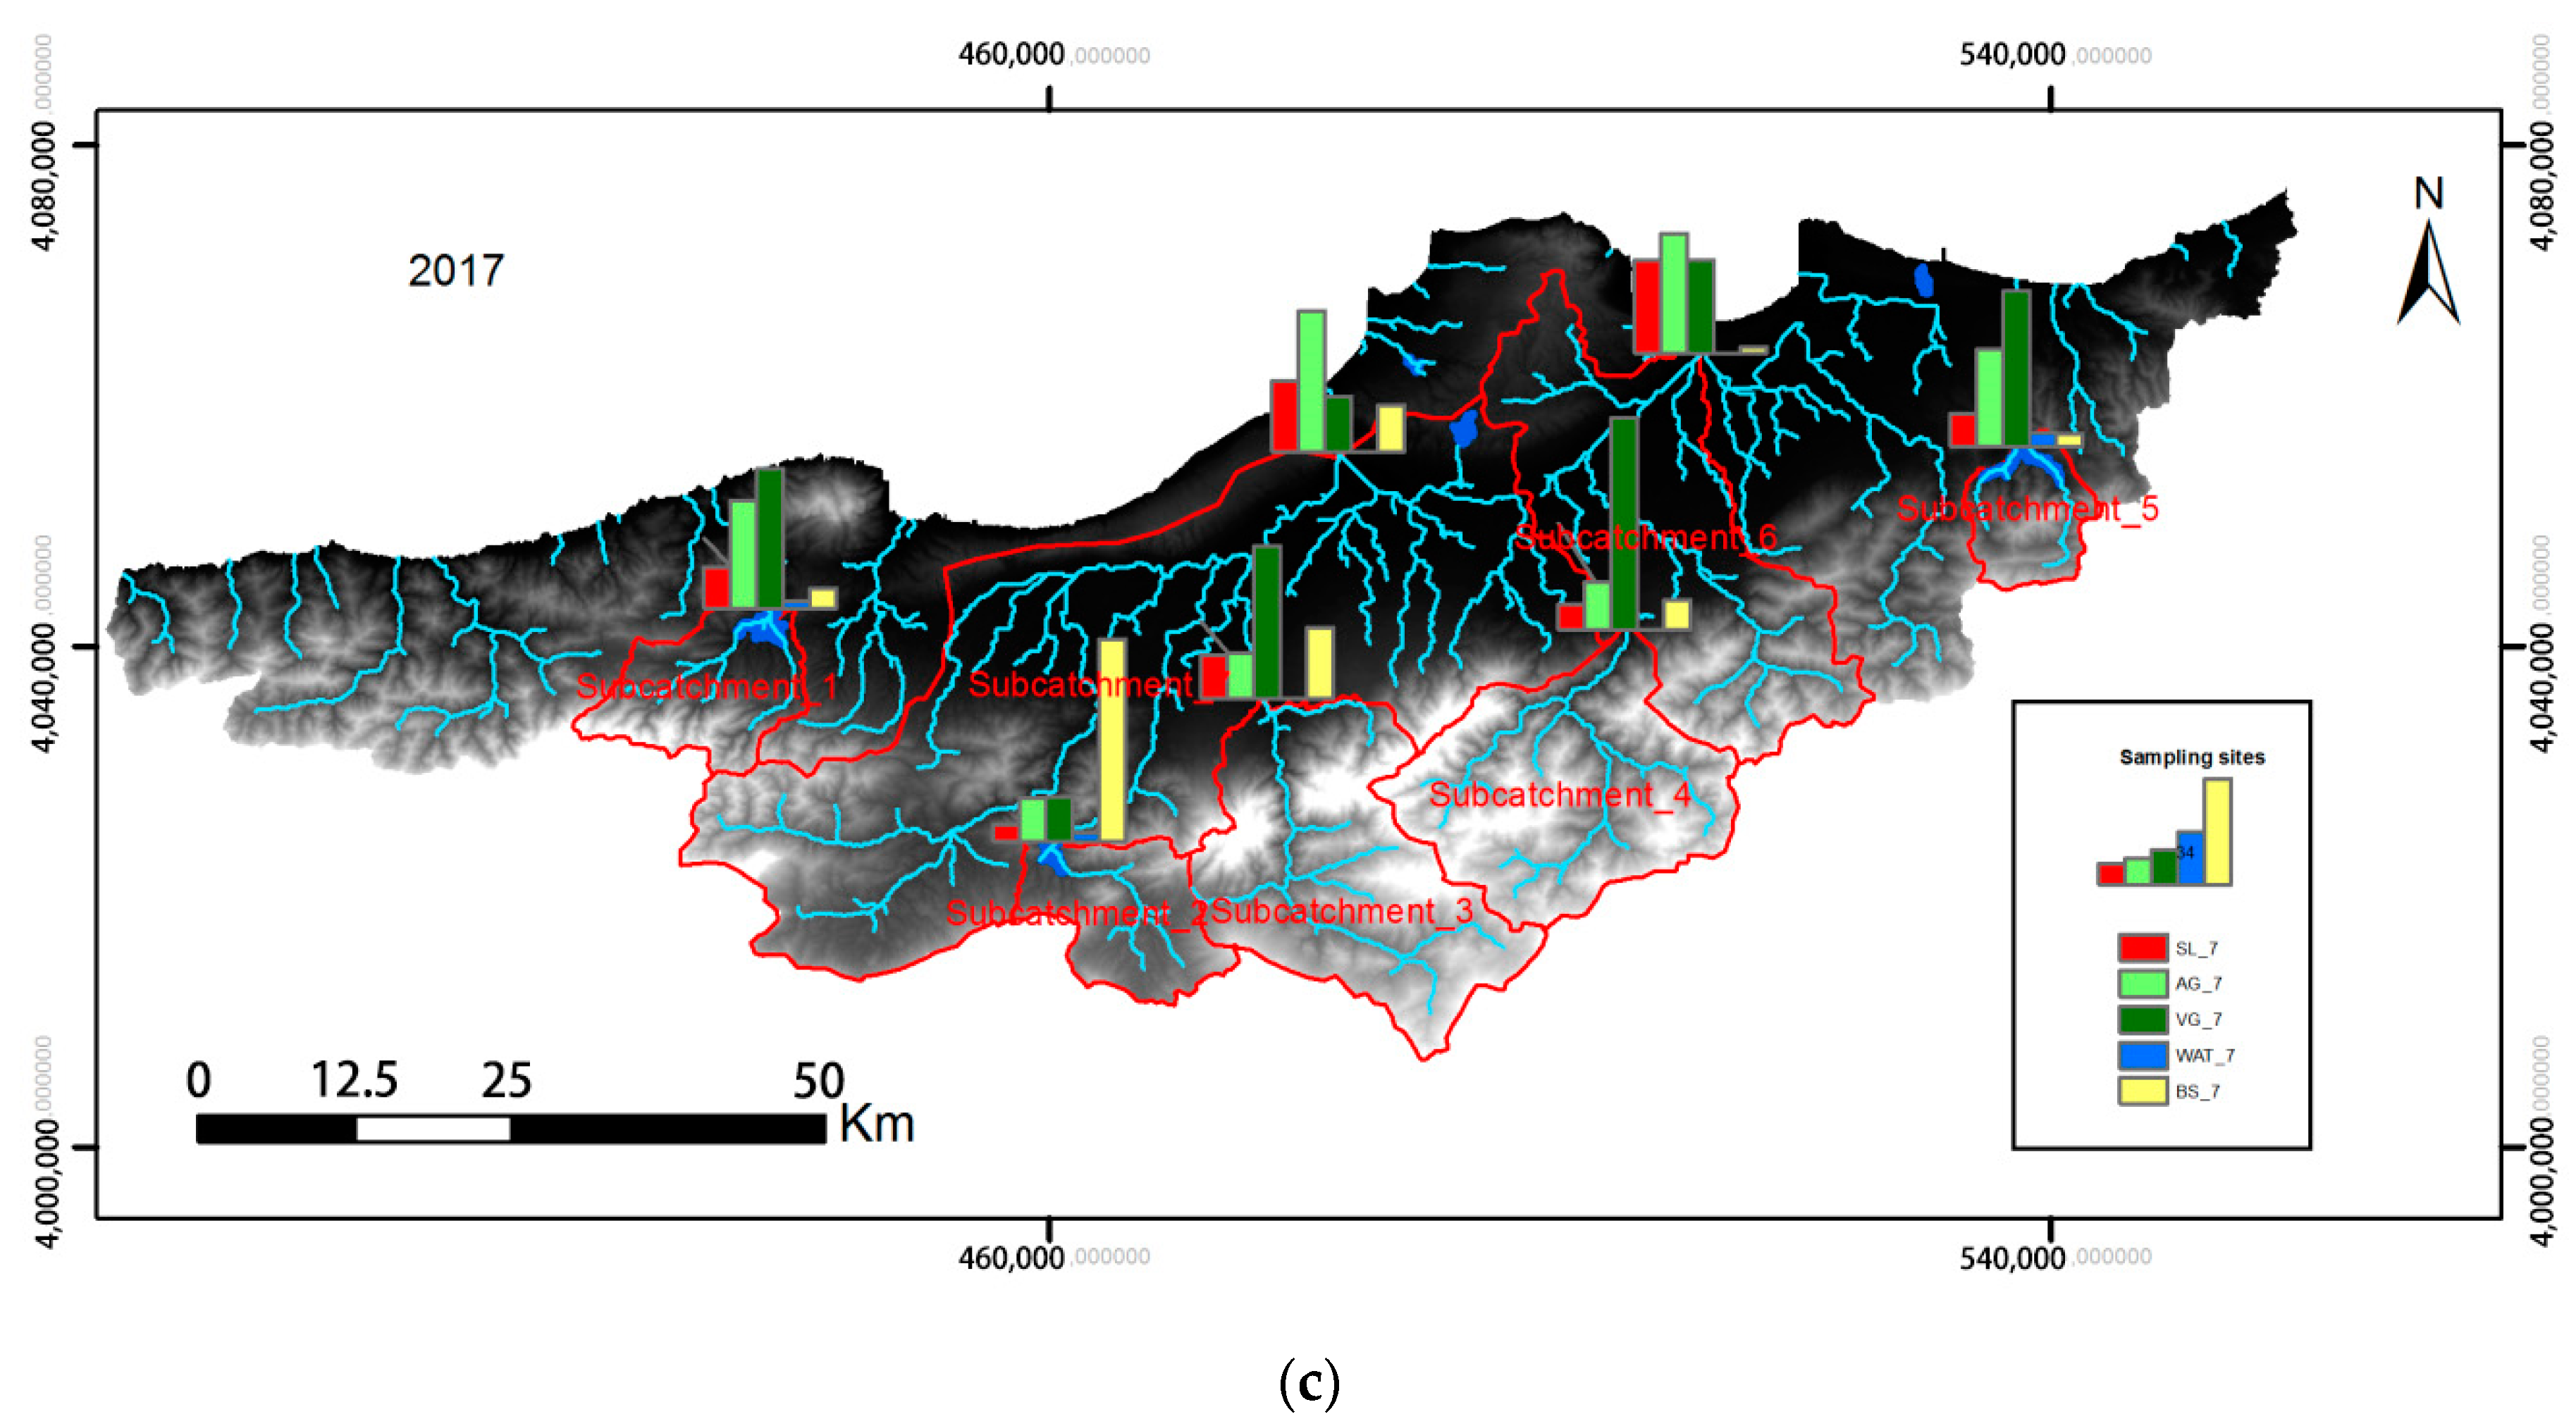
3.1. Variation of Land Use pattern between 2000 and 2017

Land use variables showed great variability over the 7 sub-catchments and the most dominant land use types were agriculture, vegetation or forest and urban settlement land (Figure 5).
Agricultural land coverage was the main landscape type in the watershed, for instance, in Catchment 1(43.1%), −6(40.1%), −7(44.2%) in 2000 (Table 3). Agriculture in catchments -2, -3, -4 and -7 increased by 187.4, 4426.6, 5767.90 and 3737.6 ha, respectively, 2000–2010 (Table 4). However, 2010–2017, agricultural land use in all sub-catchments showed a downward trend, most of it was converted into woodland (catchments 1 and 5) and urban area (catchments -4 and -5).
Woodland was also another dominant land use type in the watershed; forests were mainly distributed in southern parts of the study area occupying more than 44% in catchments -1, -3, -4 and -5 in 2000. There was a tendency of the woodland area to increase 2010–2017, mainly based on the increment of high altitude mountains.
Bare soil/rock was distributed almost everywhere in the basin, accounting for 66.7% (in catchment- 2), 26.4% (in catchment- 3) and 23.5% (in catchment -7) of land cover, respectively in 2000. Bare soil/rock in the drainage basin decreased 2010–2017, particularly in catchments -1, -6 and -7 (Table 4).
The settlement is mainly scattered in the riverside area, typically in catchments -6, -7 (29.9%, 22.5%, respectively in 2017). The settlement area in these catchments sprawled rapidly in the past 17 years, with an increment of 4844.4 and 16,858 ha, respectively. Moreover, little change in the water area.
In a word, the land use structure in this watershed has changed dramatically between 2000 and 2017 in detail, agriculture and barren land decreased significantly, meanwhile, urban settlement areas in sub-catchments increased quickly and such changes led to many pollutant loads.

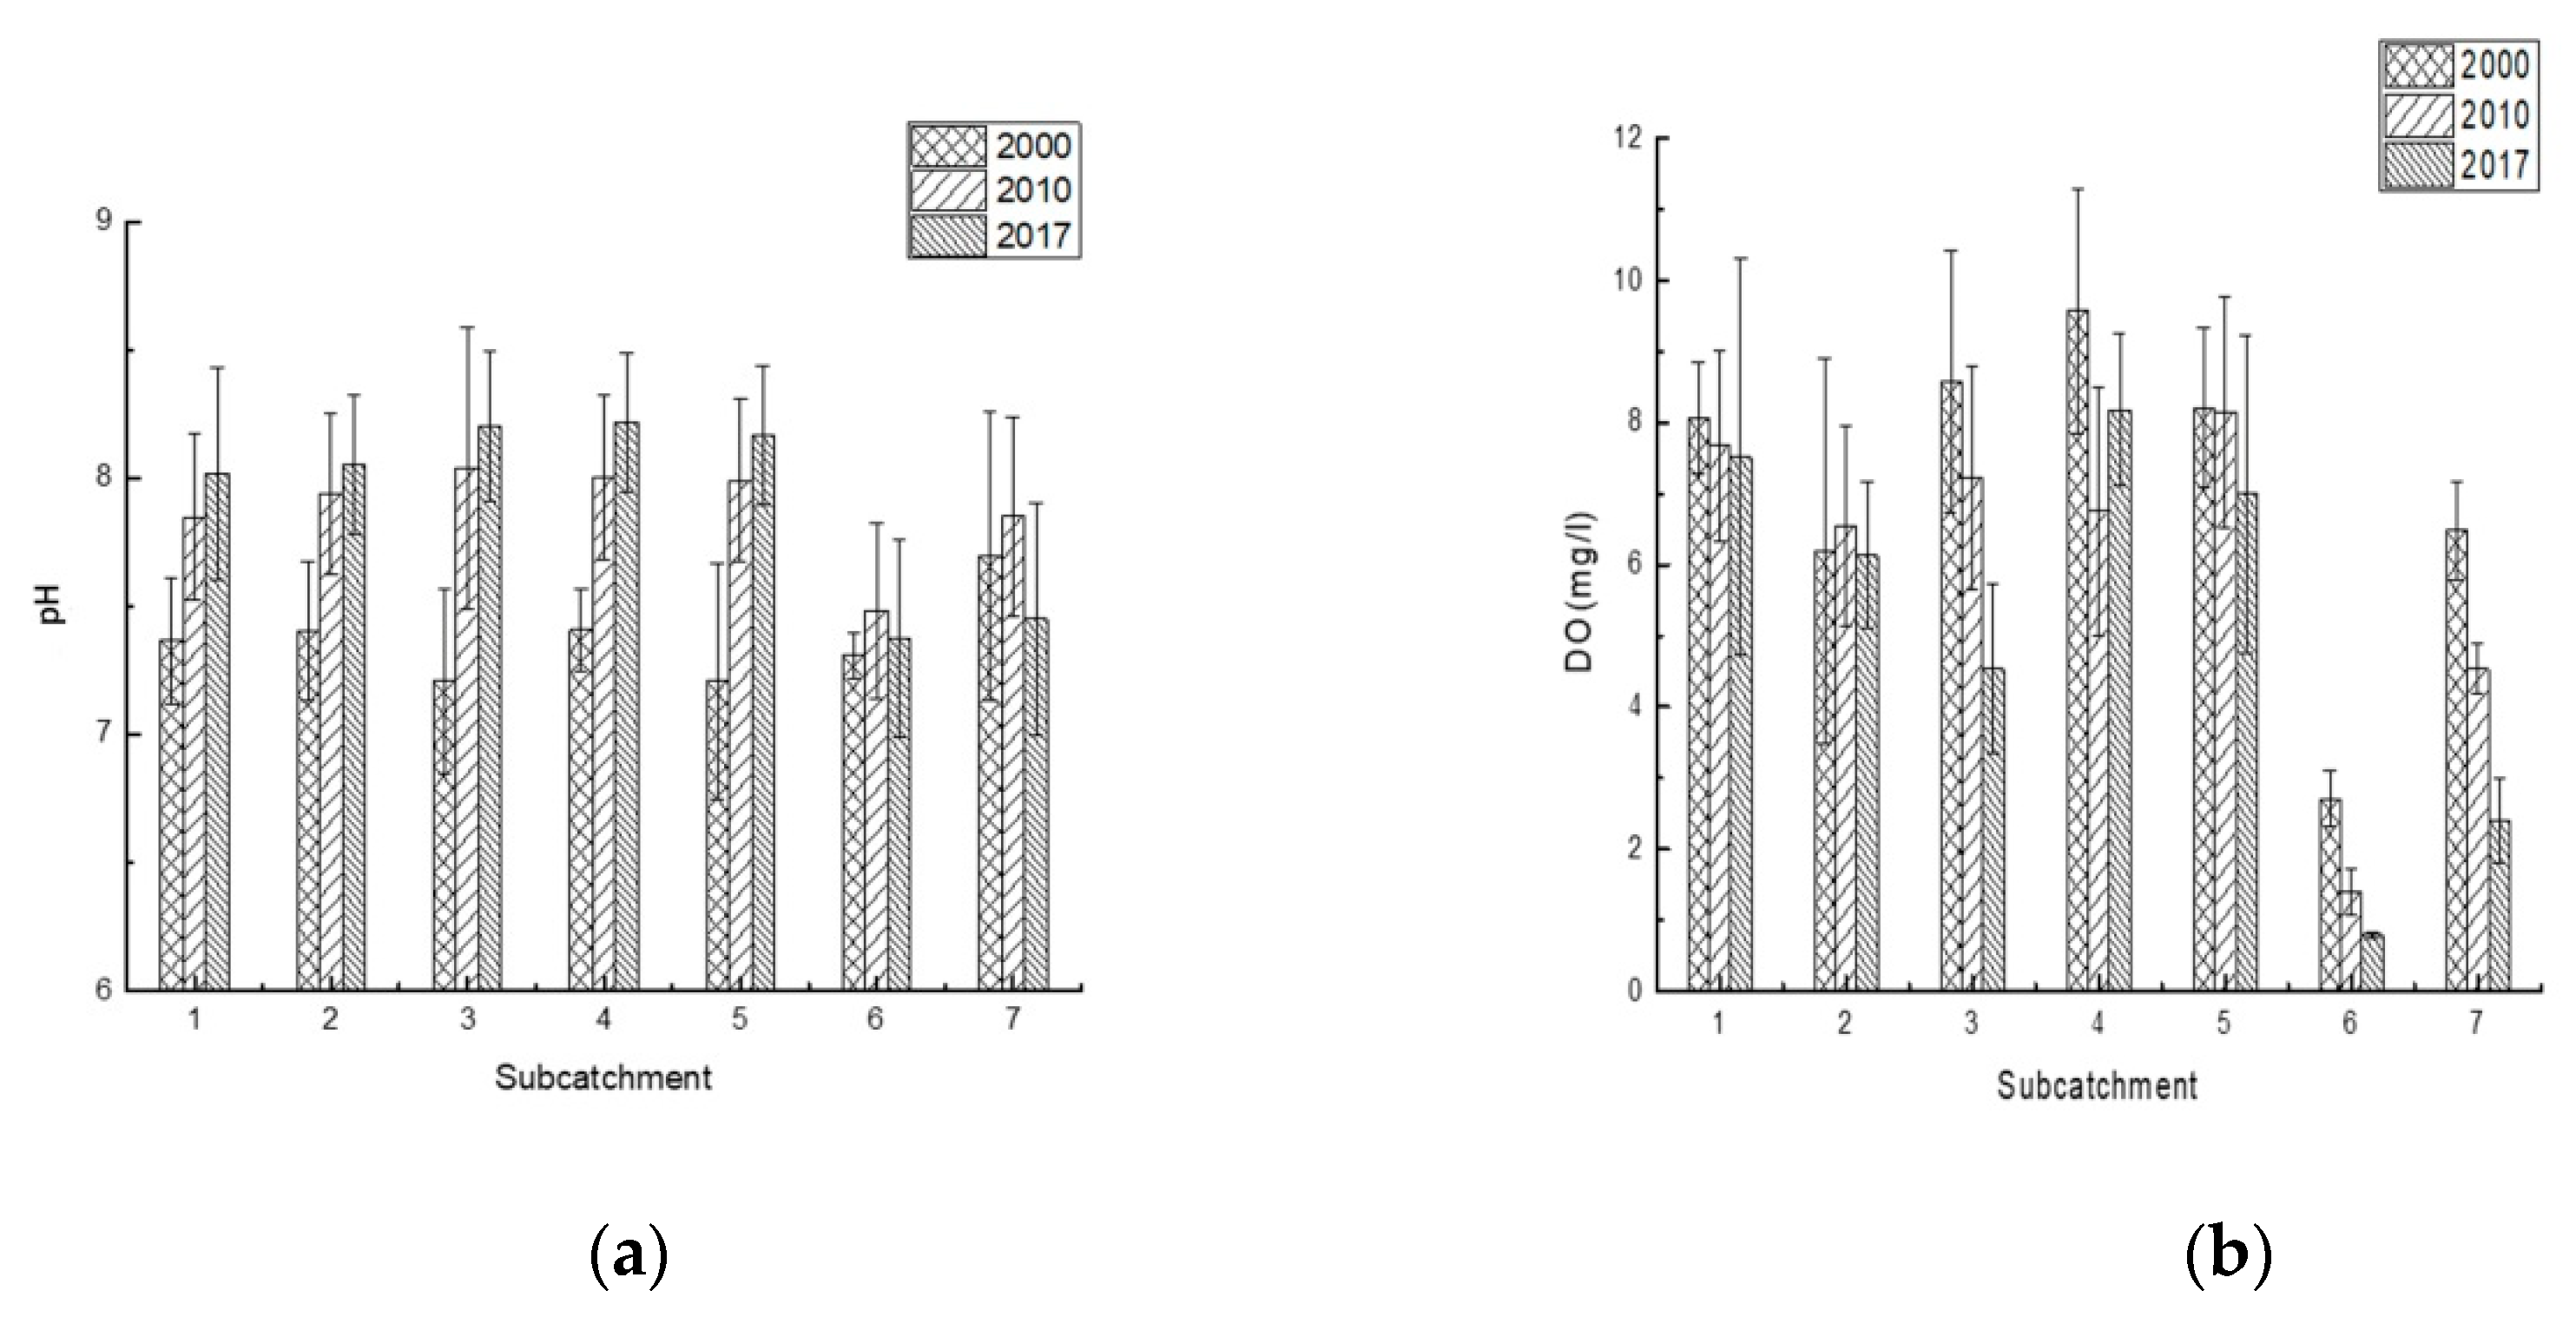
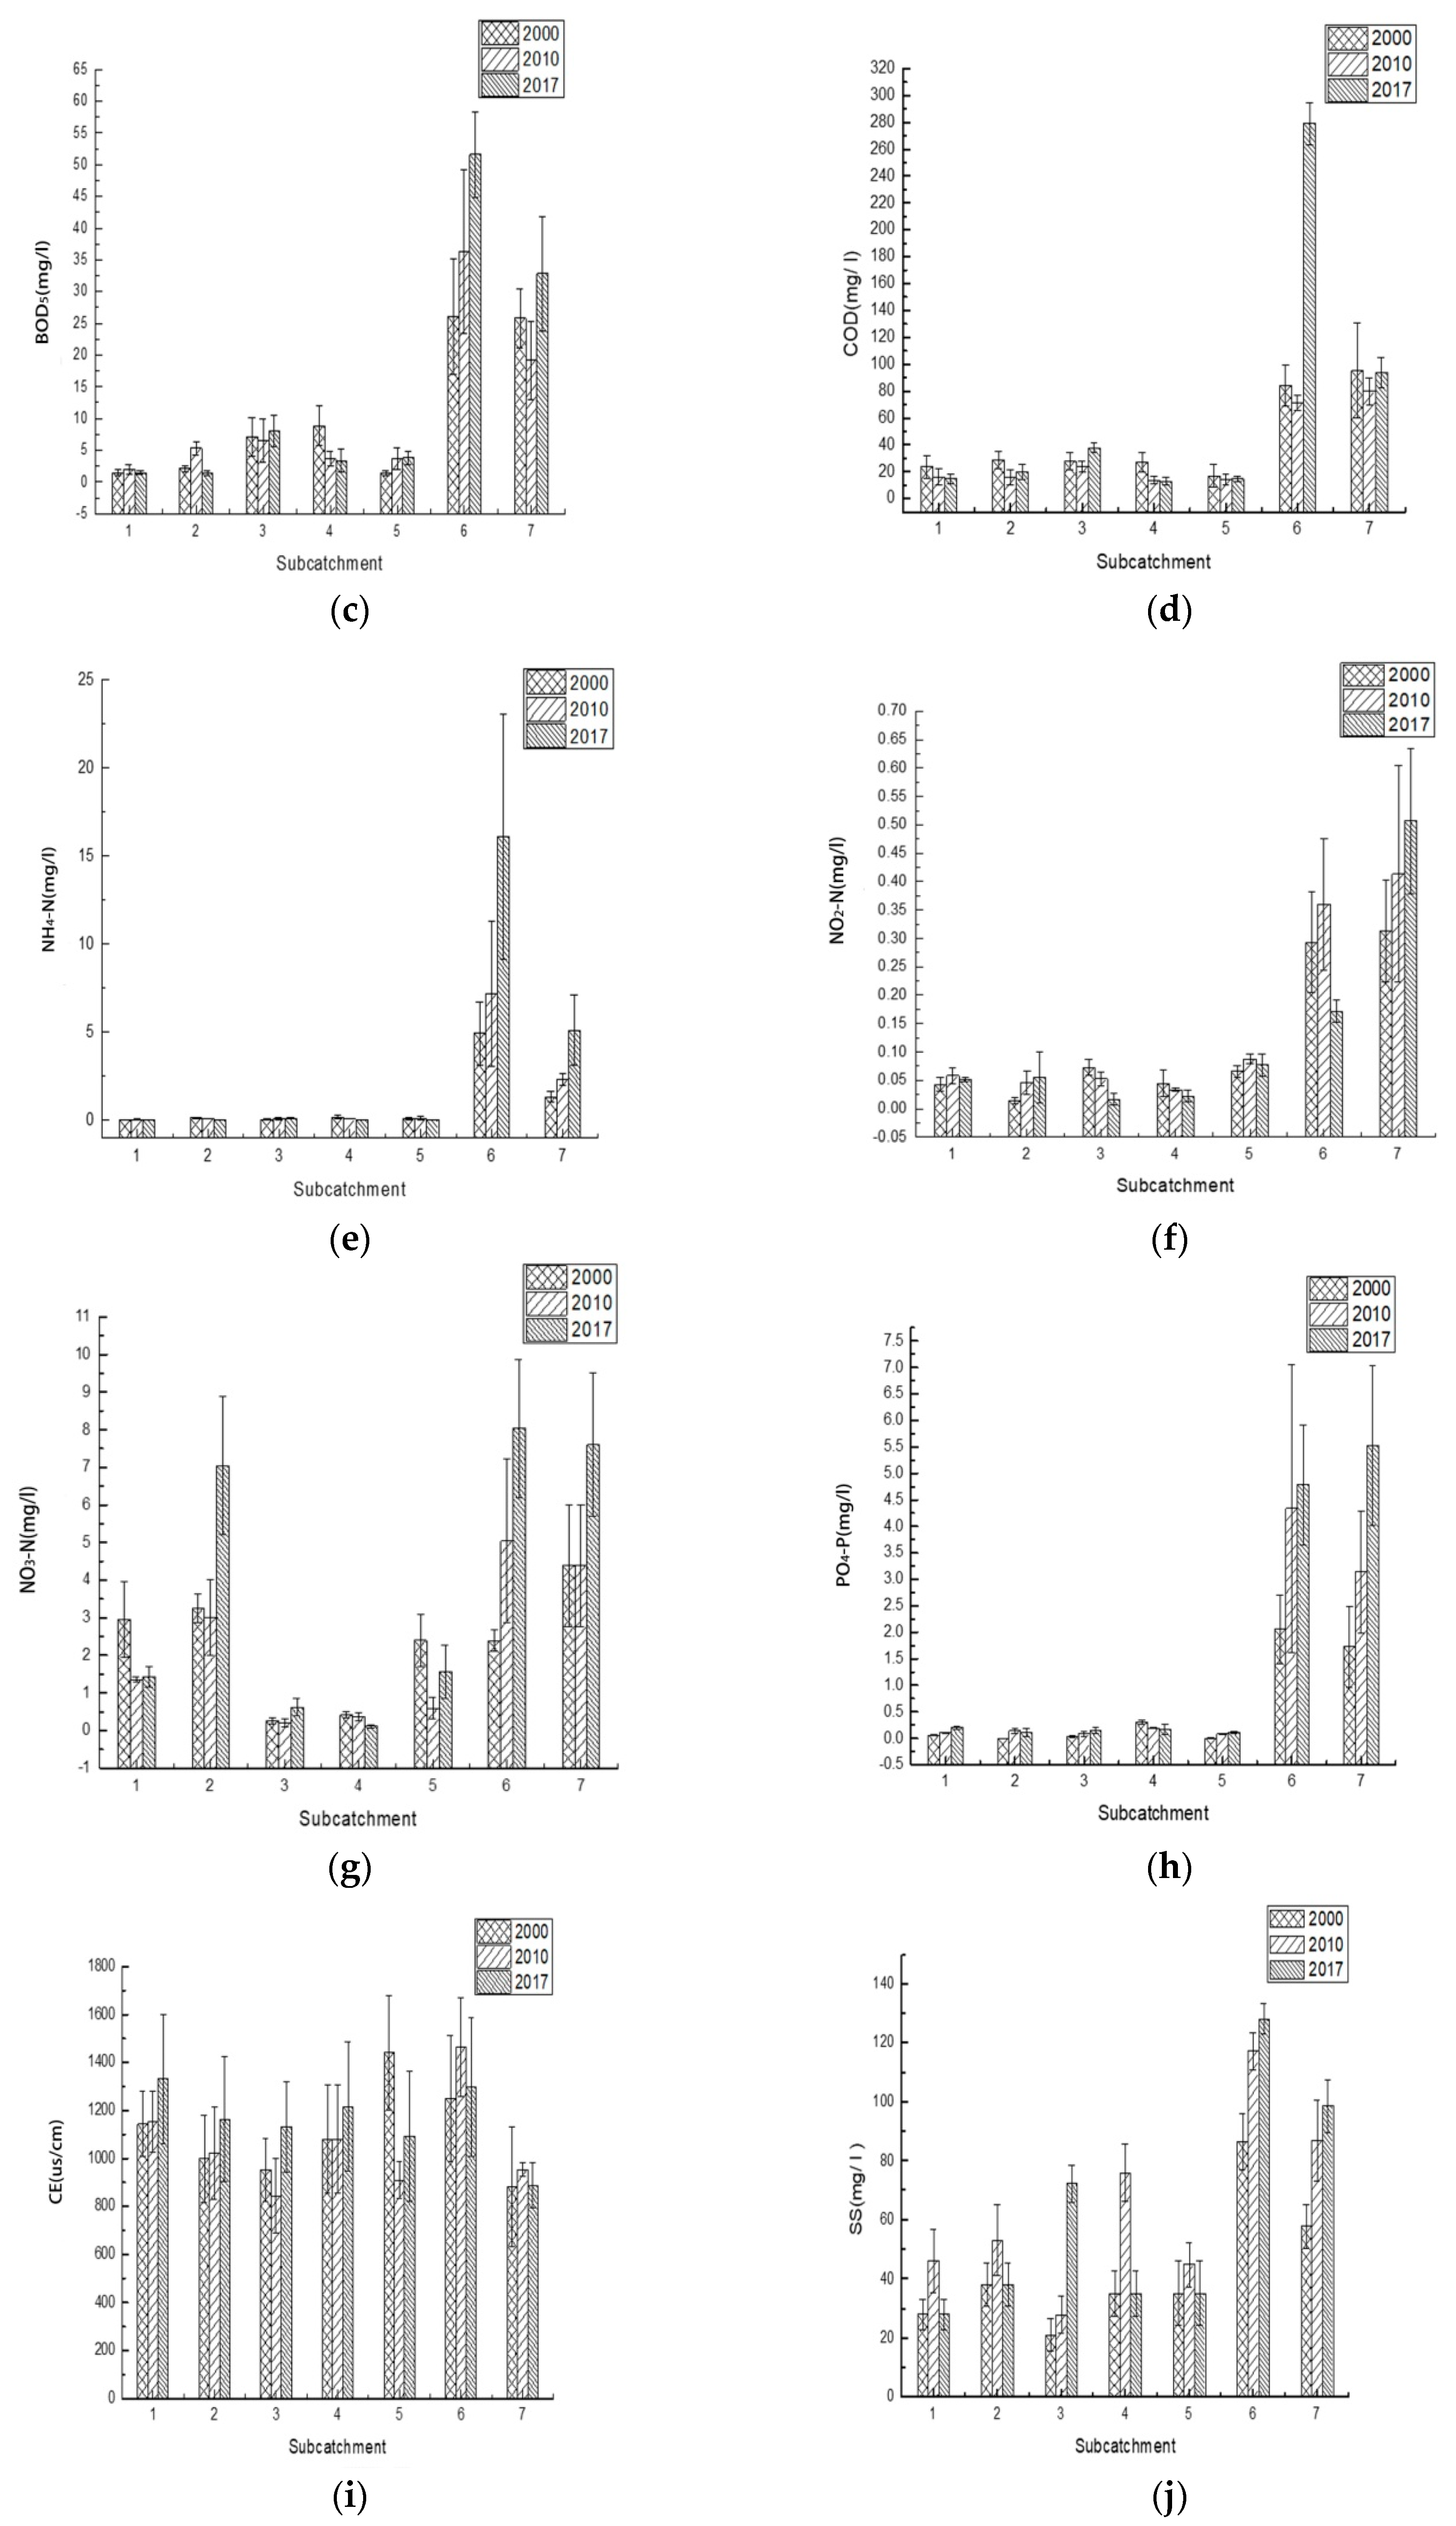
3.2. Characteristics of Physicochemical Water Quality in the Mitidja Watershed

Variations of physicochemical parameters of 2000, 2010 and 2017 are presented Figure 4 each catchment in the Mitidja watershed. The results of statistical analyses revealed that most of the water quality parameters (WQP), except pH, showed greatly spatial differences among the -7 sub-catchments. The highest values of (pH = 8.22) slightly alkaline was observed in catchment -4 (2010). The maximum of DO occurred in catchment -5 and was higher in forest areas. The low concentration of DO and maximum volume of COD, NH4-N, NO2-N, PO4-P, BOD5 and SS were recorded in the lower part of the study area, for example, catchment 6 (Figure 6), usually affected by point source pollution. The highest concentration of NO3-N is found in catchment -7.
Spatial variation of water quality during 2000, 2010 and 2007, COD concentration increased from the upstream to downstream. The largest increment rate of COD occurred in sub-catchment 6 between 2010 and 2017. The most severe pollution of NO3-N existed in the middle and downstream. The upper part Mitidja tended to have more DO concentrations, but DO status decreased to Grade IV in catchment -6 and -7.
Briefly, water quality characteristics in the Mitidja Basin have strong geographical division. Upstream areas of the basin (catchment -1, -2, -3, -4 and -5) receive least water pollution, the water quality of this mountainous region of the basin is slightly polluted with all sites recorded an average of category II, but their downstream areas are highly polluted (catchment- 6 and -7) which is related to point sources and non-point pollution sources pollution, such as agricultural runoff, domestic waste and industrial discharge. Water in downstream of the two rivers is mostly within the worse IV category. And obviously, most water quality variables have deteriorated during the period of 2000–2017.

3.3. Multivariate Correlation Analysis between Land Use and Water Quality

3.3.1. Single Factor Correlation Analysis

In order to quantify the relationship between land use and water quality, the Pearson correlation in SPSS was used to establish the relationship between water quality and land use variables. The area proportion of five land use types and the annual average concentration of ten water quality indicators in 2017 were used. Based on the significance level, independent variables NO2-N, CE were eliminated, other eight water quality parameters passed the test (Table 5). For example, settlement land (SL) was positively correlated with BOD5, SS, NH4-N, COD and PO4-P (r = 0.956, 0.927, 0.905, 0.904 and 0.885, p < 0.01) and negatively correlated with DO (r = −0.896, p < 0.01) and pH(r = −0.893, p < 0.05). Agriculture land (AL) was positively correlated with PO4-P (r = 0.765, p < 0.05) and negatively correlated with pH(r = −0.780, p < 0.01). There was a significant negative correlation between vegetation (Veg) land and NO3-N (r = −0.933, p < 0.01). The other land use indicators, water bodies and bare soil, have no significant correlations with water quality indicators.

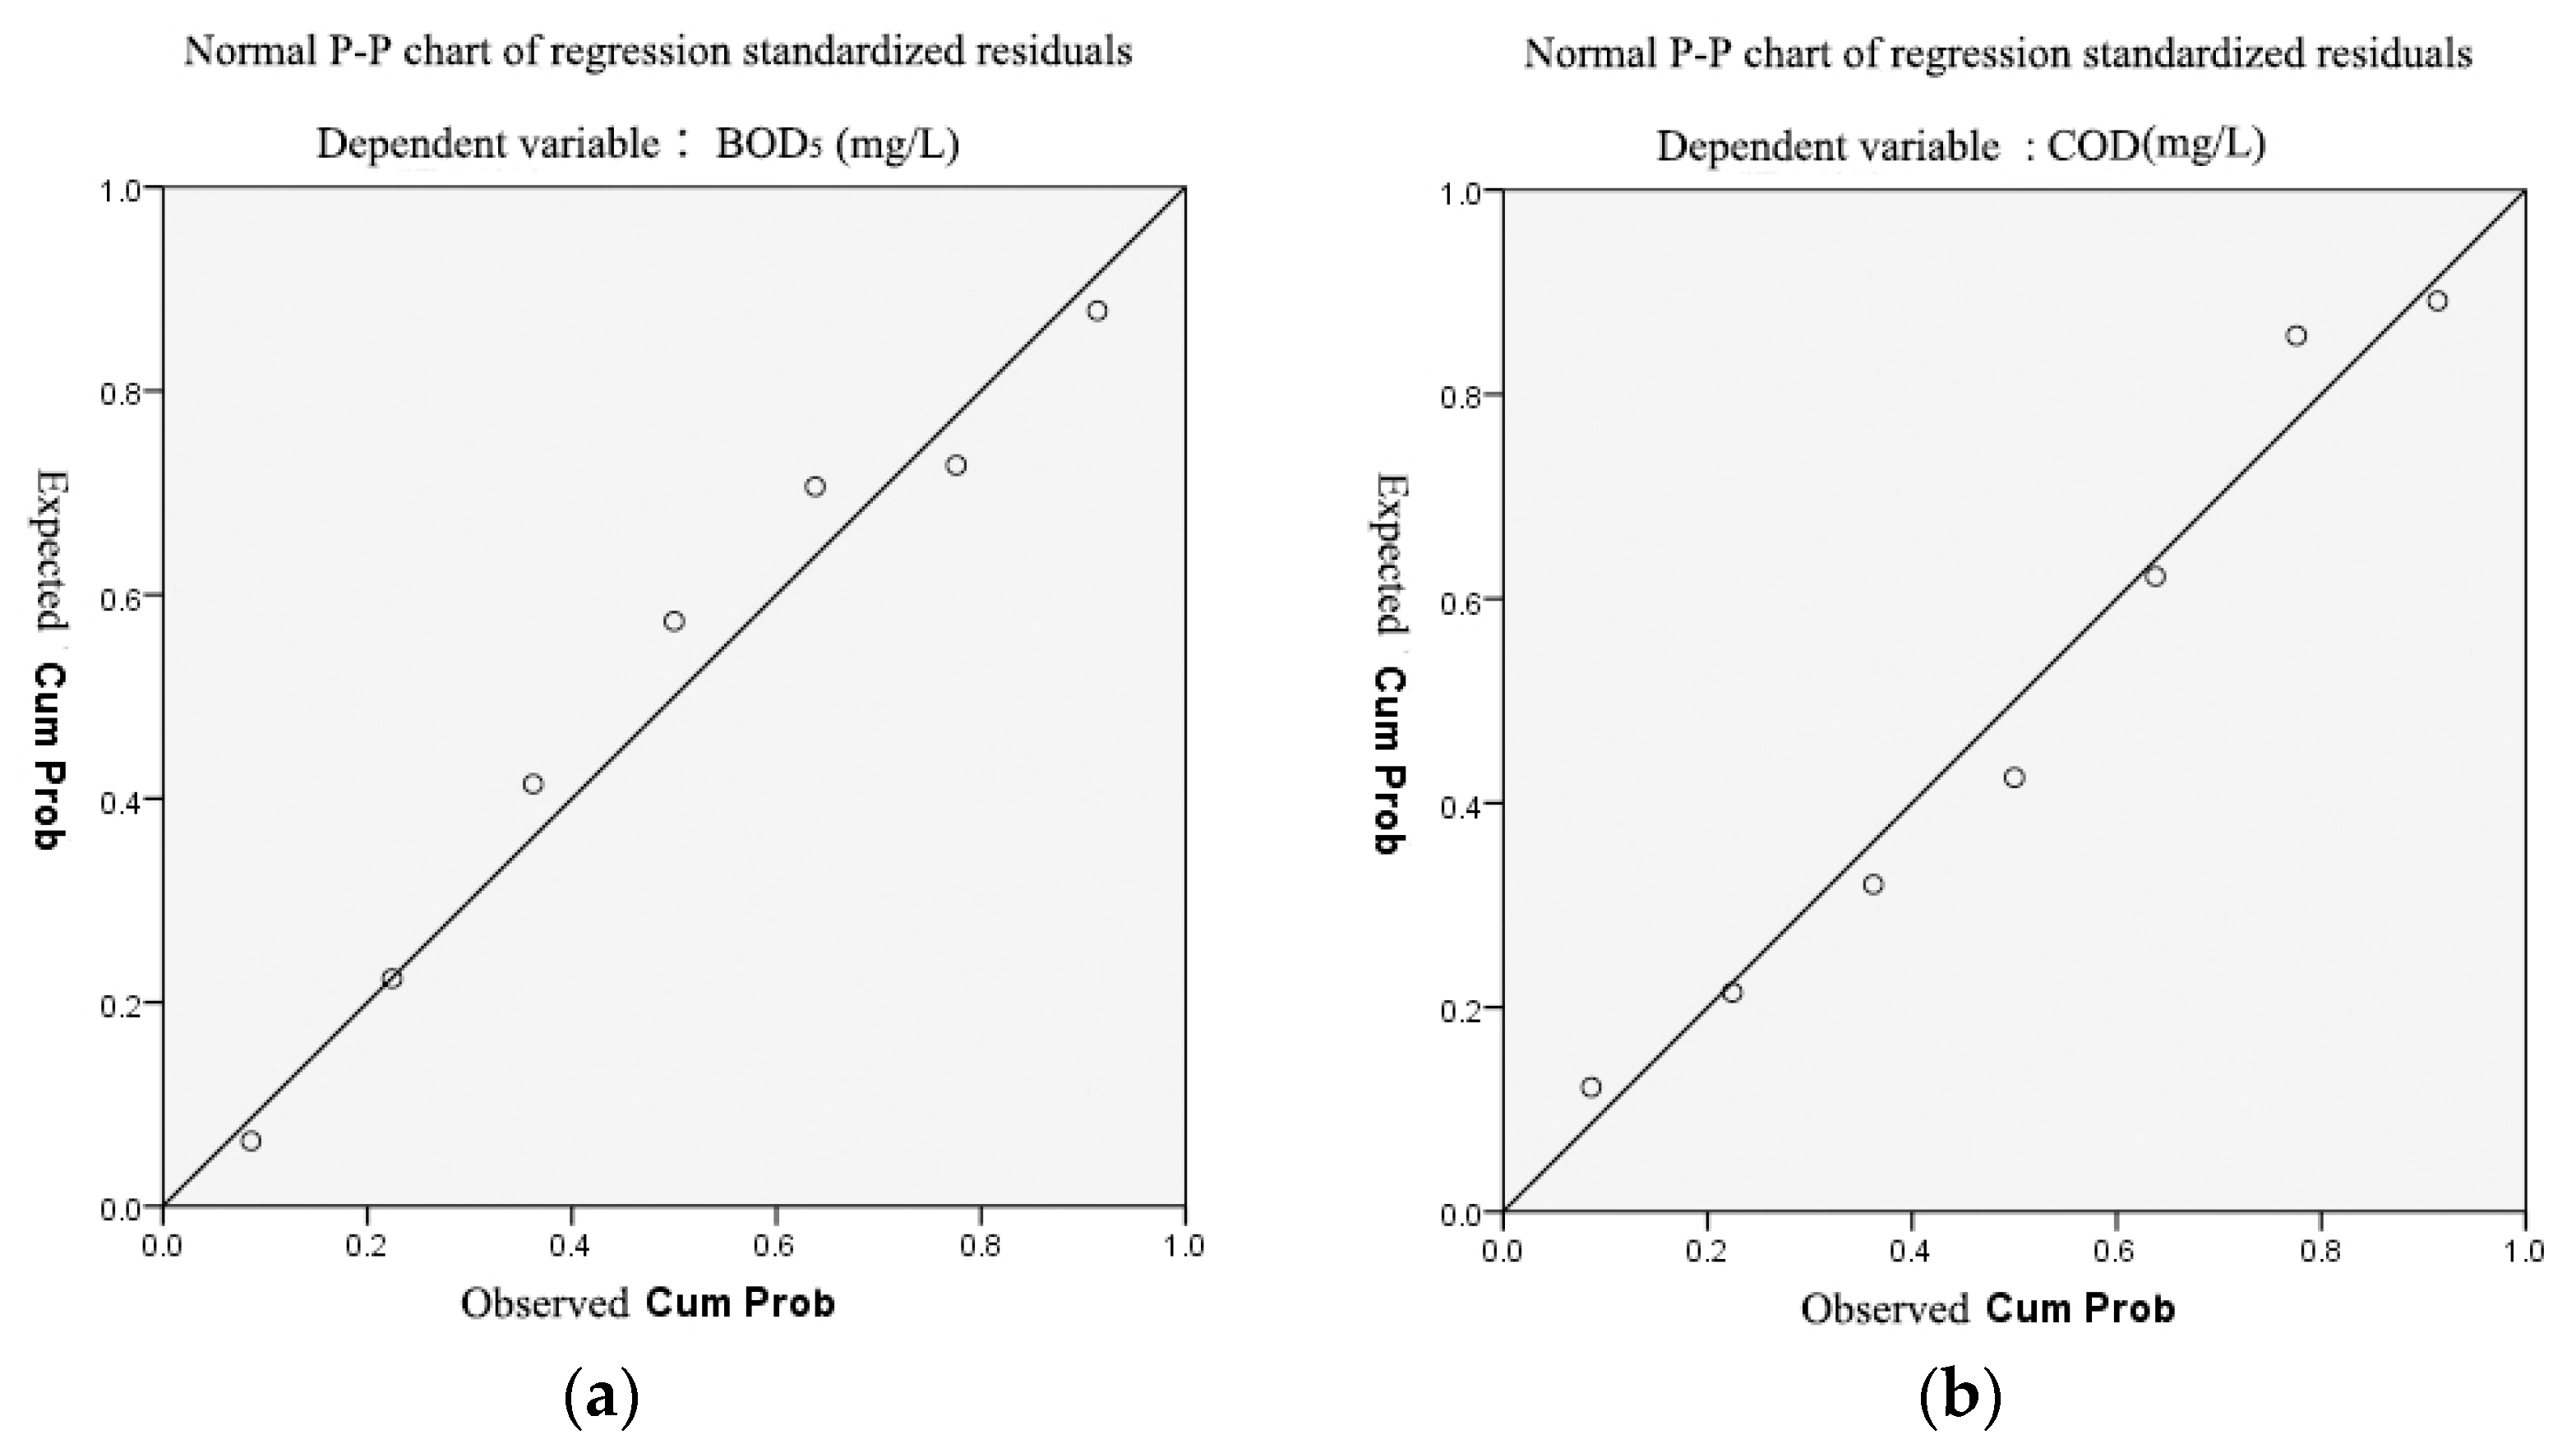
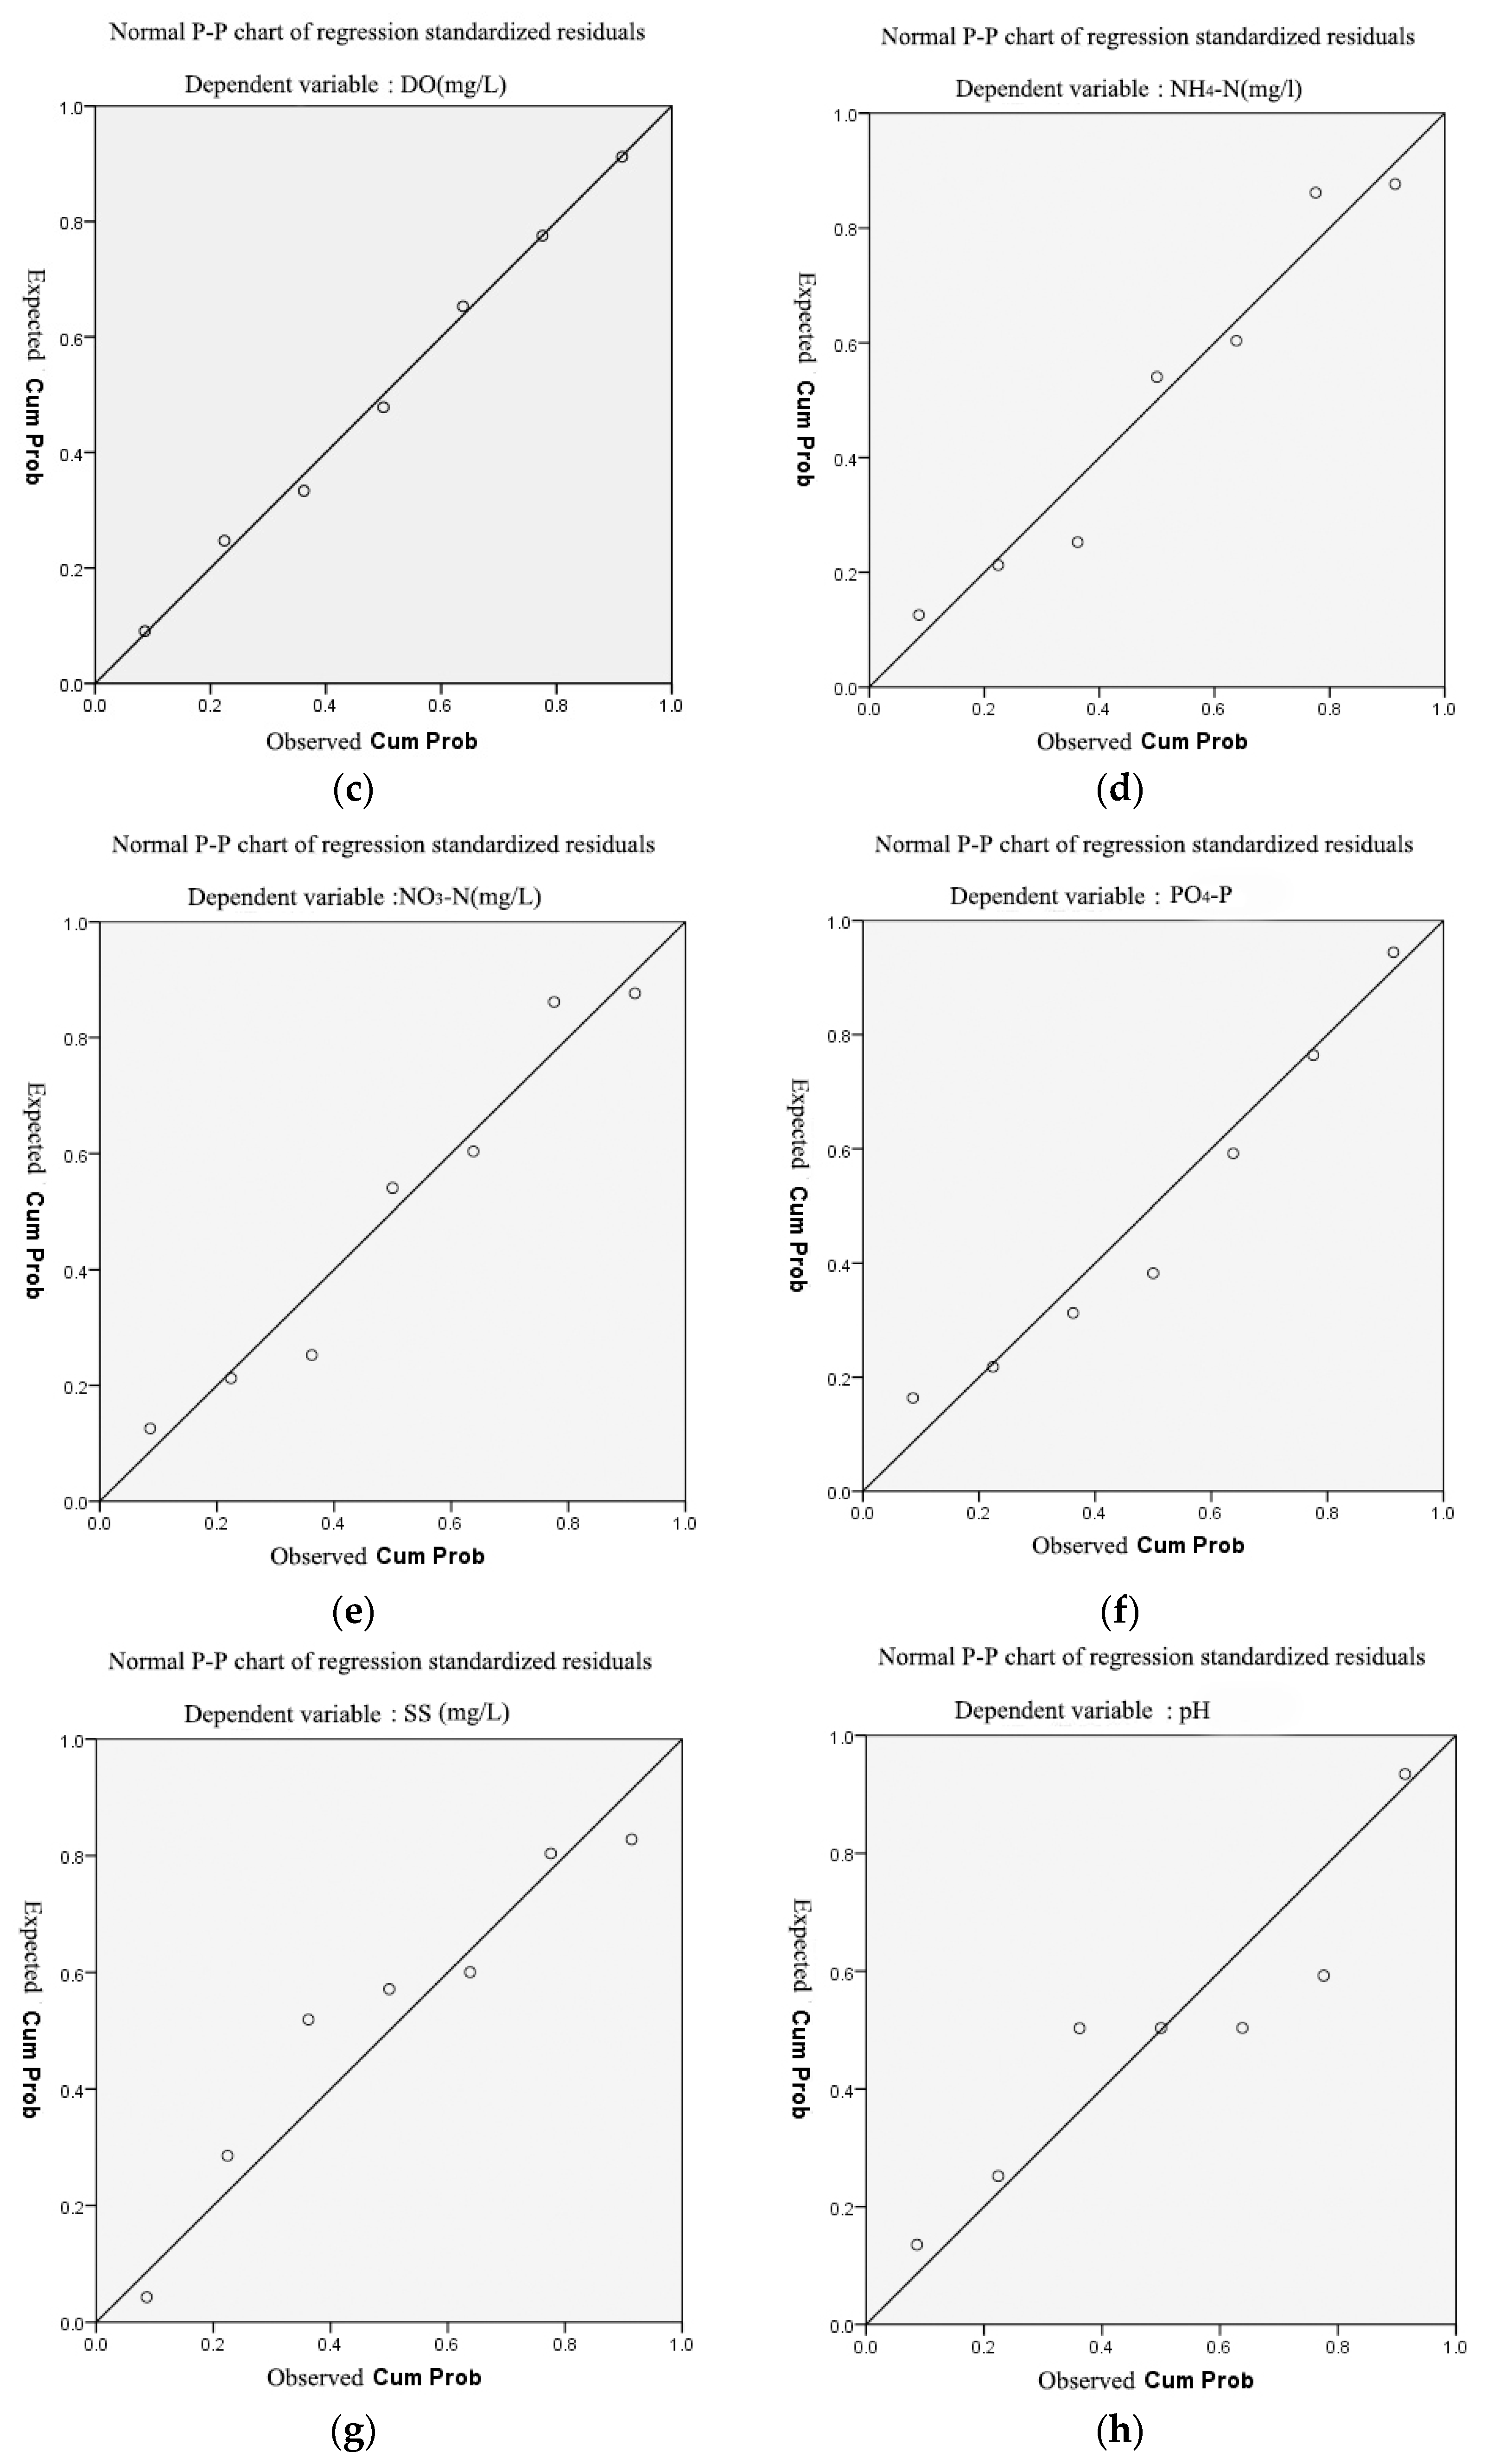
3.3.2. Multiple Linear Regression Analysis

Based on the significant correlations between the water quality and land use change, multiple stepwise linear regression (MLR) of each water quality variables with three land use variables (SL, AL and Veg) was done in 7 sub-catchments. The results show that a particular type of land use cannot describe the overall water quality indicators, but most of the water physical and chemical indicators can be accurately predicted by one or two land use types (Table 6). Significance probability level, tolerance and variance inflation factor (VIF), which are characteristic parameters of the collinearity diagnostics indicating that there was no collinearity among the independent variables. However, for the significance level is too low, AL was excluded from three land use variables for the development of the MLR model. Probably the impact of agricultural land on water quality is masked by urbanization factors.
We can see that the significant independent variables are SL and Veg in the MLR model in Table 6. For most of water quality parameters (DO, NH4-N, PO4-P, BOD5, COD, SS), SL can be looked at as predictors (R2 = 0.802, 0.818, 0.783, 0.915, 0.818, 0.859). Similarly, for NO3-N, Veg can be looked as predictors (R2 = 0.870). For pH, the non-standardized partial regression coefficients of the two independent variables are provided in Table 7. The MLR model was as follows:
pH = 8.116 − 0.032 SL + 0.007 Veg
From the perspective of regression analysis, DO, BOD5, NH4-N, PO4-P, COD, SS and pH showed sensitivity on changing settlement land, whereas NO3-N was only sensitive on changing vegetation and pH could be well explained by settlement land and vegetation. Hence urban settlement land has the greatest impact on water quality.
Meanwhile, residuals analysis showed the good fitting of the regression model (Figure 7), the independent variables (i.e., urban settlement area) are a good predictor for dependent variables (i.e., water quality parameters), for gauging the relationship between land use and water quality.
In a word, in Mitidja watershed, the urban settlement is sensitive on almost all water quality parameters, while vegetation on NO3-N only and Agricultural land on both pH and PO4-P. Therefore, the residential area is the most relevant predictor of water quality parameters, for example, in the regression equation of DO, although the coefficient of independent variable settlement land is negative, it also shows that the increase of settlement land will cause water pollution in the basin, which is consistent with the “source-sink” theory.

3.4. Time Correlation between Water Quality and Land Use Index

As shown in Table 8, as time passes, the increase of urban land is related to the increase of PO4-P, BOD5 and NH4-N concentration. A decrease of bare soil over time is related to increasing concentrations of PO4-P and NH4-N. This result may be the reason why bare soil is more transformed into agricultural land and settlement land in sub-catchments where bare soil accounts for more, such as catchment -6 and -7. There was no significant correlation between other water quality indexes and land use. This result shows that in the past 17 years, in addition to land use, more natural and anthropogenic variables may change dramatically. These variables include climate change, stream flow, population growth, water use, fertilizer application, pollution control technology and national policies. All these factors affect water quality together. Previous studies have also discovered that there are no significant relationships between water quality and land use indicators over time [18].

4. Discussions

4.1. Correlation Analysis between Land Use and Water Quality in the Mitidja Basin

4.1.1. Based on Watershed Scale

In terms of the correlation analysis above, land use structure plays an important role in affecting major water quality parameter variability. Settlement, agriculture land and vegetation are the main land use types among them.
First, the analysis shows that percentage of urban settlement land has a significant negative correlation with the concentration of DO, but has a significant positive relationships with almost all other water quality indicators. A similar conclusion is given by Sliva and Liu et al. [19,20]. With the increase of settlement land, water quality gradually deteriorates. The increase of urban settlement land means increased impervious surface and pollutants are easily washed into the water by rainfall, bringing out more pollutant loads [18,21,22]. Various human and economic activities related to urban residential land, including the discharge of residential, municipal and industrial sewage, the use of fertilizers and pesticides on lawn, street and road runoff and other non-point sources, all contribute to the concentration of water pollutants. Therefore, the water quality of the whole basin becomes worse and worse.
Second, agricultural activities will increase the risk of soil erosion, while fertilizers [23] and pesticides will input large amounts of nutrients into rivers along with rainfall-runoff, resulting in the decline of river water quality, especially nitrate nitrogen, ammonia nitrogen and phosphate, etc. [19,24,25]. However, in this study, agricultural land is only positively correlated with PO4-P. It is again proved that the relationship between agricultural activities and water quality is uncertain [18,19], to better explain water quality change, comprehensive analysis coupled with urban land use and river basin factors is necessary [20,26,27].
By comparison, a significant negative correlation exists between percentages of vegetation and NO3-N. Previous studies also drew a similar conclusion, the forest dominated region had low concentrations of most nutrient variables [26], Forest land appeared important in mitigating water quality pollution [19], and natural grassland land can slow down water pollution [25].

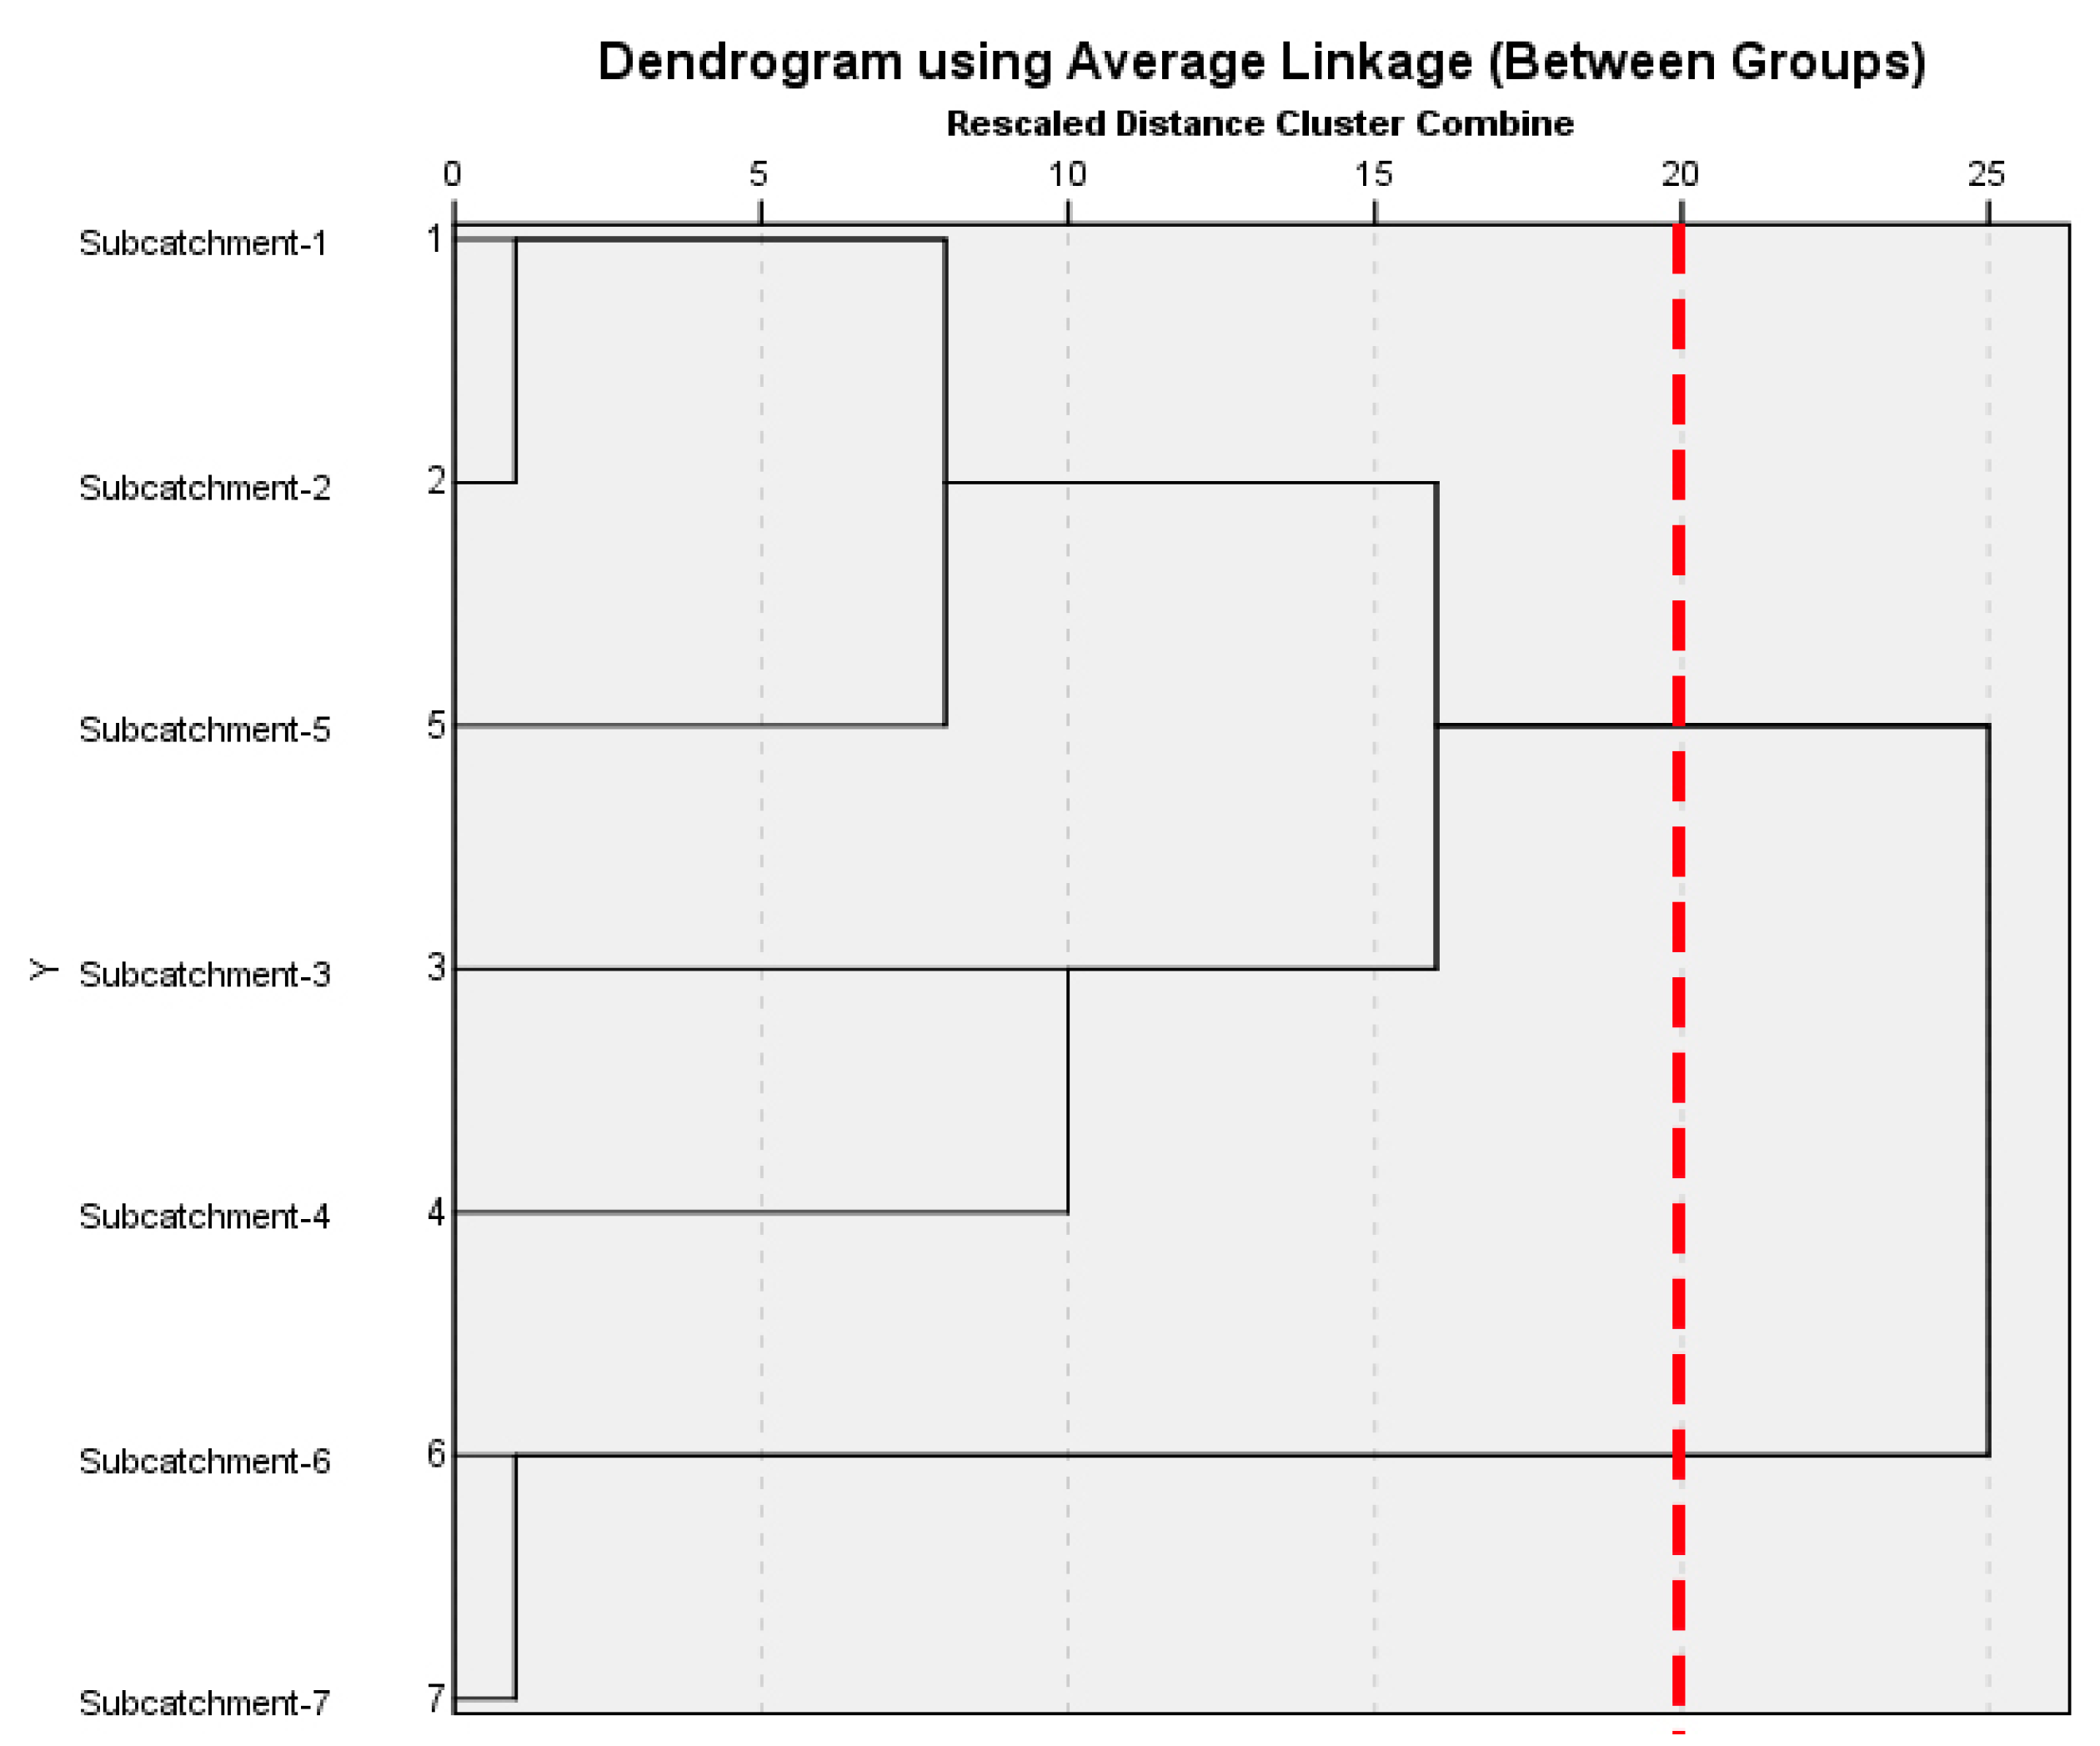
4.1.2. Based on Seven Catchments

As shown in Figure 8, cluster analysis is carried out, according to the water quality index. All sub-catchments can be divided into two groups, catchments -1, -2, -3, -4 and -5 as the first group, catchments 6 and 7 as the second group.
The first group of sub-catchments is located in the upper of the Mitidja Basin, with high vegetation coverage, fast purification, interception and dilution, fewer human activities and good overall environmental conditions. In the regression model, vegetation is an important negative correlation parameter of water quality index. Most studies [18,25,26] believe that forest land plays an important role in reducing soil erosion rate, intercepting solid pollutants and diluting pollutant concentration. To improve river water quality, we must strengthen the protection and management of forest and grassland. Hence, water quality is better in upstream of the basin (catchments -1, -2, -3, -4 and -5) and the quality in some areas can reach category II and III.
The second group (catchments -6 and -7) is located downstream of the Mitidja Basin. According to the results of multivariate correlation analysis of land use and water quality, the sub-catchment with a large proportion of settlement land has the most serious water pollution, which is consistent with the previous research results [18,19,20,21,22], such as the second group (catchments -6 and -7). It is consistent with the actual situation. These areas are industrial bases. Rapid industrialization leads to many organic pollutants discharged into rivers, which seriously affects water quality. At the same time, agricultural land in catchments 6 and 7 accounts for 80% of the entire basin. Previous studies have shown that the total amount of nitrogen and phosphorus in agricultural areas is the highest [21,28], and agricultural land is generally considered as an important non-point source pollution source in the basin, especially in the basin dominated by agriculture. Therefore, there is often a significant positive correlation between the proportion of agricultural land and the water quality indicators, especially the concentration of nutrients [23,29]. In this study, the results of the correlation analysis between land use and water quality also prove that agricultural land is positively correlated with nutrients such as NO3-N.
Therefore, the sub-catchments dominated by both agricultural and settlement land tend to have poor water quality in the Mitidja Basin. High amount BOD5 and COD concentration in the catchment -6 of Elharrach river, where cities such as Baba Ali, Sidi Moussa and Baraki are located, the concentration of NH4-N and PO4-P is also high. The water qualities of these two sub-catchments are generally evaluated as category IV and most of the physical and chemical indexes can reach the level inferior to category IV in the mainstream area, which is the most polluted area in the Mitidja Basin.

4.2. Relationship between Land Urbanization and Water Quality

The whole Mitidja Basin has shown a rapid development trend between 2000 and 2017. With the acceleration of urbanization process, the urban settlement area of Mitidja Basin increased rapidly in this period. The analysis shows that their impact on water quality variables was obvious. Through the analysis of land use change, water quality change and their relationship, the main culprit of water quality deterioration is the transformation mode from agricultural land to the urban land. In watersheds with slow urbanization, such as catchments -1, -2, -3, -4 and -5, the land use did not change much during this period.
Agricultural activities are still important sources of water pollution, so the proportion of agricultural land is positively related to the concentration of water pollutants. On the other hand, in fast urbanizing watersheds, agricultural activities may be a negligible pollution source [18,21,22]. In this case, urban land may produce many non-point source pollution, which is the main pollution source. Therefore, it is found that the change of the settlement proportion is the main factor leading to the deterioration of water quality in Mitidja Basin.
At the same time, another non-negligible cause of water pollution in this study was the reduction of bare soil. The development of bare soil into agricultural land and settlement land has also led to further deterioration of water quality and more loads on the environment.

5. Conclusions

The main research purpose was to examine LUCC evaluation and water quality fluctuation, and the relationship between these two sides between 2000 and 2017 on a sub-catchment scale using GIS, RS and statistic tools. The land use structure in the study area has changed dramatically between 2000 and 2017: There is a notable decrease of agriculture and barren land, whereas marked increment of urban settlement land. Most water quality variables have degraded between 2000 and 2017, and the water quality of upstream areas (catchments -1, -2, -3, -4 and -5) was better than that of downstream areas (catchments -6 and -7); Urban residential land is the most significant independent variable to predict water quality, which is sensitive to six water quality parameters (BOD5, COD, SS, NH4-N, PO4–P, DO and pH), while vegetation is sensitive to NO3-N.
Surface water quality depends on both natural and anthropological factors. In this study, only the dominant land use types of settlement, agriculture and vegetation showed significant correlation with water quality parameters. Among them, land settlement and agricultural land had significant negative effects on water quality; vegetation was the opposite. This was related to the increase in the impervious surface of the settlement land, high-intensity of human activities inside the land and the spatial distribution of settlement land in the Mitidja watershed. Non-point source pollution caused by agricultural production is also an important factor in water pollution [20,21]. Vegetation is very important for water conservation and regulation of water quality. The protection and management of vegetation should be emphasized. At the same time, the conversion and development of bare soil into agricultural land and settlement land is also an important reason for the deterioration of water quality. Relevant departments and staff should pay attention to this issue.
This study shows that the fluctuation of water quality is closely related not only to land use patterns on the watershed scale, but also to the superimposition influence of the urbanization process and the difference of topography and geomorphology. There is certain spatial heterogeneity among sub-catchments. Of course, due to limited datasets of both water quality and LUCC, the uncertainty of image interpretation, scale effect [19,20,24,25,30,31,32] and complexity of water quality impacts [20,28], the relationship between land use and water quality is non-unique. Further studies should introduce more water quality parameters and other possible influence parameters and conduct longer time series data analysis [33,34,35,36,37].

Author Contributions

Conceptualization, D.C. and A.E.; methodology, A.E. and D.C.; data curation, A.E. and H.X.; writing—original draft preparation, A.E. and H.X..; writing—review and editing, D.C., Z.Q. and X.X. All authors have read and agreed to the published version of the manuscript.

Funding

This research was funded by National Natural Science Foundation of China, Grant Number 41971389 and 41501472; Jiangsu Overseas Research & Training Program for University Prominent Young & Middle-aged Teachers, Grant Number 2015 and Strategic Priority Research Program of Chinese Academy of Sciences, Grant Number XDA20010302.

Conflicts of Interest

The authors declare no conflict of interest.

References

  1. Szewrański, S.; Chruściński, J.; Van Hoof, J.; Kazak, J.K.; Świąder, M.; Tokarczyk-Dorociak, K.; Żmuda, R. A location intelligence system for the assessment of pluvial flooding risk and the identification of storm water pollutant sources from roads in suburbanized areas. Water 2018, 10, 746. [Google Scholar] [CrossRef] [Green Version]
  2. Muangthong, S.; Shrestha, S. Assessment of surface water quality using multivariate statistical techniques: Case study of the Nampong River and Songkhram River, Thailand. Environ. Monit. Assess. 2015, 187, 548. [Google Scholar] [CrossRef] [PubMed]
  3. Dutta, S.; Dwivedi, A.; Suresh, K.M. Use of water quality index and multivariate statistical techniques for the assessment of spatial variations in water quality of a small river. Environ. Monit. Assess. 2018, 190. [Google Scholar] [CrossRef] [PubMed]
  4. Liu, R.; Yang, Z.; Ding, X.; Shen, Z.Y.; Wu, X.; Liu, F. Effect of land use/cover change on pollution load of non-point source in upper reach of Yangtze River Basin. Environ. Sci. 2006, 27, 2407–2414. [Google Scholar]
  5. Li, X. A review of international researches on land use/land cover change. Acta Geogr. Sin. 1996, 51, 553–558. [Google Scholar]
  6. Bu, H.M.; Meng, W.; Zhang, Y.; Wan, J. Relationships between land use patterns and water quality in the Taizi River basin, China. Ecol. Indic. 2014, 41, 187–197. [Google Scholar] [CrossRef]
  7. Rodrigues, V.; Estrany, J.; Ranzini, M.; de Cicco, V.; Martín-Benito, J.M.T.; Hedo, J.; Lucas-Borjad, M.E. Effects of land use and seasonality on stream water quality in a small tropical catchment: The headwater of Córrego água Limpa, São Paulo (Brazil). Sci. Total Environ. 2017, 9, 622–623. [Google Scholar] [CrossRef] [Green Version]
  8. Batbayar, G.; Pfeiffer, M.; Kappas, M.; Karthe, D. Development and application of GIS-based assessment of land-use impacts on water quality: A case study of the Kharaa River Basin. Ambio 2019, 10, 1154–1168. [Google Scholar] [CrossRef]
  9. Griffith, J.A. Geographic techniques and recent applications of remote sensing to landscape-water quality studies. Water Air Soil Pollut. 2002, 138, 181–197. [Google Scholar] [CrossRef]
  10. Hu, J.; Liu, M.; Zhou, W.; Xu, C.; Yang, X.-J.; Zhang, S.-W.; Wang, L. Correlations between water quality and land use pattern in Taihu Lake basin. Chin. J. Ecol. 2011, 30, 1190–1197. [Google Scholar]
  11. Tu, J. Spatial and temporal relationships between water quality and land use in northern Georgia, USA. J. Integr. Environ. Sci. 2011, 8, 151–170. [Google Scholar] [CrossRef]
  12. Li, Y.; Liu, K.; Li, L.; Xu, Z.X. Relationship of land use/cover on water quality in the Liao River basin, China. Procedia Environ. Sci. 2012, 13, 1484–1493. [Google Scholar] [CrossRef] [Green Version]
  13. Temesgen, H.; Wu, W.; Legesse, A.; Yirsaw, E.; Bekele, B. Landscape-based upstream-downstream prevalence of land-use/cover change drivers in southeastern rift escarpment of Ethiopia. Environ. Monit. Assess. 2018, 190, 166. [Google Scholar] [CrossRef] [PubMed]
  14. Butt, A.; Shabbir, R.; Ahmad, S.S.; Aziz, N. Land use change mapping and analysis using remote sensing and GIS: A case study of simly watershed, Islamabad, Pakistan. Egypt. J. Remote Sens. Space Sci. 2015, 18, 251–259. [Google Scholar]
  15. Xia, L.; Liu, R.; Zao, Y. Correlation analysis of landscape pattern and water quality in Baiyangdian Watershed. Procedia Environ. Sci. 2012, 13, 2188–2196. [Google Scholar] [CrossRef] [Green Version]
  16. Jiabo, C.; Jun, L.; Miguel, F. Effects of land use, topography and socio-economic factors on river water quality in a mountainous watershed with intensive agricultural production in east China. PLoS ONE 2014, 9, e102714. [Google Scholar]
  17. Ouyang, Y. Evaluation of river water quality monitoring stations by principal component analysis. Water Res. 2005, 39, 2621–2635. [Google Scholar] [CrossRef]
  18. Chen, X.; Zhou, W.; Pickett, S.T.A.; Li, W.; Han, L. Spatial - temporal variations of water quality and its relationship to land use and land cover in Beijing, China. Int. J. Environ. Res. Public Health 2016, 13, 449. [Google Scholar]
  19. Sliva, L.; Williams, D.D. Buffer zone versus whole catchment approaches to studying land use impact on river water quality. Water Res. 2001, 35, 3462–3472. [Google Scholar] [CrossRef]
  20. Liu, Z.; Li, Y.; Li, Z. Surface water quality and land use in Wisconsin, USA–a GIS approach. J. Integr. Environ. Sci. 2009, 6, 69–89. [Google Scholar] [CrossRef]
  21. Schoonover, J.E.; Lockaby, B.G.; Pan, S. Changes in chemical and physical properties of stream water across an urban-rural gradient in Western Georgia. Urban Ecosyst. 2005, 8, 107–124. [Google Scholar] [CrossRef]
  22. Conway, T.M. Impervious surface as an indicator of pH and specific conductance in the urbanizing coastal zone of New Jersey, USA. J. Environ. Manag. 2007, 85, 308–316. [Google Scholar] [CrossRef]
  23. Eugene, T.R.; Rabalais, N.N. Linking landscape and water quality in the Mississippi river basin for 200 years. BioScience 2003, 53, 563–572. [Google Scholar]
  24. Ding, J.; Jiang, Y.; Liu, Q.; Hou, Z.; Liao, J.; Fu, L.; Peng, Q. Influences of the land use pattern on water quality in low-order streams of the Dongjiang River basin, China: A multi-scale analysis. Sci. Total Environ. 2016, 551, 205–216. [Google Scholar] [CrossRef] [PubMed]
  25. Little, J.L.; Saffran, K.A.; Fent, L. Land use and water quality relationships in the lower little bow river watershed, Alberta, Canada. Water Qual. Res. J. Can. 2003, 38, 563–584. [Google Scholar] [CrossRef]
  26. Ye, L.; Cai, Q.; Liu, R.; Cao, M. The influence of topography and land use on water quality of Xiangxi River in Three Gorges reservoir region. Environ. Geol. 2009, 58, 937–942. [Google Scholar] [CrossRef]
  27. Mehaffey, M.H.; Nash, M.S.; Wade, T.G.; Ebert, D.W.; Jones, K.B.; Rager, A. Linking land cover and water quality in New York city’s water supply watersheds. Environ. Monit. Assess. 2005, 107, 29–44. [Google Scholar] [CrossRef]
  28. Nepomuscene, J.N.; Jewitt, G.; Graham, M. Effects of land use and land cover changes on water quality in the uMngeni river catchment, South Africa. Phys. Chem. Earth 2018, 105, 247–264. [Google Scholar]
  29. Yimer, H.D.; Mengistou, S. Water quality parameters macroinvertebrates index of biotic integrity of the Jimma wetlands, Southwestern Ethiopia. J. Wetl. Ecol. 2009, 3, 77–93. [Google Scholar] [CrossRef]
  30. Pratt, B.; Chang, H. Effects of land cover, topography, and built structure on seasonal water quality at multiple spatial scales. J. Hazard. Mater. 2012, 209–210, 48–58. [Google Scholar] [CrossRef]
  31. Li, S.; Gu, S.; Tan, X.; Zhang, Q. Water quality in the upper Han River basin, China: The impacts of land use/land cover in riparian buffer zone. J. Hazard. Mater. 2009, 165, 317–324. [Google Scholar] [CrossRef]
  32. Jarvie, H.P.; Oguchi, T.; Neal, C. Exploring the linkages between river water chemistry and watershed characteristics using GIS-based catchment and locality analyses. Reg. Environ. Chang. 2002, 3, 36–50. [Google Scholar] [CrossRef]
  33. Qiao, Z.; Xu, X.; Zhao, M.; Wang, F.; Liu, L. The application of a binary division procedure to the classification of forest subcategories using MODIS time-series data during 2000–2010 in China. Int. J. Remote Sens. 2016, 37, 2433–2450. [Google Scholar] [CrossRef]
  34. Guo, A.; Yang, J.; Xiao, X.; Jin, C.; Xia, J.; Li, X. Influences of urban spatial form on urban heat island effects at the community level in China. Sustain. Cities Soc. 2020, 53, 101972. [Google Scholar] [CrossRef]
  35. Yang, J.; Wang, Y.; Xiao, X.; Jin, C.; Xia, J.; Li, X. Spatial differentiation of urban wind and thermal environment in different grid sizes. Urban Clim. 2019, 28, 1–13. [Google Scholar] [CrossRef]
  36. Yang, J.; Jin, S.; Xiao, X.; Jin, C.; Xia, J.; Li, X.; Wang, S. Local climate zone ventilation and urban land surface temperatures: Towards a performance-based and wind-sensitive planning proposal in megacities. Sustain. Cities Soc. 2019, 47, 101487. [Google Scholar] [CrossRef]
  37. Yang, J.; Sun, J.; Ge, Q.; Li, X. Assessing the impacts of urbanization-associated green space on urban land surface temperature: A case study of Dalian, China. Urban For. Urban Green. 2017, 22, 1–10. [Google Scholar] [CrossRef]
Figure 1. Map of the study area.
Sustainability 12 03510 g001
Figure 2. Location of water quality monitoring stations.
Sustainability 12 03510 g002
Figure 3. Land use classified maps of Mitidja Basin for (a) 2000, (b) 2010 and (c) 2017.
Sustainability 12 03510 g003
Figure 4. Flowchart of data analysis methods and techniques.
Sustainability 12 03510 g004
Figure 5. The composition of land use/cover in the sub-catchments. (a) 2000 (b) 2010 (c) 2017.
Sustainability 12 03510 g005aSustainability 12 03510 g005b
Figure 6. Values (mean ± S.E.) of physicochemical parameters in the Mitidja River basin, Algeria. (a) pH (b) DO (c) BOD5 (d) COD (e) NH4-N (f) NO2-N (g) NO3-N (h) PO4-P (i) CE (j) SS.
Sustainability 12 03510 g006aSustainability 12 03510 g006b
Figure 7. Standardized residuals analysis. (a) BOD5 (b) COD (c) DO (d) NH4-N (e) NO3-N (f) PO4-P (g) SS (h) pH.
Sustainability 12 03510 g007aSustainability 12 03510 g007b
Figure 8. Cluster analysis for all data in 2017 different sub-catchments of the Mitidja watershed.
Sustainability 12 03510 g008
Table 1. Satellite data specifications.
No.SceneSensorPlatformPixel SizeAcquisition Date
1P196 R35TMLandsat 530 m19/08/2000
2P196 R34TMLandsat 530 m19/08/2000
3P196 R34ETM+Landsat 730 m07/08/2010
4P196 R35ETM+Landsat 730 m07/08/2010
5P196 R34OLILandsat 830 m09/07/2017
6P196 R35OLILandsat 830 m07/06/2017
Table 2. Land use/land cover delineated based on supervised classification.
No.Class NameDescription
1AgricultureCrop fields and fallow lands
2SettlementsResidential, commercial, industrial, transportation, roads, mixed urban
3Bare soil/rocksLand areas of exposed soil and barren area influenced by human influence
4VegetationMixed forest lands
5Water bodiesRiver, open water, lakes, ponds and reservoirs
Table 3. Land use types for the Watershed, 2000–2017.
YearCatchmentSettlementAgricultureVegetationWaterBare Soil
Area/haPer/%Area/haPer/%Area/haPer/%Area/haPer/%Area/haPer/%
2000Catchment -12891.86748.343.16426.741319.121890.512.1
Catchment -2569.13.82014.713.42283.315.1159.21.110,05066.7
Catchment -35014.711.7568713.320,833.648.64.1011,30526.4
Catchment -45498.313.83111.27.827,850.869.9003383.68.5
Catchment -5778.18.43629.2394367.8472412.6280.73
Catchment -610,70520.321,15840.116,355.4310044918.5
Catchment -715,84510.964,28244.231,008.421.30.9034,21423.5
2010Catchment -1657.84.25239.433.46965.144.4257.71.62553.616.3
Catchment -2697.84.62202.114.61939.512.9293.21.99943.166
Catchment -33059.77.110,11423.619,531.445.60.8010,13923.7
Catchment -42257.55.78879.122.324,84962.40.103858.19.7
Catchment -51246.913.42181.723.54725.550.8413.14.4729.57.8
Catchment -613,61525.820,13838.215,643.929.7003312.86.3
Catchment -713,5199.368,02050.320,231.914.93.8033,57724.8
2017Catchment -12590.713.14830.234.36958.944.4329.82.19646.2
Catchment -2797.95.32079.813.82124.914.1385.82.69687.264.3
Catchment -35948.513.96296.714.720,899.148.811.709688.222.6
Catchment -43204.9859581526,908.767.50.803771.59.5
Catchment -51717.410.42155.931.34623.449.7413.64.4386.44.2
Catchment -615,55029.920,04838.415,66029.73.701048.12
Catchment -732,70322.565,32644.925,650.717.6196.80.121,47514.8
Table 4. Land use/land cover change, 2000–2017 (ha).
Catchment2000–20102010–2017
SettlementAgricultureVegetationWaterBare SoilSettlementAgricultureVegetationWaterBare Soil
1368.8−1508.9538.4−61.4663.11932.9−409.2532.272.1−1589.6
2128.7187.4−343.8134−106.4100.1−122.3−158.492.6−255.9
3−19554426.6−1302.2−3.3−1166.12888.8−3816.965.510.9−450.4
4−3240.85767.9−3001.80.1474.5947.4−2921.1−942.10.7−86.6
5468.8−1447.5357.7172.1448.8470.5−25.8255.60.5−343.1
62909.6−1019.8−711.50−1178.21934.8−90−695.43.7−2264.7
7−23263737.6−10,776.52.9−637.919,184−2693.9−5357.7193−12,102
Table 5. Pearson correlation coefficients between Land use cover change and water quality parameters in the Mitidja watershed, 2017.
WQP (mg/L)Settlement (%)Agriculture (%)Vegetation (%)Water (%)Bare Soil (%)
pH1−0.893 *−0.780 **0.6380.4070.220
CE2−0.0540.2390.3510.031−0.148
DO−0.896 **−0.5410.5880.5040.116
NH4-N0.905 **0.563−0.363−0.431−0.337
NO2-N0.5950.745−0.591−0.288−0.132
NO3-N0.1780.320−0.933 **0.0260.562
PO4-P0.885 **0.765 *−0.547−0.494−0.282
BOD50.956 **0.654−0.429−0.519−0.347
COD0.904 **0.521−0.359−0.452−0.313
SS0.927 **0.522−0.435−0.613−0.245
*. Significance at 0.05 probability level. (2-tailed). **. Significance at 0.01 probability level. (2-tailed). 1 Dimensionless, the same below. 2 Unit: µs/cm, the same below.
Table 6. MLR model between land use and water quality in the Mitidja watershed, Algeria, 2017.
Dependent VariablesIndependent VariablesRegressionR2Adjusted R2p
DOSL9.458 − 0.287 SL0.8020.7620.006
NH4-NSL−6.272 + 0.634 SL0.8180.7820.005
NO3-NVeg8.813 − 0.148 Veg0.8700.8440.002
PO4-PSL−2.123 + 0.252 SL0.7830.7400.008
BOD5SL−17.513 + 2.184 SL0.9150.8980.001
CODSL−83.003 + 10.231 SL0.8180.7810.005
SSSL1.054 + 4.158 SL0.8590.8310.003
pHSL8.116 − 0.032 SL + 0.007 Veg0.9310.8960.005
Veg0.050
Table 7. Multiple regression results for pH and the results of collinearity tests.
VariableUnstandardized CoefficientsTPCollinearity Statistics
BStandard ErrorToleranceVIF
Constant8.1160.15851.2660.000--
SL−0.0320.006−5.4900.0050.8921.122
Veg0.0070.0032.7650.0500.8921.122
Table 8. Pearson correlation coefficients between lands use change and the water quality parameters (WQP) in the Mitidja watershed, Algeria, 2000–2017.
WQP (mg/L)Settlement (%)Agriculture (%)Vegetation (%)Water (%)Bare Soil (%)
pH−0.750.2860.25−0.3930.714
DO−0.464−0.5360.5710.2860.643
NH4-N0.857 *−0.179−0.143−0.036−0.929 **
NO2-N−0.071−0.6070.6790.750.107
NO3-N0.0710.464−0.6430.429−0.429
PO4-P0.991 **−0.274−0.1260.18−0.883 **
BOD50.857 *−0.25−0.1430.071−0.75
COD0.571−0.071−0.1430−0.075
CE−0.321−0.1430.429−0.1430.036
SS0.3940.236−0.256−0.256−0.749

