Article

A Combination of DEMATEL and BWM-Based ANP Methods for Exploring the Green Building Rating System in Taiwan

1
Graduate Institute of Industrial and Business Management, National Taipei University of Technology, 1, Section 3, Zhongxiao E. Road, Taipei 10608, Taiwan
2
Department of Industrial Engineering and Management, National Taipei University of Technology, 1, Section 3, Zhongxiao E. Road, Taipei 10608, Taiwan
*
Author to whom correspondence should be addressed.
Sustainability 2020, 12(8), 3216; https://doi.org/10.3390/su12083216
Submission received: 17 March 2020 / Revised: 12 April 2020 / Accepted: 13 April 2020 / Published: 16 April 2020
(This article belongs to the Special Issue Sustainability and Risks in Construction Management)

Abstract

:
Green buildings are a crucial environmentally friendly component for sustainable human habitation and for the preservation of a healthy ecosystem. This study proposes a novel hybrid model to explore the influential relationship of various indicators and their importance for a green building evaluation system. First, a green building index system is established based on a review of recent literature on green building evaluation systems. Then, the decision making trial and evaluation laboratory (DEMATEL) technique is utilized to determine the influential relationship among the criteria. Finally, a novel best worst method (BWM)-based analytic network process (ANP) model is applied to determine the influential weight of the criteria. The result indicated that the top five ranked criteria are all classified within the two dimensions of waste reduction and energy saving. An empirical case study of an example in Taiwan is carried out to demonstrate the effectiveness of the proposed model. Management implications are also provided.

1. Introduction

The recent rapid growth in environmental awareness worldwide is propelling architects and engineers to develop novel ideas and technologies that would facilitate green building. The process of green building aims at finding a balance between man-made architecture and preservation of the natural environment. However, the evaluation systems for green buildings are complex and vary from country to country depending upon different policies, local culture, and geographic location. Thus, understanding the influential relationships and importance of indicators within these evaluation systems will help in the implementation of good practices for developing green buildings. The construction materials and building processes can have tremendous environmental impact while developing green buildings, which cannot be ignored. These problems, beginning with the choice of materials, from construction throughout the lifetime of the building to demolition and disposal, can also influence environmental systems [1,2]. For example, in Taiwan, the lifetime of most non-wooden structures is 23 to 29 years if they are constructed with steel, with reinforced concrete structures lasting 32 to 45 years. The limited lifetime of buildings constructed using these materials, from initial construction to demolition and disposal of the remains, has had a big effect on the local environment [3]. Since the 1990s, a few countries such as the United States (US) and the United Kingdom (UK) have sought to become more aware of and codify those factors critical to protecting the environment and ensuring sustainability. Others have advocated the use of green materials to build green buildings in China [4]. Taiwan is striving to play a role as a pioneer in the region, not only by developing standards for the use of environmentally friendly materials, reducing waste and saving energy but also by promoting government policy to encourage industries to adopt green construction practices on the island [5].
One of the issues that lead to confusion as to what needs to be done is the variation in evaluation system methods between different countries and even within systems. For example, the Building Research Establishment Environmental Assessment Method (BREEAM), the first such rating system developed in the world, may be applied during the preliminary planning and design phases of the building, during its construction, operation and maintenance, refurbishment, or even in the final demolition phase of the building [6]. Moreover, BREEAM is a complex system and requirements can vary according to the type of building, that is, depending on whether it is for residential, commercial, healthcare, or industrial purposes or whether it is applicable to entire communities. The most widely applied green building evaluation system worldwide is the Leadership in Energy and Environmental Design (LEED) system which originated from the United States. Buildings and management use are classified in different ways; for instance, for cities and communities, homes, neighborhood development, building operations and maintenance, building design and construction, and interior design and construction [7]. The point is that there are different assessment systems for green buildings, which vary with national background and culture. Understanding the relationship between and the importance of the indicators used in these evaluation systems is necessary to help practitioners and governments implement measures encouraging construction of green buildings. However, there has only been a limited amount of research exploring the correlation and weight of these evaluation indicators. This study aims to develop a novel model to explore the relationship and importance of green building’s indicators.
The fuzzy analytic hierarchical process and fuzzy transformation matrix have been used in previous studies to assess the contributive weight or importance of each green building policy measure needed to reach the goals [8] and how to aggressively remove roadblocks and stimulate acceptance by dissimilar types of adopters for public, commercialized, and private buildings [9]. Shao et al. [10] applied a hybrid model to generate an influential network relationship map (INRM), mapping the relations among assessment systems. They first derived the criterion weights by using the decision-making trial and evaluation laboratory-based analytical network process (DANP) method. The establishment of a green building assessment system is a multi-criteria decision making (MCDM) problem, so effective evaluation has to be performed under conflicting conditions [2,5,8,9,10].
MCDM methods have been widely used for the appraisal and choice of assorted green building evaluation systems, because they have demonstrated excellent evaluation performance, especially for complex systems [11,12]. They can approximately be divided into three segments: determination of the evaluation system, calculation of the weights, and aggregation of performance of alternatives. Interpretive structural modelling, a well-established methodology, was first suggested by Warfield in 1973 to assist with the identification and organization of interrelationships between elements related to a specific problem or issue that would heighten the understanding of its complexity [13]. DEMATEL is designed to convert the cause-and-effect relationships between elements in a complex system into structural models [14]. Both methods can identify the cause-and-effect relationships among evaluation systems [13]. The most commonly used methods adopted for determining criteria weights are the analytic hierarchy process (AHP) [15], ANP [16], and BWM [17]. ANP is a mathematical tool that can methodically identify and arrange all kinds of criteria dependency network. It is essentially an expansion of the AHP based on the concept of the Markov Chain. It has a nonlinear dynamic structure and is a powerful method that overcomes the issue of interdependency and response encountered between the criteria and alternatives in the actual world. It has been successfully applied to many decision-making issues under realistic circumstances [18,19,20,21].
However, there are three shortcomings to the original ANP analysis: the structure of the system is based on assumptions, it requires time-consuming pairwise comparisons, and it is difficult to obtain coherent results when the number of criteria are high. This study proposes a hybrid model that can remedy these three shortcomings. First, DEMATEL is applied to construct a complex green building system. The original ANP pairwise comparisons are replaced by the BWM-based ANP method, to obtain more consistent results with fewer comparisons. BWM, originally proposed by Rezaei [17], has been successfully applied in many fields [22,23]. Not only can BWM be used to derive the weights of the criteria, but it also can be combined with other MCDM methods. Its usefulness and effectiveness have been verified in many studies. The novel MCDM model proposed in this study integrates the DEMATEL and a BWM-based ANP methods to determine the complex relationships in a green building evaluating system and the influential weights of the indicators. The steps in the novel method are summarized below:
(i)
The DEMATEL technique is used to map the influential relationships among green building indicators.
(ii)
A novel hybrid method, the BWM-based ANP model, is applied to explore the importance of these green building indicators.
(iii)
An amended Taiwan green building assessment system is used to verify the effectiveness of the hybrid MCDM model.
(iv)
Some strategies for implementing the green buildings are provided for practitioners and government.
The rest of the paper is organized as follows. Section 2 examines the pertinent literature on green building assessment criteria; assessment criteria are included not only for Taiwan but for other major countries/regions. Section 3 outlines the proposed hybrid model and the basic concepts of this approach. The case study is discussed in Section 4 to prove feasibleness and practicability of the proposed model. Finally, in Section 5, the conclusions are summarized and directions for future research suggested.

2. Literature on Green Building Rating Systems

With increasing environmental awareness, the general population is beginning to understand the importance of sustainable development although increased urbanization has also increased the demand for building construction as well as safe and healthy indoor environments. These sometimes-conflicting needs obviously affect the design, conception, and methods of construction of green buildings [1,2,3,4,5]. In response to this trend, BREEAM, was launched by the British Building Research Establishment in 1990, opening a new chapter and approach as a sustainable green building assessment tool. BREEAM encourages people to consider how low-carbon and low-impact designs can minimize a building’s energy demand, even before considering the application of low-carbon technologies and energy efficiency. After nearly 30 years of development, the BREEAM guidelines ensuring sustainability are quite wide in scope, complete, and clear. BREEAM has established an “in-use” evaluation standard for assessment of the various stages of a building’s life cycle, including the construction of new buildings, new infrastructure, community projects, and the renovation of existing buildings. Each stage of the usage period can last for many decades. This assessment, rating, and certification method later influenced the United States and Canada to develop the LEED guidelines in 1996 and the Canadian Green Building Tool assessment methods in 1998 [24]. LEED is a market-oriented assessment system for high-performance green buildings, initiated by the US Green Building Council in 1996. It aims at encouraging the development and implementation of sustainable buildings as well as to providing cost-saving, healthier, and more efficient industry guidelines. In terms of the number of certified green buildings, LEED is undoubtedly the most widely adopted standard for green building certification worldwide [25,26,27].

2.1. Research on Green Building Assessment Systems

This sub-section outlines the scholarly study of green building related fields, directions of research in the past few years and ways in which they have been studied. The MCDM methods, AHP, BWM, DEMATEL, ANP, DANP, Technique for Order of Preference by Similarity to Ideal Solution (TOPSIS), and BWM, are widely adopted to explore green building material (GBM) assessment, green building management, and sustainable material selection for building construction [10,28,29]. The 15 articles with most relevant research field of green building indicators assessment are selected. In particular, these research papers were published in the past three years. A general summary of the literature review appears in Table 1.
We found that the above research conducted in recent years has focused on: (1) discussion of LEED and BREEAM guidelines as the main axis for development and comparison with other assessment systems; (2) empirical case studies based on specific indicators, for example: indoor environment, materials use, site ecology, innovation for improvement, energy and water efficiency, pollution solutions, waste recycling, etc.; (3) suggestions for future research and goals for improvement. The above studies have made many contributions to the determination of the criteria for evaluation in the green building rating system. However, only a few articles have explored the influential relationship among the criteria. Our novel model not only can understand the interdependency of the dimensions within the green building evaluating system but also can obtain the importance of the criteria or indicators.

2.2. The Proposed Green Building Rating Framework

Referring to several green building assessment systems and the literature reviewed [7,10,25,27,30,32,33,35,36], we discussed with experts how to build an amended green building rating system that takes into consideration Taiwan’s special environment. Specifically, nine experts were invited to answer the assessment survey, including two architects with 20 years’ experience in this industry, a building structure designer, also with 21 years’ experience, two doctororal research fellows in the field of green building research, three senior managers who have been in charge of green building management or operations for more than 15 years, and an official who is in charge of forest conservation and ecology serving in the central government of Taiwan. The proposed green building rating framework classifies twelve evaluation indicators into four dimensions (i.e., ecology, energy saving, waste reduction, and health) (see Table 2).
This study aims to find the importance of these indicators as well as identify the interdependence between the systems. The results can help to explore how to improve and build an effective green building assessment system and maximize the effectiveness of green building policies in terms of promotion, application, and achieving the goal of sustainable environmental protection.

3. Proposed Combination of DEMATEL and ANP-BWM Methods

This study proposes a novel hybrid model combining DEMATEL and BWM-based ANP to identify the interdependency relationship of every indicator. This method differs from those used in past studies in several ways, for example it greatly reduces the number of questionnaire items needed from which to draw a systematic causality diagram for decision makers. An illustration of the proposed approach and the calculation steps is displayed in Figure 1. In brief, the evaluation framework consists of four primary phases: (1) identify the most influential criteria in Taiwan Green building rating system for MCDM; (2) categorize the criteria into dimensions of similar characteristics; (3) use DEMATEL method to illustrate the interactions or interdependence amongst the criteria; (4) calculate the influential weights of the criteria/dimensions by BWM based ANP method.
Section 3.1 and Section 3.2 explain the operation procedures of DEMATEL and BWM based ANP methods.

3.1. DEMATEL Technique

Back in the period 1972 to 1976, the Banelle Memorial Institute of Geneva developed a method for the Science and Human Affairs Program to solve complex tangled problems, which so called DEMATEL. It can improve the understanding of special problems, groups of complex tangled problems, and provide a discernible solution through a hierarchical structure [14,37]. This approach can be applied in many areas, such as green building evaluation model, waste recycling barrier, and Sponge City (SC) to achieve sustainable urbanization [38,39,40]. The DEMATEL technique can be summarized in the following steps.
Step 1: Assign scores to each factor.
Define the dimensions of the evaluation scale to represent the extent of the impact. The semantic values and semantic operational definitions are divided into 0, 1, 2, 3, and 4, representing the different degrees of influence from “no impact (0),” “Low impact (1),” “Medium degree impact (2),” “High impact (3),” to “Very high impact (4).”
Step 2: Construct direct relation matrix.
This questionnaire (matrix) is filled in by experts (evaluators), who are asked to judge the degree of influence of two facets. The direct relation matrix is generated based on the values as defined in step 1. The results from the various experts are then integrated to generate a direct relationship matrix A. The mean score among the respondents is then calculated to arrive at element aij to form the initial average matrix A= [ a i j ] n × n with the diagonal matrix value of the part set to 0.
Step 3: Normalize the direct influence matrix.
From the direct relation matrix A obtained in step 2, a normalized direct-relation matrix D = [ d i j ] n × n is calculated by
D = z · A
z = min { 1 max i j = 1 n a i j , 1 max j i = 1 n a i j } ,   i ,   j = 1 ,   2 , ,   n .
Step 4: Calculate the total influence matrix T.
The total influence matrix T = [ t i j ] n × n can be produced by summing up the direct outcomes and all of the indirect outcomes using Equation (3).
T = D + D 2 + + D h = D ( I D ) 1 ,
where I denotes the identity matrix, and when lim h D h = [ 0 ] n × n .
Step 5: Calculate the sums of the rows and columns of matrix T.
The sums of the columns and rows of the total-influence matrix T are denoted by column vectors R and S, respectively:
R = [ r i ] n × 1 = [ j = 1 n t i j ] n × 1 ,   i ,   j = 1 ,   2 , ,   n
S = [ s j ] 1 × n = [ i = 1 n t i j ] 1 × n ,   ,   j = 1 ,   2 , ,   n ,
where [ s j ] 1 × n T = [ s i ] n × 1 . If ri denotes the sum of the ith row of matrix T, then ri denotes the sum of the direct and indirect effects that factor i has on all of the other factors. If si denotes the column sum from matrix T, then si denotes the sum of the direct and indirect effects that factor i has received from all of the other factors. Moreover, (ri + si) supplies an index of the strength of the effects that are given and received, which means that (ri + si) indicates the degree of the total effect that factor i has in this system. Therefore, if (risi) is positive, then factor i has a net influence on the other factors; on the other hand, if (risi) is negative, then factor i is, in general, influenced by the other factors.

3.2. BWM Based ANP Method

The ANP is one of the MCDM methods developed to improve upon the shortcomings of the AHP. The dependence and feedback between the problem criteria are considered for construction of a model of the decision problem with a network type instead of a hierarchical type of structure. The unweighted supermatrix is composed of clusters and elements. The related importance weights of each element as obtained by pairwise comparisons are input into the unweighted supermatrix. The weighted supermatrix is obtained by multiplying every element in one cluster of the unweighted supermatrix by the corresponding cluster weight matrix. After being added up, the sum of each column will be equal to 1 [16]. This method can be applied in many areas, such as sustainable supplier selection, green roof type selection, and environmental Strengths, Weaknesses, Opportunities, and Threats (SWOT) analysis. [41,42,43].
ANP can handle the problem of processing interdependencies between criteria and alternative solutions in complex systems, but it cannot model a hierarchical structure, because the higher level criteria are considered to be dependent on the lower level criteria. However, when faced with a large number of criteria or alternative solutions, the questions to be answered in the ANP’s questionnaire become cumbersome and time consuming. In order to effectively reduce the number of pairwise comparisons, we propose using the BWM-based ANP method.
BWM is a MCDM method [17] that used to evaluate the weights or importance of a set of decision criteria. The method chooses two criteria: the best and the worst criterion. The best criteria is the one with the most important role in decision-making, while the worst criteria has the opposite effect. This approach can be applied in many areas, e.g., various battery technologies in the residential grid storage market, sustainable material selection for building construction, and exploring the criteria for evaluating the green performance of airports [29,44,45]. The BWM is used in this study instead of AHP to determine the local weights for each criterion. The ANP-BMW calculation procedure is discussed in detail below.
Step 1: Determine the influential correlation among dimensions based on DEMATEL results.
The DEMATEL analysis helps to determine the influential correlation among dimensions. Generally speaking, in the total relationship impact matrix T, if tij is greater than the average value of the matrix T, it indicates that dimension i (column) corresponding to tij affects dimension j (row); then the criteria included in tij all need to go through the process of pairwise comparisons. In this work, the BWM method is used for pairwise comparison of the internal criteria in the unweighted supermatrix of ANP. The BWM, first proposed by Rezaei [17] requires fewer pairwise comparisons to achieve more consistent results than the AHP.
Step 2: Obtain the input data for ANP.
The BWM has been widely used for evaluation and selection problems in various industries. The steps are summarized below [17].
Step 2.1: Determine the decision criterion set
Decision makers or experts develop q evaluation criteria that are consistent with the decision-making problem, { c 1 , c 2 , , c n } .
Step 2.2: Screen out the best and worst criteria
From the q criteria developed by decision makers or experts in Step 1, the best (i.e., most satisfactory, important, or preferred) and worst (i.e., least satisfactory, important, or preferred) criteria are selected. This is a key step affecting the analysis and the result.
Step 2.3: Use the best criterion as a baseline for pairwise comparisons with other criteria to create the BO vector (Best-to-Others).
During the comparison process, the decision maker assigns a value from 1 to 9 for the “best and the rest of criteria”, with 1 meaning that the criterion has the same level of importance as the best criteria and 9 meaning that the best criteria is much more important than this criterion. The BO vector created based on the best and remaining criteria can be expressed as follows:
A b = ( a b 1 , a b 2 , , a b n ) ,
where a b j represents the importance of the best criterion b, better than criterion j. The value of the pairwise comparison of the best criterion by itself must be 1, that is a b b = 1 .
Step 2.4: Use the worse criterion as a baseline to run pairwise comparisons with other criteria to create the OW vector (Others-to-Worst).
The decision maker assigns a value from 1 to 9 for the rest of the criteria in comparison to the worse one. The remaining criteria and worse criteria are used to create the OW vector, which can be expressed as follows:
A w = ( a 1 w , a 2 w , , a n w ) T ,
where a j w represents the importance of the remaining criterion j better than the worse criterion w. The value of the pairwise comparison of the worse criterion by itself must be 1, that is, a w w = 1 .
Step 2.5: Calculate the optimal weight for each criterion: ( w 1 * , w 2 * , , w n * ) .
The optimal criteria weights are calculated by the Linear Programming (LP) model, using the BO and OW vectors as input (BO is the weight ratio obtained by comparison of the best criteria to the remaining criteria; OW is the ratio of the weight obtained by comparison of the remaining criteria with the worse criteria). Comparison is made between the absolute deviation from the expert defined values (that is, | w b w j a b j | , | w j w w a j w | ) and maximization of the absolute deviation. Finally, the minimum of the two is chosen as the best objective function value. To minimize the largest objective function value, it can be converted into a linear objective function for calculation. The converted minimum objective function can be represented by the following model:
min   ξ s . t . | w b w j a b j | ξ ; | w j w w a j w | ξ ; j w j = 1 ; w j 0 ,   for   all   j .
In the solution set for Equation (6), if the total number of criteria is n, then the model is limited to 4n-5 constraints for pairwise comparison, with the last constraint being the total criterion weight which is equal to 1. Therefore, giving a proper value ξ makes for a feasible area in a non-empty collection. The intersection of each constraint in the linear programming model can be used to find the optimal weights ( w 1 * , w 2 * , , w n * ) of the criterion in the feasible solution area and minimized target value ξ * .
Step 3: Form a supermatrix by entering the vectors obtained from the ANP-BWM evaluation into the appropriate column n.
A supermatrix is defined as a partitioned matrix, in which every submatrix consists of relationships between two clusters. Local priority vectors are presented in the corresponding columns in the supermatrix. This supermatrix is first made stochastic (i.e., normalized supermatrix N, where each column sums to 1). Following that, the normalized supermatrix is raised to its limiting powers until the weights converge to stable values, thus forming the limit supermatrix W. Each row represents the
lim p ( W ) p

4. Case Illustration and Management Implications

After reviewing the literature and discussing with experts, this study proposed a green building rating system that takes into account the environment in Taiwan. To avoid different expert groups leading to different results, this study requests the confidence level to be higher than 95%. The experts’ opinions would be checked until their consensus is reached. First, the DEMATEL technique is used to map the influential relationships among four dimensions; then, the BWM based ANP model is applied to explore the importance of these green building indicators. Data for Taiwan are selected to verify the feasibility of the evaluation criteria and the proposed model. Climatic conditions in Taiwan show that summer and autumn are humid and hot and subject to the threat of typhoons and earthquakes. Heavy use of air conditioning to overcome the high temperature and humidity seems to be the only way for inhabitants to improve their living conditions. Buildings also need to be able to withstand the impact of strong winds and earthquakes [46]. This study argues that these geographical circumstances and climatic conditions need to be considered in the formation of the Taiwan Green Building Evaluation System. This evaluation system (Table 2), which is specially designed for Taiwan and to meet the needs of earthquake-proofing can be applied in other areas, such as tropical or subtropical regions with climatic conditions similar to those in Taiwan.

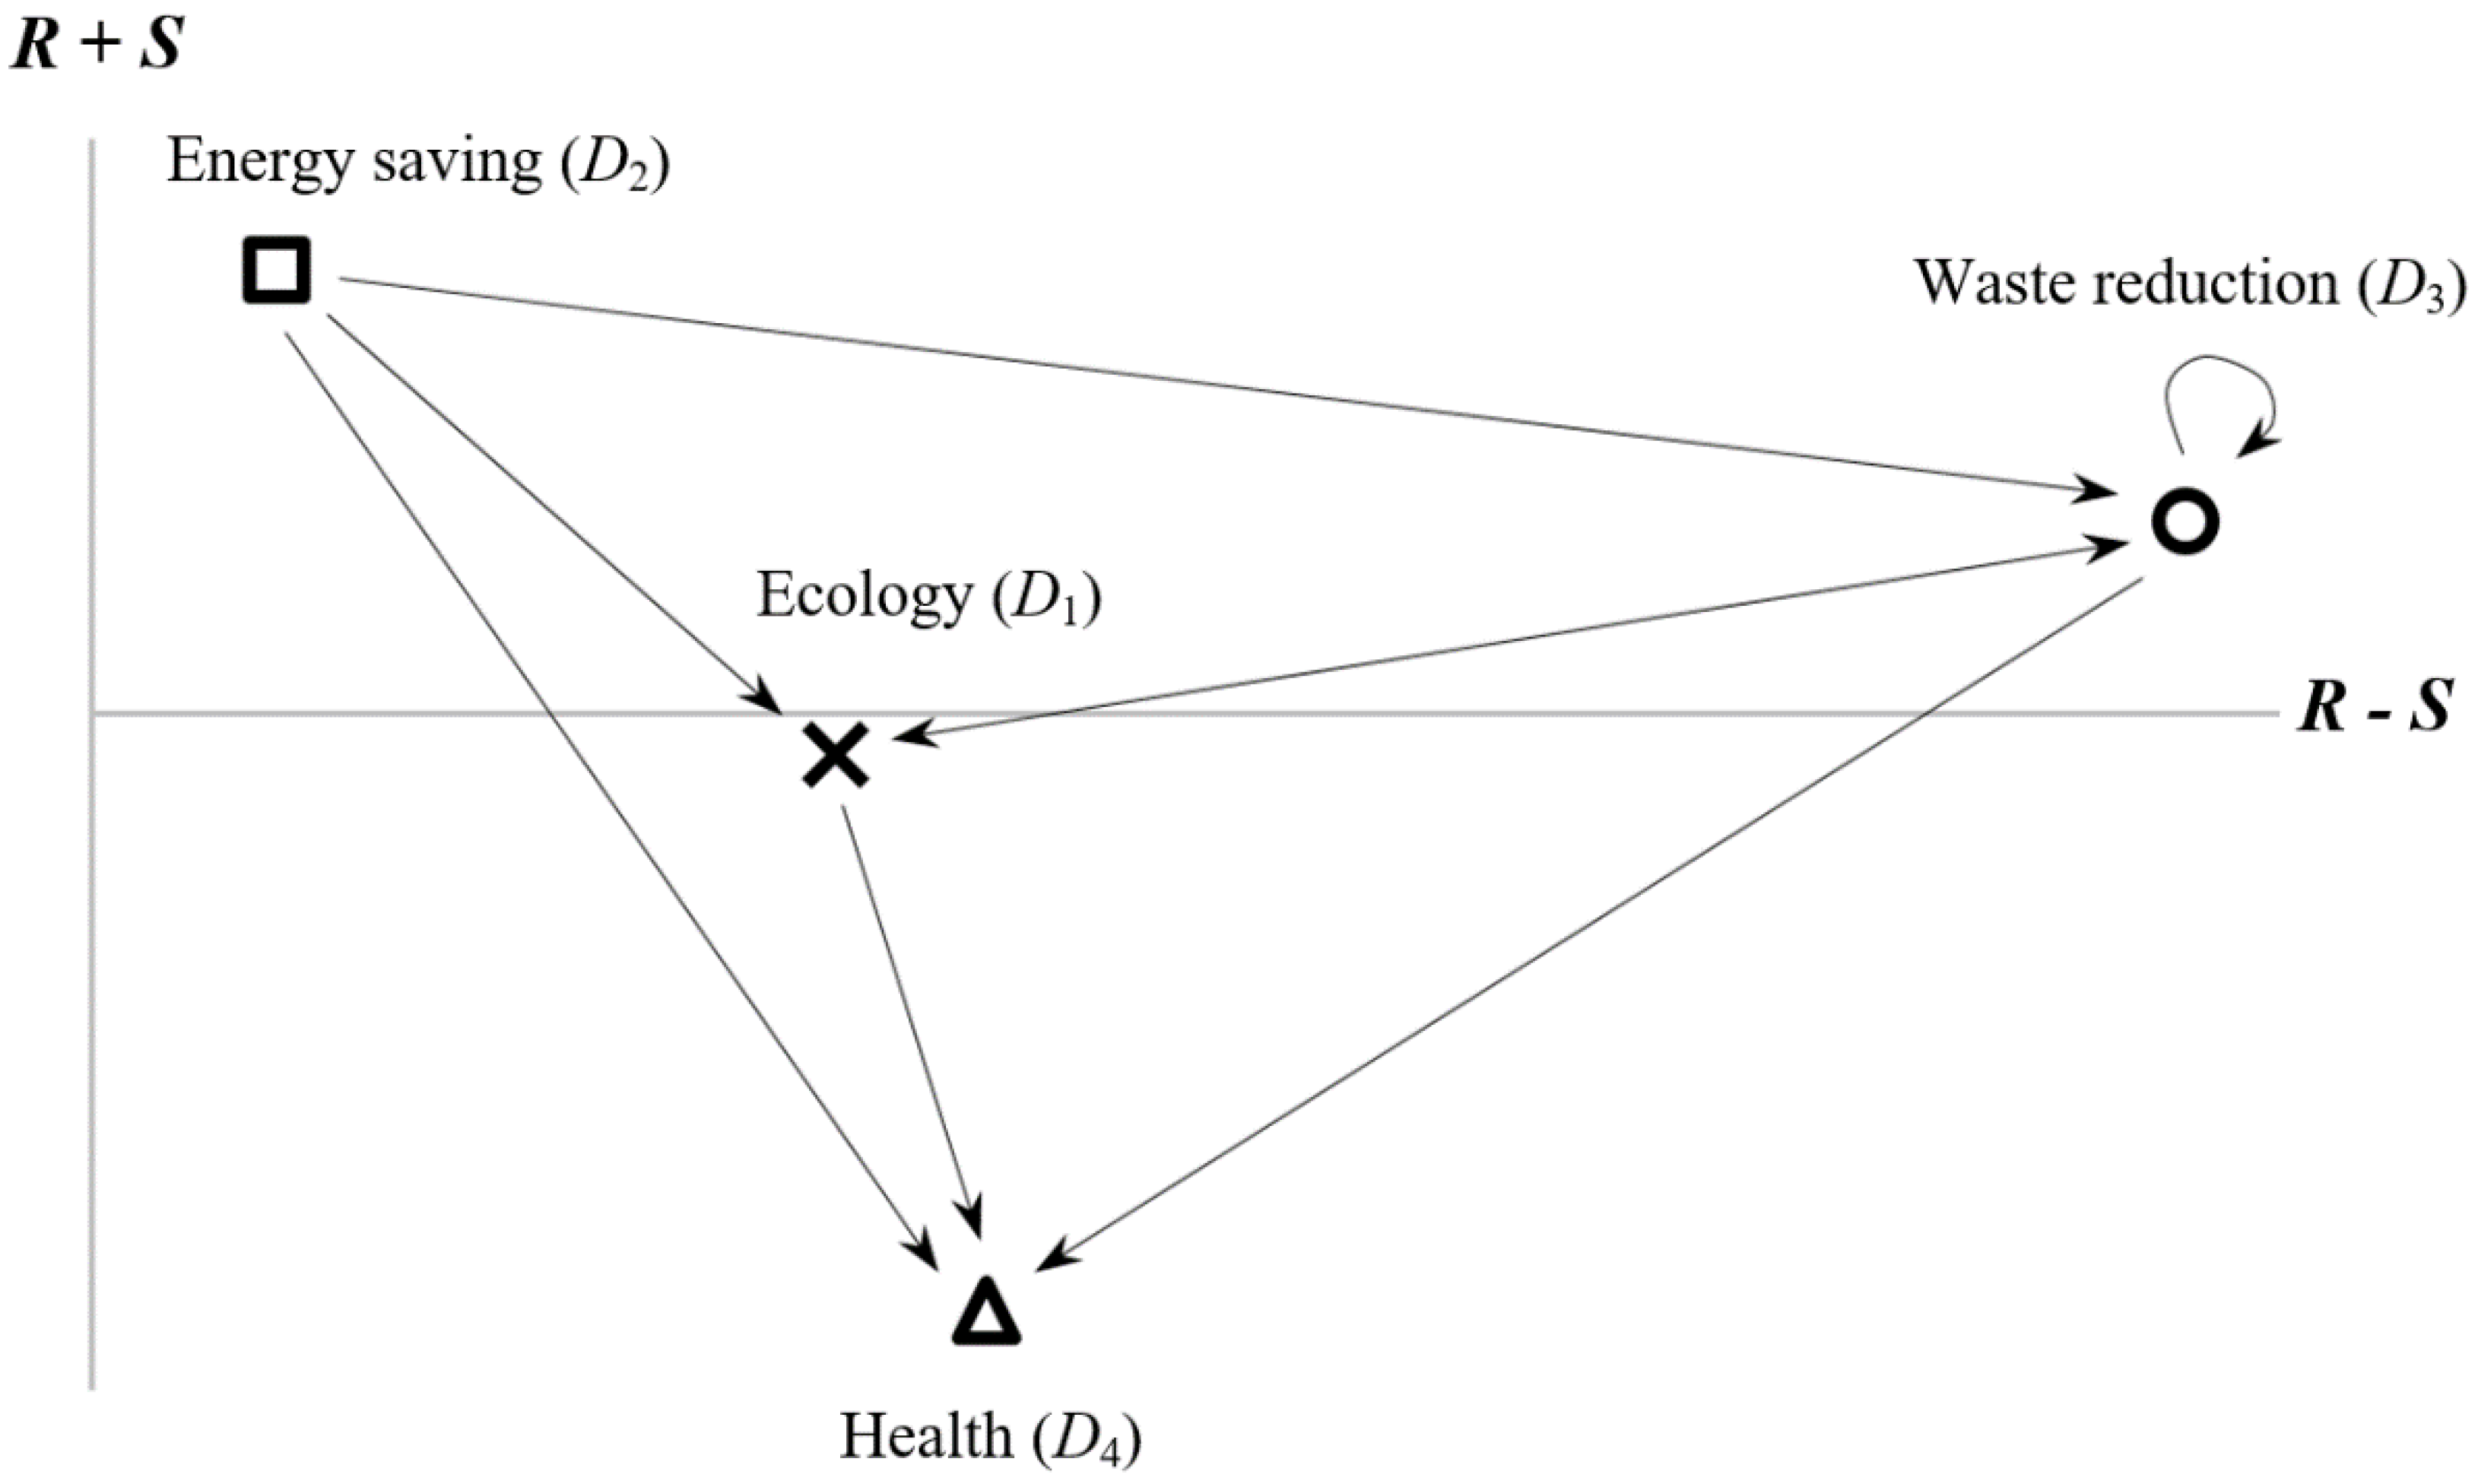
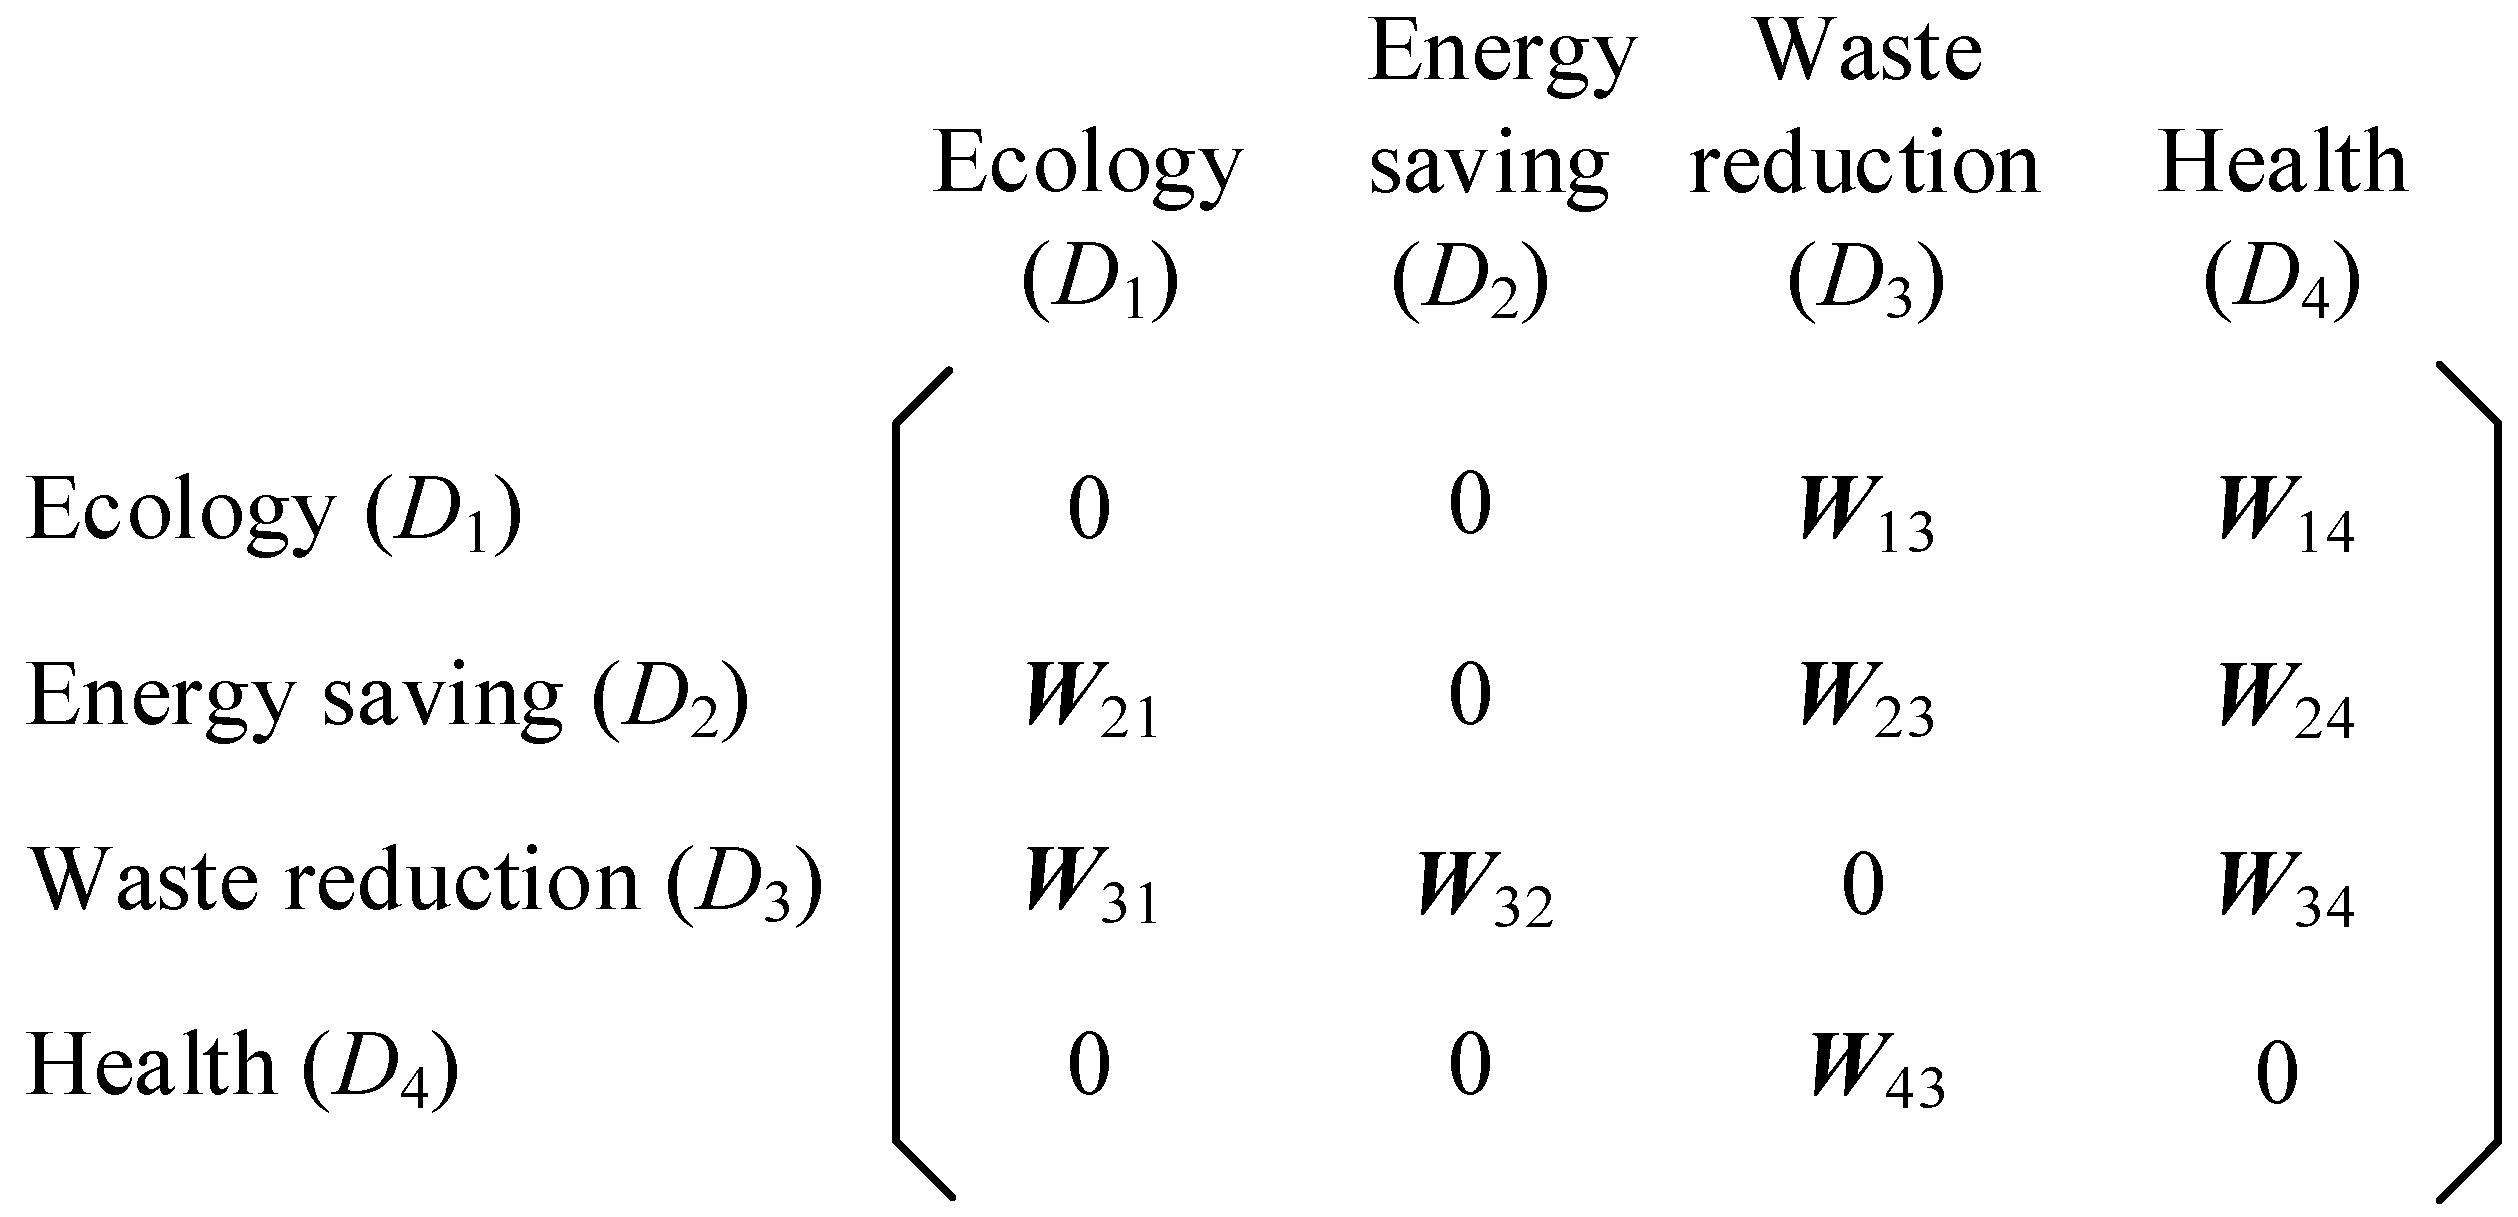
4.1. Using DEMATEL to Determine the Influential Relationships of the Dimensions

This study uses DEMATEL to convert the degree of interaction between complex dimensions into the characteristics of causality, most significantly to illustrate the relationship between the four dimensions (i.e., ecology, energy saving, waste reduction, and health). The initial evaluation matrix obtained from the nine experts is shown in Table 3. Following the procedure described in Section 3.1, the total influence relationship matrix can be calculated, as in Table 4.
Note: The average sample gap = 1 n ( n 1 ) i = 1 n j = 1 n ( | t i j p t i j p 1 | t i j p ) × 100 % = 4.8 % < 5 % for consensus, where n is the number of subsectors, p is the number of experts (9), and the significant confidence level is 95.2%, which is greater than the recommended minimum of 95%. If the average sample gap between the experts’ opinion is greater than 5%, the outlier will be removed from the sample. Then, more experts are invited to conduct the survey until the confidence level 95% is reached.
After completing the DEMATEL questionnaire to obtain the assessment of the degree of interaction among green building indicators, the results, as shown in Table 5, can be used to determine the influential relationship between the four dimensions as plotted as Figure 2.
From Figure 2, we can see that energy saving (D2) significantly affects the other three dimensions, ecology (D1), waste reduction (D3), and health (D4). As indicated in many previous studies, energy saving is one of the most effective ways to decrease carbon emissions as well as to slow down the phenomenon of global warming. Waste reduction (D3) which includes building material CO2 emission reduction (C31) and building construction and demolishing waste reduction (C32) have an influence on both ecology (D1) and human health (D4). The dust and fine particles generated during the construction and demolition processes are spread by the wind and endanger the surrounding atmosphere. Untreated waste not only occupies a large area in landfills but can also contaminate the water, atmosphere, and soil. Lack of environmental sanitation makes it easier for the transmission of disease and can have a serious impact on both ecology (D1) and human health (D4).
According to Table 5, the structure of the supermatrix can be decided by setting the threshold to 1.3, as discussed by the experts. This number was determined as appropriate because a higher number does not reflect the complex relationship between the dimensions and a lower number will require too many pairwise comparisons during the ANP analysis.

4.2. Using BWM Based ANP to Obtain the Influential Weights of the Criteria

Based on the obtained structure of the supermatrix (Figure 3), we can apply the BWM method to derive the priority vectors in each submatrix (e.g., W21, W31). For example, the weight vectors C21, C22, C23 (0.172, 0.305, 0.523) in the first column of Table 6 can be calculated by following the steps of the BWM detailed in Section 3.2. The input data (supermatrix) for the BWM based ANP comprise the average of nine expert evaluation values, as presented in Table 6. The sum of each column should be 1. Through application of the concept of the Markov chain, we can derive the limit supermatrix W, as presented in Table 7. The final weights of the dimensions and criteria are summarized in Table 8. The results indicate that the first priority in these dimensions is energy saving (D2), and the top five criteria are as follows: waste reduction during building construction and demolition (C32), building material CO2 emission reduction (C31), water resource recycling (C23), building’s thermal isolation (C21), and intelligent control of air conditioning and lighting (C22).

4.3. Model Comparison and Management Implications

Two MCDM models were tested and compared with the proposed model. Model 1 is a combination of DEMATEL and AHP based on ANP. It is similar to the proposed model, but the input value of ANP is obtained through the AHP questionnaire. As can be seen in Table 9, although the results of Model 1 are not much different from those obtained with the proposed model, the ranking of the fourth and fifth places is different. In addition, the number of pairwise comparisons using the AHP questionnaire is more than that required with the BWM, and the consistency is worse than with our proposed model [17,22,23]. Model 2 is comprised of the original ANP. It does not use DEMATEL to explore the interdependence between dimensions. Therefore, Model 2 requires more pairwise comparisons than Model 1. Obviously, the ranking of the criteria generated by Model 2 is significantly different from the other models (our proposed model and Model 1). For example, the criteria ranked second is C43. The results in Table 8 were presented to the nine experts for review. They all agreed that not only was the proposed model easy to apply to answer these types of questions, but the results were also more in line with their own expert opinions.
From Table 8, we can determine that waste reduction during building construction and demolition (C32) is the top priority with a criteria weight of 0.185. The main focus should be to minimize the environmental burden by minimizing the use of toxic materials for building construction. To achieve this goal, the second priority is the reduction of CO2 emission for building materials (C31) with a criteria weight of 0.168. This relates to encouraging the reduction of CO2 emissions from the very beginning stage of producing and transporting building materials, building structures with lightweight but durable materials, and the adoption of recycled building materials. The top two rankings are all included in the dimension of waste reduction (D3), which shares 35.3% of the total evaluated weights. In the previous section, noted that waste reduction affects the two dimensions of ecology and health. Analysis of the impact of reducing production and transportation of building materials shows that the production of building materials, such as steel, cement, bricks, tiles and glass, is one of the largest CO2 emitting sectors. In particular, cement production accounts for a considerable amount of total global greenhouse gas emissions. Improvements must be made from the stage of planning to construction of the building and beyond to reduce carbon dioxide emissions.
The criteria of water resource recycling (C23) ranks number 3, in terms of water conservation with a weight of 0.150. The volume of water consumption could be reduced by using water-saving toilets, shower heads, and automatic flushing urinal devices. On the other hand, collecting rainwater could be a proactive way to increase water resources. Rainwater can be used for many purposes, including flushing toilets, irrigating plants, replenishing air-conditioning, or as supplemental water sources for landscape ponds. The utilization of rainwater can minimize the use of precious tap water, for more effective use of water resources [47]. Ranking number 4, with a criteria weight of 0.103, is thermal isolation (C21). This goal can be met by measures such as avoiding large-area windows with exposure to direct sunlight as well as horizontal sky-lights on the building roof, the adoption of Low-E glass in closed cycle type air-conditioned buildings, measures for strengthening roof insulation, and keeping horizontal building depths low (14 m) to achieve natural ventilation. Meeting the above criteria can greatly reduce the use of air conditioning. Intelligent control of air conditioning and lighting (C22) is ranked number 5, with a criteria weight of 0.100. This could include the adoption of high efficiency air conditioning, variable frequency energy saving and lighting equipment, and avoiding equipment overloading or over-specification in a design. The last two criteria are thermal isolation of the building (C21) and intelligent control of air conditioning and lighting (C22). The former should be managed during the initial stage of building design while the second one depends upon modern technology to achieve the goal of energy conservation. Building energy consumption accounts for an astounding 40% of the world’s total carbon emissions [48]. One Taiwan study shows that the addition of a layer of thermal insulation and enhanced air tightness reduces energy consumption by an average of 39.78% [49]. Both of indicators are essential elements of the green building evaluation system.
The top five ranked criteria are all classified within the two dimensions of waste reduction (D3) and energy saving (D2), which shares a combined total of 70.6% of the weights from the 12 criteria. The results are quite close to those obtained in the previous section using the DEMATEL method to determine the influential relationships of the dimensions. As we can see from Figure 2, energy saving (D2) significantly affects the other three dimensions, ecology (D1), waste reduction (D3), and health (D4). Moreover, waste reduction (D3) significantly affects ecology (D1) and health (D4). The objective of this study is to establish a widely applicable green building assessment method for areas in Taiwan characterized by high population density and traffic congestion. Building construction, building usage, and final demolition all need to be planned properly from the very beginning to meet the target of waste reduction. Moreover, appropriate building design can help residents/building owners reduce the use of lighting, air conditioning, and water consumption, which not only achieves the goals of environmental protection but can also lead to substantial monetary savings for building users. In the aspect of model analysis, it saves tremendous costs and time of trial and error method, and this model can be introduced for the evaluation and selection of other issues.

5. Conclusions and Future Work

We propose a green building rating framework based on a novel MCDM model. The model integrates the DEMATEL and BWM based ANP methods thereby remedying the shortcomings of the traditional ANP method and can be used to determine the priorities for green building indicators applicable to the special circumstances in Taiwan. The complex relationships among green building indicators are identified by an INRM. The INRM reveals that waste reduction (D3) and energy saving (D2) are causal factors affecting the other two dimensions, ecology (D1) and health (D4). The results of the BWM based ANP method indicate that the top five ranking indicators are waste reduction during building construction and demolition (C32), building material CO2 emission reduction (C31), water resource recycling (C23), building’s thermal isolation (C21), and intelligent control of air conditioning and lighting (C22). Our findings suggests ways to minimize the environmental burden, by minimizing the use of toxic materials and reducing CO2 emissions from the very beginning stage of building material production and transportation. Resource conservation during the operational stage of building usage is also important, not only focused on lowering water consumption but also energy saving through active thermal isolation.
Although this research makes a significant contribution by the development of a green building assessment framework, some limitations still exist that can be further explored in the future. At present, we use data from parts of experts in Taiwan as our case study, but data from other countries or another group data from Taiwan could be good examples for comparisons. The current findings are snapshots based on a limited number of experts’ judgements. In future research, we will issue more questionnaires to increase the breadth of analysis. In addition, the uncertainty of experts and the ambiguity of the assessment environment were not considered in this study, which is one of the limitations that needs to be pointed out. A model that combines fuzzy theory with grey theory is one possible direction for future development.

Author Contributions

P.C.Y.L. collected the data, administrated the project, and wrote the paper. H.-W.L. designed the research and verified the model. J.J.H.L. co-wrote and revised the paper. All authors have read and agreed to the published version of the manuscript.

Funding

This research received no external funding.

Conflicts of Interest

The authors declare no conflict of interest.

Nomenclature

AcronymNomenclature
AHPAnalytic Hierarchy Process
ANPAnalytic Network Process
BWMBest Worst method
BREEAMBuilding Research Establishment Environmental Assessment Method
DANPDecision making trial and evaluation laboratory-based Analytical Network Process
DEMATELDecision Making Trial and Evaluation Laboratory
EEWHEcology, Energy saving, Waste reduction, and Health
ESGBEvaluation Standard for Green Building
GBIGreen Building Index
GBMGreen Building Material
INRMInfluential Network Relationship Map
LEEDLeadership in Energy and Environmental Design
MCDMMulti-Criteria Decision Making
QESQuantitative Evaluation System
SMTIScoring Methods of Terminal Indicators
TOPSISTechnique for Order Preference by Similarity to an Ideal Solution

Appendix A

Appendix A1. DEMATEL Questionnaire

The experts were asked to determine the influential degrees among the dimensions according to the DEMATEL technique, as described in Section 3.1. For example, in one of the questions in this survey, experts will be asked to assess what are the degrees of influence for the Ecology (D1) factor that affect Energy Saving (D2)?
Table A1. Decision making trial and evaluation laboratory (DEMATEL) questionnaire.
EcologyEnergy SavingWaste ReductionHealth
Ecology0
Energy Saving 0
Waste Reduction 0
Health 0

Appendix A2. BWM Based ANP Questionnaire

According to the results in Figure 3, which corresponds to Table A2, A BWM assessment is required inside each empty box. The BWM operation process is shown in steps 2.1 to 2.5.
Table A2. BWM based ANP questionnaire.
C11C12C13C14C21C22C23C31C32C41C42C43
C111.0000.0000.0000.0000.0000.0000.000
C120.0001.0000.0000.0000.0000.0000.000
C130.0000.0001.0000.0000.0000.0000.000
C140.0000.0000.0001.0000.0000.0000.000
C21 1.0000.0000.000
C22 0.0001.0000.000
C23 0.0000.0001.000
C31 1.0000.000
C32 0.0001.000
C410.0000.0000.0000.0000.0000.0000.000 1.0000.0000.000
C420.0000.0000.0000.0000.0000.0000.000 0.0001.0000.000
C430.0000.0000.0000.0000.0000.0000.000 0.0000.0001.000

References

  1. Sharma, M. Development of a ‘Green building sustainability model’ for Green buildings in India. J. Clean Prod. 2018, 190, 538–551. [Google Scholar] [CrossRef]
  2. Tsai, W.H.; Lin, S.J.; Lee, Y.F.; Chang, Y.C.; Hsu, J.L. Construction method selection for green building projects to improve environmental sustainability by using an MCDM approach. J. Environ. Plan. Manag. 2013, 56, 1487–1510. [Google Scholar] [CrossRef]
  3. Mitterpach, J.; Hroncová, E.; Ladomerský, J.; Štefko, J. Quantification of improvement in environmental quality for old residential buildings using life cycle assessment. Sustainability 2016, 8, 1303. [Google Scholar] [CrossRef] [Green Version]
  4. Shen, L.; Yang, J.; Zhang, R.; Shao, C.; Song, X. The Benefits and Barriers for Promoting Bamboo as a Green Building Material in China—An Integrative Analysis. Sustainability 2019, 11, 2493. [Google Scholar] [CrossRef] [Green Version]
  5. Kuo, C.F.J.; Lin, C.H.; Hsu, M.W. Analysis of intelligent green building policy and developing status in Taiwan. Energy Policy 2016, 95, 291–303. [Google Scholar] [CrossRef]
  6. Liu, T.Y.; Chen, P.H.; Chou, N.N. Comparison of Assessment Systems for Green Building and Green Civil Infrastructure. Sustainability 2019, 11, 2117. [Google Scholar] [CrossRef] [Green Version]
  7. Wu, Z.; Li, H.; Feng, Y.; Luo, X.; Chen, Q. Developing a green building evaluation standard for interior decoration: A case study of China. Build. Environ. 2019, 152, 50–58. [Google Scholar] [CrossRef]
  8. Kuo, C.F.J.; Lin, C.H.; Hsu, M.W.; Li, M.H. Evaluation of intelligent green building policies in Taiwan–Using fuzzy analytic hierarchical process and fuzzy transformation matrix. Energy Build. 2017, 139, 146–159. [Google Scholar] [CrossRef]
  9. Sangkakool, T.; Techato, K.; Zaman, R.; Brudermann, T. Prospects of green roofs in urban Thailand–A multi-criteria decision analysis. J. Clean. Prod. 2018, 196, 400–410. [Google Scholar] [CrossRef]
  10. Shao, Q.G.; Liou, J.; Weng, S.S.; Chuang, Y.C. Improving the green building evaluation system in China based on the DANP method. Sustainability 2018, 10, 1173. [Google Scholar] [CrossRef] [Green Version]
  11. Hsu, C.C.; Liou, J.J.; Lo, H.W.; Wang, Y.C. Using a hybrid method for evaluating and improving the service quality of public bike-sharing systems. J. Clean. Prod. 2018, 202, 1131–1144. [Google Scholar] [CrossRef]
  12. Pineda, P.J.G.; Hsu, C.C.; Liou, J.J.; Lo, H.W. A Hybrid Model for Aircraft Type Determination Following Flight Cancellation. Int. J. Inf. Technol. Decis. Mak. 2018, 17, 1147–1172. [Google Scholar] [CrossRef]
  13. Chauhan, A.; Singh, A.; Jharkharia, S. An interpretive structural modeling (ISM) and decision-making trail and evaluation laboratory (DEMATEL) method approach for the analysis of barriers of waste recycling in India. J. Air Waste Manag. Assoc. 2018, 68, 100–110. [Google Scholar] [CrossRef]
  14. Gabus, A.; Fontela, E. World Problems, An Invitation to Further thought within the Framework of DEMATEL; Battelle Geneva Research Center: Geneva, Switzerland, 1972. [Google Scholar]
  15. Saaty, T.L. The Analytic Hierarchy Process: Planning, Priority Setting, Resources Allocation; University of Pittsburgh: Pittsburgh, PA, USA, 1980. [Google Scholar]
  16. Saaty, T.L. Decision Making with Dependence and Feedback: Analytic Network Process; RWS Publications: Pittsburgh, PA, USA, 1996. [Google Scholar]
  17. Rezaei, J. Best-worst multi-criteria decision-making method. Omega 2015, 53, 49–57. [Google Scholar] [CrossRef]
  18. Chen, F.H.; Hsu, T.S.; Tzeng, G.H. A balanced scorecard approach to establish a performance evaluation and relationship model for hot spring hotels based on a hybrid MCDM model combining DEMATEL and ANP. Int. J. Hosp. Manag. 2011, 30, 908–932. [Google Scholar] [CrossRef]
  19. Ou Yang, Y.P.; Shieh, H.M.; Tzeng, G.H. A VIKOR technique based on DEMATEL and ANP for information security risk control assessment. Inf. Sci. 2013, 232, 482–500. [Google Scholar] [CrossRef]
  20. Supeekit, T.; Somboonwiwat, T.; Kritchanchai, D. DEMATEL-modified ANP to evaluate internal hospital supply chain performance. Comput. Ind. Eng. 2016, 102, 318–330. [Google Scholar] [CrossRef]
  21. Mimović, P.M.; Krstić, A.; Savic, J. Serbia joining the european union: An anp model for forecasting the accessing date. Int. J. Anal. Hierarchy Process 2019, 11. [Google Scholar] [CrossRef]
  22. Lo, H.W.; Liou, J.J.; Wang, H.S.; Tsai, Y.S. An integrated model for solving problems in green supplier selection and order allocation. J. Clean. Prod. 2018, 190, 339–352. [Google Scholar] [CrossRef]
  23. Lo, H.W.; Liou, J.J.; Huang, C.N.; Chuang, Y.C. A novel failure mode and effect analysis model for machine tool risk analysis. Reliab. Eng. Syst. Saf. 2019, 183, 173–183. [Google Scholar] [CrossRef]
  24. Zhang, C.; Cui, C.; Zhang, Y.; Yuan, J.; Luo, Y.; Gang, W. A review of renewable energy assessment methods in green building and green neighborhood rating systems. Energy Build. 2019, 195, 68–81. [Google Scholar] [CrossRef]
  25. Suzer, O. Analyzing the compliance and correlation of LEED and BREEAM by conducting a criteria-based comparative analysis and evaluating dual-certified projects. Build. Environ. 2019, 147, 158–170. [Google Scholar] [CrossRef]
  26. Xue, F.; Lau, S.S.; Gou, Z.; Song, Y.; Jiang, B. Incorporating biophilia into green building rating tools for promoting health and wellbeing. Environ. Impact Assess. Rev. 2019, 76, 98–112. [Google Scholar] [CrossRef]
  27. Zou, Y. Certifying green buildings in China: LEED vs. 3-star. J. Clean. Prod. 2019, 208, 880–888. [Google Scholar] [CrossRef]
  28. Khoshnava, S.M.; Rostami, R.; Valipour, A.; Ismail, M.; Rahmat, A.R. Rank of green building material criteria based on the three pillars of sustainability using the hybrid multi criteria decision making method. J. Clean. Prod. 2018, 173, 82–99. [Google Scholar] [CrossRef]
  29. Mathiyazhagan, K.; Gnanavelbabu, A.; Prabhuraj, B.L. A sustainable assessment model for material selection in construction industries perspective using hybrid MCDM approaches. J. Adv. Manag. Res. 2019. [Google Scholar] [CrossRef]
  30. Zhang, X.; Zhan, C.; Wang, X.; Li, G. Asian green building rating tools: A comparative study on scoring methods of quantitative evaluation systems. J. Clean. Prod. 2019, 218, 880–895. [Google Scholar] [CrossRef]
  31. Ansah, M.K.; Chen, X.; Yang, H.; Lu, L.; Lam, P.T. A review and outlook for integrated BIM application in green building assessment. Sustain. Cities Soc. 2019, 48, 101576. [Google Scholar] [CrossRef]
  32. Wu, C.Y.; Lo, S.F. What makes a greener building? Lessons from Taiwan. J. Environ. Prot. Ecol. 2018, 9, 957. [Google Scholar] [CrossRef] [Green Version]
  33. Yu, W.D.; Cheng, S.T.; Ho, W.C.; Chang, Y.H. Measuring the Sustainability of construction projects throughout their lifecycle: A Taiwan lesson. Sustainability 2018, 10, 1523. [Google Scholar] [CrossRef] [Green Version]
  34. Shan, M.; Hwang, B.G. GBRSs: Global reviews of practices and research efforts. Sustain. Cities Soc. 2018, 39, 172–180. [Google Scholar] [CrossRef]
  35. Danish, M.S.S.; Senjyu, T.; Ibrahimi, A.M.; Ahmadi, M.; Howlader, A.M. A managed framework for energy-efficient building. J. Build. Eng. 2019, 21, 120–128. [Google Scholar] [CrossRef]
  36. Tsai, W.T. Overview of Green Building Material (GBM) Policies and Guidelines with Relevance to Indoor Air Quality Management in Taiwan. Environments 2018, 5, 4. [Google Scholar] [CrossRef] [Green Version]
  37. Tzeng, G.H.; Chiang, C.H.; Li, C.W. Evaluating intertwined effects in eLearning programs: A novel hybrid MCDM model based on factor analysis and DEMATEL. Expert Syst. Appl. 2007, 32, 1028–1044. [Google Scholar] [CrossRef]
  38. Yan, A.T.; Lai, M.J.; Lin, C.Y. An Evaluation Model for Improving the Green Building by Integrating DEMATEL Based ANP and VIKOR. In Proceedings of the 2014 International Symposium on Computer, Consumer and Control, Taichung, Taiwan, 10–12 June 2014; pp. 729–732. [Google Scholar]
  39. Lo, H.-W.; Liou, J.-J.; Huang, C.-N.; Chuang, Y.-C.; Tzeng, G.-H. A new soft computing approach foranalyzing the influential relationships of critical infrastructures. Int. J. Crit. Infrastruct. Prot. 2020, 28, 100336. [Google Scholar] [CrossRef]
  40. Zhang, L.; Sun, X.; Xue, H. Identifying critical risks in Sponge City PPP projects using DEMATEL method: A case study of China. J. Clean. Prod. 2019, 226, 949–958. [Google Scholar] [CrossRef]
  41. Abdel-Baset, M.; Chang, V.; Gamal, A.; Smarandache, F. An integrated neutrosophic ANP and VIKOR method for achieving sustainable supplier selection: A case study in importing field. Comput. Ind. 2019, 106, 94–110. [Google Scholar] [CrossRef]
  42. Mahdiyar, A.; Tabatabaee, S.; Durdyev, S.; Ismail, S.; Abdullah, A.; Rani, W.N.M.W.M. A prototype decision support system for green roof type selection: A cybernetic fuzzy ANP method. Sustain. Cities Soc. 2019, 48, 101532. [Google Scholar] [CrossRef]
  43. Namin, F.N.; Askari, H.R.; Ramesh, S.; Hassani, S.M.M.; Khanmohammadi, E.; Ebrahimi, H. Application of ANP network analysis process method in SWOT model. Civ. Eng. J. 2019, 5, 458–465. [Google Scholar] [CrossRef] [Green Version]
  44. Van de Kaa, G.; Fens, T.; Rezaei, J. Residential grid storage technology battles: A multi-criteria analysis using BWM. Technol. Anal. Strateg. Manag. 2019, 31, 40–52. [Google Scholar] [CrossRef]
  45. Kumar, A.; Aswin, A.; Gupta, H. Evaluating green performance of the airports using hybrid BWM and VIKOR methodology. Tour. Manag. 2020, 76, 103941. [Google Scholar] [CrossRef]
  46. Huang, J.-C.; Milliman, J.D.; Lee, T.-Y.; Chen, Y.-C.; Lee, J.-F.; Liu, C.-C.; Lin, J.-C.; Kao, S.-J. Terrain attributes of earthquake-and rainstorm-induced landslides in orogenic mountain Belt, Taiwan. Earth Surf. Process. Landforms 2017, 42, 1549–1559. [Google Scholar] [CrossRef]
  47. Lu, T.J.; Juan, Y.K. Applying Kano Two-Dimensional Quality Model to Build the Performance Evaluation Indicators of Long-Life High-Quality Condominiums. Sustainability 2019, 11, 4046. [Google Scholar] [CrossRef] [Green Version]
  48. Maiolo, M.; Pirouz, B.; Bruno, R.; Palermo, S.A.; Arcuri, N.; Piro, P. The Role of the Extensive Green Roofs on Decreasing Building Energy Consumption in the Mediterranean Climate. Sustainability 2020, 12, 359. [Google Scholar] [CrossRef] [Green Version]
  49. Lin, K.L.; Jan, M.Y.; Liao, C.S. Energy Consumption Analysis for Concrete Residences—A Baseline Study in Taiwan. Sustainability 2017, 9, 257. [Google Scholar] [CrossRef] [Green Version]
Figure 1. The analysis process.
Sustainability 12 03216 g001
Figure 2. The influential relationship network among the four dimensions.
Sustainability 12 03216 g002
Figure 3. Structure of the supermatrix for analytic network process (ANP) analysis.
Sustainability 12 03216 g003
Table 1. Intensive literature review of related research papers on green buildings.
AuthorResearch MethodologyAssessment Indicators
Khoshnava et al. [28]Applies a hybrid MCDM methodology, DEMATEL and Fuzzy ANP to resolve multiple incompatible and conflicting GBM criteria to align with 3Ps sustainability. GBM criteria
Wu et al. [7]AHP method.LEED and BREEAM
Zhang et al. [24] Offers an extensive review of renewable energy evaluation tools employed in green neighborhood/building rating systems that is very useful for realization and then reformation of the assessment scheme.LEED-ND-US, PCRS- Abu Dhabi, Indian green building council- Township-India, Green Star-Community-Australia, Building Environmental Assessment Method (BEAM) Plus-Neighborhood- HK and Assessment Standard of Green Buildings -China
Zhang et al. [30]Quantitative Evaluation System (QES); scoring methods of terminal indicators (SMTIs); aims to outline parallels and differences between QESs of Evaluation Standard for
Green Building (ESGB) and of ecology, energy saving, waste reduction and health (EEWH) with a stress on the SMTIs.
EEWH and ESGB
Ansah et al. [31]Focuses on the width and profundity of integrating the evaluation criteria into Building Information Modelling (BIM) and advances in supportive techniques.LEED, BEAM Plus, BREEAM, Green Mark, and Green Building Index (GBI)
Wu and Lo [32]Encourages incentives for buildings owned by the individual, private corporations or components of large scale projects to get a higher degree of EEWH certification.EEWH
Yu et al. [33] (1) Identifies 57 candidate sustainability criteria; (2) pre-screening and prioritizing of preliminary criteria for applicable lifespan stages through domain specialist consultations; (3) examination of historical sustainable projects; (4) prioritization of selected preliminary criteria through a questionnaire survey; and (5) case study demonstration.EEWH Certified
Shao et al. [10] Introduces DANP model to build an interdependent system and determine the weights of the indicators. Stakeholders can use this method to judge the complicated kinship between green building management and cause-effect within the indicators through the derived INRM in order to set improvements for better green buildings in China.An assessment system with 7 dimensions and 30 indicators:
Shan and Hwang [34]Extracts and sums up all the assessment criteria from the 15 predominant green building rating systems. Among the 29 criteria, 7 can be reasoned to be the most vital evaluation criteria. water, energy, material, indoor environment, site, innovation, land and outdoor environment
Sharma [1]Uses a quantitative research design to authenticate 12 hypotheses for their research model. Questionnaire survey method was used for data collection.Used Structural Equation Modelling to verify research model and hypotheses.
Zou [27]Compares LEED and the 3-star systems by testing four principal categories of informative variables hypothesized to contribute to green building certification options.LEED and 3-Star (ESGB)
Suzer [25]Examines the degree of conformity and correlation between BREEAM and LEED concerning their assessment criteria and award levels. Also analyzes dual-certified buildings, indexes that received awards from both of the afore-mentioned certification bodies. LEED and BREEAM
Danish et al. [35]A comprehensive literature review about energy efficiency and management of buildings; investigates the opportunities to minimize the building life-cycle cost. Finally, proposes a framework-scheme as a best incorporated resolution for building sustainability.LEED, BIM, and Life-Cycle Costing
Tsai [36]Conducts a comprehensive literature review for an initial outline of Taiwan’s success in terms of green building material (GBM) efforts through legal systems and revitalization measures.EEWH, GBM, and Indoor air quality
Mathiyaz-Hagan et al. [29]Using BWM and Fuzzy TOPSIS methodology to select sustainable material selection of building construction.The 3 pillars: environmental, economic, and social
Table 2. Dimensions and criteria for green buildings in Taiwan.
DimensionsCriteriaExplanation
Ecology (D1)Biodiversity (C11)The scope of consideration includes ecological green networks, small habitats, plant diversity, soil ecology, lessening of lighting pollution, and removing biological barriers [30,33].
Land area and degree of greenery (C12)Indicators for assessment include: (1) maintenance of green areas covering more than 15% of the site; (2) most areas are planted with arbors and small areas are planted with shrubs; (3) reducing artificial lawn and parterre; and (4) planting perennial vines on the surface of the building [26,30,33].
Water content of the site (C13)The building base has the ability to store and allow infiltration of rainwater. Water is beneficial to microbial activity in the soil and thus preservation of the organic quality of the soil [10,26].
Outdoor environment (C14)Reduction of light pollution caused by building lighting; reflections from the building’s glass on the surrounding environment. Achieving these two items will result in a high score for this assessment [10,26].
Energy saving (D2)Building’s thermal isolation (C21)Avoiding placement of large-area windows in areas with direct sun exposure as well as horizontal sky-lights in the building roof; adopt low-emissivity glass (Low-E glass) in closed cycle type air-conditioned buildings; strengthen roof insulation and keep the building’s horizontal depth low (14 m) to achieve natural ventilation [7,26].
Intelligent control of air conditioning and lighting (C22)Adopt high efficiency, variable frequency energy saving air conditioning and lighting equipment; avoid equipment overloading or over-specification in the design; promotion of energy-saving and control of lighting by ensuring that there are sufficient windows to allow natural light; use high-efficiency energy lighting fixtures, proper illumination design, and intelligent control systems to save energy [8,10].
Water resource recycling (C23)Four indicators: (1) water saving and auto control flush toilets; (2) rainwater collection and re-use to irrigate plants; (3) recycling the water from large air conditioning cooling systems; (4) avoid artificial lawns and parterre [7,10,30].
Waste reduction (D3)Building materials CO₂ emission reduction (C31)Reduce CO2 emissions during production and transportation of building materials, build structures of lightweight but durable materials, and use recycled building materials [10,26,30].
Waste reduction during building construction and demolishing (C32)Minimize the environmental burden and harm to the human body by good management of four major sources of construction pollution: (1) reuse of construction waste soil, (2) construction waste, (3) waste from the demolished building, and (4) reduction of air pollution during the construction phase [10,30,33].
Health (D4)Indoor environment (C41)Using green building materials for indoor decoration, noise insulation, natural lighting, and ventilation is essential for the health of the building occupants/users [7,10,26,30].
Water storage conditions (C42)Cisterns and pipeline need to be cleaned and disinfected regularly to ensure that the building inhabitants have clean water to drink and for daily use [10,26,30].
Sewage and Waste Disposal (C43)Four indicators: (1) discharge of household or commercial sewage to sewage treatment equipment or dedicated sewers, (2) garbage collection site with sufficient space and enclosed equipment, (3) garbage sorting and recycling, and (4) recycling of food waste [10,30].
Table 3. The average direct relation matrix A.
D1D2D3D4
D101.7782.1113.333
D22.11103.3332.111
D33.3332.22203.000
D41.7781.8892.3330
Table 4. The total influence matrix T.
D1D2D3D4
D11.2381.2281.4941.699
D21.5351.1331.6771.712
D31.7171.4231.4951.895
D41.2721.1141.3611.248
Table 5. Results of the DEMATEL calculation.
risiri + sirisi
D15.6615.76311.424−0.103
D26.0574.89810.9551.158
D36.5306.02712.5580.503
D44.9966.55511.550−1.559
Table 6. Averaged input data (supermatrix) of best worst method (BWM)-based ANP.
C11C12C13C14C21C22C23C31C32C41C42C43
C111.0000.0000.0000.0000.0000.0000.0000.3700.2260.1710.1330.206
C120.0001.0000.0000.0000.0000.0000.0000.2200.2880.3570.1830.170
C130.0000.0001.0000.0000.0000.0000.0000.0950.1210.3040.3460.216
C140.0000.0000.0001.0000.0000.0000.0000.3150.3650.1680.3370.408
C210.1720.1870.1740.3531.0000.0000.0000.4170.2600.4170.2140.208
C220.3050.1570.2560.3640.0001.0000.0000.3590.2280.4170.1450.192
C230.5230.6560.5700.2840.0000.0001.0000.2240.5120.1670.6410.600
C310.4290.3620.4620.4190.5000.5000.5001.0000.0000.6290.4000.305
C320.5710.6380.5380.5810.5000.5000.5000.0001.0000.3710.6000.695
C410.0000.0000.0000.0000.0000.0000.0000.5570.2361.0000.0000.000
C420.0000.0000.0000.0000.0000.0000.0000.2210.2360.0001.0000.000
C430.0000.0000.0000.0000.0000.0000.0000.2210.5290.0000.0001.000
Table 7. Limit supermatrix W.
C11C12C13C14C21C22C23C31C32C41C42C43
C110.0470.0470.0470.0470.0470.0470.0470.0470.0470.0470.0470.047
C120.0450.0450.0450.0450.0450.0450.0450.0450.0450.0450.0450.045
C130.0270.0270.0270.0270.0270.0270.0270.0270.0270.0270.0270.027
C140.0580.0580.0580.0580.0580.0580.0580.0580.0580.0580.0580.058
C210.1030.1030.1030.1040.1070.1030.1030.1040.1030.1040.1030.103
C220.1000.0990.1000.1010.0990.1030.0990.1000.1000.1000.0990.100
C230.1500.1510.1500.1480.1470.1470.1510.1480.1500.1480.1500.150
C310.1680.1680.1680.1680.168 0.168 0.168 0.1680.1680.1680.1680.168
C320.1850.1850.1850.1850.185 0.185 0.185 0.1850.1850.1850.1850.185
C410.0460.0460.0460.0460.0460.0460.0460.0460.0460.0460.0460.046
C420.0270.0270.0270.0270.0270.0270.0270.0270.0270.0270.0270.027
C430.0450.0450.0450.0450.0450.0450.0450.0450.0450.0450.0450.045
Table 8. Weights and ranking of dimensions and criteria.
DimensionWeightRankCriteriaWeightRank
D10.1763C110.0477
C120.04510
C130.02712
C140.0586
D20.3541C210.1034
C220.1005
C230.1503
D30.3522C310.1682
C320.1851
D40.1184C410.0468
C420.02711
C430.0459
Table 9. Comparison of three different multi-criteria decision making (MCDM) models.
DEMATEL + BWM Based ANP (Our Proposed Model)DEMATEL + AHP Based ANP
(Model 1)
AHP Based ANP
(Model 2)
CriteriaWeightRankWeightRankWeightRank
C110.04770.04680.05611
C120.045100.04490.0708
C130.027120.021120.04912
C140.05860.06660.0757
C210.10340.09350.0679
C220.10050.11840.0776
C230.15030.14230.1053
C310.16820.16720.1044
C320.18510.18610.1461
C410.04680.05270.0825
C420.027110.030110.06110
C430.04590.036100.1072

