Article

Drivers of Sustainable Adoption of Building Information Modelling (BIM) in the Nigerian Construction Small and Medium-Sized Enterprises (SMEs)

by
Abdullahi B. Saka
*,
Daniel W. M. Chan
and
Francis M. F. Siu
Department of Building and Real Estate, The Hong Kong Polytechnic University, Hung Hom, Kowloon, Hong Kong, China
*
Author to whom correspondence should be addressed.
Sustainability 2020, 12(9), 3710; https://doi.org/10.3390/su12093710
Submission received: 24 February 2020 / Revised: 14 April 2020 / Accepted: 27 April 2020 / Published: 3 May 2020
(This article belongs to the Special Issue Sustainability and Risks in Construction Management)

Abstract

:
The small and medium-sized enterprises (SMEs) which are the backbone of any economy are often on the disadvantaged side of the digital divide in the construction industry. With the advent of building information modelling (BIM), the SMEs are facing challenges and are slow with its uptake. Hitherto, extant research studies on BIM have focused primarily on the large firms and there is an observed trend of underrepresentation of the SMEs in BIM studies. Thus, this paper aims to investigate the major drivers of sustainable adoption of Building Information Modelling in SMEs and the dynamics of these drivers in developing countries using interpretive structural modelling approach and Matrice d’Impacts croises-multipication applique a classement (MICMAC) analysis. The findings reveal that organizational readiness is of utmost importance for the proliferation of BIM in SMEs. Also, the independent drivers which are the most important drivers consist of BIM characteristics, internal and external environment drivers and thus portray the BIM adoption as a complex socio-technical system. This study categorizes the drivers for easy intervention of SMEs’ managers and policymakers. It contributes to the nascent studies of BIM adoption in SMEs of developing countries.

1. Introduction

The Construction Industry is complex, and this can be related to the inefficiency of the operation, uncertainties, and interdependence making way for an increase in complexity of the industry as opined by Dubois and Gadde [1]. The culture of the industry, increase in population, increase in stakeholders, increase in demand, lack of information reuse and management, and poor cross-disciplinary communications also contributed to this complexity. This has been having a tremendous effect on the productivity and the performance of the industry which has been a subject of criticisms. Latham [2] reported that the industry is ‘ineffective’ and ‘incapable of delivering for its customers’. Egan [3] corroborated that the underperforming nature of the industry is as a result of the structure and the working practices. A more integrated approach has been recommended as one of the ways to curb the ineffectiveness of the industry.
There have been proposed remedies such as Total Quality Management (TQM), Lean Practices, Sustainability, Partnering, and Building Information Modelling (BIM) among others. These are channelled towards improving the practices in the construction industry. However, only the BIM has generated an industry-wide influence [4] and has become notable in the AEC industry [5]. The National Building Information Model Standard Project Committee [6] defines BIM as ‘a digital representation of physical and functional characteristics of a facility. It is a shared knowledge resource for information about a facility forming a reliable basis for decisions during its lifecycle; defined as existing from earliest conception to demolition’. It is an interrelating set of policies, processes and technologies that enables the life cycle management of the building data in a digitized format [7]. The information and data made available in the digital format by the BIM can be easily edited, copied, and shared with the project stakeholders, which has improved interoperability between different phases of projects compared to the 2D paper formats. Perceived benefits such as improved collaboration, improved profitability, reduced cost, saved time, improved communication, improved design, reduced errors have been reported on projects that implemented BIM [8,9,10,11,12,13,14]. Similarly, some research studies [15,16,17] have reported on the significant benefits such as improved productivity and efficiency in construction organizations that have adopted BIM. This has led to an increase in the awareness, adoption, and implementation of BIM in the architecture, engineering, and construction (AEC) industry over the years.
The United Kingdom (UK) mandated the use of BIM towards the bid of reducing the industry cost by 20% with 2016 deadline and the level of implementation has since increased from 13% in 2011 to 74% in 2018 [18]. General Services Administration (GSA) started the BIM implementation on projects in the United States in 2003 and this influenced industry-wide awareness and adoption. McGraw Hill [19] reported an increase from 28% (2007) adoption level to 71% (2012) in North America. The Building and Construction Authority (BCA) led the BIM adoption in Singapore and BIM has since become a mandatory part in the procurement of public sector projects from 2012 [20]. The Hong Kong Housing Authority (HKHA) has been piloting the use of BIM since 2006 and the adoption has increased in the industry. Similarly, Senate Properties started piloting of BIM project in the public sector of Finland while Skanska Oy started the implementation in the private sector [21]. BIM was mandated on public projects over S$50 million in South Korea. Countries as such Norway, Denmark, Malaysia, Australia, Canada among others have also recorded an increase in the level of BIM adoption.
However, the diffusion of BIM in the AEC industry is slow and not as envisaged [22]. Both developed countries and developing countries are still facing the challenges of BIM adoption, though, developed countries are ahead of the developing countries as a result of the concerted efforts of some of the governments, and organizations in such countries [23]. There have been few reports on BIM from developing countries [24] especially from the ‘BIM infants’ countries [25,26]. The construction industry in the developing countries is marred by myriads of challenges such as time overruns, cost overruns, project delays, project abandonments, corruptions, disputes and generating wastes [27,28]. Thus, the adoption and implementation of BIM have great potential in such clime [23]. However, the diffusion is slower than that of developed countries [29] and hindered by challenges such as lack of awareness, lack of government support, high cost of implementation and lack of implementation guidelines/strategies [25,30,31,32]
Despite the increase in adoption recorded over the last decade in the AEC industry, there has been a growing trend of the underrepresentation of the small and medium-sized enterprises (SMEs) in the extant studies [16] and this is evident by the few numbers of BIM research studies specifically from SME perspective [4,33]. This could be partly explained by the digital divide between the ‘BIM compliant’ large firms and ‘BIM complaint’ SMEs [32] leaving the SMEs on the disadvantaged side of the divide. Even though the SMEs are the backbone of economies and represents a larger percentage of the AEC firms, and integration of the fragmented industry depends on integrating the SMEs and the large firms (supply chain). Extant studies have often attempted to view and combine the SMEs and large firms together under the same scope; however, such a singular view might not be realistic and may be prone to errors. The SMEs and the large firms are different firms cohabiting the same ecological environment but belong to different business niche, and thus would react and act differently in the same operating environment [34]. In addition, it is important to note that the SMEs are not the smaller version of the large firms [35]. SMEs are characterized by a small number of employees, high flexibility, organic structure, low resources and are often unwilling to adopt innovations that are perceived to be risky and far away from their safe zone [34]. Hong, et al. [36] and Arayici, Coates, Koskela, Kagioglou, Usher and O’Reilly [17] asserted that the SMEs stand to gain from BIM adoption as a result of their characterized features (small size, small projects, high flexibility and organic structure) which would make change easy, BIM adoption process manageable and high implementation feasible. However, there is still low adoption of BIM in the SMEs as reported by studies from the developed countries such as Canada, Australia, the United Kingdom, France, Italy and the US [16,37,38,39,40,41]. Similarly, McGraw Hills [42] corroborated that a large percentage of non-adopters are the SMEs due to lack of awareness, lack of resources, and lack of technical know-how. These challenges have led to the loss of competitiveness and loss in market share for the non-adopting SMEs.
The few extant studies on BIM in SMEs are from developed countries with a high level of awareness, adoption and implementation of BIM and coupled with government support. Little is known about BIM in SMEs of BIM infant industries (developing countries) where the level of awareness is low, no government mandate and low technology adoption [43]. Pandya [44] reported that SMEs in developing countries are more vital and important to the economy. Thus, the SMEs in the AEC of developing countries are more vital to the growth of the industry and have cogent roles to play in improving productivity as they represent a large percentage of the industry. However, the SMEs in developing countries are performing below expectancy, less competitive and are often fighting for survival. Also, despite the importance of SMEs in developing countries, there has been an underrepresentation of the SMEs’ narratives in BIM research [45]. This could be partly explained by the low level of awareness in the industry and low level of implementation in the small and medium-sized enterprises (SMEs) of such countries.

Context

This study aims to present and analyze the major drivers of sustainable BIM adoption in SMEs and the dynamics between these drivers in a BIM infant industry of developing countries. The study of innovations such as BIM is highly contextual [46], thus, Nigeria a developing and BIM infant industry is adopted as a case study. This study draws from theoretical lenses of technology, organization and environment framework (TOE) [47], institutional theory [48] and innovation diffusion theory (IDT) [49]. These theoretical lenses are well-suited as they are organizational level theories which are in tandem with this present study. The innovation diffusion theory (IDT) has been said to be well suited for studying BIM adoption [39] and delineates the stages of innovation as awareness, interest, decision (adoption), implementation, and confirmation [49]. Also, relative advantage, compatibility, complexity, tribality and observability are identified as the characteristics that affect innovation diffusion. The major criticism is that it focuses on the technology context of innovation [50] and ignores the organizational and environmental factors. Thus, the lapse of the IDT is complimented by the adopted institutional theory which emphasized the roles of the external environment. According to institutional theory, the isomorphic pressures acting on the organization from the environmental context are mimetic, coercive, and normative pressure [48,51]. The technology, organization, environment framework, on the other hand, is also well suited for new technology in SMEs as it assumed that the firms are merely passive victims of technology, which better describes smaller industry players like the SMEs [52]. A theory mining review of these innovation theories and other theories revealed underlined contexts of individual (organization) characteristics, innovation characteristics (technology), and contextual characteristics (internal and external environmental factors) [53]. Thus, the adopted lenses will be synthesized and use to frame this study.
These lenses enable this study to benefits from the internal and external context of innovation as against many extant innovation studies that often overlook the influence of external drivers and are much focused on internal drivers from a positivist perspective [54]. Also, this would enable this study to benefit from seminal studies that have built on a robust body of knowledge from communications, sociology and psychology to explain innovation [55]. Neglecting theories in studies of innovation ‘seem irrational’ and might result in ‘overlooking many aspects of innovations in any field including construction’ [54].
Innovation studies could be at the industry level, firm-level, and project level. Studies have often emphasized the need to differentiate between innovation levels as innovation are adopted at the firm level and implemented at the project level. This study is a firm-level view of innovation as Sexton, And and Aouad [34] opined that ‘Companies, not projects, are the only credible focus for change in the construction industry’. Project teams are often temporary and project innovation are often specific which might make adopting the same innovation on different projects difficult; established innovations at the firm level are more sustainable than project innovations with temporary teams [56]. It is also noteworthy that SMEs in developing countries often have the same identity as the project in the sense that they do not many projects at hand unlike the large firms, thus, they tend to focus on the few projects they have at hand and the firm’s influence is felt. Also, firms are the focus of the few extant studies on BIM in SMEs.
The main objectives of this study are: (a) To identify the major drivers of sustainable adoption of BIM in SMEs; (b) to assess the interrelationship of the drivers in developing countries; (c) prioritize these drivers based on their dynamics; and (d) to categorize these drivers for easy intervention. Interpretive Structural Modelling (ISM) approach will be employed in this study. This study is significant and indispensable because identifying the major drivers is one of the precursors of BIM proliferation in the SMEs [57]. Also, the study of BIM use in SMEs is an important mediator for widespread adoption in the AEC industry, and it has global significance and impact [4]. Hillebrandt [58] corroborated that the effect of a 5% increase in the productivity of the SMEs will equate to the effect of a 20% increase in the productivity of the large firms. Lastly, the SMEs are an essential and distinct entity [59] that would continue dominating the construction industry [60].

2. Building Information Modelling (BIM) in the Nigerian Construction Industry

The Nigerian Construction Industry (NCI) is the largest in West Africa and plays a key role in the development of the country [61]. It employs approximately 25% of Nigeria’s workforce and contributed 3.72% to the real GDP in 2017 [62]. However, this sector is not performing up to expectation and it is being marred by many challenges such as low productivity, waste, low quality, cost overrun, rework, delay, project abandonment and conflicts [63]. This is a result of the fragmented nature of the industry coupled with ineffective communication/information management [64]. Kori and Kiviniemi [65] opined that the NCI stands to benefit from the implementation of BIM. However, the discussion on BIM in the Nigerian context is less than a decade, as the discussion just started in 2012. Review studies on the potential of adopting BIM in the NCI were carried out by Alufohai [66], Ibrahim and Bishir [67] and Munir and Jeffrey [68]. These early studies stressed the need for adopting and implementing BIM in the NCI and the associated benefits during the design stage, construction, and operation phases of construction projects. Extant studies revealed that the level of awareness and adoption of BIM in the industry is still low and facing many challenges such as lack of knowledge, lack of government support, and lack of implementation guidelines/strategies.
Abubakar, et al. [69] assessed the readiness of design firms in Nigeria to adopt BIM using the four readiness categories of management, people, process, and technology. It was revealed that the firms are ready to adopt BIM but are facing challenges such as lack of awareness among professionals and clients. Abubakar, Ibrahim, Kado and Bala [30] surveyed BIM barriers and drivers in the NCI. Availability of trained BIM professionals, affordability of BIM tools, and enabling environments are the most significant drivers while resistance to change, high cost of BIM and lack of enabling environment are hindering BIM in NCI. Dare-Abel, et al. [70] assessed the level of awareness of the architecture firms and concluded that there is an increase in the level of awareness of the firms. Awareness of NCI professionals have also been carried out in many studies [71,72,73,74,75,76,77] and the level of awareness has been increasing over the years. However, the level of awareness does not translate to increase in the level of implementation. The level of adoption and implementation of BIM by the professionals is still low and this is also reflected by studies [78,79,80,81] at the organization level.
Saka, Chan and Olawumi [26] noted that the emerging trend in these studies is the assumption that there are no differences between the SMEs and large firms, thus, they all adopted a singular view of BIM in the NCI. Despite the conclusion by Amuda-Yusuf [82] that the size of the organization influences the level of awareness and understanding of BIM in the NCI. Kori, et al. [83] revealed that the SMEs which are characterized with 0–199 employees, inadequate resources, and flexible structure is slow with the adoption of BIM in Nigeria. These SMEs represent 96% of the firms in Nigeria, and as such are the backbone of the economy. However, they are performing woefully [84]. The SMEs in the NCI are thus less competitive and struggle with innovation adoption.

BIM in SMEs

Empirical evidence in innovation studies have asserted that there is a significant relationship between the size of an organization and innovation adoption. Shefer and Frenkel [85] averred that those large firms tend to invest more in research and development compared to small firms that often invest less than 3% [35]. Although the studies revealed that this might varies across industries.
Audretsch and Acs [59] argued that the often contradictory findings of studies on innovation and size might be as a result of the approach often adopted which relies on large firms with few or no SMEs for comparison. Acs and Audretsch [86] corroborated that the large firms tend to have a relative advantage in innovation in industries that are capital intensive and produce different goods while small firms have a relative advantage in industries dominated by large firms and with large skilled labor. The construction industry, on the other hand, is different from other industries in terms of its production in which the product has long life cycle and are fixed in a geographical location [87]; and is dominated by the SMEs that are said to be less innovative because of their financial and technical capability [88]. These contributed to the innovation capability of the industry [89]. Innovation studies in the construction industry have also asserted that there seems to be a relationship between the firm size and the capability to innovate [90]. The large firms are often on the advantaged size because of the presence of organizational slack which permits them to try out innovation and because of their technical and financial ability. Despite all odds, there has been emerging evidence to suggest that small and medium-sized firms can innovate successfully in the construction industry.
The studies on BIM adoption and implementation have been often contradictory and vary from context to context [57]. Thus, there might be different findings from different countries, different discipline, and different firm sizes. Surprisingly, there are often contradictory findings from studies in the same context. Chen et al. [91] studied the adoption of BIM in the Chinese construction industry using the technology-organization-environment framework. The study revealed that the relative advantage of BIM and top management support are a major factor for BIM adoption in the Chinese firms and younger firms are more likely to innovate. It added that the engineering firms deemed organization readiness to be significant which is contrary to the view of construction firms. Surprisingly, the study did not find any significant consistency for environmental pressures on Chinese firms. However, these findings contradict extant findings from the same Chinese context. For instance, Xu et al. [92] built on TAM and concluded that complexity and relative advantage do not influence the user adoption decision. However, it was during the early phase of BIM adoption in China. Cao, Li and Wang [51] adopted institutional theory and revealed that coercive pressures and mimetic pressures which are environmental pressures to be significant on the adoption of BIM. Also, Ding, et al. [93] adopted the theory of reasoned action to study adoption indicators for architectural firms in China and revealed that management support is not significant for BIM adoption. Albeit the studies are from the same context, the findings are contradictory and could be partly explained by the different scope, and theoretical framework.
Similarly, Ahuja et al. [94] adopted the TOE framework to study the adoption of BIM in architectural firms in India. The study asserted that trialability, top management support, and BIM expertise (knowledge capability) are significant in BIM adoption. The study also argued the need to view BIM adoption as a multi-level social construct. However, the study revealed that there is no environmental pressure on BIM adoption which is in contrary to Juan et al. [95]. Juan, Lai and Shih [95] revealed that government policies, competitor pressures, financial incentive, and technological support influence the willingness of Taiwanese architectural firms to adopt BIM. Won et al. [96] argued that nontechnical organizational issues such as willingness to share information, BIM team, and collaboration are of high priority for the adoption of BIM at the organization level during the early adoption period. Ahmed and Kassem [97] supported the argument that adoption of BIM is a socio-technical process that is affected by the BIM characteristics (relative advantage and compatibility), the internal environment (communication behavior, organization size, organizational readiness, and management support), and external environment (coercive pressures) in architectural firms in the UK. Son et al. [98] adopted TAM to assess factors affecting BIM adoption of Korean architects. Antecedents factors such as top management support, confidence in computer use, normative pressure and compatibility are identified as critical factors mediated by perceived ease of use and or perceived usefulness.
Overall, these studies have highlighted varying factors affecting BIM adoption. However, there has been no general agreement in the literature and most of the factors are often from the perspective of large. There is a need for contextual studies of the identified factors on BIM innovation diffusion.

3. Research Methods

A three-stage approach was adopted to achieve the objectives of this study as shown in Figure 1.
  • Stage I: A comprehensive desktop search was conducted using some search engines such as Web of Science (WOS) which ‘consists of important and influential journals in the world’ [99,100]; Scopus, which has been said to have a wider coverage [101]; Google Scholar; and Science Direct. The search query “BIM” and “SME” and “BIM” and “Small firm” was used on the search engines, and both journal articles and conference papers were considered as BIM adoption in SMEs is still at an infant stage of development, also to avoid publication bias. The initial outputs were refined using language and field as this is the common practice in related studies. Citation tracking was carried out using the reference list of the previous outputs until ‘saturation point’[102]. A total of 55 papers that specifically address BIM from the perspective of SMEs was the result of the search. These papers were reviewed to identify the major drivers of sustainable adoption of BIM in SMEs.
  • Stage II: Drawing from the theoretical lenses of institutional theory, innovation diffusion theory and technology organization framework, similar drivers were synthesized. The synthesized drivers’ list was presented to four experts (2 industry experts and 2 academic researchers) with extensive hands-on experience on BIM in SMEs. The two industry experts and two academic researchers were invited for participation in the pilot survey to review and validate the adequacy, clarity and relevance of the identified items on the draft survey form before the launch of the main survey, and their inputs were not used to formulate any conclusions. A point worthy of note is that the Interpretive Structural Modelling (ISM) survey does not require a large number of respondents unlike the normal surveys and this applies to the pilot survey as well (see Ravi and Shankar [103], Mitra Debnath and Shankar [104], Shen, Song, Wu, Liao and Zhang [105], Liu, Li, Bian, Song and Xiahou [106] and Ahuja, Sawhney and Arif [94]). A mix of industry experts and academic researchers were adopted to achieve a balanced view of the two sides of the divide. These two selected industry experts have gained extenstive hands-on working experience in BIM and SMEs while the two selected academic researchers have acquired abundant research expertise in BIM and SMEs. Suggested corrections and recommendations were reviewed and incorporated in the identified drivers as deemed appropriate.
  • Stage III: The responses were analysed using interpretive structural modelling and Matrice d’Impacts croises-multipication applique a classement (MICMAC) technique. Figure 2 shows the ISM approach adopted for this study. The ISM method was developed by Warfield in 1974 [107]. It enables the study of the interrelationship in a complex system and gives insight to the direct and indirect relationships between the various factors in the system. It involves decomposing a complex system to various subsystems with experts’ experience, knowledge which would be used in developing a multi-level structural model that would clarify the complex relationships with clarity. The number of experts involves in ISM is usually low as the focus is on the quality of the responses rather than on the quantity of the respondents [105]. As a result of its high efficiency, the method has gained widespread adoption in analysing and studying variables in complex systems in construction management [94,105,106,108,109,110] and diverse areas. Similar methods for analysing factors such as mean score, weighted score, relative importance index, and severity index require data from a large number of respondents. Nevertheless, these methods do not present insight into the dynamics of the factors [105]. In areas such as BIM in SMEs of BIM infants with fewer experts as the adoption of BIM in the SMEs is still at the germinating stage would benefit from this approach. There has been no consensus on the number of respondents required for ISM in the literature. Ravi and Shankar [103] and Mitra Debnath and Shankar [104] consulted two experts; Shen, Song, Wu, Liao and Zhang [105] and Liu, Li, Bian, Song and Xiahou [106] consulted five experts, and seven experts were consulted by Ahuja, Sawhney and Arif [94]. The followings are the steps involved:
    • Step 1: Variables affecting the system under consideration are identified;
    • Step 2: Contextual relationship is established between the identified variables in Step 1;
    • Step 3: Structural Self-Interaction Matrix (SSIM) is developed for the variables which indicate the pairwise relationships among them;
    • Step 4: Reachability matrix is developed from the SSIM and the matrix is checked for transitivity. The transitivity is a basic assumption in ISM; it states that if variable A is related to variable B and B is related C, then A is necessarily related C;
    • Step 5: The reachability matrix is partitioned into different levels;
    • Step 6: A diagraph is developed based on the reachability matrix and hierarchy structure;
    • The ISM model is developed and checked for conceptual inconsistency.
Matrice d’Impacts croises-multipication applique a classement (MICMAC) technique is used in classifying of the variables under study based on the driving power and dependence [111]. It was developed by Duperrin and Godet [112] for classifying hierarchical factors into clusters in order to provide clarity as regards the dynamics between the factors.

4. Drivers of Sustainable Adoption of BIM in SMEs

Sustainable adoption relates to ‘confirmed adoption’ beyond the implementation stage of the innovation diffusion per Roger [49]. Sustainable adoption is necessary because some firms do drop out of the innovation process before the confirmation stage. Table 1 shows the synthesized and reviewed drivers from the literature. The drivers are categorized into technology context, external environment and internal environment.

4.1. Interpretive Structural Modelling (ISM) Approach

4.1.1. Structural Self-Interaction Matrix (SSIM)

This present study sent invites to 25 experts in the Nigerian Construction Industry by sending an email explaining the aim and objectives of the study to them and the approach to be adopted in the study. Only 16 experts accepted the invite and participated in the study. The number of respondents is deemed sufficient as the focus is on the quality of the responses, not the quantity and extant studies that adopted ISM often have lower responses. Table 2 shows the experts’ demographics.
The experts identified the contextual relationship between the drivers of BIM in SMEs using:
  • V = driver Di influences driver Dj and Dj does not influence Di;
  • A = driver Dj influences driver Di and Di does not influence Dj;
  • X = driver Di influences driver Dj and Dj influences Di;
  • O = drivers Di and Dj are unrelated.
The aggregated responses of the 16 experts are shown in Table 3 as a structural self-interaction matrix (SSIM). The aggregation was done using the ‘Minority gives way to the majority’ as per extant studies [105,113,114] to avoid subjectivism.

4.1.2. Initial Reachability Matrix

According to the principle of ISM, the SSIM was converted to an initial reachability matrix using the following rules:
(a)
If the cell entry is V in SSIM, cell i,j will be 1 and cell j,i will be 0 in the initial reachability matrix;
(b)
If the cell entry is A in SSIM, cell i,j will be 0 and cell j,i will be 1 in the initial reachability matrix;
(c)
If the cell entry is X in SSIM, cell i,j will be 1 and cell j,i will be 1 in the initial reachability matrix;
(d)
If the cell entry is O in SSIM, cell i,j will be 0 and cell j,i will be 0 in the initial reachability matrix.
Table 4 shows the initial reachability matrix of the drivers derived from the SSIM. For instance, cell D1/D7 is O in Table 3, thus according to rule d, cell D1/D17 is 0 and D17/D1 is 0 in Table 4. Similarly, cell D13/D17 is V in Table 3, and according to rule a, cell D13/D17 is 1 and D17/D13 is 0 in Table 4. The above rules a to d were applied to the Table 3 to have Table 4 using the instances cited.

4.1.3. Final Reachability Matrix of the Drivers Derived from the SSIM

The initial reachability matrix is check for transitivity based on the procedures of ISM. Transitivity is a fundamental assumption in ISM which avers that if A is equal to B and B is equal to C, then A will be equal to C. A Python function (shown below) was used to check for transitivity (Xiang, 2013).
  • deftransitivity (matrix):
    • result = ""
    • length = len(matrix)
    • for i in range(0, length):
      • for row in range(0, length):
        • for col in range(0, length):
          • matrix [row] [col] = matrix [row][col] or (matrix[row][i] and matrix[i][col])
      • result += ("\n W" + str(i) +" is: \n" + str(matrix).replace("]," , "] \n") + "\n")
    • result += ("\n Final Reachability Matrix is \n" + str(matrix).replace("]," , "]\n"))
    • print (result)
    • return result
Table 5 shows the outputs from the Python function which checked for the transitivity.

4.1.4. Hierarchical Structure of the Drivers Derived from the SSIM

In order to partition the drivers to different levels, the reachability set, antecedent set, and the intersection set is identified for each of the drivers using the final reachability matrix. The reachability set for a driver consists of the driver itself and any other drivers with a value of 1 in the corresponding row. Similarly, antecedent set consist of the driver itself and other drivers with a value of 1 in the corresponding column. The intersection set consist of common items (drivers) in both the reachability and antecedent sets. Table 6 shows the reachability set, antecedent set, and intersections for all the drivers using the final reachability matrix. Drivers with the same reachability set and intersection set are to be partitioned to the same level. Only D14 (Organization readiness) is partitioned to level I as shown in Table 6. This is because the reachability set ‘14’ is the same as the intersection set ‘14’. The member ‘14’ would be deleted from the next iteration completely as shown in Table 7.
Partitioned drivers are removed from the iteration and the reachability set, antecedent set, and the intersection are identified again. Table 7 shows the new sets after removing the partitioned driver (D14). Drivers that have their reachability set as the same as their intersection set are to be partition to the same level during each iteration. D13 ‘Top management support’, D15 ‘Adequate financial resources’, D16 ‘Appropriate Organization culture’, and D17 ‘Organizational structure’ are partitioned to level II as shown in Table 7. This is because the reachability set for D13 is ‘13, 16, 17’; D15 reachability set ‘15’; D16 reachability set ‘13, 16, 17’; and D17 reachability set ‘13, 16,17’ are all the same with their respective intersection set. The members ‘13, 15, 16, and 17’ would be deleted from the next iteration completely as shown in Table 8.
Drivers at levels I and II are removed from the new iteration to have Table 8. ‘Perceived ease of use’ and ‘Compatibility’ are partitioned to level III as shown in Table 8. This is because the reachability set for D2 is ‘2’ and D3 reachability set ‘3’ are all the same with their respective intersection set. The members ‘2 and 3’ would be deleted from the next iteration completely as shown in Table 9.
Partitioned drivers at levels I, II, and III are removed from the iteration. ‘Low level of complexity’, ‘Client demand’, ‘Government mandate’, ‘Adoption by competitors’, ‘Institutional bodies’, ‘Collaborative procurement and adaptive methods’ and ‘High awareness by the various stakeholders’ are partitioned to level IV as shown in Table 9. This is because the reachability set for D4 is ‘4’; D6 reachability set ‘6,7,8,9,10,12’; D7 reachability set ‘6,7,8,9,10,12’; and D8 reachability set ‘6,7,8,9,10,12’; D9 reachability set ‘6,7,8,9,10,12’; D10 reachability set ‘6,7,8,9,10,12’; and D12 reachability set ‘6,7,8,9,10,12’ are all the same with their respective intersection set. The members ‘4,6,7,8,9,10’ and 12’ would be deleted from the next iteration completely as shown in Table 10.
The last iteration revealed that ‘Perceived usefulness’, ‘Tangible benefits’ and ‘Push by software vendors in the market’ have their reachability set to be the same as their intersection. Thus, they are partitioned to level V as shown in Table 10. This is because the reachability set for D1 is ‘1’; D5 reachability set ‘5’ and D11 reachability is ‘11’ are all the same with their respective intersection set.
Figure 3 shows the ISM approach based hierarchical structure obtained from the previous drivers partitioning.

4.2. Matrice d’Impacts Croises-Multipication Applique a Classement (MICMAC) Analysis

The MICMAC analysis was computed using the dependence power and the driving force for each of the drivers as shown in Table 11. The dependence power is the sum of all the values in a row for a driver using the final reachability matrix table and the driving power is the sum of all values in a column for a driver using the final reachability matrix table
The dependence power and driving force are used to plot the diagrap as shown in Figure 4.
The diagrap categorized the drivers into four groups as follows:
(a)
Autonomous drivers: These are drivers with weak driving power and weak dependence power. The autonomous drivers include perceived ease of use (D2) and low level of complexity (D4). They have a few links and often disconnected from the main system;
(b)
Dependent drivers: These are drivers with strong dependence power and weak driving power. They include perceived usefulness (D1), benefits observability (D5), and push by software vendors (D11). As they depend on other drivers, they can be influenced by addressing other drivers;
(c)
Independent drivers: These are drivers with the strong driving force and weak dependence force. They include compatibility (D3), top management support (D13), organization readiness (D14), adequate financial resources (D15), appropriate organization culture (D16), and organizational structure (D17). These are considered as the most important drivers;
(d)
Linkage drivers: These are drivers with strong driving and dependence power. They include client demand (D6), government mandate (D7), adoption by competitors (D8), institutional bodies (D9), collaborative procurement and adaptive methods (D10), and awareness of the various stakeholders (D12). These drivers drive themselves and have feedback effects on other drivers.

5. Discussion of Results

Most construction sectors in developing countries are BIM infant industries that are still struggling with BIM adoption and Implementation. These BIM infants are facing challenges ranging from innovation characteristics to internal and external contexts. A major challenge is the lack of government support for BIM in most of these countries as seen in some developed countries.
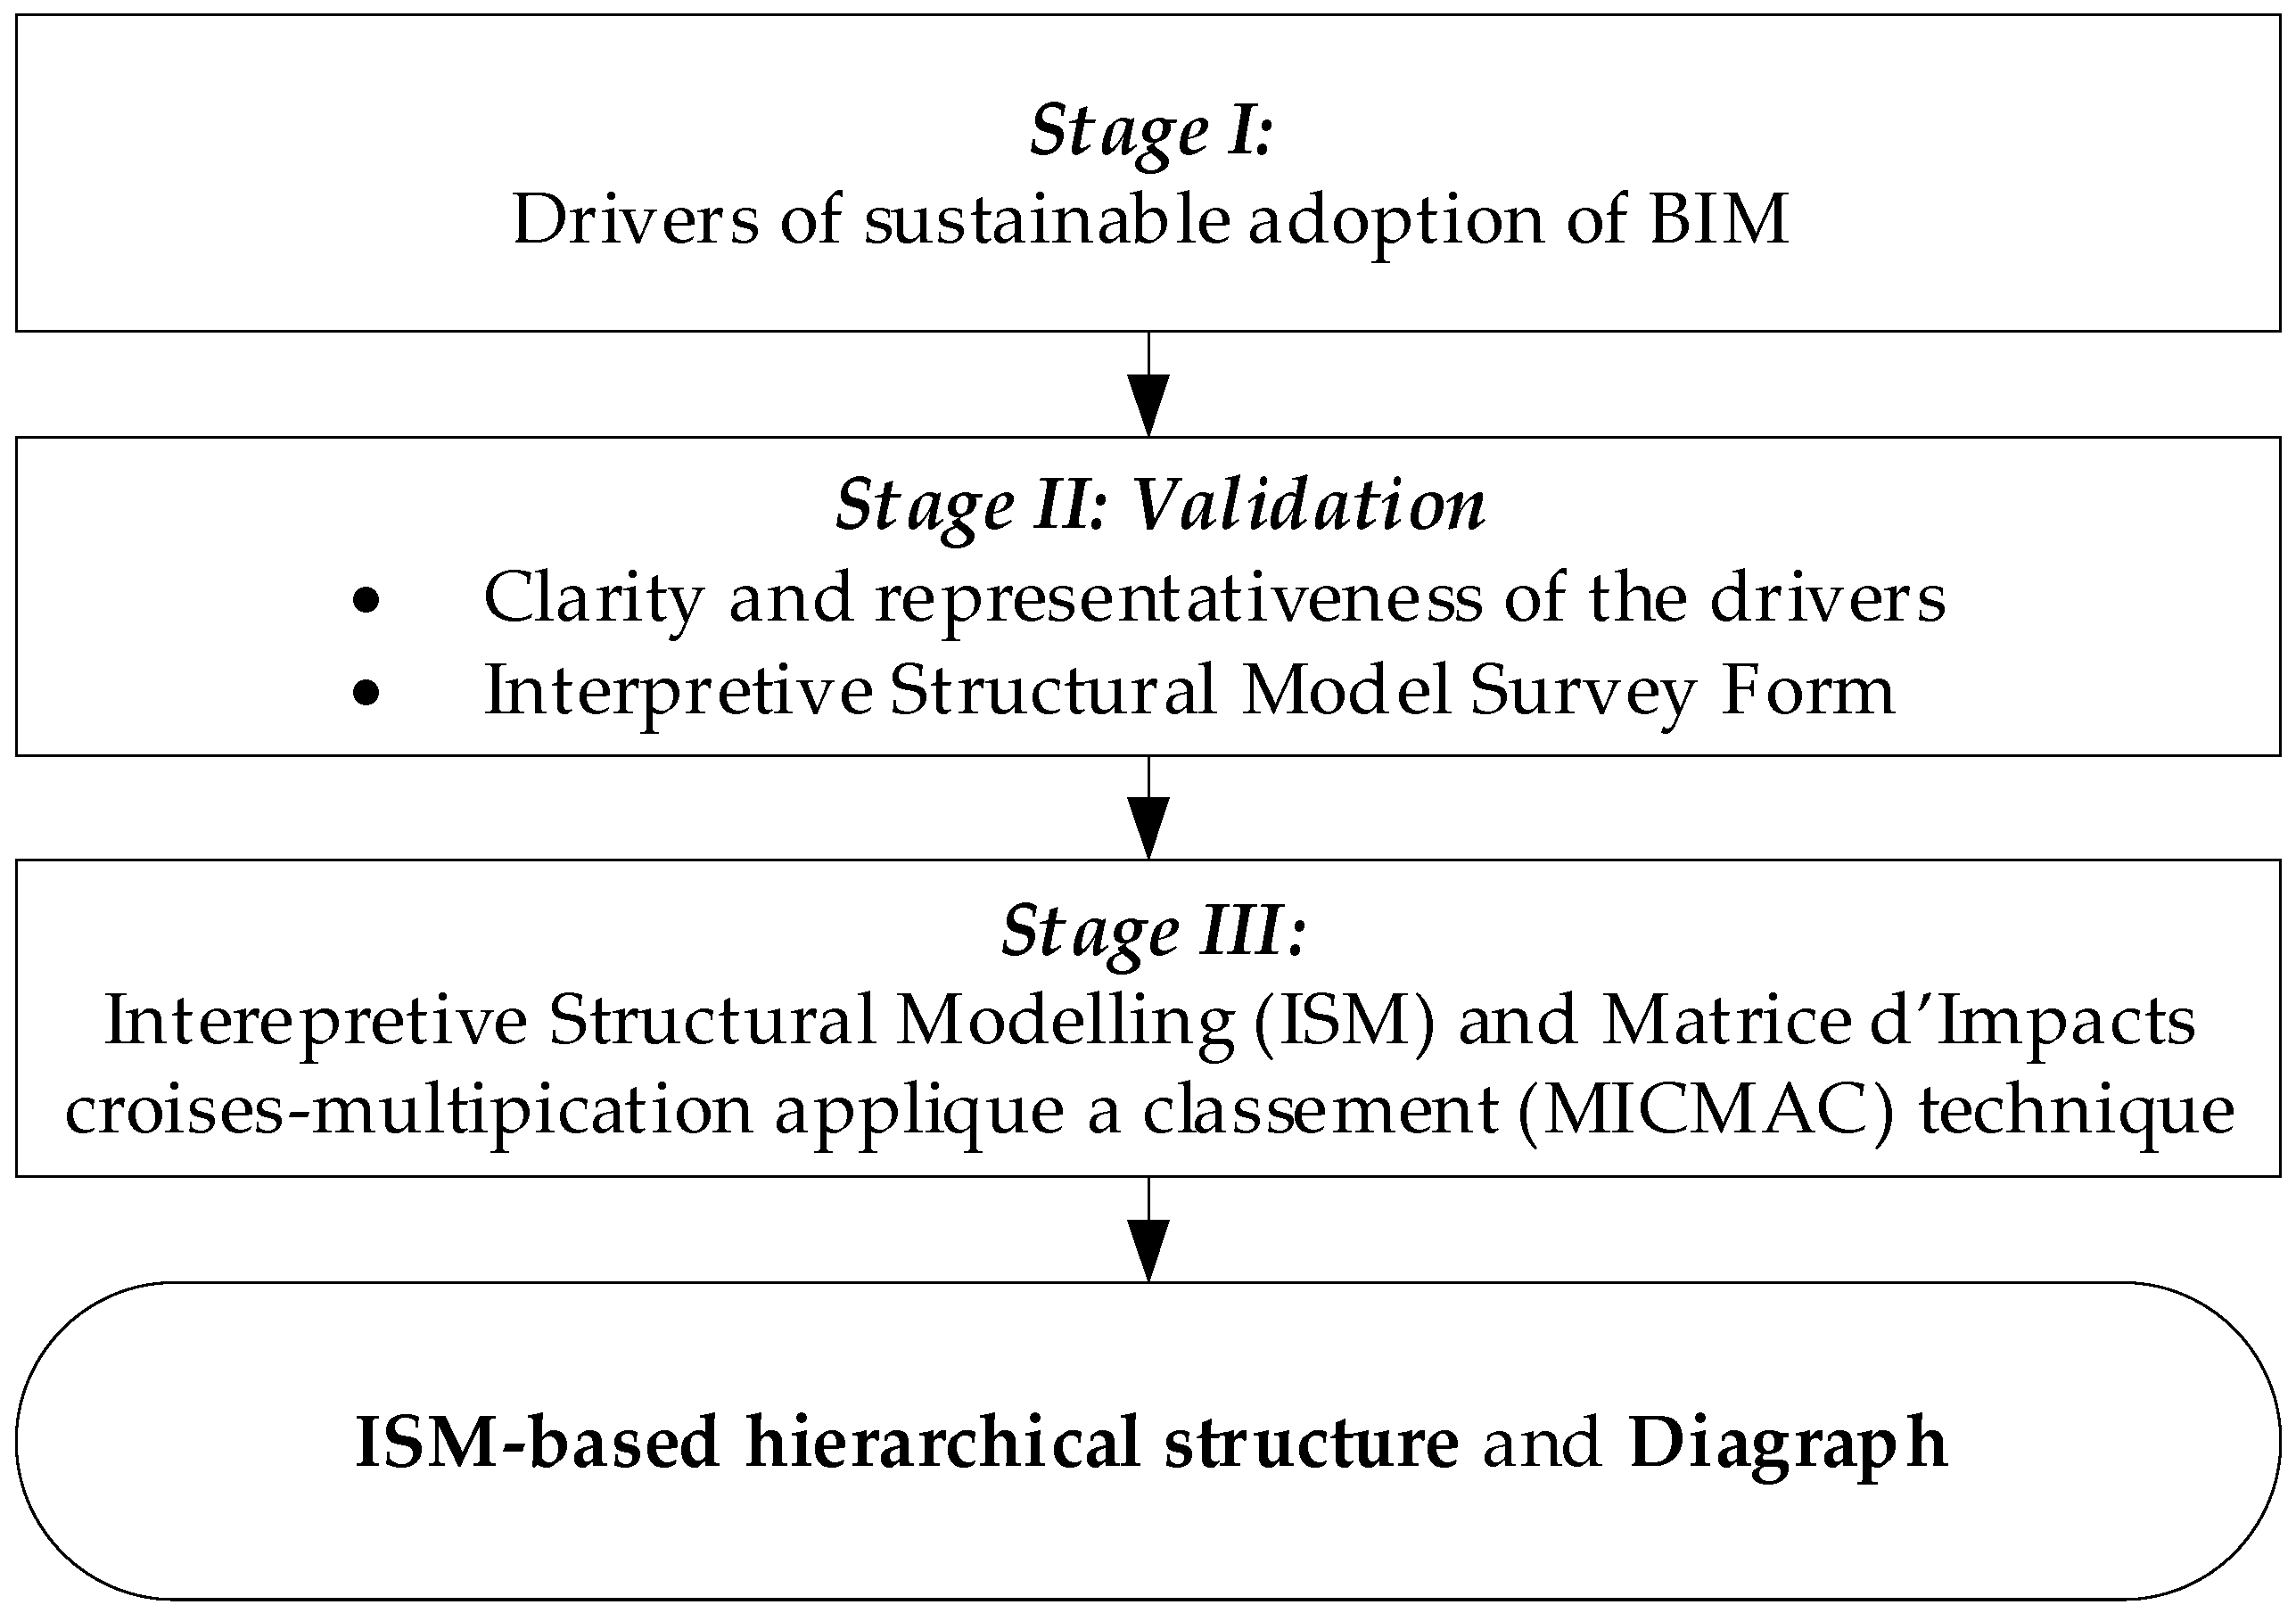
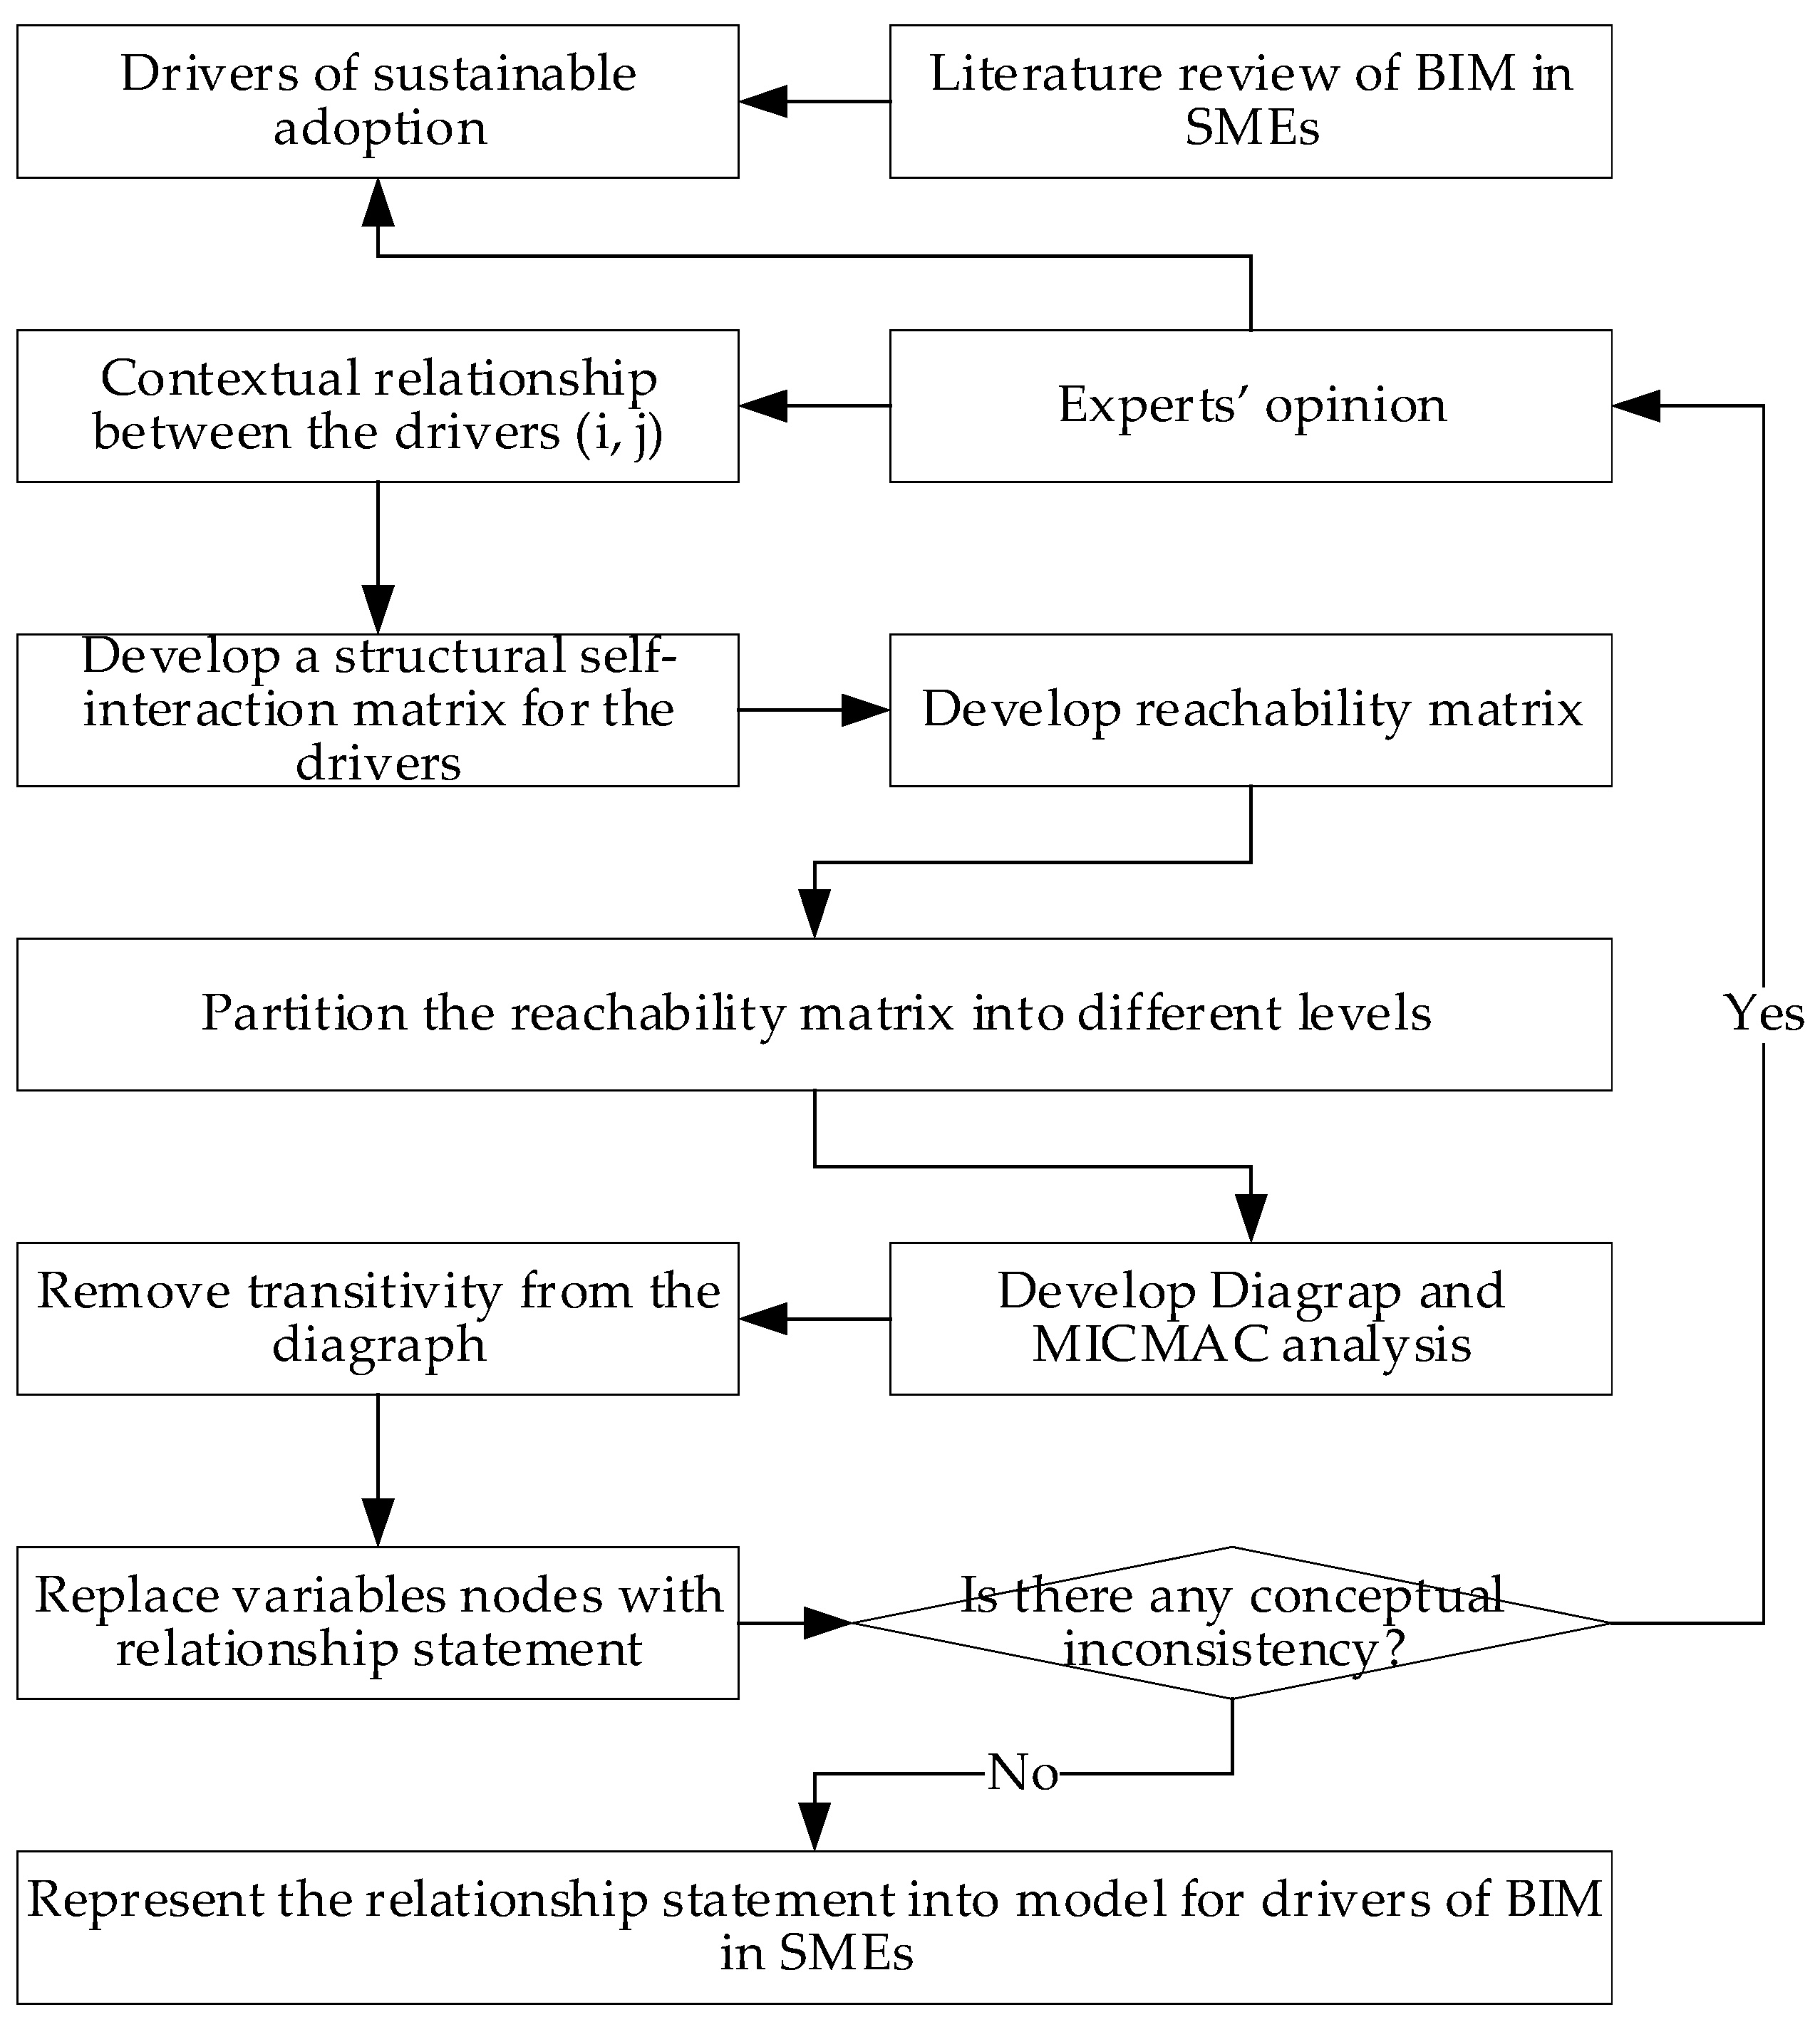
In the case of Nigeria, the construction small and medium-sized enterprises which are the backbone of the economy are at the receiving end because of their characterized features. They are characterized with lack of resources, a small number of employees, and lacks innovation adoption which have often been posited as making BIM adoption difficult for the SMEs. This present study evaluates the major drivers that could lead to sustainable adoption of BIM in Nigeria from the perspective of the SMEs. Drivers were identified, reviewed, and synthesized into 17 major drivers using the theoretical lenses of innovation diffusion theory, institutional theory, and technology organization and environment framework. BIM experts from the Nigerian construction SMEs were consulted to help identify the dynamics and the relationship among the drivers using the interpretive structural modelling (ISM) technique. This technique decomposes a complex system into various subsystems for easy intervention. Five (5) levels were identified hierarchically using the ISM principle with the importance of the levels in descending order. Thus, drivers at the level I are more important than the drivers at level V.
Organization readiness is the only partitioned driver in level I of the ISM model and this shows the significance of the firms’ readiness in driving BIM adoption in the SMEs. This result suggests that the major driver of BIM in Nigeria is the internal will of the firm in the absence of government mandate. It resonates with Abubakar, Ibrahim and Bala [69] that the firms need to be people, process, technology, and management ready in order to adopt BIM sustainably. The level II of the ISM model consists of top management support, adequate financial resources, organic structure and appropriate culture. This shows that the top management staff in SMEs are crucial to the decision to adopt BIM, which is logical because the top management staff may be a sole proprietor or a small number of individuals whose decision is final. Also, an adequate financial resource is important because the SMEs lacks access to financial resources and the cost of BIM implementation (cost of BIM tools and staff training) is high. Thus, most SMEs see BIM as risky and are unwilling to adopt BIM which is in tandem with the findings of Saka, Chan and Siu [45]. Consequently, an adequate financial resource will lead to BIM affordability for the SMEs [30]. Also, appropriate culture would ensure that there is no resistance to change and organic structure would make the BIM process (change) easier because of the firms’ flexibility [36].
Level III consists of perceived ease of use of BIM tools and compatibility of the BIM tool with the SMEs job practice. These drivers are technology characteristics that are important for BIM adoption because when the SMEs perceived that BIM tools are easy to use and it is applicable for use on their projects as against the perception that BIM is meant for large firms [108], they will likely embrace it. Level IV consists of government mandate, competitors, client demand, institutional bodies, collaborative approaches, and low complexity of the BIM tools. This suggests that a combination of both technology characteristics, internal and external context drivers are also necessary to drive BIM. This corroborates Sexton, And and Aouad [34] that effective technology transfer entails interaction between the technology, the firm, and the external environment. The last level (level V) on the other hand consists of the push by software vendors, perceived usefulness and observability of benefits. Albeit these drivers are also important, however, this ISM indicates that they may not be able to drive sustainable adoption of BIM in the Nigerian SMEs effectively as compared with other drivers. This is logical because the SMEs are often hard to reach and the push by software vendors are often targeted at the large firms that have the financial means to invest in BIM. Also, the tangibility of BIM benefits is not a major driver of BIM as currently seen in the AEC where most of the BIM benefits are non-tangible but there is still an increase in BIM adoption. In essence, BIM benefits are mostly nontangible at the early stage of the implementation and this does not resonate well with the SMEs that often prefer to invest in innovation that would contribute to business within a short period [34]. This is reflected in their perception that BIM is not applicable to their projects compared to the large firms [39].
The MICMAC analysis categorized the drivers into four categories of drivers. These categories are autonomous, independent, dependent and linkage drivers. The autonomous drivers have few links in the system and consist of the perceived ease of use, and complexity of the BIM tools. Perceived usefulness, observability of benefits and push by software vendors are grouped into dependent drivers. This suggests that these drivers depend on other drivers which can easily influence them. For instance, stakeholders’ awareness would influence perceived usefulness and software vendors’ push. Also, clients’ demand and collaborative approaches could lead to the observability of BIM benefits in SMEs. The independent drivers are the most important drivers and consist of top management support, compatibility, organization readiness, adequate financial resource, appropriate organization culture, and organic structure. This is in tandem with the ISM model that partitioned organization readiness to level I of the major drivers. The independent drivers also corroborate Hong, Hammad, Sepasgozar and Akbarnezhad [36]. Similarly, top management support is also very important and resonates with the findings of Ogunmakinde and Umeh [77] in the Nigerian AEC industry. Due attention should be paid to these independent drivers as they are the major drivers of sustainable adoption of BIM in the Nigerian construction SMEs. Linkage drivers, on the other hand, include client demand, government mandate, adoption by competitors, institutional bodies, collaborative approaches, and stakeholders’ awareness. These linkage drivers are sensitive as they have feedback effects on other drivers. For instance, clients’ demand for BIM on construction projects would lead to top management support and may also lead to available resources for BIM implementation. Similarly, government mandate would force SMEs that are working either as a main contractor or subcontractor on public projects to be BIM compliant. Also, adoption by competitors in the industry might have an influence on the firm management to adopt BIM in order to be able to compete. Lastly, an increase in stakeholders’ awareness would influence top management, organization readiness and organization culture.

6. Conclusions

The need for sustainable adoption of BIM in the SMEs of developing countries cannot be overemphasized because they have innate potentials and represent the backbone of the economy. Sustainable adoption of BIM in the Nigerian SMEs is necessary in order to bridge the digital divide between the SMEs and the large firms that are BIM compliant. It is also necessary for the integration of the fragmented construction industry which has been causing many intractable problems in the sector. This present study identified the major drivers of BIM in the Nigerian SMEs and adopted an interpretive structural modelling approach using BIM experts input to determine the dynamics and the relationship among the drivers. The ISM model ranked the drivers in hierarchical levels using the experts’ responses and the results indicate that the major driver of BIM is the organization readiness. The model also portrays the need to view BIM adoption in the context of technology characteristics, internal and external contexts because the SMEs cannot operate in a vacuum. The MICMAC analysis, on the other hand, categorized the drivers into four major categories with different characteristics. This categorisation presents the drivers in more reflective light and identifies the drivers that are of utmost importance, the sensitive drivers and the drivers that can be easily influenced by other drivers. This would make intervention easy for policymakers and stakeholders interested in sustainable adoption of BIM in the Nigerian construction SMEs.
This study is of paramount importance because it considers BIM from the perspective of the SMEs which is found missing in the few extant BIM studies in BIM infant countries. It adopted organization theoretical lenses to frame the study in order to reap benefits from these rich theories that have been developed from diverse bodies of knowledge. The study adopted the ISM approach to show the dynamics of the drivers as against the prevailing approaches of mean score, relative importance index and other similar approaches. It set the scene for dynamic simulation of the effects of these drivers on BIM adoption in the SMEs of developing countries. Also, the pace of BIM adoption in developing countries can be easily influenced by the identified drivers for SMEs because they are the backbone of the economy and a BIM compliant construction SMEs is a BIM compliant construction sector.
Only 16 experts responded to the questionnaire survey which may serve as a limitation of the study, however, the ISM focus is on experts that are knowledgeable and experienced in the subject matter and not on the quantity of the experts. Similarly, there are many drivers of BIM adoption in SMEs based on the literature, however, the present study groups them into 17 major drivers and 3 contexts; and these major drivers can be decomposed into subdrivers of BIM if necessary.

Author Contributions

Conceptualization: A.B.S. and D.W.M.C.; Software: A.B.S., D.W.M.C. and F.M.F.S.; Formal analysis: A.B.S.; Investigation: A.B.S.; Writing—original draft preparation: A.B.S.; Validation: D.W.M.C. and F.M.F.S.; Resources: A.B.S., D.W.M.C. and F.M.F.S.; Writing—review and editing: D.W.M.C., and F.M.F.S.; Supervision: D.W.M.C. and F.M.F.S. Project administration: D.W.M.C., and F.M.F.S. All authors have read and agreed to the published version of the manuscript.

Funding

This research study was fully supported through funding of the full-time PhD research studentship under the auspice of the Department of Building and Real Estate, The Hong Kong Polytechnic University, Hong Kong. The current study was accomplished as part of a PhD research programme.

Conflicts of Interest

The authors declare no conflict of interest.

References

  1. Dubois, A.; Gadde, L.-E. The construction industry as a loosely coupled system: Implications for productivity and innovation. Constr. Manag. Econ. 2002, 20, 621–631. [Google Scholar] [CrossRef]
  2. Latham, M. Constructing the Team: Joint Review of Procurement and Contractual Arrangements in the UK Construction Industry; Her Majesty’s Stationary Office (HMSO): London, UK, 1994.
  3. Egan, J. Rethinking Construction: Report of the Construction Task Force on the Scope for Improving the Quality and Efficiency of UK Construction; Department of the Environment, Transport and the Regions: London, UK, 1998. [Google Scholar]
  4. Dainty, A.; Leiringer, R.; Fernie, S.; Harty, C. BIM and the small construction firm: A critical perspective. Build. Res. Inf. 2017, 45, 696–709. [Google Scholar] [CrossRef] [Green Version]
  5. Eastman, C.; Teicholz, P.; Sacks, R.; Liston, K. BIM Handbook: A Guide to Building Information Modeling for Owners, Managers, Designers, Engineers and Contractors; John Wiley & Sons.: Hoboken, NJ, USA, 2011. [Google Scholar]
  6. The National Building Information Model Standard Project Committee. National Building Information Model Standard NBIMS; The National Institute of Building Sciences: Washington, DC, USA, 2007. [Google Scholar]
  7. Succar, B. Building information modelling framework: A research and delivery foundation for industry stakeholders. Autom. Constr. 2009, 18, 357–375. [Google Scholar] [CrossRef]
  8. Azhar, S. Building Information Modeling (BIM): Trends, Benefits, Risks, and Challenges for the AEC Industry. Leadersh. Manag. Eng. 2011, 11, 241–252. [Google Scholar] [CrossRef]
  9. Bryde, D.; Broquetas, M.; Volm, J.M. The project benefits of Building Information Modelling (BIM). Int. J. Proj. Manag. 2013, 31, 971–980. [Google Scholar] [CrossRef]
  10. Eastman, C.; Liston, K.; Sacks, R.; Liston, K. BIM Handbook: A Guide to Building Information Modeling for Owners, Managers, Designers, Engineers and Contractors; Wiley Publishing: Hoboken, NJ, USA, 2008; p. 2007029306. [Google Scholar]
  11. Donahue, C. The BIM Revolution: The Top 3 Benefits of Using BIM in Construction. Available online: https://goo.gl/lnQWVX (accessed on 1 May 2019).
  12. Throssell, D. Barts & London Hospital—BIM Projects. Available online: https://goo.gl/8xVu5Y (accessed on 1 May 2019).
  13. Migilinskas, D.; Popov, V.; Juocevicius, V.; Ustinovichius, L. The Benefits, Obstacles and Problems of Practical Bim Implementation. Procedia Eng. 2013, 57, 767–774. [Google Scholar] [CrossRef] [Green Version]
  14. Olugboyega, O. Building Information Modelling-Based Projects in Nigeria Evidences from Eko Atlantic City. PM World J. 2016, 10, 1–14. [Google Scholar]
  15. Poirier, E.A.; Staub-French, S.; Forgues, D. Measuring the impact of BIM on labor productivity in a small specialty contracting enterprise through action-research. Autom. Constr. 2015, 58, 74–84. [Google Scholar] [CrossRef]
  16. Poirier, E.; Staub-French, S.; Forgues, D. Embedded contexts of innovation: BIM adoption and implementation for a specialty contracting SME. Constr. Innov. 2015, 15, 42–65. [Google Scholar] [CrossRef]
  17. Arayici, Y.; Coates, P.; Koskela, L.; Kagioglou, M.; Usher, C.; O’Reilly, K. Technology adoption in the BIM implementation for lean architectural practice. Autom. Constr. 2011, 20, 189–195. [Google Scholar] [CrossRef]
  18. NBS. National BIM Report; NBS: Mandaluyong, Philippines, 2018. [Google Scholar]
  19. Construction, M.H. The Business Value of BIM for Construction in Major Global Markets; Smart Market Report: New York, NY, USA, 2015. [Google Scholar]
  20. Edirisinghe, R.; London, K. Comparative Analysis of International and National Level BIM Standardization Efforts and BIM Adoption; CIB W78: London, UK, 2015. [Google Scholar]
  21. Wong, A.K.D.; Wong, F.K.W.; Nadeem, A. Government roles in implementing building information modelling systems. Constr. Innov. 2011, 11, 61–76. [Google Scholar] [CrossRef]
  22. Ayinla, K.O.; Adamu, Z. Bridging the digital divide gap in BIM technology adoption. Eng. Constr. Archit. Manag. 2018, 25, 1398–1416. [Google Scholar] [CrossRef]
  23. Olawumi, T.; Chan, D.W.M. Development of a benchmarking model for BIM implementation in developing countries. Benchmarking: Int. J. 2019, 26, 1210–1232. [Google Scholar] [CrossRef]
  24. Bui, N.; Merschbrock, C.; Munkvold, B.E. A Review of Building Information Modelling for Construction in Developing Countries. Procedia Eng. 2016, 164, 487–494. [Google Scholar] [CrossRef]
  25. Jayasena, H.S.; Weddikkara, C. Assessing the BIM maturity in a BIM infant industry. In Proceedings of the Second World Construction Symposium: Socio-Economic Sustainability in Construction, Colombo, Sri Lanka, 14–15 June 2013. [Google Scholar]
  26. Saka, A.B.; Chan, D.W.M.; Olawumi, T.O. A Systematic Literature Review of Building Information Modelling in the Architecture, Engineering and Construction Industry—The Case of Nigeria. In Proceedings of the Environmental Design and Management International Conference 2019 (EDMIC 2019) on Drivers and Dynamics of Change in the Built Environment, Ile-Ife, Nigeria, 20–22 May 2019; Obafemi Awolowo University: Ile-Ife, Nigeria, 2019; pp. 728–6488. [Google Scholar]
  27. Saka, A.B.; Olaore, F.; Olawumi, T.O. Post-contract material management and waste minimization: An analysis of the roles of quantity surveyors. J. Eng. Des. Technol. 2019, 17, 793–807. [Google Scholar] [CrossRef]
  28. Bello, A.M.; Saka, A.B. Impact of variation on project delivery in Oyo state. World Sci. News 2017, 86, 265–282. [Google Scholar]
  29. Saka, A.B.; Chan, D.W.M. A global taxonomic review and analysis of the development of BIM research between 2006 and 2017. Constr. Innov. 2019, 19, 465–490. [Google Scholar] [CrossRef]
  30. Abubakar, M.; Ibrahim, Y.M.; Kado, D.; Bala, K. Contractors Perception of the Factors Affecting Building Information Modelling (BIM) Adoption in the Nigerian Construction Industry. In Proceedings of the Computing in Civil and Building Engineering, Orlando, FL, USA, 23–25 June 2014; pp. 167–178. [Google Scholar]
  31. Olugboyega, O.; Aina, O.O. Analysis of Building Information Modelling Usage Indices and Facilitators in the Nigerian Construction Industry. J. Logist. Inf. Serv. Sci. 2016, 3, 1–36. [Google Scholar]
  32. Saka, A.B.; Chan, D.W.M. A Scientometric Review and Metasynthesis of Building Information Modelling (BIM) Research in Africa. Buildings 2019, 9, 85. [Google Scholar] [CrossRef] [Green Version]
  33. Lam, T.T.; Mahdjoubi, L.; Mason, J. A framework to assist in the analysis of risks and rewards of adopting BIM for SMEs in the UK. J. Civ. Eng. Manag. 2017, 23, 740–752. [Google Scholar] [CrossRef] [Green Version]
  34. Sexton, M.; And, P.B.; Aouad, G. Motivating small construction companies to adopt new technology. Build. Res. Inf. 2006, 34, 11–22. [Google Scholar] [CrossRef]
  35. O’Regan, N.; Ghobadian, A. Innovation in SMEs: The impact of strategic orientation and environmental perceptions. Int. J. Product. Perform. Manag. 2005, 54, 81–97. [Google Scholar] [CrossRef]
  36. Hong, Y.; Hammad, A.W.; Sepasgozar, S.; Nezhad, A.A. BIM adoption model for small and medium construction organisations in Australia. Eng. Constr. Arch. Manag. 2019, 26, 154–183. [Google Scholar] [CrossRef]
  37. Garcia, A.J.; Mollaoglu, S.; Syal, M. Implementation of BIM in Small Home-Building Businesses. Pr. Period. Struct. Des. Constr. 2018, 23, 04018007. [Google Scholar] [CrossRef]
  38. Hosseini, M.R.; Pärn, E.A.; Edwards, D.J.; Papadonikolaki, E.; Oraee, M. Roadmap to Mature BIM Use in Australian SMEs: Competitive Dynamics Perspective. J. Manag. Eng. 2018, 34, 05018008. [Google Scholar] [CrossRef]
  39. Hosseini, M.R.; Banihashemi, S.; Chileshe, N.; Namzadi, M.O.; Udaeja, C.; Rameezdeen, R.; McCuen, T. BIM adoption within Australian Small and Medium-sized Enterprises (SMEs): An innovation diffusion model. Constr. Econ. Build. 2016, 16, 71. [Google Scholar] [CrossRef] [Green Version]
  40. Malacarne, G.; Toller, G.; Marcher, C.; Riedl, M.; Matt, D.T. Investigating benefits and criticisms of BIM for construction scheduling in SMES: An Italian case study. Int. J. Sustain. Dev. Plan. 2018, 13, 139–150. [Google Scholar] [CrossRef]
  41. Tranchant, A.; Beladjine, D.; Beddiar, K. Bim in french smes: From innovation to necessity. BIM 2017 2017, 1, 135–142. [Google Scholar]
  42. Construction, M.H. The Business Value of BIM in Australia and New Zealand: How Building Information Modelling is Transforming the Design and Construction Industry; Smart Market Report; McGraw Hill Construction: Bedford, MA, USA, 2014. [Google Scholar]
  43. Oladapo, A.A. The impact of ICT on professional practice in the Nigerian construction industry. Electron. J. Inf. Syst. Dev. Ctries 2006, 24, 1–19. [Google Scholar] [CrossRef]
  44. Pandya, V.M. Comparative analysis of development of SMEs in developed and developing countries. In Proceedings of the 2012 International Conference on Business and Management, Phuket, Thailand, 6–7 September 2012; pp. 426–433. [Google Scholar]
  45. Saka, A.B.; Chan, D.W.M.; Siu, F.M.F. Adoption of Building Information Modelling in Small and Medium-Sized Enterprises in Developing Countries: A System Dynamics Approach. In Proceedings of the CIB World Building Congress 2019 (WBC 2019) on ‘Constructing Smart Cities’, Hong Kong, China, 17–21 June 2019. (USB Electronic Proceedings under the Sub-Theme 03—Smart Planning, Design and Construction; Paper #50 with Reference Number: Ab0468; ISBN 978-962-367-821-6). [Google Scholar]
  46. Papadonikolaki, E. Grasping brutal and incremental bim innovation through institutional logics. In Proceedings of the 33rd Annual ARCOM Conference, Cambridge, UK, 4–6 September 2017; pp. 54–63. [Google Scholar]
  47. Tornatzky, L.G.; Fleischer, M.; Chakrabarti, A.K. The processes of technological innovation. In Issues in Organization and Management Series; Lexington Books: Lexington, KY, USA, 1990. [Google Scholar]
  48. DiMaggio, P.; Powell, W.W. The Iron Cage Revisited: Institutional Isomorphism and Collective Rationality in Organizational Fields. Am. Sociol. Rev. 1983, 48, 147. [Google Scholar] [CrossRef] [Green Version]
  49. Rogers, E.M. Diffusion of Innovations, 5th ed.; The Free Press, A Division of Simon and Schuster, Inc.: New York, NY, USA, 2003. [Google Scholar]
  50. Ishak, S.S.M.; Newton, S. An innovation resistance factor model. Constr. Econ. Build. 2016, 16, 87–103. [Google Scholar] [CrossRef] [Green Version]
  51. Cao, D.; Li, H.; Wang, G. Impacts of Isomorphic Pressures on BIM Adoption in Construction Projects. J. Constr. Eng. Manag. 2014, 140, 04014056. [Google Scholar] [CrossRef]
  52. Bosch-Sijtsema, P.; Isaksson, A.; Lennartsson, M.; Linderoth, H. Barriers and facilitators for BIM use among Swedish medium-sized contractors—“We wait until someone tells us to use it”. Vis. Eng. 2017, 5, 179. [Google Scholar] [CrossRef]
  53. Straub, E.T. Understanding Technology Adoption: Theory and Future Directions for Informal Learning. Rev. Educ. Res. 2009, 79, 625–649. [Google Scholar] [CrossRef] [Green Version]
  54. Hosseini, M.R.; Chileshe, N.; Zuo, J.; Baroudi, B. Adopting global virtual engineering teams in AEC Projects. Constr. Innov. 2015, 15, 151–179. [Google Scholar] [CrossRef]
  55. Kale, S.; Arditi, D. Diffusion of Computer Aided Design Technology in Architectural Design Practice. J. Constr. Eng. Manag. 2005, 131, 1135–1141. [Google Scholar] [CrossRef]
  56. Brewer, G. Guest Editorial. Constr. Econ. Build. 2016, 16, 57–58. [Google Scholar] [CrossRef] [Green Version]
  57. Gu, N.; London, K. Understanding and facilitating BIM adoption in the AEC industry. Autom. Constr. 2010, 19, 988–999. [Google Scholar] [CrossRef]
  58. Hillebrandt, P.M. Letter to the Editor. Constr. Manag. Econ. 2006, 24, 669–670. [Google Scholar] [CrossRef]
  59. Audretsch, D.B.; Acs, Z.J. Innovation and Size at the Firm Level. South. Econ. J. 1991, 57, 739–744. [Google Scholar] [CrossRef]
  60. Shelton, J.; Martek, I.; Chen, C. Implementation of innovative technologies in small-scale construction firms. Eng. Constr. Arch. Manag. 2016, 23, 177–191. [Google Scholar] [CrossRef]
  61. Olugboyega, O.; Aina, O.O. Correlation Analysis of Benefits of Building Information Modelling and Clients’ Requirements. J. Sci. Eng. Res. 2018, 5, 53–68. [Google Scholar]
  62. Danwata, D.D. Repositioning the construction industry for economic development. Daily Trust, 1 December 2017. [Google Scholar]
  63. Ayodele, E.O.; Alabi, O.M. Abandonment of Construction Projects in Nigeria: Causes and Effects. J. Emerg. Trends Econ. Manag. Sci. 2011, 2, 142–145. [Google Scholar]
  64. Olugboyega, O. Evaluation of building Information Modelling Usage in Construction Industry in Lagos State, Nigeria. Master’s Thesis, Department of Building Faculty of Environmental Design and Management, Obafemi Awolowo University, Osun, Nigeria, 2018. [Google Scholar] [CrossRef]
  65. Kori, S.A.; Kiviniemi, A. Toward Adoption of BIM in the Nigerian AEC Industry. In Proceedings of the 9th BIM Academic Symposium & Job Task Analysis Review, Washington, DC, USA, 7–8 April 2015. [Google Scholar]
  66. Alufohai, A.J. Adoption of Building Information Modeling and Nigeria’s Quest for Project cost management. Niger. Inst. Quant. Surv. 2012, 1, 6–10. [Google Scholar]
  67. Ibrahim, S.; Bishir, I.M. Review of using Building Information Modeling (BIM) in Nigerian Construction Industry. J. Environ. Sci. Policy Eval. 2012, 2, 52–62. [Google Scholar]
  68. Munir, M.; Jeffrey, H. Building Information Modelling (BIM): A summary of some UK experiences as guide to adoption in Nigeria. In Proceedings of the 1st NIQS Annual Research Conference, Abuja, Nigeria, 3–5 September 2013. [Google Scholar]
  69. Abubakar, M.; Ibrahim, Y.; Bala, K. An Assessment of Readiness of the Nigerian Building Design Firms to Adopt Building Information Modelling Technologies. In Proceedings of the Fifth International Conference for Construction Engineering and Project Management, ICCEPM, Anaheim, CA, USA, 10 January 2013. [Google Scholar]
  70. Dare-Abel, O.A.; Igwe, J.M.; Ayo, C.K. Proficiency and Capacity Building of Human Capital in Architectural Firms in Nigeria. Int. J. Archit. Des. 2014, 25, 1133–1139. [Google Scholar]
  71. Akerele, A.O.; Etiene, M. Assessment of the Level of Awareness and Limitations on the Use of Building Information Modeling in Lagos State. Int. J. Sci. Res. Publ. 2016, 16, 229–234. [Google Scholar]
  72. Ogunde, A.O.; Babalola, F.D.; Akinola, G.A.; Ogundipe, K.E.; Ademola, S.A.; Akuete, E.; Olaniran, H.F. The Utilization of Building Information Modeling In Nigerian: Construction Industry Challenges and Prospects. In Proceedings of the 29th International Business Information Management Association Conference, Vienna, Austria, 3–4 May 2017. [Google Scholar]
  73. Ebiloma, D.O.; Daibi-Oruene, W.D.; Bumaa, F.N. Application of Multiple Regressions on the Impact of Building Information Modelling Adoption Drivers on Sustainable Construction in Nigeria. Int. J. Innov. Sustain. 2017, 1, 22–31. [Google Scholar]
  74. Anifowose, O.M.; Babarinde, S.A.; Olanrewaju, O.I. Adoption Level of Building Information Modelling by Selected Professionals in Kwara State. Environ. Technol. Sci. J. 2018, 9. [Google Scholar] [CrossRef]
  75. Ruya, T.F.; Chitumu, Z.D.; Kaduma, L.A. Challenges of Building Information Modelling Implementation in Africa a Case of Nigerian Construction Industry. In Proceedings of the FIG Congress, Istanbul, Turkey, 6–11 May 2018. [Google Scholar]
  76. Amade, B.; Onwuka, U.S.; Oguzie, J.O.C.; Umoh, E.D.; Uduma, P.N. Building Information Modelling and its Application in Building Construction Projects. PM World J. 2018, 9, 1–21. [Google Scholar]
  77. Ogunmakinde, O., Emmanuel; Umeh, S. Adoption of BIM in the Nigerian Architecture Engineering and Construction (AEC) Industry. In Proceedings of the 42nd Australasian Universities Building Education Association (AUBEA), Singapore, 26–28 September 2018. [Google Scholar]
  78. Olapade, D.T.; Ekemode, B.G. Awareness and utilisation of building information modelling (BIM) for facility management (FM) in a developing economy. J. Facil. Manag. 2018, 16, 387–395. [Google Scholar] [CrossRef]
  79. Onungwa, I.O.; Uduma-Olugu, N.; Igwe, J.M. Building information modelling as a construction management tool in nigeria. BIM 2017 2017, 1, 25–33. [Google Scholar] [CrossRef] [Green Version]
  80. Abubakar, Y.S.; Muhammad, A.; Abdurazaq, M. Prioritisation of factors affecting the adoption of Building Information Modelling in Nigerian construction industry. In Proceedings of the Nigerian Institute of Quantity Surveyors 3rd Research Conference NIQS RECON3: Confluence of Research, Theory and Practice in the Built Environment, Bauchi, Nigeria, 1–3 September 2015. [Google Scholar]
  81. Babatunde, S.O.; Udeaja, C.; Adekunle, A.O. Barriers to BIM implementation and ways forward to improve its adoption in the Nigerian AEC firms. Int. J. Build. Pathol. Adapt. 2020. ahead-of-print. [Google Scholar] [CrossRef] [Green Version]
  82. Amuda-Yusuf, G. Critical Success Factors for Building Information Modelling Implementation. Constr. Econ. Build. 2018, 18, 55–73. [Google Scholar] [CrossRef]
  83. Kori, S.A.; Itanola, M.; Saka, A.B. The Capability and Support of Structure Capital on BIM Innovation in SME. Inf. Knowl. Manag. 2019, 9, 56–66. [Google Scholar] [CrossRef]
  84. Effiom, L.; Edet, S.E. Success of Small and Medium Enterprises in Nigeria: Do Environmental Factors Matter? J. Econ. Sustain. Dev. 2018, 9, 117–128. [Google Scholar]
  85. Shefer, D.; Frenkel, A. R&D, firm size and innovation: An empirical analysis. Technovation 2005, 25, 25–32. [Google Scholar] [CrossRef]
  86. Acs, Z.J.; Audretsch, D.B. Innovation, Market Structure, and Firm Size. Rev. Econ. Stat. 1987, 69, 567–574. [Google Scholar] [CrossRef]
  87. Barata, J.M.; Fontainha, E. Determinants of Innovation in European Construction Firms. Technol. Econ. Dev. Econ. 2017, 23, 915–936. [Google Scholar] [CrossRef]
  88. Damanpour, F. An Integration of Research Findings of Effects of Firm Size and Market Competition on Product and Process Innovations. Br. J. Manag. 2010, 21, 996–1010. [Google Scholar] [CrossRef]
  89. Reichstein, T.; Salter, A.J.; Gann, D.M. Break on Through: Sources and Determinants of Product and Process Innovation among UK Construction Firms. Ind. Innov. 2010, 15, 601–625. [Google Scholar] [CrossRef]
  90. Arias-Aranda, D.; Minguela-Rata, B.; RodrõÂguez-Duarte, A. Innovation and firm size: An empirical study for Spanish engineering consulting companies. Eur. J. Innov. Manag. 2001, 4, 133–141. [Google Scholar] [CrossRef]
  91. Chen, Y.; Yin, Y.; Browne, G.J.; Li, D. Adoption of building information modeling in Chinese construction industry. Eng. Constr. Archit. Manag. 2019, 26, 1878–1898. [Google Scholar] [CrossRef]
  92. Xu, H.; Feng, J.; Li, S. Users-orientated evaluation of building information model in the Chinese construction industry. Autom. Constr. 2014, 39, 32–46. [Google Scholar] [CrossRef]
  93. Ding, Z.; Zuo, J.; Wu, J.; Wang, J.Y. Key factors for the BIM adoption by architects: A China study. Eng. Constr. Archit. Manag. 2015, 22, 732–748. [Google Scholar] [CrossRef]
  94. Ahuja, R.; Sawhney, A.; Arif, M. Prioritizing BIM Capabilities of an Organization: An Interpretive Structural Modeling Analysis. Procedia Eng. 2017, 196, 2–10. [Google Scholar] [CrossRef]
  95. Juan, Y.-K.; Lai, W.-Y.; Shih, S.-G. Building information modeling acceptance and readiness assessment in Taiwanese architectural firms. J. Civ. Eng. Manag. 2016, 23, 356–367. [Google Scholar] [CrossRef] [Green Version]
  96. Won, J.; Lee, G.; Dossick, C.; Messner, J. Where to Focus for Successful Adoption of Building Information Modeling within Organization. J. Constr. Eng. Manag. 2013, 139, 04013014. [Google Scholar] [CrossRef] [Green Version]
  97. Ahmed, A.L.; Kassem, M. A unified BIM adoption taxonomy: Conceptual development, empirical validation and application. Autom. Constr. 2018, 96, 103–127. [Google Scholar] [CrossRef]
  98. Son, H.; Lee, S.; Kim, C. What drives the adoption of building information modeling in design organizations? An empirical investigation of the antecedents affecting architects’ behavioral intentions. Autom. Constr. 2015, 49, 92–99. [Google Scholar] [CrossRef]
  99. Olawumi, T.O.; Chan, D.W.M. A scientometric review of global research on sustainability and sustainable development. J. Clean. Prod. 2018, 183, 231–250. [Google Scholar] [CrossRef]
  100. Zhao, X. A scientometric review of global BIM research: Analysis and visualization. Autom. Constr. 2017, 80, 37–47. [Google Scholar] [CrossRef]
  101. Hong, Y.; Chan, W.M.D. Research trend of joint ventures in construction: A two-decade taxonomic review. J. Facil. Manag. 2014, 12, 118–141. [Google Scholar] [CrossRef] [Green Version]
  102. Randolph, J.J. A Guide to Writing the Dissertation Literature Review. Pract. Assess. Res. Eval. 2009, 14, 13. [Google Scholar]
  103. Ravi, V.; Shankar, R. Analysis of interactions among the barriers of reverse logistics. Technol. Forecast. Soc. Chang. 2005, 72, 1011–1029. [Google Scholar] [CrossRef]
  104. Mitra Debnath, R.; Shankar, R. Improving service quality in technical education: Use of interpretive structural modeling. Qual. Assur. Educ. 2012, 20, 387–407. [Google Scholar] [CrossRef]
  105. Shen, L.; Song, X.; Wu, Y.; Liao, S.; Zhang, X. Interpretive Structural Modeling based factor analysis on the implementation of Emission Trading System in the Chinese building sector. J. Clean. Prod. 2016, 127, 214–227. [Google Scholar] [CrossRef]
  106. Liu, P.; Li, Q.; Bian, J.; Song, L.; Xiahou, X. Using Interpretative Structural Modeling to Identify Critical Success Factors for Safety Management in Subway Construction: A China Study. Int. J. Environ. Res. Public Health 2018, 15, 1359. [Google Scholar] [CrossRef] [Green Version]
  107. Warfield, J.N. Developing Interconnection Matrices in Structural Modeling. Ieee Trans. Syst. Man Cybern. 1974, 4, 81–87. [Google Scholar] [CrossRef] [Green Version]
  108. Chaple, A.P.; Narkhede, B.E.; Akarte, M.M.; Raut, R. Interpretive framework for analyzing lean implementation using ISM and IRP modeling. Benchmarking Int. J. 2018, 25, 3406–3442. [Google Scholar] [CrossRef]
  109. Tan, T.; Chen, K.; Xue, F.; Lu, W. Barriers to Building Information Modeling (BIM) implementation in China’s prefabricated construction: An interpretive structural modeling (ISM) approach. J. Clean. Prod. 2019, 219, 949–959. [Google Scholar] [CrossRef]
  110. Saka, A.B.; Chan, D.W.M. Profound barriers to building information modelling (BIM) adoption in construction small and medium-sized enterprises (SMEs). Constr. Innov. 2020. ahead-of-print. [Google Scholar] [CrossRef]
  111. Mandal, A.; Deshmukh, S.G. Vendor Selection Using Interpretive Structural Modelling (ISM). Int. J. Oper. Prod. Manag. 1994, 14, 52–59. [Google Scholar] [CrossRef]
  112. Duperrin, J.C.; Godet, M. Méthode de Hiérarchisation des Éléments d’un Système: Essai de Prospective du Système de L’énergie Nucléaire dans son Contexte Sociétal; Commissariat á I’Energie Atomique (CEA): Paris, France, 1973. [Google Scholar]
  113. Mathiyazhagan, K.; Govindan, K.; NoorulHaq, A.; Geng, Y. An ISM approach for the barrier analysis in implementing green supply chain management. J. Clean. Prod. 2013, 47, 283–297. [Google Scholar] [CrossRef]
  114. Mor, R.S.; Bhardwaj, A.; Singh, S. Benchmarking the interactions among performance indicators in dairy supply chain. Benchmarking Int. J. 2018, 25, 3858–3881. [Google Scholar] [CrossRef]
Figure 1. Research approach of the study.
Sustainability 12 03710 g001
Figure 2. Interpretive structural modelling (ISM) approach for the study.
Sustainability 12 03710 g002
Figure 3. Interpretative Structural Model (ISM) for drivers of BIM adoption in SMEs.
Sustainability 12 03710 g003
Figure 4. Diagraph and MICMAC analysis of the drivers.
Sustainability 12 03710 g004
Table 1. Drivers of sustainable adoption of BIM.
ContextsDriversIDSources
(a)
Technology (TOE)
(b)
Relative Advantage, Compatibility, Complexity, Tribality and Observability (IDT)
Perceived usefulness (e.g., time saving, cost reduction, higher productivity, smooth workflow)D1Hong, et al. [102]; Bosch-Sijtsema, Isaksson, Lennartsson and Linderoth [52]; Hong, Hammad, Sepasgozar and Akbarnezhad [36]; Rodgers, et al. [103]
Perceived ease of useD2Hong, Hammad and Akbarnezhad [102]; Bosch-Sijtsema, Isaksson, Lennartsson and Linderoth [52]
Compatibility with work practices and jobs in handD3Hong, Hammad and Akbarnezhad [102]; Hong, Hammad, Sepasgozar and Akbarnezhad [36]
Low level of complexityD4Hong, Hammad and Akbarnezhad [102]; Bosch-Sijtsema, Isaksson, Lennartsson and Linderoth [52]
Tangible BIM benefits (Observability)D5Bosch-Sijtsema, Isaksson, Lennartsson and Linderoth [52]
(a)
Environment (TOE)
(b)
Mimetic pressure, Coercive pressure, and Normative pressure (INT)
Client demandD6Hong, Hammad and Akbarnezhad [102]; Bosch-Sijtsema, Isaksson, Lennartsson and Linderoth [52]; Hong, Hammad, Sepasgozar and Akbarnezhad [36]; Caroll and McAuley [104]
Government mandateD7Caroll and McAuley [104]; Anuar and Abidin (2015); Forsythe [105]
Adoption by competitors in the marketD8
Institutional bodies (i.e., push by professional bodies, educational institutions)D9Li, et al. [106]; Caroll and McAuley [104]; Joseph Garcia, Mollaoglu and Syal [37]; Poirier, Staub-French and Forgues [16]
Collaborative procurement and adaptive methodsD10Li, Zheng, Si and Xu [106]
Push by software vendors in the marketD11Li, Zheng, Si and Xu [106]
High awareness by various stakeholdersD12Bosch-Sijtsema, Isaksson, Lennartsson and Linderoth [52]; Hong, Hammad, Sepasgozar and Akbarnezhad [36]
(a)
Organization (TOE)
Top management supportD13Joseph Garcia, Mollaoglu and Syal [37]; Bosch-Sijtsema, Isaksson, Lennartsson and Linderoth [52]; Hong, Hammad, Sepasgozar and Akbarnezhad [36]; Poirier, Staub-French and Forgues [16]
Organization readinessD14Bosch-Sijtsema, Isaksson, Lennartsson and Linderoth [52]; Poirier, Staub-French and Forgues [16]; Olatunji [107]
Adequate financial resourcesD15Li, Zheng, Si and Xu [106]; Caroll and McAuley [104]
Appropriate organization cultureD16Li, Zheng, Si and Xu [106]; Joseph Garcia, Mollaoglu and Syal [37]; Olatunji [107]; Olatunji [107]
Organizational structureD17Hong, Hammad, Sepasgozar and Akbarnezhad [36]; Olatunji [107]
Table 2. Experts’ distribution.
DemographicsCategoryNumberPercentage
ProfessionEngineer318.75%
Quantity Surveyor212.5%
Architect637.5%
Researcher531.25%
TypeConsultant743.75%
Contractor425%
University/Research institutes531.25%
Consultant743.75%
Years of professional experience<5 years--
5–10 years318.75%
11–15 years743.75%
16–20 years425%
>20 years212.5%
Number of BIM projects involved1–3 projects531.25%
4–6 projects850%
7–9 projects318.75%
>10 projects--
Table 3. Structural Self-Interaction Matrix (SSIM).
D17D16D15D14D13D12D11D10D9D8D7D6D5D4D3D2D1
D1OOOVVOOOVVVVOOOOX
D2OOOOVOOOOVOOOAOX
D3OOOVVOOOOOOAOOX
D4OOOOVOOOOVOOOX
D5OOOVVOOOVVVVX
D6OOVVVOOVOOAX
D7OVOVVVOVAOX
D8OOOVVOOXOX
D9OOOOVXAOX
D10OOOOVVOX
D11OOOVVVX
D12OOOVVX
D13VVAVX
D14OAAX
D15OOX
D16AX
D17X
Table 4. Initial reachability matrix of the drivers derived from the SSIM.
D1D2D3D4D5D6D7D8D9D10D11D12D13D14D15D16D17
D110000111100011000
D201000000000010000
D300100000000011000
D401010000000010000
D500001111100011000
D600100100010011100
D700000110010111000
D800000001010011000
D900000010100110000
D1000000000010000000
D1100000000001111000
D1200000000100111000
D1300000000000011011
D1400000000000001000
D1500000000000001100
D1600000000000011010
D1700000000000000011
Table 5. Final Reachability Matrix of the drivers derived from the SSIM.
D1D2D3D4D5D6D7D8D9D10D11D12D13D14D15D16D17
D11010 111110111111
D201000000000011011
D300100000000011011
D401010000000011011
D500101111110111111
D600100111110111111
D700100111110111111
D800100111110111111
D900100111110111111
D1000100111110111111
D1100100111111111111
D1200100111110111111
D1300000000000011011
D1400000000000001000
D1500000000000001100
D1600000000000011011
D1700000000000011011
Table 6. Level I of the hierarchical structure of the drivers using the final reachability matrix.
DriverReachability SetAntecedent SetIntersectionLevel
D11,3,7,8,9,10,15,16,1711
D22,13,14,16,172,42
D33,13,14,16,171,3,5,6,7,8,9,10,11,123
D42,4,13,14,16,1744
D53,5,6,7,8,9,10,12,13,14,15,16,1755
D63,6,7,8,9,10,12,13,14,15,16,171,5,6,7,8,9,10,11,126,7,8,9,10,12
D73,6,7,8,9,10,12,13,14,15,16,171,5,6,7,8,9,10,11,126,7,8,9,10,12
D83,6,7,8,9,10,12,13,14,15,16,171,5,6,7,8,9,10,11,126,7,8,9,10,12
D93,6,7,8,9,10,12,13,14,15,16,171,5,6,7,8,9,10,11,126,7,8,9,10,12
D103,6,7,8,9,10,12,13,14,15,16,171,5,6,7,8,9,10,11,126,7,8,9,10,12
D113,6,7,8,9,10,11,12,13,14,15,16,171111
D123,6,7,8,9,10,12,13,14,15,16,171,5,6,7,8,9,10,11,126,7,8,9,10,12
D1313,14,16,171,2,3,4,5,6,7,8,9,10,11,12,13,16,1713,16,17
D14141,2,3,4,5,6,7,8,9,10,11,12,13,14,15,16,1714I
D1514,151,5,6,7,8,9,10,11,12,1515
D1613,14,16,171,2,3,4,5,6,7,8,9,10,11,12,13,16,1713,16,17
D1713,14,16,171,2,3,4,5,6,7,8,9,10,11,12,13,16,1713,16,17
Table 7. Level II of the hierarchical structure of the drivers using the final reachability matrix.
DriversReachability SetAntecedent SetIntersectionLevel
D11,3,7,8,9,10,15,16,1711
D22,13,16,172,42
D33,13,16,171,3,5,6,7,8,9,10,11,123
D42,4,13,16,1744
D53,5,6,7,8,9,10,12,13,15,16,1755
D63,6,7,8,9,10,12,13,15,16,171,5,6,7,8,9,10,11,126,7,8,9,10,12
D73,6,7,8,9,10,12,13,15,16,171,5,6,7,8,9,10,11,126,7,8,9,10,12
D83,6,7,8,9,10,12,13,15,16,171,5,6,7,8,9,10,11,126,7,8,9,10,12
D93,6,7,8,9,10,12,13,15,16,171,5,6,7,8,9,10,11,126,7,8,9,10,12
D103,6,7,8,9,10,12,13,15,16,171,5,6,7,8,9,10,11,126,7,8,9,10,12
D113,6,7,8,9,10,11,12,13,15,16,171111
D123,6,7,8,9,10,12,13,15,16,171,5,6,7,8,9,10,11,126,7,8,9,10,12
D1313,16,171,2,3,4,5,6,7,8,9,10,11,12,13,16,1713,16,17II
D15151,5,6,7,8,9,10,11,12,1515II
D1613,16,171,2,3,4,5,6,7,8,9,10,11,12,13,16,1713,16,17II
D1713,16,171,2,3,4,5,6,7,8,9,10,11,12,13,16,1713,16,17II
Table 8. Level III of the hierarchical structure of the drivers using the final reachability matrix.
DriversReachability SetAntecedent SetIntersectionLevel
D11,3,7,8,9,1011
D222,42III
D331,3,5,6,7,8,9,10,11,123III
D42,444
D53,5,6,7,8,9,10,1255
D63,6,7,8,9,10,121,5,6,7,8,9,10,11,126,7,8,9,10,12
D73,6,7,8,9,10,121,5,6,7,8,9,10,11,126,7,8,9,10,12
D83,6,7,8,9,10,121,5,6,7,8,9,10,11,126,7,8,9,10,12
D93,6,7,8,9,10,121,5,6,7,8,9,10,11,126,7,8,9,10,12
D103,6,7,8,9,10,121,5,6,7,8,9,10,11,126,7,8,9,10,12
D113,6,7,8,9,10,11,121111
D123,6,7,8,9,10,121,5,6,7,8,9,10,11,126,7,8,9,10,12
Table 9. Level IV of the hierarchical structure of the drivers using the final reachability matrix.
DriversReachability SetAntecedent SetIntersectionLevel
D11,7,8,9,1011
D4444IV
D55,6,7,8,9,10,1255
D66,7,8,9,10,121,5,6,7,8,9,10,11,126,7,8,9,10,12IV
D76,7,8,9,10,121,5,6,7,8,9,10,11,126,7,8,9,10,12IV
D86,7,8,9,10,121,5,6,7,8,9,10,11,126,7,8,9,10,12IV
D96,7,8,9,10,121,5,6,7,8,9,10,11,126,7,8,9,10,12IV
D106,7,8,9,10,121,5,6,7,8,9,10,11,126,7,8,9,10,12IV
D116,7,8,9,10,11,121111
D126,7,8,9,10,121,5,6,7,8,9,10,11,126,7,8,9,10,12IV
Table 10. Level V of the hierarchical structure of the drivers using the final reachability matrix.
DriversReachability SetAntecedent SetIntersectionLevel
D1111V
D5555V
D11111111V
Table 11. Dependence and Driving Power of the drivers.
D1D2D3D4D5D6D7D8D9D10D11D12D13D14D15D16D17
Dp power12101199999191517101515
Dr power13556131212121212131241244

