1. Introduction
A flood is the most disturbing natural incident that affects and disrupts the safety of a society, especially people who are vulnerable to disaster due to geographic conditions and poor available resources [
1]. Floods can cause losses of human lives, extensive material damages, the devastation of cultural properties, population displacement and environmental damages, while significantly hampering economic development. Prognostic climate models indicate an increasing incidence of extreme climatic phenomena resulting most likely from climate change, both on a global and local level. Extreme air temperatures, rainfall intensities and dry periods can be expected in the future, along with the occurrence of storms and devastating winds. The consequences of climate change are evidenced by the increasing duration, intensity and frequency of floods, higher risks of riverine flooding, more frequent floods of occasional watercourses, and changed patterns of snow melting and ice flooding [
2,
3,
4,
5].
The regulation of watercourses, construction of levees and different operational measures such as setting up waterbeds in emergencies are all flood protection measures. Levees are embankments used for passive flood protection, aimed to prevent the consequences of flooding. They are regulation structures used outside the main riverbed. They are always in place and provide permanent flood protection without any action from the property owner. Levees protect the target area from high water levels [
6,
7]. In the Republic of Croatia, alongside the national watercourses, there are approximately 2400 km of levees. Among them, there are approximately 1600 km of levees of different levels of protection alongside local watercourses. A large number of these levees are in bad condition and need to be rebuilt or reconstructed. Other levees are not high enough to match extremely high levels of water. It is, therefore, necessary to build tops in order to meet the appropriate safety and functionality requirements [
8,
9].
Floods are a natural phenomenon that cannot be prevented; however, the risk of flood-related adverse effects can be minimised. The impact of climate change on the hydrological behaviour of the river basin, both in natural and modified conditions, should be considered when managing flood risks, precisely because of possible changes in the flood regime. Changes in the intensity and frequency of extreme rainfall, combined with changes in land-use patterns, will lead to an increase in flood risk globally [
10,
11,
12]. Risk management always starts with risk identification [
13]. A list of risks relevant for a levee reconstruction project is compiled following in-depth research of the potential sources of risk, adverse events that include risk, and the unfavourable effects of an undesirable scenario. Risk identification, among other sociological and psychological factors, largely depends on experience [
14,
15,
16].
Risk assessment is performed for each identified risk. There are two independent components of risk: the likelihood of the risk (risk probability) and the impact of the risk on the project (risk impact). These components must be quantified to analyse, compare, and prioritise various risks. This is accomplished by introducing the risk exposure that represents the product of the risk probabilities and the risk impact on the project: risk exposure = risk probability × impact risk [
17]. Risk exposure can be determined by one of the multi-criteria analysis methods. By determining risk exposure for all the identified risks and finding their interrelationship, a risk ranking list can be compiled. Depending on the position of the risk (relative value of its exposure with reference to the other risks) in the risk ranking list, resources can be used for the anticipated risk response [
15].
Risk assessment can be performed by an individual or a group of experts. In the latter case, the main problem is aggregation of the preference rankings of individuals into reliable consensus ranking. Numerous aggregation methods have been proposed to solve this problem [
18]. Liao et al. [
19] proposed an enhanced consensus reaching process for group decision making, which removes some expert opinions instead of removing the expert from the decision group. Dong and Cooper [
20] developed a peer-to-peer dynamic adaptive consensus reaching model based on an automatic feedback mechanism. However, the problem of reliability intensifies with an increase in the number of experts involved in the decision-making process. There will always be experts whose priorities are significantly different from the others and whose risk priority list will be significantly different from the aggregated list [
21]. Xu et al. [
22] developed an improved consensus model for large-group emergency decision-making. The model is designed to manage minority opinions and non-cooperative behaviors. Palomares et al. [
23] proposed a consensus model suitable to manage large scales of decision-makers and capable of managing individual and subgroup noncooperative behaviors. The main issue is the reliability of a consensus ranking that represents an aggregated result. In order to analyse and measure the reliability of an expert in a group, Fu et al. [
24] developed a group evidential reasoning approach where the weights and reliabilities of attributes and experts are included. Instead of dealing with the reliabilities of experts, this study presents a novel application of reliability analysis for risk ranking in a levee reconstruction project. Various methods can be used to aggregate the preference rankings of individuals into consensus ranking. The most used methods are: arithmetic mean [
25], geometric mean [
26], harmonic mean [
27], Bonferroni mean [
28], power [
29], Choquet integral [
30], Sugeno integral [
31] and hybrid method [
32]. Aczel and Saaty [
33] showed that the best aggregation method for ANP is the geometric mean, so it was used to determine the risk exposures for each key risk. This means that risk exposures can be treated as random variables and that the reliability analysis of the ranking of a particular key risk in the risk priority list can be conducted. The risk ranking probability matrix was determined as a result, and its components included the probabilities that risk exposure of lower-ranking risk is higher than risk exposure of higher-ranking risk. The reliability analysis combines The Analytic Network Process (ANP) and Monte Carlo Simulation (MCS) method. If consensus is not able to be reached with satisfactory reliability, different decision-making approaches are proposed.
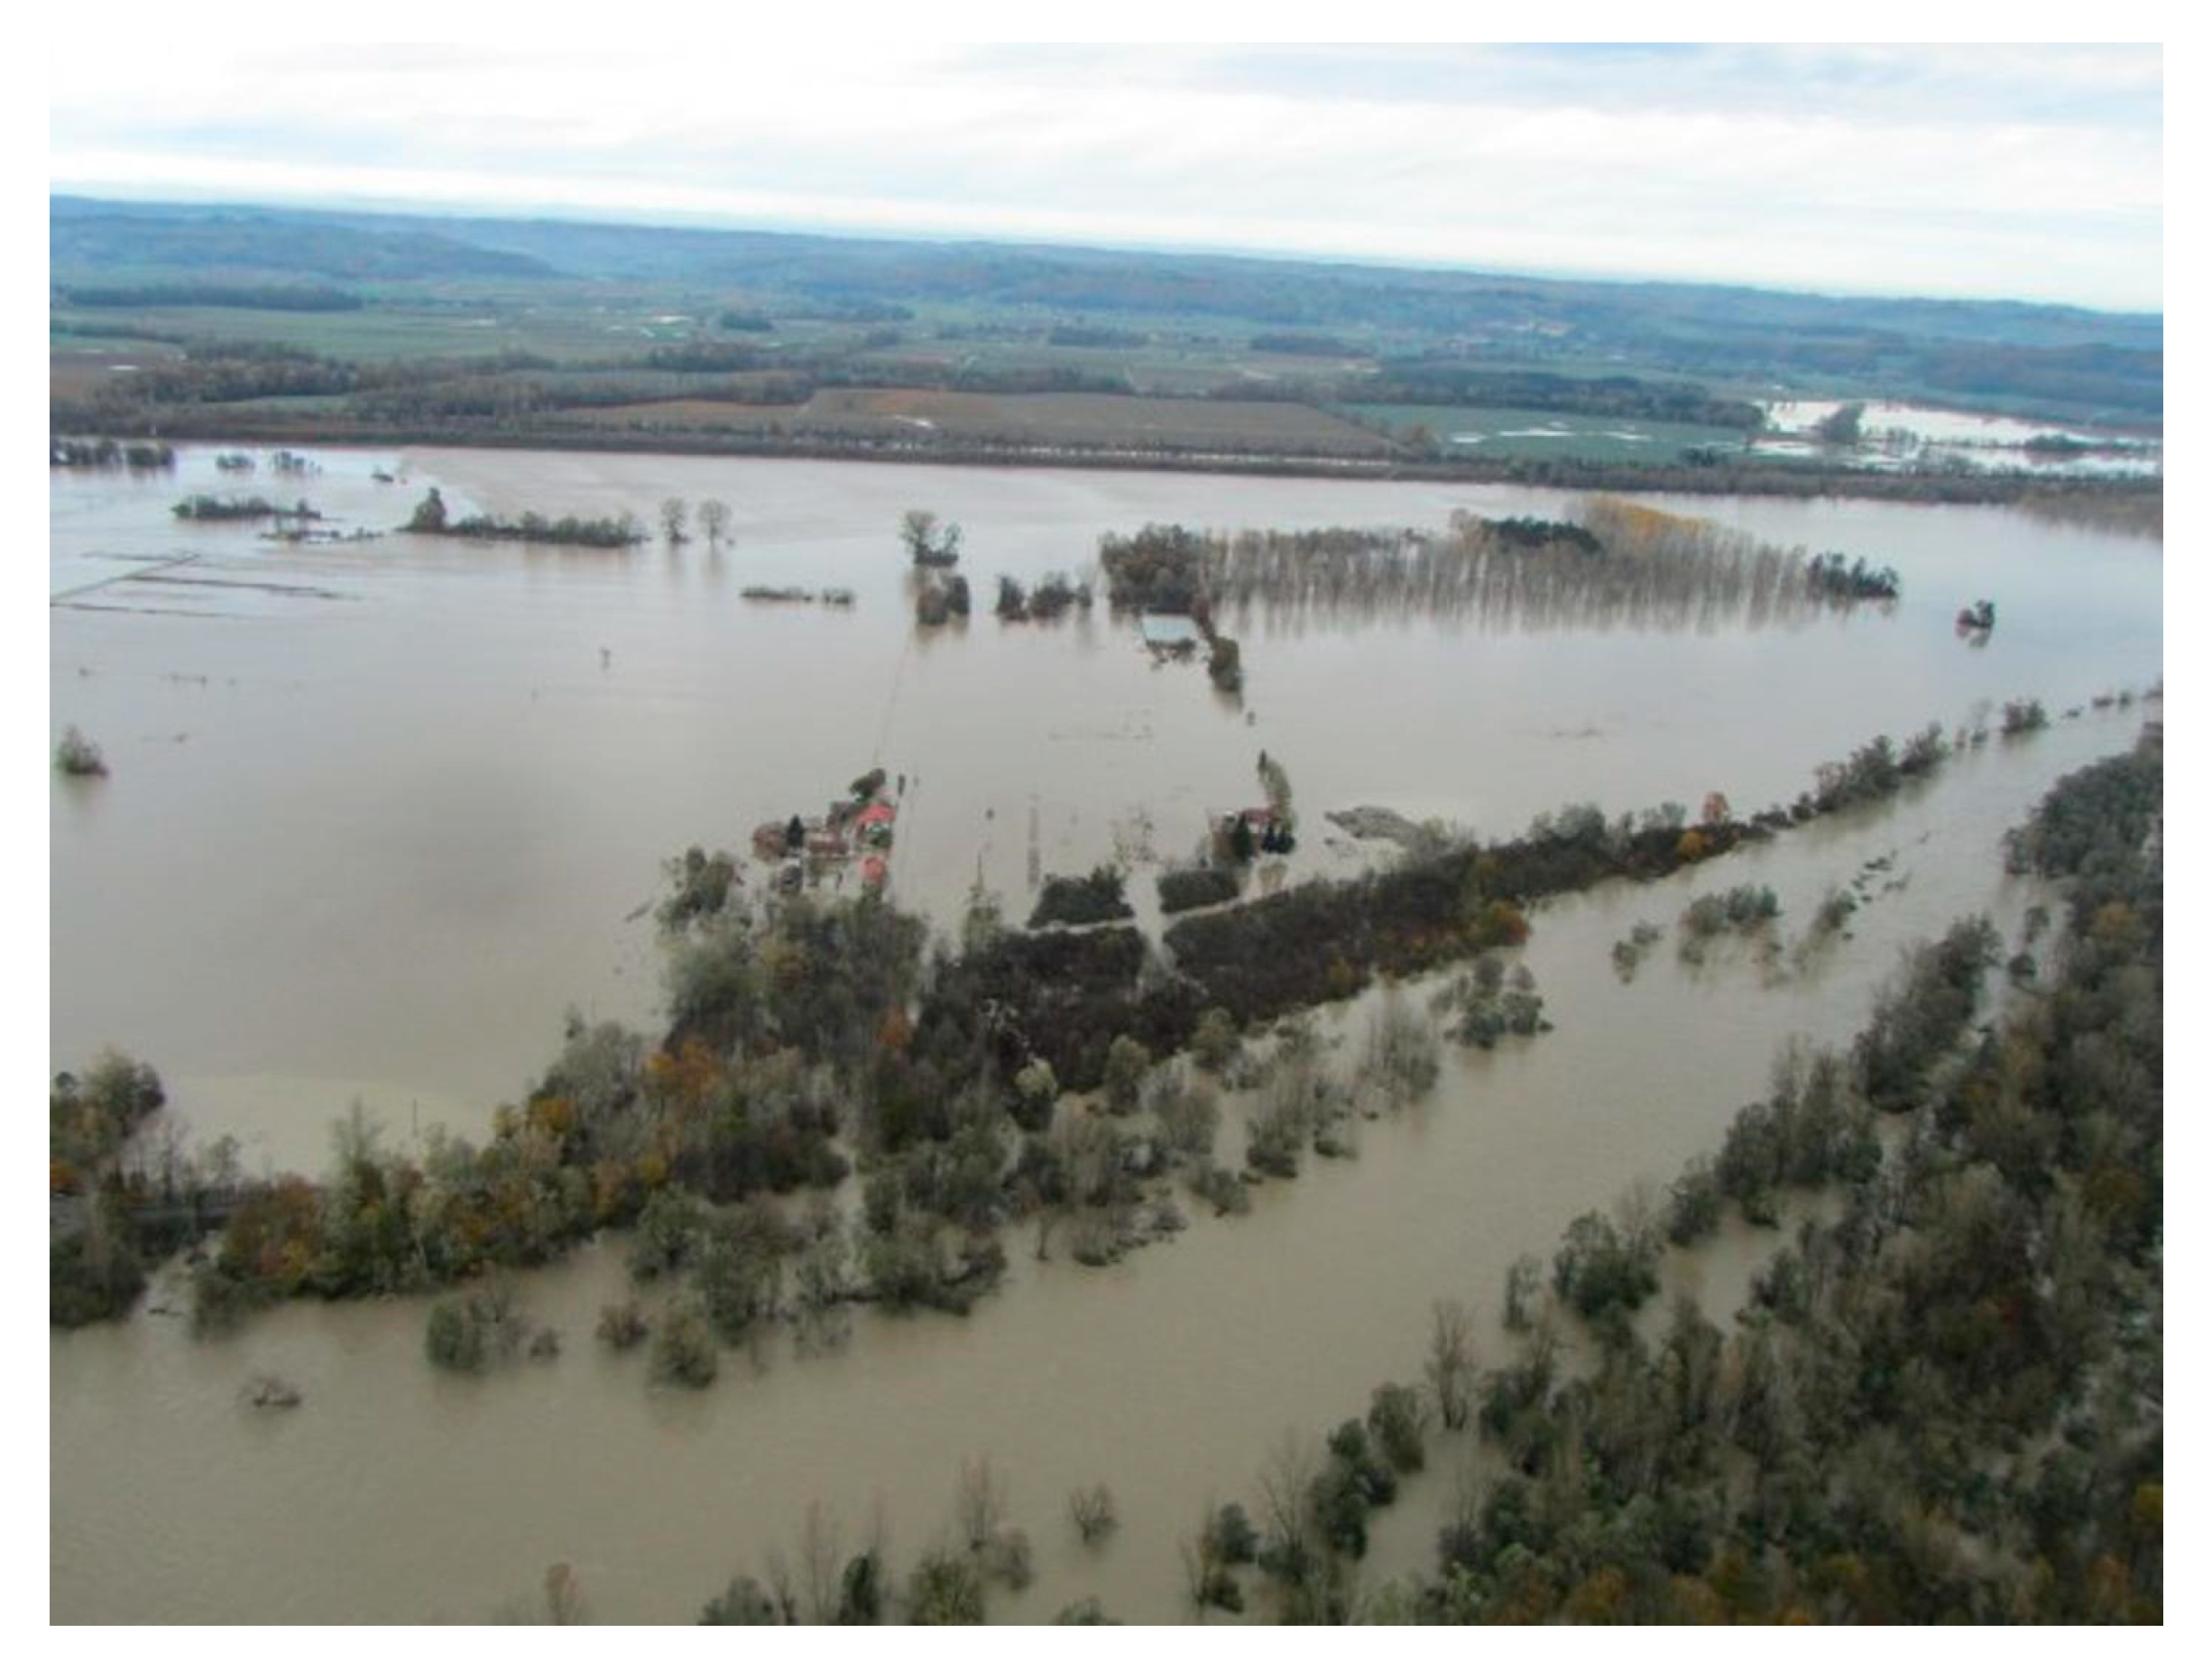
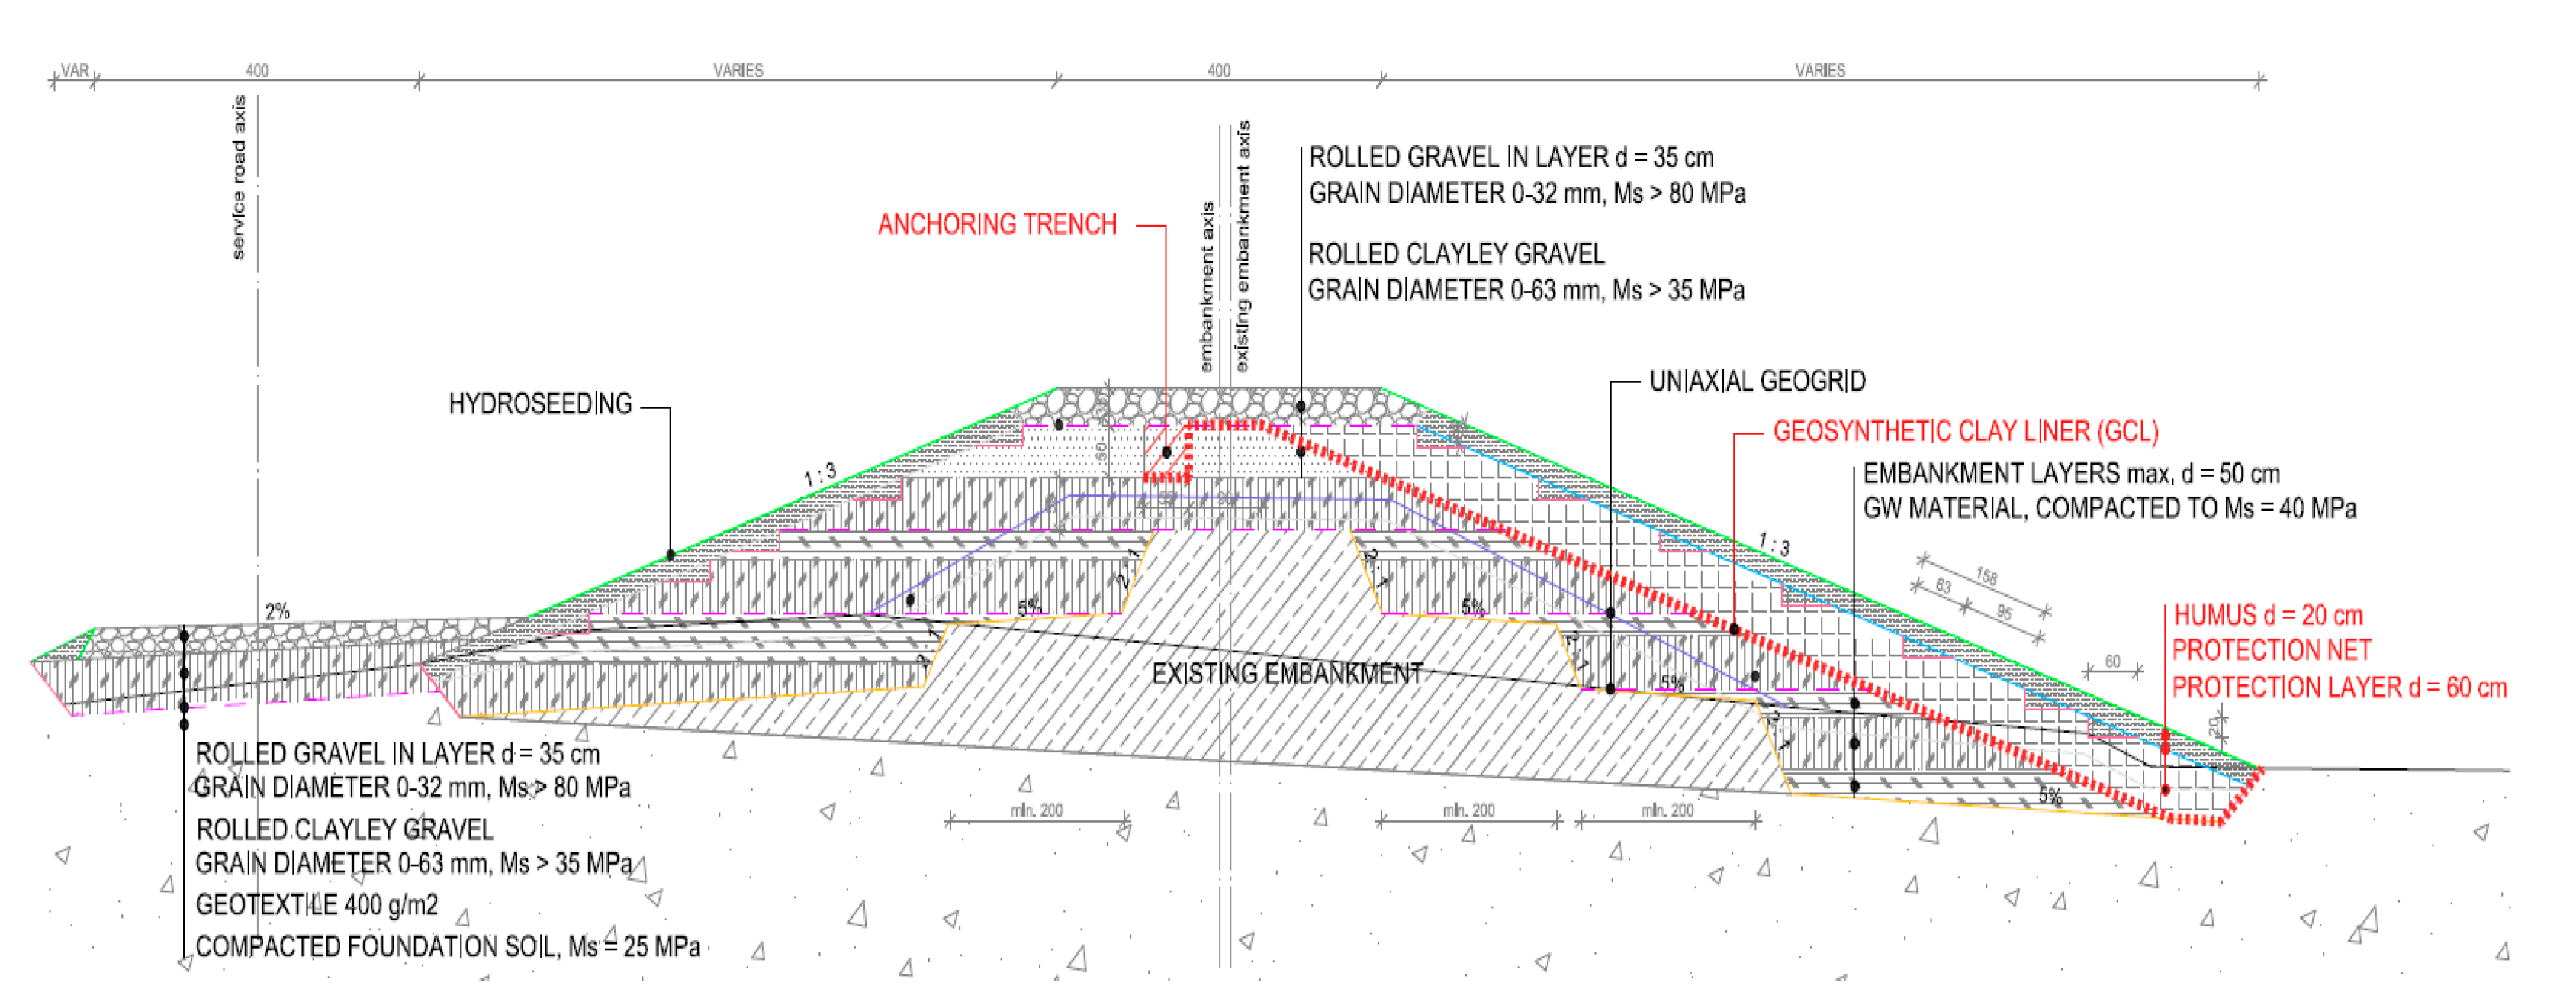
This study is structured as follows. Considering the fact that the risk exposure is site-specific, the following section describes the flooding and breaching, as well as the proposed reconstruction measures for the Otok Virje-Brezje levee, located in the northwest part of the Republic of Croatia. This project was chosen to demonstrate the applicability of the proposed methodology of reliability analysis for risk ranking in a levee reconstruction project.
Section 3 shows the identification of the key risks that can exist during the levee reconstruction.
Section 4 presents the risk assessment of the levee reconstruction project based on the analytic network process (ANP) model.
Section 5 elaborates on a reliability analysis for risk ranking using the Monte Carlo simulation method.
Section 6 discusses different decision-making approaches that can be applied in cases where consensus is not reached with satisfactory reliability. The final section presents the conclusions.
3. Identification of the Key Risks During the Levee Reconstruction Project
The risk management process begins with risk identification in order to compile a list of key risks related to the project [
35]. For every levee reconstruction project, a large number of potential risks can be identified. These are events whose unfavourable outcome may be detrimental to project success during its life cycle. However, it will be very challenging to make a complete list of the risks (particularities of each project) for reconstruction projects of levees, regardless of the size, type and contents. Such a list would contain a certain number of high-exposure risks, including a great number of negligible risks of low-exposure. According to Kovacevic et al. [
36], the most common risks during reconstruction of a levee are as follows: overtopping when the water level surpasses the crest of the levee, inundation resulting from the malfunction of the levee components, seeping of the water through the levee, seeping of the water through the foundation soil under the levee, surface erosion of the levee, internal erosion of the levee, rapid drawdown condition, presence of animal burrows, lack of knowledge about the soil conditions due to inadequate site investigation, inadequate monitoring and evaluation of the levee condition, insufficiently detailed reconstruction design, unsatisfactory performance of reconstruction works, damage from vessels occurring during levee exploitation, cavitation damage induced failure of spillways and seismic loading.
Decision-makers use various techniques for risk identification; the best-known ones include brainstorming, interviews, questionnaires, the Delphi method, and expert systems [
37]. The brainstorming technique was chosen as the most appropriate. It is a meaningful and open discussion in which participants discuss their views on possible sources of risk in the project. They further discuss how uncertainty manifests and how to turn it into risk [
38]. Oladokun et al. [
39] evaluated construction risk management techniques in developing economies and concluded that brainstorming is the most effective risk identification technique. According to Goble [
40], the advantage of brainstorming is the group diversity to generate ideas. These ideas tend to be superior to individually generated ones. Kobo-Greenhut et al. [
41] concluded that most risk analysis techniques rely on brainstorming and that structured brainstorming yields better risk identification. To determine the list of key risks, a group of five experts (designer, project manager, project auditor, supervisor, and contractor representative) who were directly involved in the levee reconstruction project was convened. They were all male and of similar age and experience. They brainstormed the following list of key risks related to Otok Virje-Brezje levee reconstruction:
Inadequate site investigation;
Overtopping;
Insufficiently detailed reconstruction design;
Unsatisfactory performance of reconstruction works;
Inaccurate monitoring and condition evaluation.
The verification of the list of key risks was performed in two steps. The first step was the choice of experts to took part in the verification of the proposed list of key risks. A total of 30 experts took part; they had played an important role in similar projects. This group was composed of seven designers, six project managers, five supervisors, seven contractor representatives, and five university consultants. In the second step, all the experts were given the list of key risks and the structural questionnaire with a single multiple-choice question. The question was, “What do you think of the proposed key risks related to Otok Virje-Brezje levee reconstruction project”? The choices were
Acceptable,
Satisfactory,
Reasonable,
Unsatisfactory and
Unacceptable. The experts did not know how the key risks had been identified; this question was posed to verify the identification process. The answers are shown in
Figure 4. A high degree of consensus had been reached; thus, it was possible to undertake the risk assessment and to determine the risk priority list.
4. Risk Assessment in the Levee Reconstruction Project
Risk assessment is performed by determining risk exposure as a product of risk probability and risk impact. Risk probability is a dimensionless value. The risk may impact time, cost, quality or the environment; its impact can be expressed in monetary units. This means that risk exposure has the dimension of the monetary unit used in calculations. Consequently, risk exposure for a particular risk may acquire any value and is calculated independently. The absolute value of risk exposure for a particular risk, viewed in itself, has practically no usable value. Therefore, it is important to determine how intense the risk exposure of a particular risk is with respect to the risk exposures of the other risks. A priority list is compiled by determining the risk exposures of all the identified risks and placing them in an interrelationship.
The risk priority list can be determined using a quantitative, qualitative or mixed approach. The quantitative approach implies that risk probability and risk impact can be explicitly calculated using one of the known quantitative methods of risk analysis. To do this, the relevant database must be available to form the probability distribution (to enable the direct calculation of the impact on time, cost, quality, and environment) [
42,
43,
44]. The priority list is created using the qualitative approach when there is no database about earlier projects to use for the probability distribution function and for determining risk probability. Moreover, all the necessary indicators for the direct calculation of the consequences would also be missing for a qualitative approach [
45,
46]. For example, the probability of overtopping can be quantified based on the high-water database in the past, and the probability of inaccurate monitoring and condition evaluation can be quantified from a database about earlier projects. This means that these two probabilities can be compared quantitatively. However, if there is no database about the impact of inadequate site investigation and the insufficiently detailed reconstruction design on the time of reconstruction work execution then these two impacts can only be qualitatively determined. This called for the use of the ANP method.
Thomas L. Saaty developed Analytic Network Process (ANP) to aid managers in in making decisions [
47,
48,
49,
50,
51]. ANP is one of the methods for multi criteria decision-making. Subjective assessments and objective facts are incorporated into a logical network to provide decision-makers with an intuitive approach in quantifying the importance of each decision element through a comparison process. The ANP method represents a generalisation of the analytic hierarchical process (AHP) to enable decision-makers to reduce the complex problem to a non-linear network form that also contains a linear hierarchical form with several levels. The network consists of clusters and elements or nodes within a cluster. The interaction between the elements of one cluster (inner dependence) and between elements of different clusters (outer dependence) is enabled. Complex real-life problems are well modelled with the interdependence of network elements. Functional interaction between the criteria and alternatives in the model achieves greater stability of the analysis results. Morteza and Tamošaitienė [
52] applied the fuzzy ANP to assess the relative importance of risk factors and alternatives and prioritise construction projects. Chatterjee et al. [
53] extended the ANP and develop a hybrid multi criteria decision-making model for risk prioritisation during construction. Chou and Ongkowijoyo [
54] proposed an ANP-based method to quantify and define the interdependencies among various components of critical infrastructure and their importance based on expert perspectives. The ANP is particularly suitable for flood protection risk assessment. Dano et al. [
55] combined ANP with geographic information system (GIS) and remote sensing (RS) derived variables for flood susceptibility assessment and mapping. The ANP model was used to calculate the relative weights of the various flood influencing factors. De Brito et al. [
56] concluded that ANP proved to be effective for assessing the vulnerability to floods and that ANP should be used whenever possible as it allows for the capturing of the complex relationships among vulnerability criteria in a transparent way.
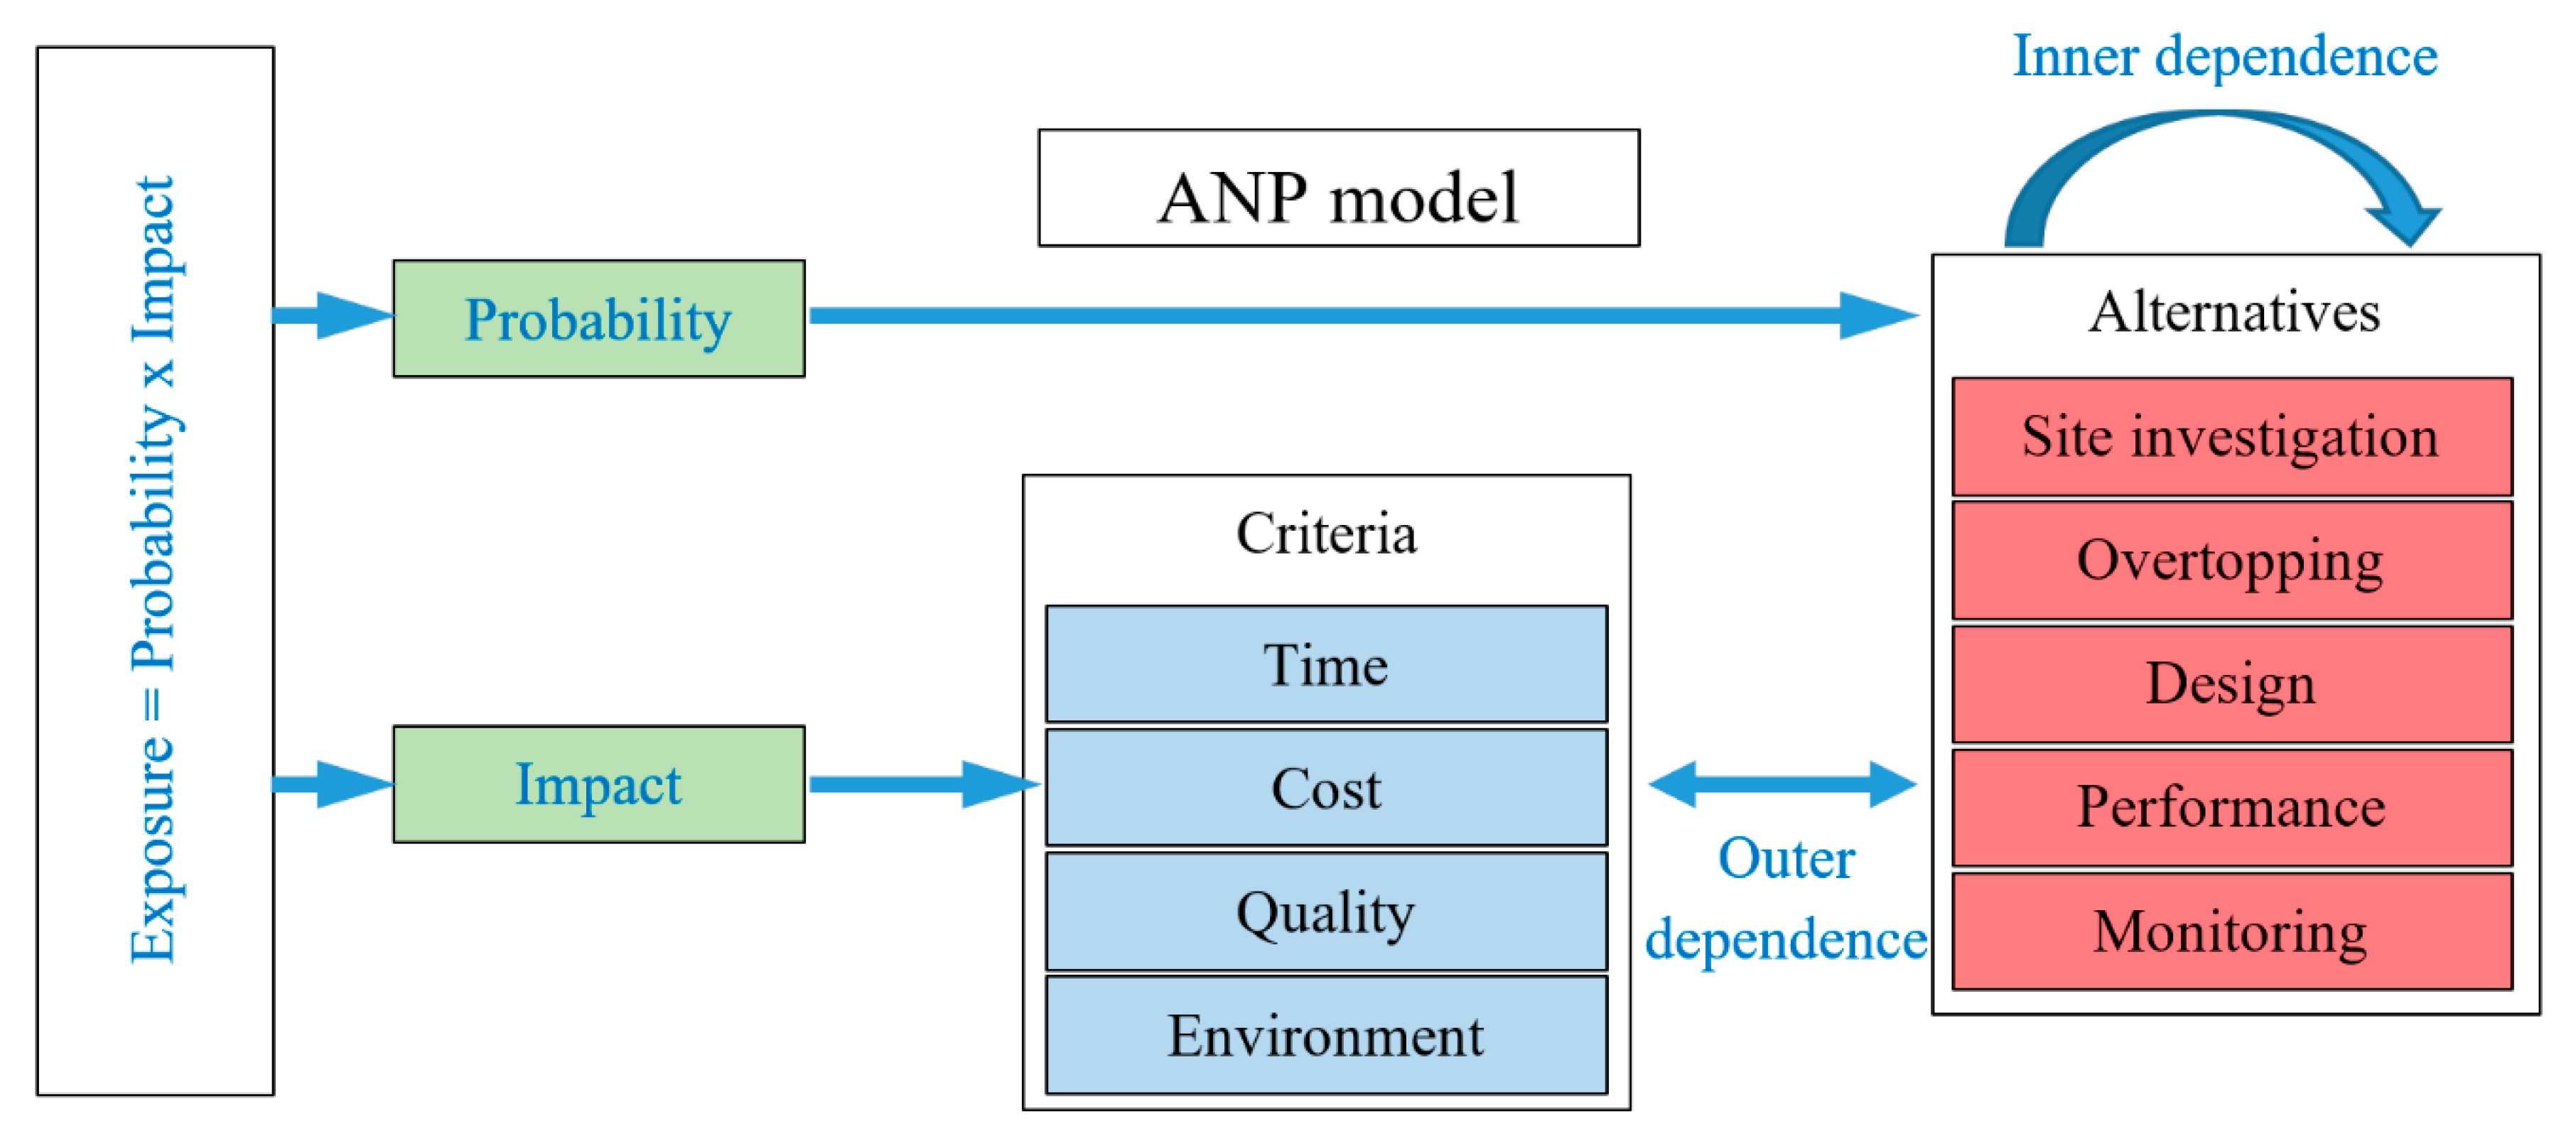
The ANP model for risk assessment in the Otok Virje-Brezje levee reconstruction project consists of the main network and two sub-networks (
Figure 5). Considering the fact that risk exposure is defined as the product of risk probability and risk impact, the main
Risk Exposure network enables the determination of risk exposure while the sub-networks enable the determination of risk probability and risk impact. The
Risk Probability sub-network contains one criterion:
Probability and five alternatives (
Site Investigation, Overtopping, Design,
Performance, and
Monitoring), which are the key risks analysed. The
Risk Impact sub-network contains four criteria:
Time,
Cost,
Quality, and
Environment, as well as five alternatives. In order to obtain the results (risk exposure) of the ANP model, alternative weight values are multiplied for each alternative in both sub-networks. By normalizing the risk exposure values for all alternatives, the risk priority list was obtained.
The model consists of 10 comparisons of the importance of five elements of the Alternatives cluster compared to one element of the Probability cluster, six comparisons of the importance of four elements of the Criteria cluster compared to one element of the Impact cluster, 40 comparisons of the importance of five elements of the Alternatives cluster compared to four elements of the Criteria cluster, 30 comparisons of the importance of the four elements of the Criteria cluster compared to five elements of the Alternatives cluster, and 30 comparisons of the importance of five elements of the Alternatives cluster compared to each one. The modelling was conducted by a total of 35 experts, whereby five verified the key risks and 30 verified that list. The process of comparison is represented by forming a comparison matrix. If the expert has at his disposal n alternatives, or criteria that form the comparison matrix, then he must make n(n−1)/2 evaluations. The eigenvector of each comparative matrix is the priority vector, while the eigenvalue gives the measure of consistency in making the assessment or comparison. The priority vector W and the maximum eigenvalue λmax of the comparison matrix A are determined by solving the general problem of eigenvalues AW = λmaxW. The consistency coefficients for each comparison matrix at all levels, determined by the eigenvalue of the comparison matrix, and the global consistency coefficients were significantly less than 0.10. Consistent judgments were therefore made at all hierarchical levels and resulted in 35 risk priority lists. Below are some of the modelling results conducted by the first author of this study, who is also the designer of the Otok Virje-Brezje levee reconstruction.
Table 1 shows a comparison matrix between the relative importance of the elements of the
Alternatives cluster and the element of the
Probability cluster; relative importance presents an alternative to the
Probability, i.e., relative probability of occurrence of each identified key risk. The
Site Investigation is three times more likely to occur than the
Design. Meanwhile, the
Performance is 1.5 times less likely to occur than
Monitoring. It is evident that
Site investigation is the most likely alternative, and the
Design is the least likely.
Table 2 shows a comparison matrix of the relative importance of the elements of the
Criteria cluster compared to the elements of the
Impact cluster and the obtained importance in comparison to the
Impact cluster. In conclusion,
Time is three times more important than
Quality, and
Cost is 2.5 times less important than the
Environment. It is evident that
Environment is the most important one, with
Quality being least important.
In order to illustrate the comparison of the alternatives against the criteria,
Table 3 shows the comparison matrix of the relative importance of the
Alternatives cluster and
Environment element of the
Criteria cluster. The importance of the alternatives was compared to the
Environment criterion. In conclusion,
Site Investigation is 4 times more important than
Monitoring, and the
Design is 2 times less important than
Overtopping. Therefore,
Overtopping is the most important, and
Monitoring is the least important criterion.
In order to illustrate the comparison of the alternatives against the criteria,
Table 4 shows the comparison matrix of the relative importance of the
Criteria cluster and
Overtopping element of the
Alternatives cluster. The importance of the criterion was compared to the
Overtopping alternative.
Overtopping risk was twice as important as
Quality, and
Time was five times less important than the
Environment. It is evident that the
Environment is the most important, and
Time is the least important criterion.
In order to illustrate the comparison of the alternatives against all existing ones,
Table 5 shows the comparison matrix of the relative importance of the
Alternatives cluster and
Performance risk; the importance of the alternatives was compared to the
Performance alternative. This example was chosen because, in the ANP model, the
Performance risk had the highest importance. In conclusion,
Site Investigation is twice as important as
Monitoring, and
Overtopping is as important as the
Design. It is evident that
Site Investigation is the most important, and
Overtopping is the least important alternative.
Figure 6;
Figure 7 show the risk probability and risk impact obtained for every risk analysed.
Figure 8 shows the
risk exposure calculated as the normalized product of risk probability (
Figure 6) and risk impact (
Figure 7) obtained through the ANP model.
5. Application of Reliability Analysis for Risk Ranking in the Levee Reconstruction Project
Risk assessment was performed by a group of experts. The result is 35 risk priority lists or 35 sets of individual normalised risk exposures for each key risk (
Table 6). Expert 1 is the first author of this study and the designer of the Otok Virje-Brezje levee reconstruction. As can be seen, there are deviations in the priorities of individual experts. For example, the order of risk exposures in the priority list of Expert 25 is different from the order established by the designer. Risk exposures of
Overtopping and
Performance risks are greater than risk exposure of
Site investigation risk, and thus greater resources should be allocated to them. Using the ANP model, Expert 10 obtained the same ranking in the risk priority list, but the differences between the first and second risk exposures are much smaller than those of the designer.
The risk exposures obtained by using the geometric mean method were normalized so that their sum equals to one. The risk exposures are proportional to the resources that will be allocated to the risk responses.
Table 7 shows the aggregated risk priority lists obtained by using the geometric mean method. It shows that more resources should be allocated for management of the
Site Investigation risk (29.7%), followed by
Performance (24.7%),
Overtopping (23.2%),
Monitoring (16.6%) and lastly
Design (5.8%).
The reliability analysis of the group consensus-reaching method was conducted by determining the risk ranking probability matrix by using the Monte Carlo simulation method. This method is widely used in risk management and reliability analysis. Namazian et al. [
57] used it for assessing completion time of projects under risk. Lan et al. [
58] presented an integrated probabilistic framework that combines Monte Carlo simulation and a flood control risk model. Aronica et al. [
59] performed the probabilistic evaluation of flood hazard in urban areas using Monte Carlo simulation. The components of the risk ranking probability matrix included the probabilities that the risk exposure of individual risk is less than the risk exposure of other risks. That means that risk exposures are treated as random variables. The analysis starts by forming a probability distribution of the risk exposures on the basis of 35 individual risk exposures for each key risk (
Table 6). To avoid making assumptions about the probability distribution of the risk exposures, the kernel distribution was chosen. This is a nonparametric continuous smooth representation of the probability density function (PDF) of a random variable [
60].
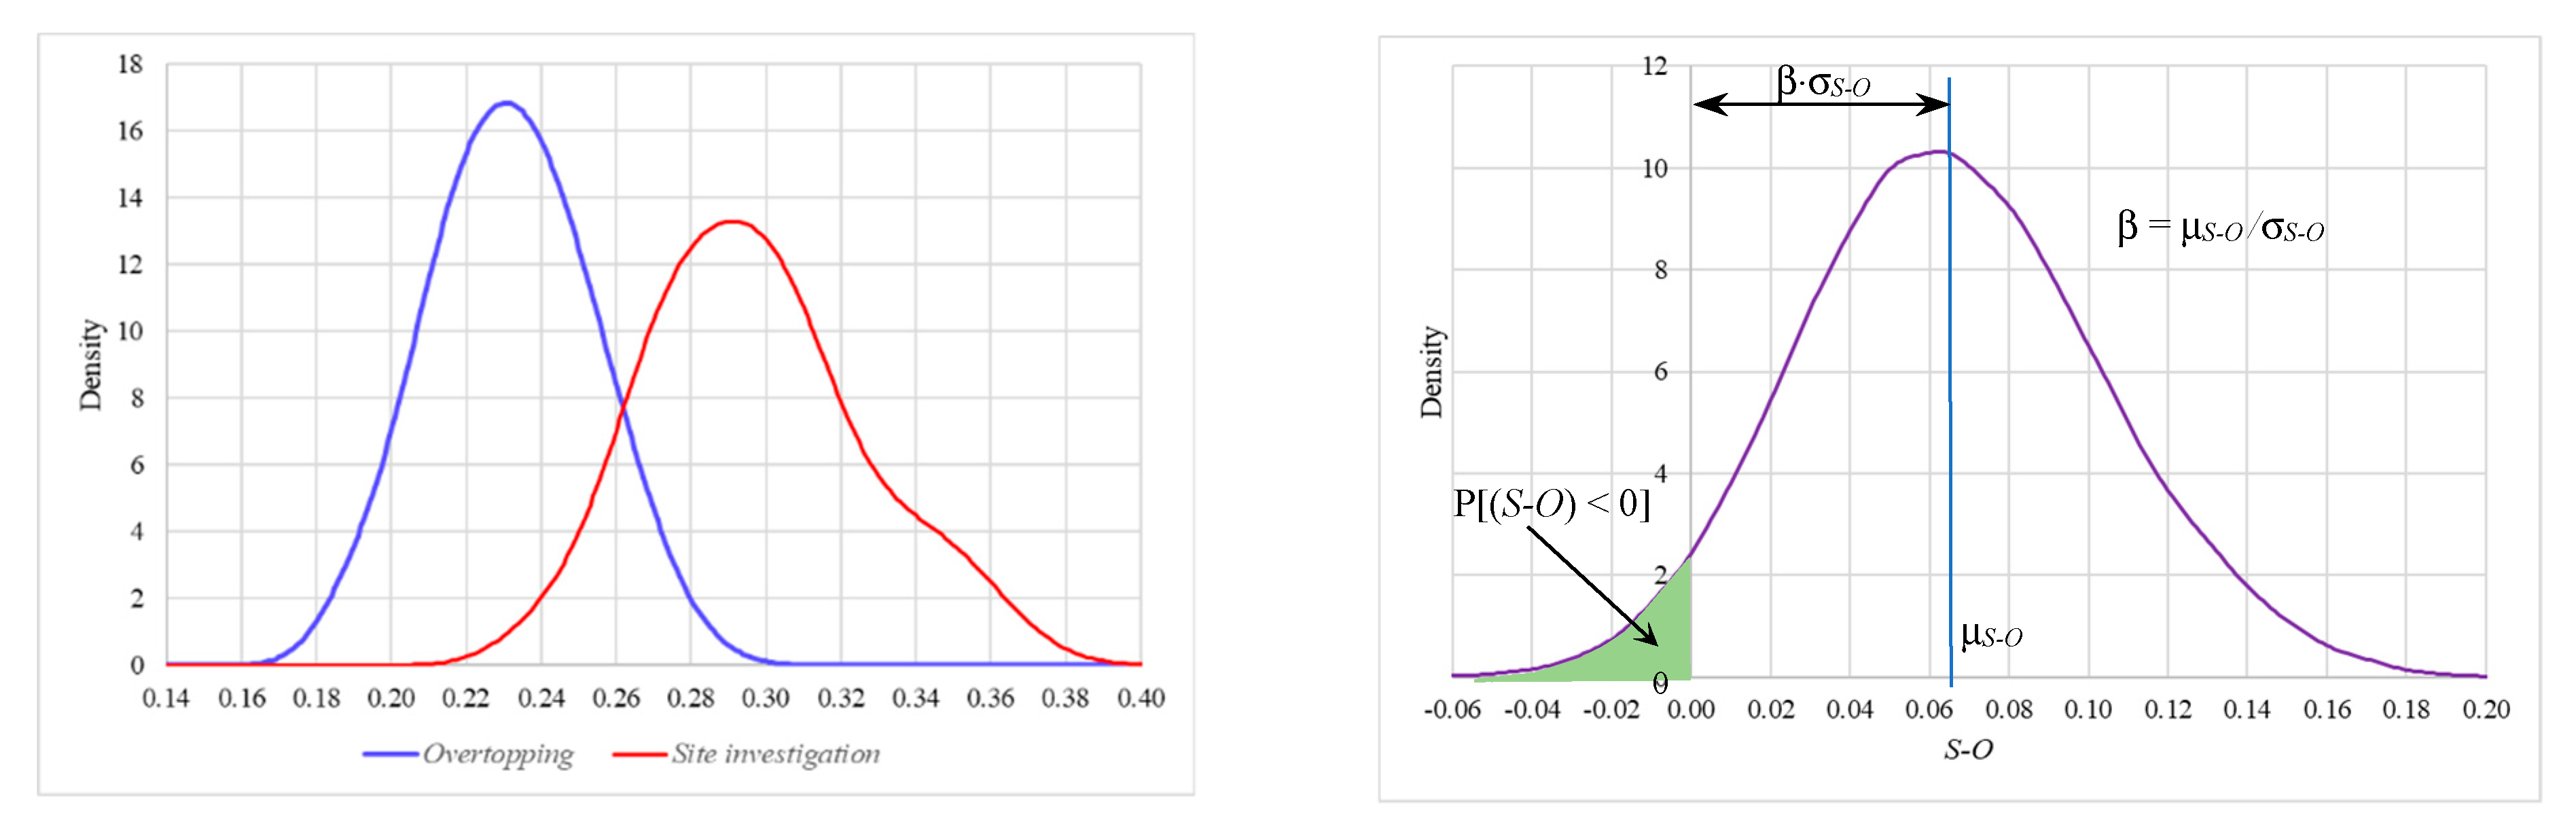
Figure 9 shows the histogram and kernel probability density functions of random variables
Site investigation and
Overtopping.
The probability that the value of the random variable
Site investigation is less than the value of the random variable
Overtopping is equal to the probability that the difference between the values of the random variables
Site investigation and
Overtopping is less than zero: p
S-O = P[(
S − O) < 0]. The difference in random variables is also a random variable (
S − O). The probability density function, mean and the standard deviation of a random variable (
S-O) will be calculated using the Monte Carlo Simulation method. The reliability index β represents the ratio of its mean μ
S-O and the standard deviation σ
S-O (
Figure 10).
In the same way, the probability p
i-j for all other key risk combinations can be determined. The result of the reliability analysis is the risk ranking probability matrix (
Table 8). It can be seen that p
j-i = 1 − p
i-j.
6. Discussion
The application of the ANP method for risk assessment in the levee reconstruction projects results in a ranking of risks according to the value of their risk exposure. Depending on the position of the risk in the risk priority list, or the relative value of its exposure with respect to other risks, appropriate resources will be utilised for the anticipated risk response. Owing to the fact that 35 experts participated in the decision to allocate risk response resources, the geometric mean method was used to determine the risk exposures for each key risk. These risk exposure values were then normalised so that their sum is equal to one. The value of the normalized risk exposure for each key risk is proportional to the resources that will be allocated to the risk responses.
The reliability of using the geometric mean method to reach consensus in decision making was analysed by determining the probability that a lower-ranked risk had a higher risk exposure than a higher-ranked risk.
Table 8 shows that the probability that
Overtopping and
Monitoring risks switch places in the rankings is 0.014. This means that out of 1000 experts, only 14 of them will give higher priority (and higher risk response) to
Design risk over
Performance risk. This example indicates high reliability in the allocation of risk response resources. However, the probability of
Performance risk and
Overtopping risk switch places in the rankings is 0.320. This means that as many as 30.2% of the entire expert population will prioritise
Overtopping risk over
Performance risk. It is therefore difficult to speak of confidence in the consensus reached.
If consensus is not reached with satisfactory reliability, two approaches are possible. The first approach is to apply the Delphi method of reaching consensus, by sending experts the values of normalised risk exposures of key risks obtained by the geometric mean method. After the results of the second round arrive, a new reliability analysis is performed, and the corresponding probabilities are calculated. The rounds are repeated until consensus is reached, or until the highest probability that indicates that the risks of switching places in the rankings is less than some threshold value. It is proposed that this probability be less than 0.05, which means that for every 100 experts, five of them will have different priorities in the risk ranking.
Another approach is to redistribute risk response resources based on the results of the reliability analysis. This can be achieved by changing the values of the risk exposures shown in
Table 7. Let the risk exposure of lower-ranked risk be
a and let the risk exposure of higher-ranked risk be
b. Let the probability that a lower-ranked risk has a higher risk exposure than a higher-ranked risk be
p. The risk exposure of the lower-ranked risk should be increased to become
c =
a + (
b − a) ×
p and the risk exposure of the higher-ranked risk should be reduced to become
d =
b − (
b −
a) ×
p. The total value of risk exposures for these two risks remains the same because
a +
b =
c +
d. If all experts have the same preferences, the probability that the two risks will switch places will be
p = 0. No redistribution is made, and the risk exposures remain the same because
c =
a and
d =
b. If half of the experts assume that more resources are needed to respond to one risk, while the other half assumes that it should be done for the other risk, then the probability of the two risks switching places will be
p = 0.5. Reallocations will be made in such a way that equal resources are allocated for both risks. Risk exposures become equal to their arithmetic mean because
c = 0.5 × (
a +
b) and
d = 0.5 × (
a +
b). The reallocation of resources for risk responses is presented in
Table 9. It shows that the resources now should be allocated as follows:
Site Investigation risk (28.9%),
Performance (24.6%),
Overtopping (24.1%),
Monitoring (16.6%) and
Design (5.8%).
7. Conclusions
Floods are natural disasters that cannot be completely prevented. With the continued development of flood protection systems, construction of protective and regulatory water structures, and implementation of flood protection measures, flood risks can be reduced significantly. Owing to climate change, effective and sustainable flood protection has recently become an increasingly important consideration worldwide. The concept of flood protection has traditionally been based on levees. Flood risk management involves a comprehensive approach to reducing the probability of floods and their potential adverse effects on the population, economy and environment. To reduce the risk of flooding, it is necessary to reconstruct and upgrade the existing levees. The identification of key risks, risk assessment and allocation of foreseen risk response resources are presented on the example of the Otok Virje-Brezje levee located in the northwest part of the Republic of Croatia. Owing to a large water wave, the levee collapsed in width of 50 m and flooded approximately 6.45 km2 of the occupied area.
To identify the key risks as the most appropriate, a brainstorming technique was selected. A group of experts (designer, project manager, project auditor, supervisor, and contractor representative), directly involved in the levee reconstruction project, was selected. The list of the key risks was verified with the help of a group of 30 experts with significant experience in similar projects. It was concluded that a high degree of consensus was reached on the selection of key risks in the levee reconstruction project. Owing to the fact that it was necessary to combine quantitative and qualitative approaches to risk analysis, ANP was chosen as one of the methods for multi criteria decision making. The application of the ANP method helped with the formation of a risk priority list and the allocation of risk response resources in proportion to the value of their risk exposures. A group of 35 experts participated in the risk assessment. The geometric mean method was used to reach consensus in group decision-making. The reliability of using the geometric mean method was analysed by determining the probability that a lower-ranked risk had a higher risk exposure than a higher-ranked risk. The scientific contribution of this manuscript is the development a novel application of reliability analysis for risk ranking in a levee reconstruction project. The research contributes to the development of group multi criteria decision-making methods related to risk contingency measures. It can improve the planning and effective management of levee construction processes.


