


Abstract
Wetlands provide ecosystem services for regional development, and, thus, have considerable economic value. In this study, a combination of evaluation methods was carried out to evaluate the wetland ecosystem services provided by national nature reserves in 11 coastal provinces/municipalities in China. We constructed a literature database containing 808 observations (over 170 papers) on field-scale research for wetlands in China’s coastal zones. Using this literature database, as well as land use (LU) data, net primary productivity (NPP), and statistical data, and digital elevation model (DEM) data, we established a valuation framework and database for nine important ecosystem services of the 13 wetland types in the study area. After the large-scale academic literature review, the ordinary kriging offered by Geostatistical Analyst tools was used to interpolate the physical dimensions of the unmeasured locations. The results showed that: (1) the wetland ecosystem services in 35 national nature reserves have a total value of 33.168 billion USD/year; (2) the values of wetland ecosystem services revealed considerable spatial variability along China’s coastal zones; and (3) assessments provide additional insights into the trade-offs between different ecosystem services and wetland types. The valuation framework and database established in this study can contribute to the mapping of wetland ecosystem services in coastal zones.
1. Introduction
Historically, wetlands have been considered as wasteland that should be drained for economic development [1]. Today, wetlands are widely recognized to provide important and valuable ecological services for human well-being [2,3,4]. Natural wetlands are often more valuable than converted ones [5].
Wetlands in China, especially in the coastal zones, support abundant biodiversity and provide the foundation for regional development in different means, including by producing fishery products, absorbing pollutants, allowing for carbon storage, serving as ecological barriers against extreme weather events, enabling tourism and recreation, providing spawning and nursery sites for fish species, and providing refuel sites for millions of migrating birds [6]. However, these ecosystems have been reclaimed at an alarming rate over the last decades [7]. China’s coastal wetlands have declined by up to 58% from 1950–2014 [8]. The Yellow Sea tidal flats in China have lost 70% of their area between the 1950s and the 2000s, and their status has become endangered [7,9]. Mangroves have declined by 69% from 1950–1997; large-scale mangrove restoration projects from 1997 to 2013 have restored the area of mangroves to its 1980 level, but this only represents 68% of its level during the 1950s [8]. Wetlands are endangered by numerous factors, such as continuing population growth and economic expansion in coastal areas, unreasonable utilization, increased aquaculture and expanding residential regions, the underappreciated value of wetlands, and inappropriate definitions of wetlands in laws and regulations [6,8,10]. Among these factors, the misunderstanding of the value of wetlands in public decision is the essential issue. In the past, the pursuit of short-term economic benefits has led to coastal wetlands being converted to artificial lands, such as salt pan and mariculture [7]. More recently, the lack of trade-offs in the value of wetlands has misled the direction of wetland restoration, with much of the coastal land being restored to less-than-ideal types. A comprehensive and rapid wetland evaluation method is urgently needed in wetland conservation and restoration, especially on larger scales.
Despite a broad recognition of its importance [11,12], the valuation of wetland services has gaps. A literature review of 101 studies on the valuation of mangroves, sea grasses, and salt marshes from 2007 to 2016 shows that the benefit transfer regularly lacked the consideration of relevance between the original study and the case study of interest [13]. Among the 175 publications of research on ecosystem services in China from 2000 to 2016, limited studies focus on wetlands (3%), rivers (3%), lakes (2%), coastal ecosystems (1%), aquaculture (1%), and mangroves (1%) [14,15,16,17,18,19,20,21,22,23,24,25,26]. In addition, obtaining sufficient information on the extent of all wetland types is, at times, a challenge during the assessment [5]. In this context, combining satellite remote sensing data with the literature data of field surveys, and using upscaling to estimate ecosystem features, can reduce the valuation uncertainty and demonstrate the spatial distribution of wetland ecosystem services.
National nature reserves along China’s coastal zones preserve relatively complete wetland types. Included in the 35 national nature reserves are 12 internationally and 23 nationally important wetlands, which are therefore selected as the study area and basis for a valuation framework and database for nine ecosystem services of 13 wetland types. In China’s coastal zones, most studies of wetland ecosystem features are reported in Chinese and inaccessible to the global research community, and, thus, we constructed a literature database containing 808 observations (over 170 papers) in English or Chinese. On the basis of Remote Sensing and Geographic Information System technology, we used high-resolution Landsat TM image data of the study areas, net primary productivity (NPP) data, Digital Elevation Model (DEM) data, literature data, and statistical data. The ecosystem services values (ESV) were assessed by drawing a connection between the observed land use dynamics and the physical dimensions of the ecosystem services. The latter were obtained from upscaling the results of the reviewed field-scale research in the literature database, using Geostatistical Analyst tools. The valuation framework and database in this study provides scientific support for resource managers and policy-makers in wetland conservation and restoration.
2. Materials and Methods
2.1. Study Area
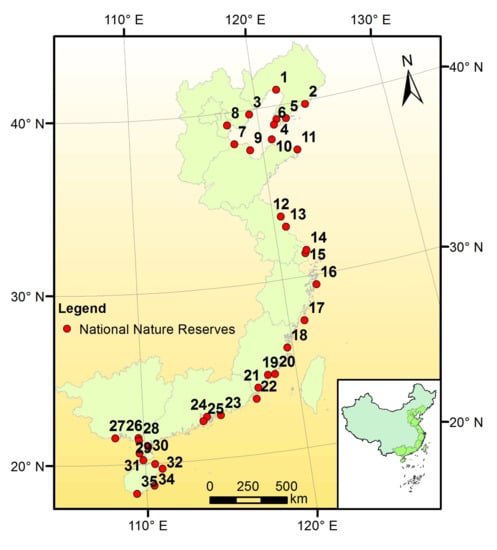
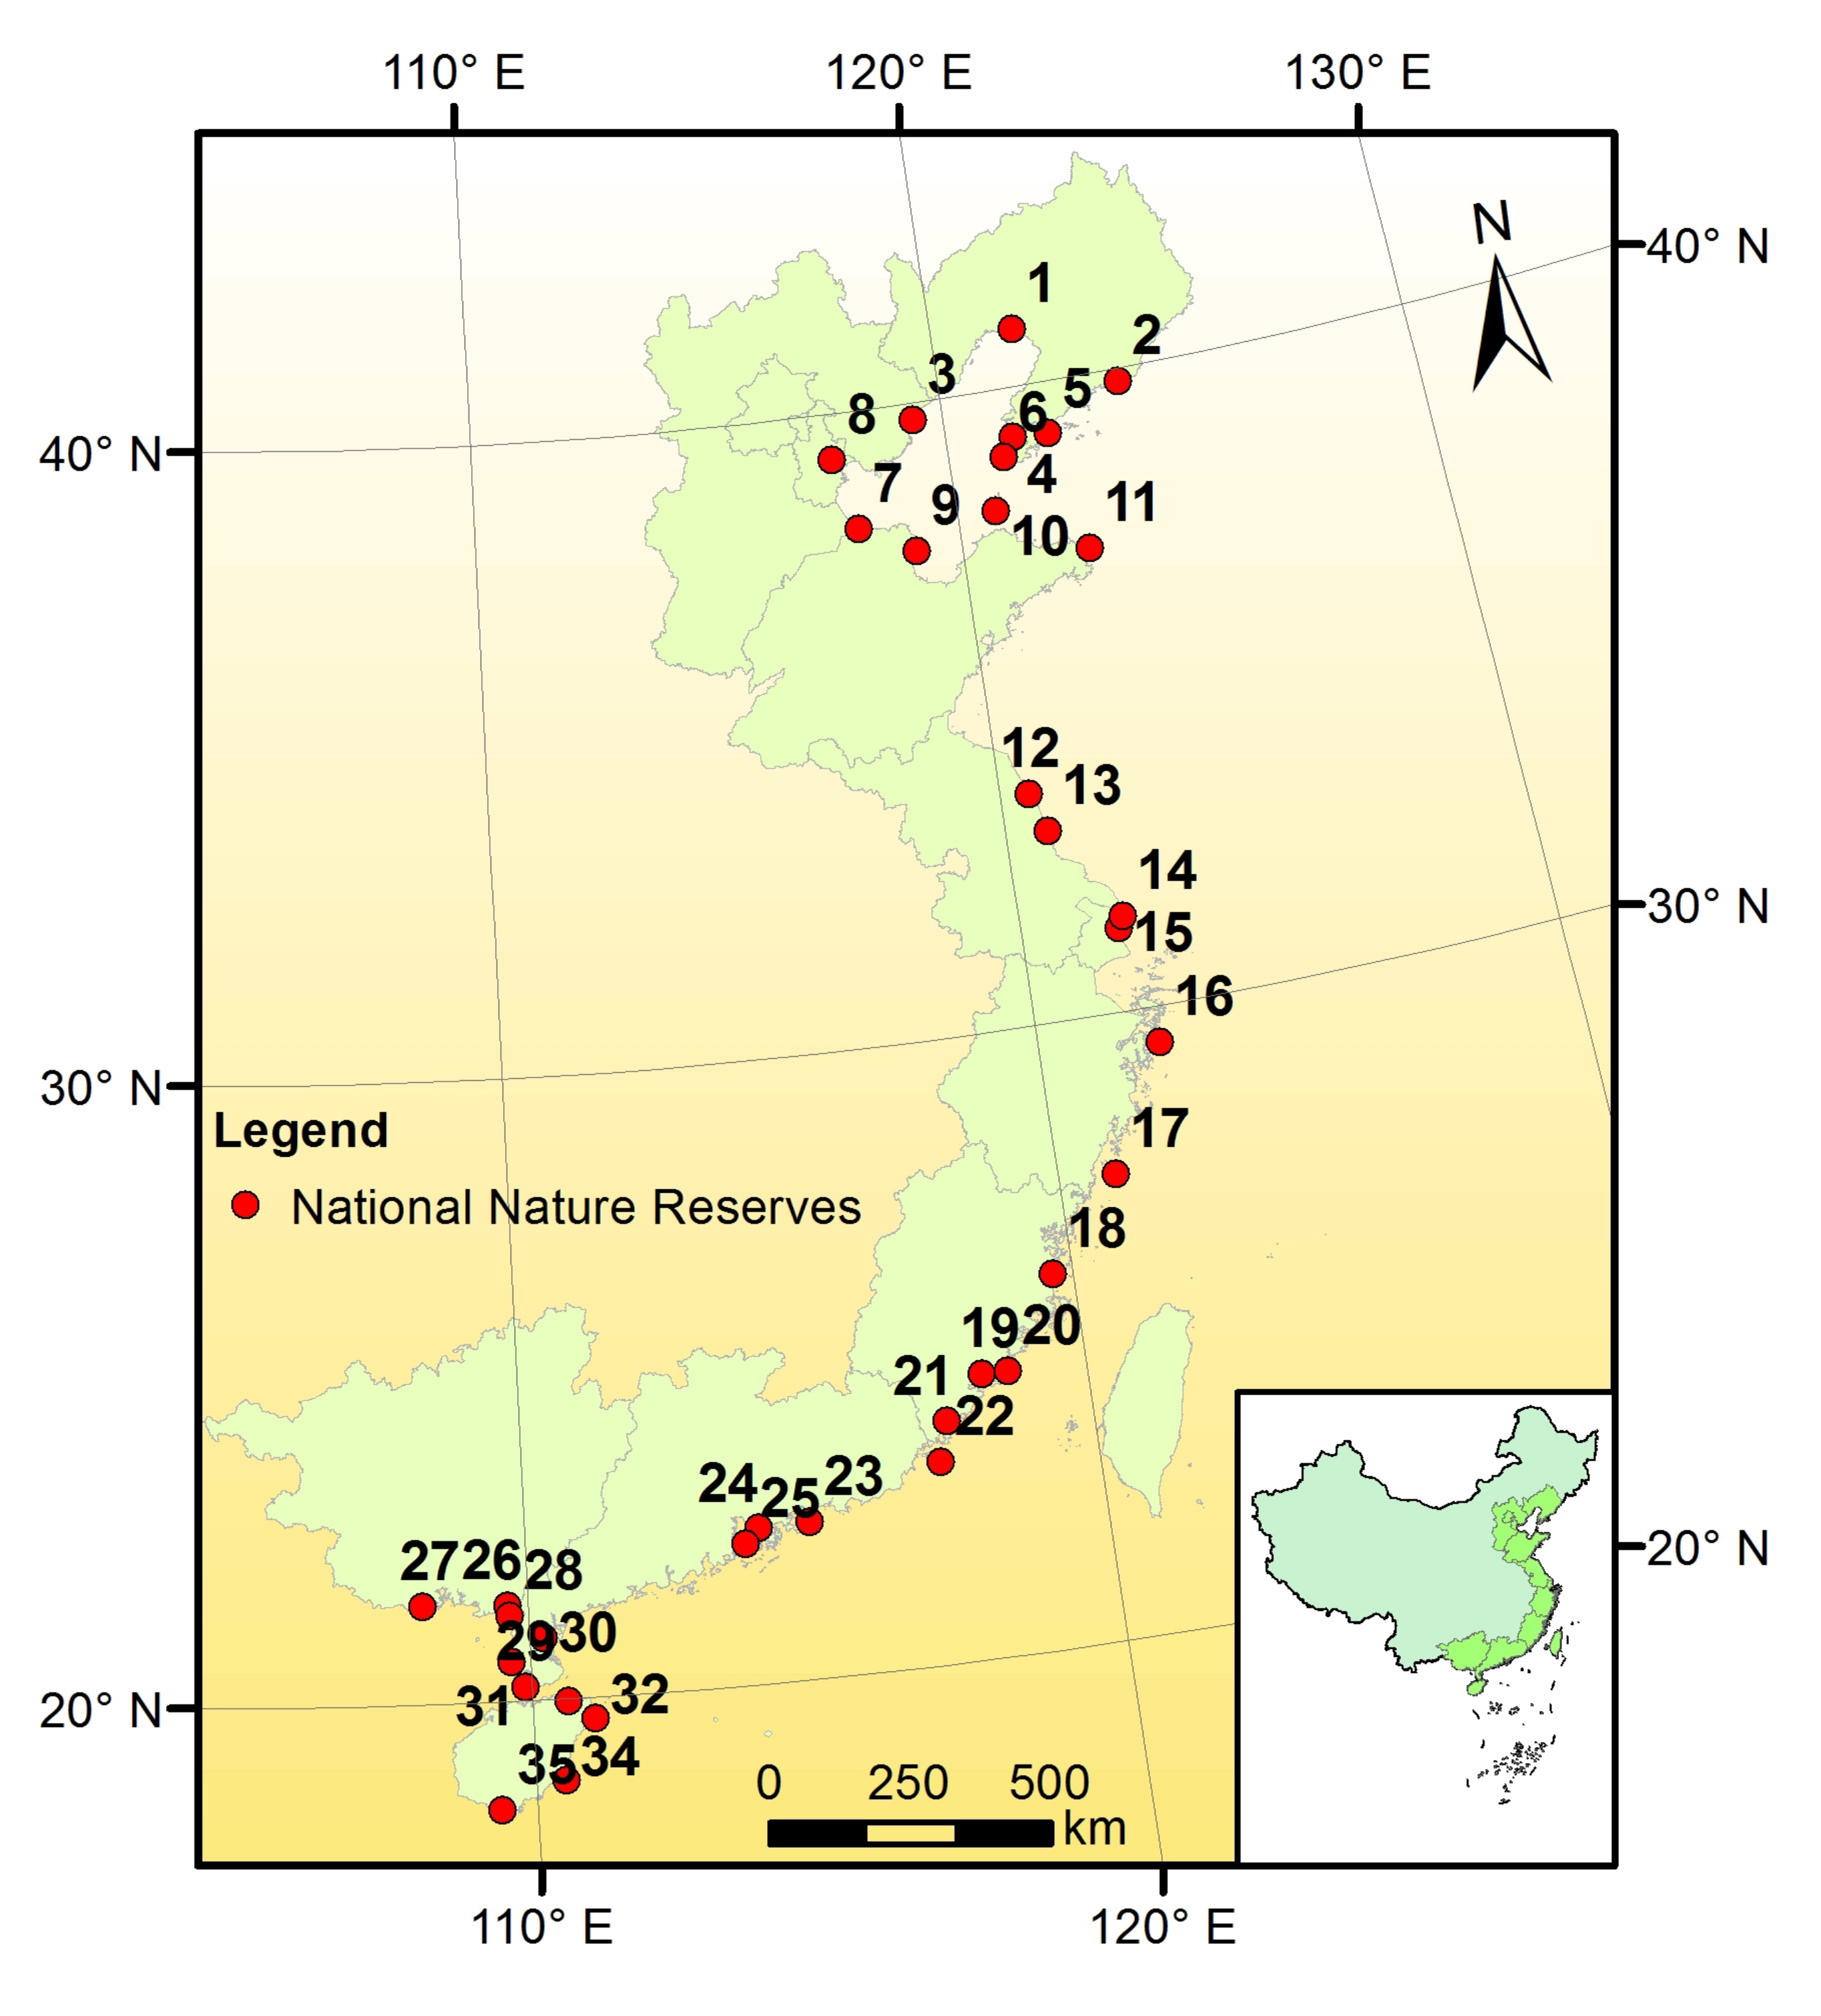
This study evaluated wetland ecosystem services in 35 national nature reserves in 11 coastal provinces/municipalities in China (Table 1, Figure 1) (Taiwan, Hong Kong, and Macao are not included due to data limitations). These national nature reserves are managed by different departments, including the environmental protection sector, marine sector, forestry sector, and agriculture sector, among others. The types of wetlands include rivers, lakes, reservoirs and ponds, bottomland, tidal flats, estuarine waters, estuarine delta, coastal lagoons, mangroves, shallow water, coral reefs, salt pan, and mariculture. Included in these 35 national nature reserves are 12 internationally and 23 nationally important wetlands.
Table 1.
Names and distributed regions of the study areas.
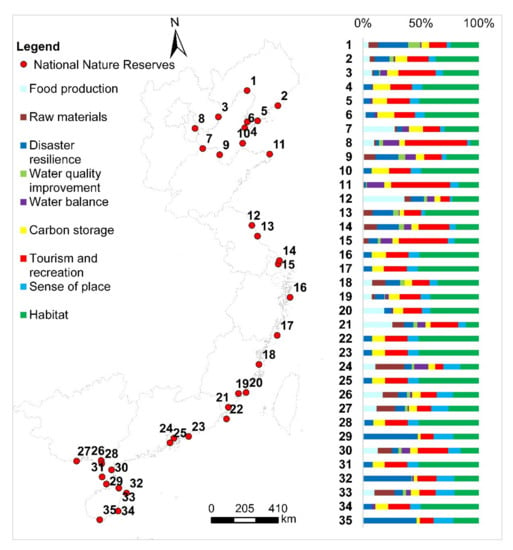
Figure 1.
Distribution of the 35 national nature reserves (Numbers correspond to Table 1).
2.2. Data Description
Table 2 reports the data sources of the valuation for each ecosystem service. The data used for the ESV calculation were mainly derived from land use (LU) data, NPP data, DEM data, the database of published literature, statistical yearbooks, and complementary special yearbooks.
Table 2.
Data sources for the valuation for each ecosystem service.
2.2.1. LU Data
LU data from 2015 were used to estimate the size of the wetlands. The China Coastal Land Use Data Set established China’s coastal LU data products by interpretation on the basis of Landsat Thematic Mapper/Enhanced Thematic Mapper Plus (TM/ETM+) and Landsat Operational Land Imager (OLI) images; the LU types were divided into eight level-1 types and 24 level-2 types [27,28,29]. In 2015, the overall accuracy of the China Coastal Land Use Data Set reached 93.98%, with the Kappa coefficients of 0.9229 [29]. In the present study, level-2 LU types were used to identify the area of 12 wetland types in the 35 national nature reserves, including rivers, lakes, reservoirs and ponds, bottomland, tidal flats, estuarine waters, estuarine delta, coastal lagoons, shallow water, coral reefs, salt pan, and mariculture [28].
The LU area data of the national nature reserves in the published literature were used as complementary material. Mangrove_TNC2014—the spatial distribution vector data of mangrove derived from The Nature Conservancy (TNC)—was used to identify mangrove areas.
In ArcGIS 10.2, the boundaries data of the 35 national nature reserves were used to clip LU, NPP, DEM data to obtain spatial data for each reserve.
2.2.2. NPP Data
NPP is the difference between Gross Primary Productivity and autotrophic respiration. It is the net production of plant biomass in a given time. In this study, NPP data were used to estimate the annual biomass of wetland plants in order to evaluate raw materials. The NPP data used were the products of MODIS NTSG MOD17 v55 annual/30-arcsec NPP in 2015 (Table 2) [30,31]. After boundary clipping, the NPP per unit area in each reserve was calculated. On the basis of the area of the wetlands and NPP per unit area data, the annual biomass of wetland plant raw materials in each reserve was consequently obtained.
2.2.3. DEM Data
DEM data were used to calculate wetland reservoir capacity in the study area. The DEM data used were the products of ASTER Global Digital Elevation Model (GDEM), which were posted on a 1 arc second (approximately 30 m at the equator) grid (Table 2). In this study, the data were reprocessed and DEM data of the study area with a resolution of 100 m were obtained. The volume of the area below the horizon line was calculated by DEM. The volume of the wetland area above the horizon was calculated by the wetland volume algorithm (wetland area *0.81 m). Consequently, the wetland reservoir capacity was obtained.
2.2.4. Literature Database
The data used for the assessment of the ecosystem services were obtained from upscaling the results of the reviewed field-scale research in China’s coastal zones. Data were collected from published literature available at the China National Knowledge Infrastructure (CNKI; http://www.cnki.net/) and ScienceDirect (https://www.sciencedirect.com/) until the end of 2018. The literature was published in Chinese or English. The data collected included: (1) the output of crude salt per unit area, the width and wave attenuation of typical wetland vegetation species, the removal rates of N and P of typical wetland vegetation species, the carbon density (in the aboveground and belowground, litter, and soil) of different wetland types, and the LU data for the reserve (used as complementary); (2) the value of disaster resilience, habitat, sense of place, and tourism and recreation per unit area; and (3) the construction cost of reservoirs per unit, the price of crude salt per unit, the price of plant raw materials per unit, and the price of N and P removal per unit. After three screening steps, we constructed a literature database containing over 170 papers (808 observations) for wetlands in China’s coastal zones. In addition to the data mentioned above, we also collected any available information on province or city, study area, year of research, longitude, latitude, wetland types, annual precipitation, annual mean temperature, vegetation types, and methods for each observation. The sites of the database span a latitudinal range from 19.3 N in the Hainan province to 47 N in the Northeastern Plain. The data found were from different types of wetlands. Several observations came from the same wetland area, allowing for the analysis of the spatial scale variability. For a bibliography of the studies collected in the literature database, see Supplementary Materials (Table S1).
2.3. Evaluation Methods
The ecosystem services can be classified into four categories: (1) provisioning, (2) regulating, (3) cultural, and (4) supporting services [5]. Following this classification framework, the 13 wetland types were evaluated using nine important ecosystem services, namely food production, raw materials, disaster resilience, water quality improvement, water balance, carbon storage, tourism and recreation, sense of place, and habitat.
Among the nine ecosystem services, five (food production, raw materials, water quality improvement, water balance, and carbon storage) were estimated in two steps. The first step was to calculate the physical dimension of each ecosystem service. The physical dimensions of food production were the result of upscaling using the statistical data (i.e., the aquatic output, output value, area) of coastal provinces, counties, and cities where the reserve is located. The physical dimension of crude salt in raw materials—output of crude salt per unit area—was obtained from the literature. The physical dimensions of plant raw materials were calculated on the basis of NPP and LU data. The physical dimensions of the water balance were calculated on the basis of DEM and LU data. The physical dimensions of the water quality improvement and carbon storage were obtained from the literature. These included N and P removal rates, vegetation carbon density (aboveground and belowground), litter, and soil (0–100 cm) carbon density. The ordinary kriging of the Geostatistical Analyst tools in ArcGIS 10.2 was used to interpolate these physical dimensions for the unmeasured locations using the data from the measured locations in the literature database. The second step was to calculate the value of each ecosystem service based on the physical dimension by evaluation method. The market price method was used to estimate the value of food production, raw materials, and carbon storage. The avoided cost method was used to assess the water quality improvement value. The shadow project method was used to assess the value of water balance.
The values of the other four ecosystem services (disaster resilience, tourism and recreation, sense of place, and habitat) with limited valuation data were estimated using a benefit transfer technique [32]. On the basis of the literature database, the average of the value estimates from similar or the same locations was applied to the target area. In this study, all value estimates were standardized to USD/ha/y at 2015 price levels. Table 3 reveals detailed information on the evaluation methods used.
Table 3.
The evaluation methods used.
3. Results
3.1. Spatial Variability of ESV
In this study, we evaluated nine important wetland ecosystem services that were universal across coastal zones. These ecosystem services were classified into four categories: (1) provisioning: food production, raw materials; (2) regulating: disaster resilience, water quality improvement, water balance, carbon storage; (3) cultural: tourism and recreation, sense of place; and (4) supporting services: habitat.
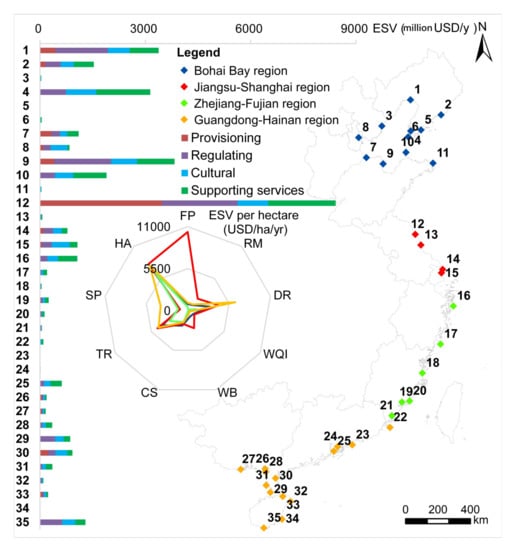
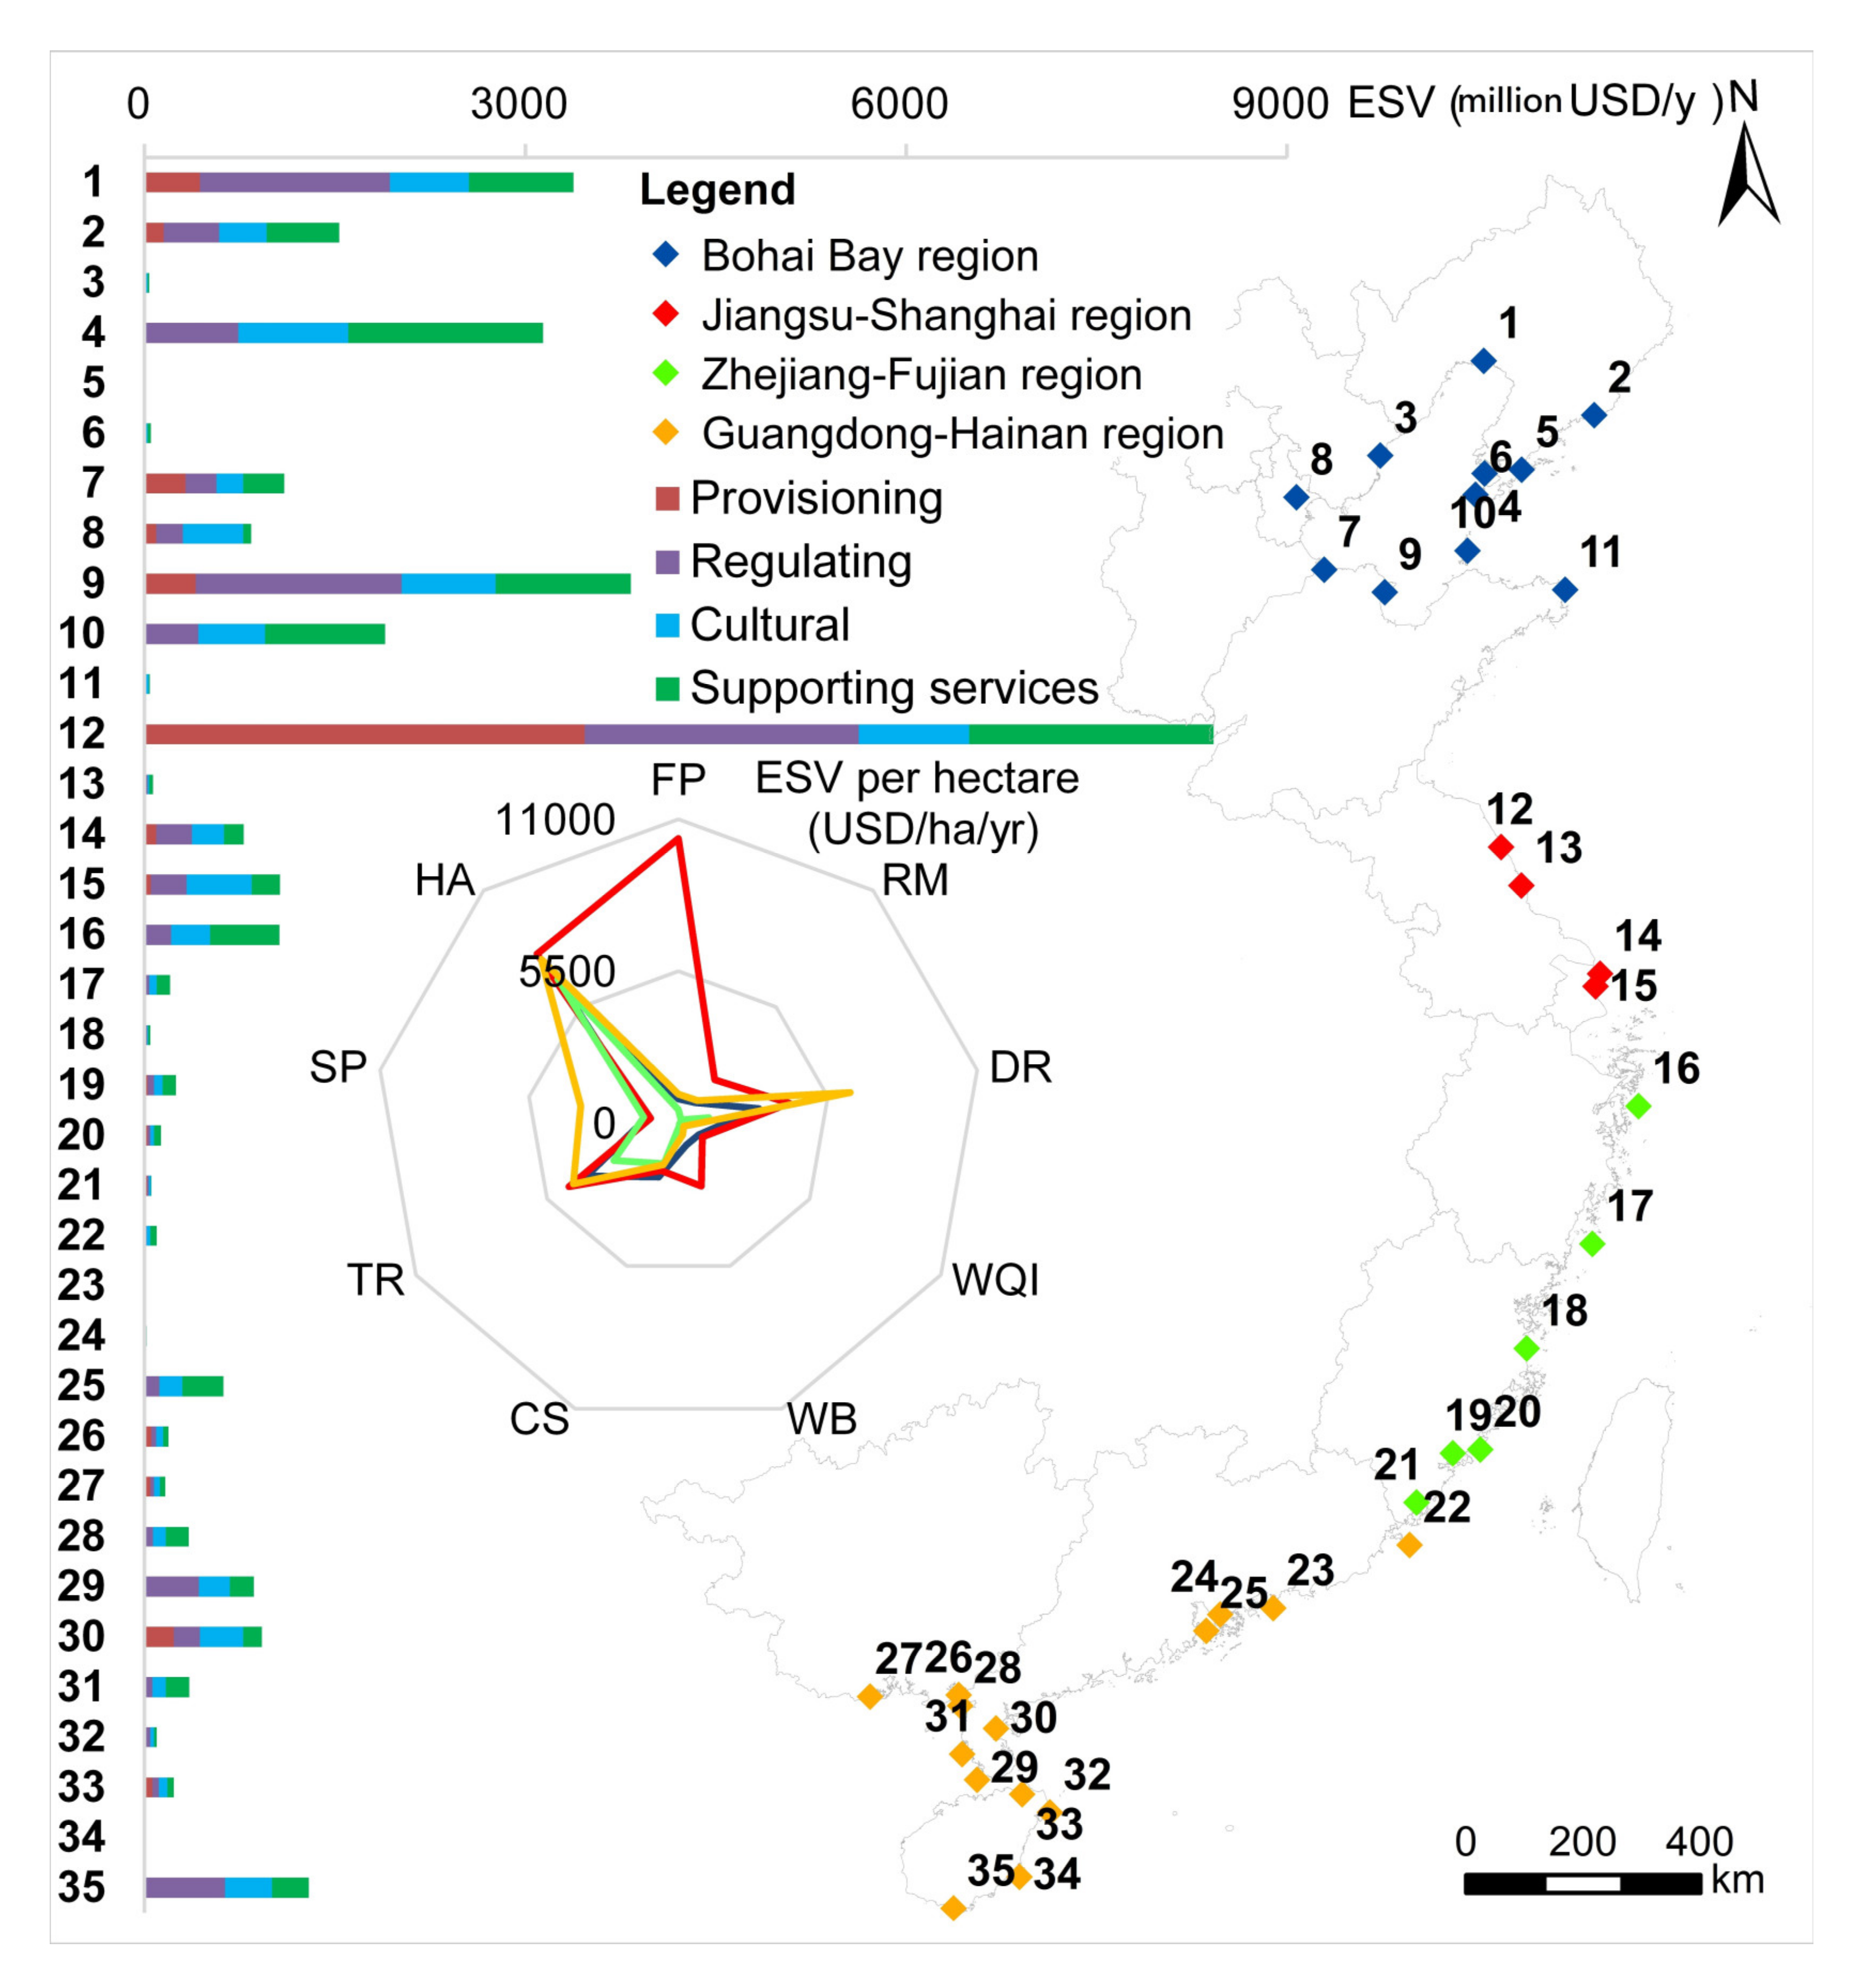
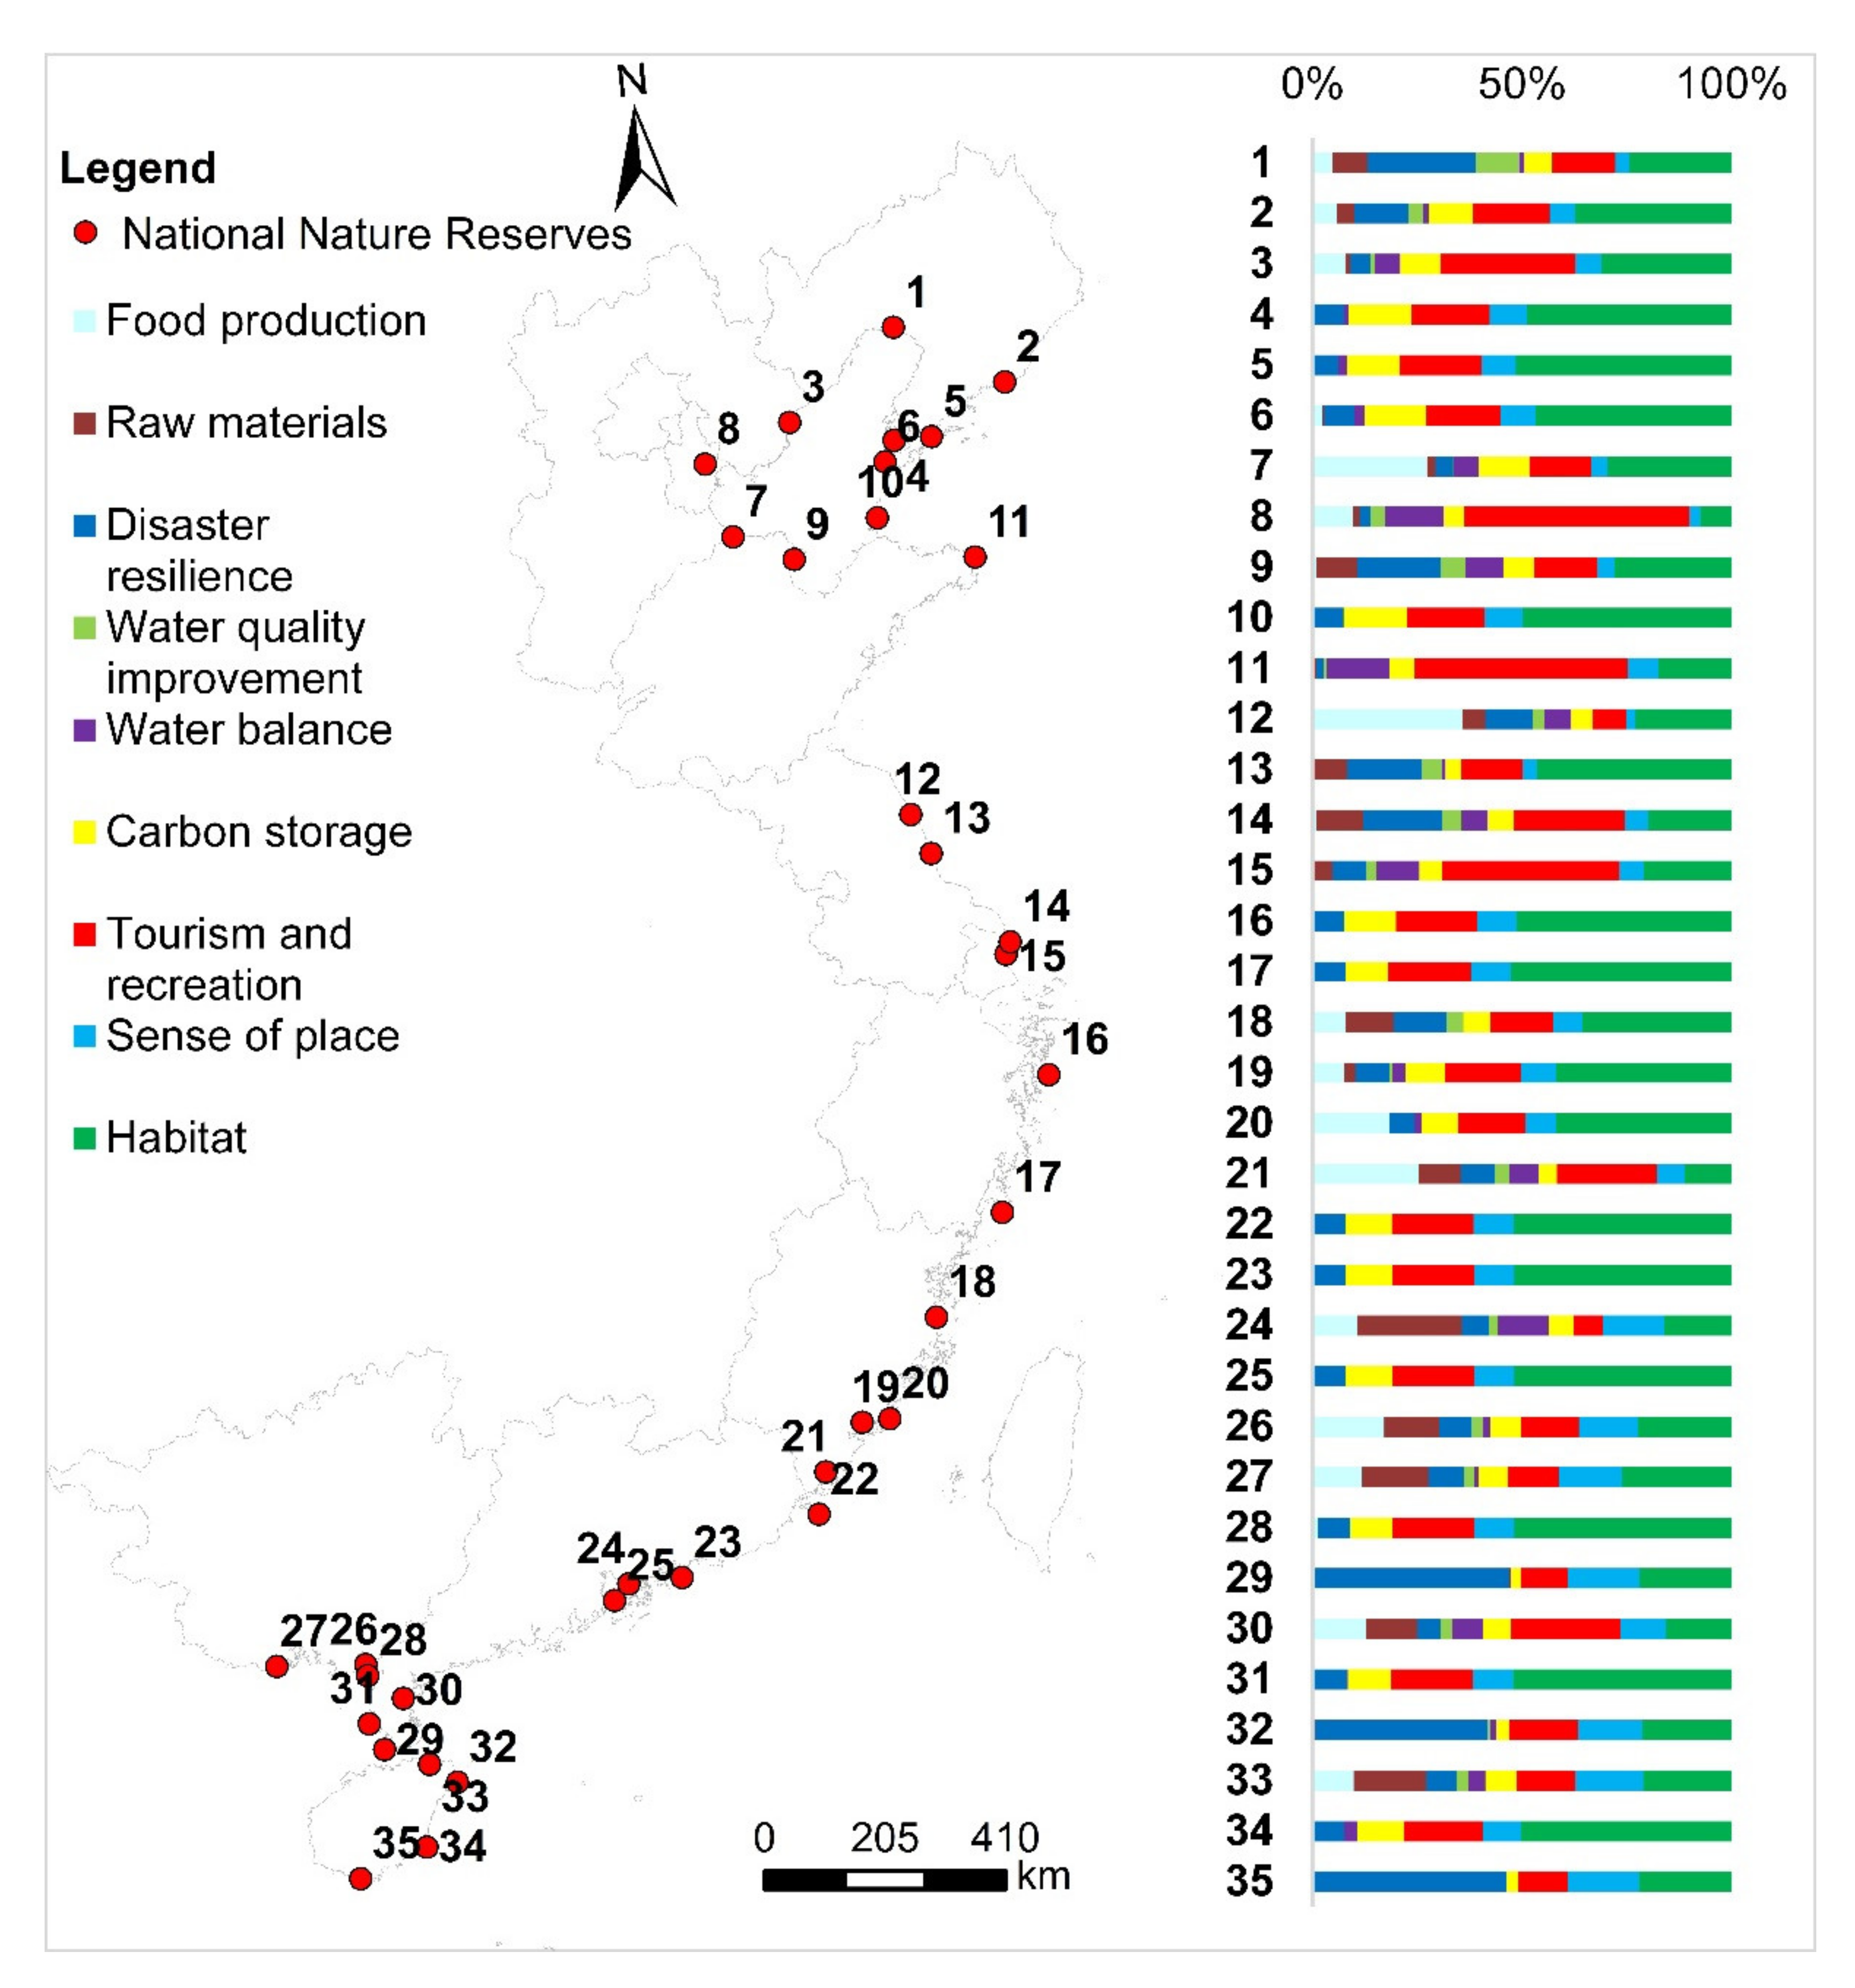
Figure 2 shows the values of the wetland ecosystem services in 35 national nature reserves. The Jiangsu Yancheng Rare Birds National Nature Reserve (No. 12) had the highest ESV (8,422.47 USD×106) due to its valuable services of food production and habitat (Figure 3). The Shandong Yellow River Delta (No. 9), Liaoning Liaohe River Estuary (No. 1), and Liaoning Dalian Spotted Seal (No. 4) National Nature Reserves followed, mainly due to the contributions of habitat and disaster resilience; except for the latter, which had high value of tourism and recreation in addition to habitat service. Among the 35 national nature reserves, 27 comprised the sum of regulating, cultural and supporting services that accounted for over 80% of the total ESV.
Figure 2.
The values of the wetland ecosystem services of 35 national nature reserves, and the radar chart of ecosystem services values for the four regions (Blue line: the Bohai Bay region; red line: the Jiangsu–Shanghai region; green line: the Zhejiang–Fujian region; orange line: the Guangdong–Hainan region. The numbers of national nature reserves correspond to Table 1).
Figure 3.
Value composition (percentage) for the wetland ecosystem services of each national nature reserve (numbers correspond to those in Table 1).
To analyze spatial differences, we divided the study area into four regions, which follow: (1) the Bohai Bay region: National Nature Reserve numbers 1–11; (2) the Jiangsu–Shanghai region: National Nature Reserve numbers 12–15; (3) the Zhejiang–Fujian region: National Nature Reserve numbers 16–21; and (4) the Guangdong–Hainan region: National Nature Reserve numbers 22–35. Based on the ESV per hectare, a radar chart was drawn (Figure 2). Overall, the wetland ecosystem services among the four regions showed considerable spatial variability. The Jiangsu–Shanghai region showed the highest mean ESV per hectare (35,305.82 USD/ha/y) due to the contributions of food production, habitat, and tourism and recreation. The Guangdong–Hainan region (26,484.17 USD/ha/y) followed due to its valuable services of habitat and disaster resilience. The Bohai Bay region (20,562.48 USD/ha/y) was third, and the Zhejiang–Fujian region had the lowest mean ESV per hectare.
3.2. The ESV of the Seven Reserves Categories and 13 Wetland Types
According to the protection object or ecosystem type, the 35 national nature reserves can be divided into seven categories: (1) Island: numbers 6, 10, 16, 17, 22, 34; (2) Coral Reef: numbers 29, 32, 35; (3) Special Geological Landform: numbers 3, 5, 20; (4) Rare Animals: numbers 4, 11, 13, 19, 23, 25, 28, 31; (5) River Estuary: numbers 1, 2, 9, 14, 15, 18, 21, 27; (6) Mangrove: numbers 24, 26, 30, 33; and (7) Wetland: numbers 7, 8, 12. Figure 3 shows the value proportions of the wetland ecosystem services of each national nature reserve. Island showed a high proportion of habitat service value (50.53%), followed by tourism and recreation service value (18.98%); Coral Reef showed a high proportion of disaster resilience service value (46.00%), followed by habitat service value (22.07%); Special Geological Landform showed high value proportions of tourism and recreation (19.59%) and of habitat (39.67%) services; Rare Animals showed a high proportion of habitat service value (49.04%), followed by tourism and recreation service value (19.04%); River Estuary showed high value proportions of habitat service (26.78%) and of disaster resilience service (19.37%), especially in the Bohai Bay and Jiangsu–Shanghai regions; Mangrove showed high value proportions of tourism and recreation (22.22%), habitat (17.54%), and raw materials (13.41%) services; Wetland showed a high value proportion of food production service (32.72%). The values of the wetland ecosystem services of Island, Special Geological Landform, Coral Reef, and Rare Animals were mainly composed of five service types (98.62%), as follows: habitat, tourism and recreation, carbon storage, sense of place, and disaster resilience; the other four types of service accounted for a relatively small proportion (1.38%).
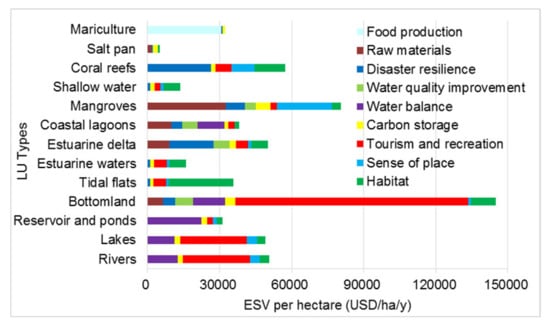
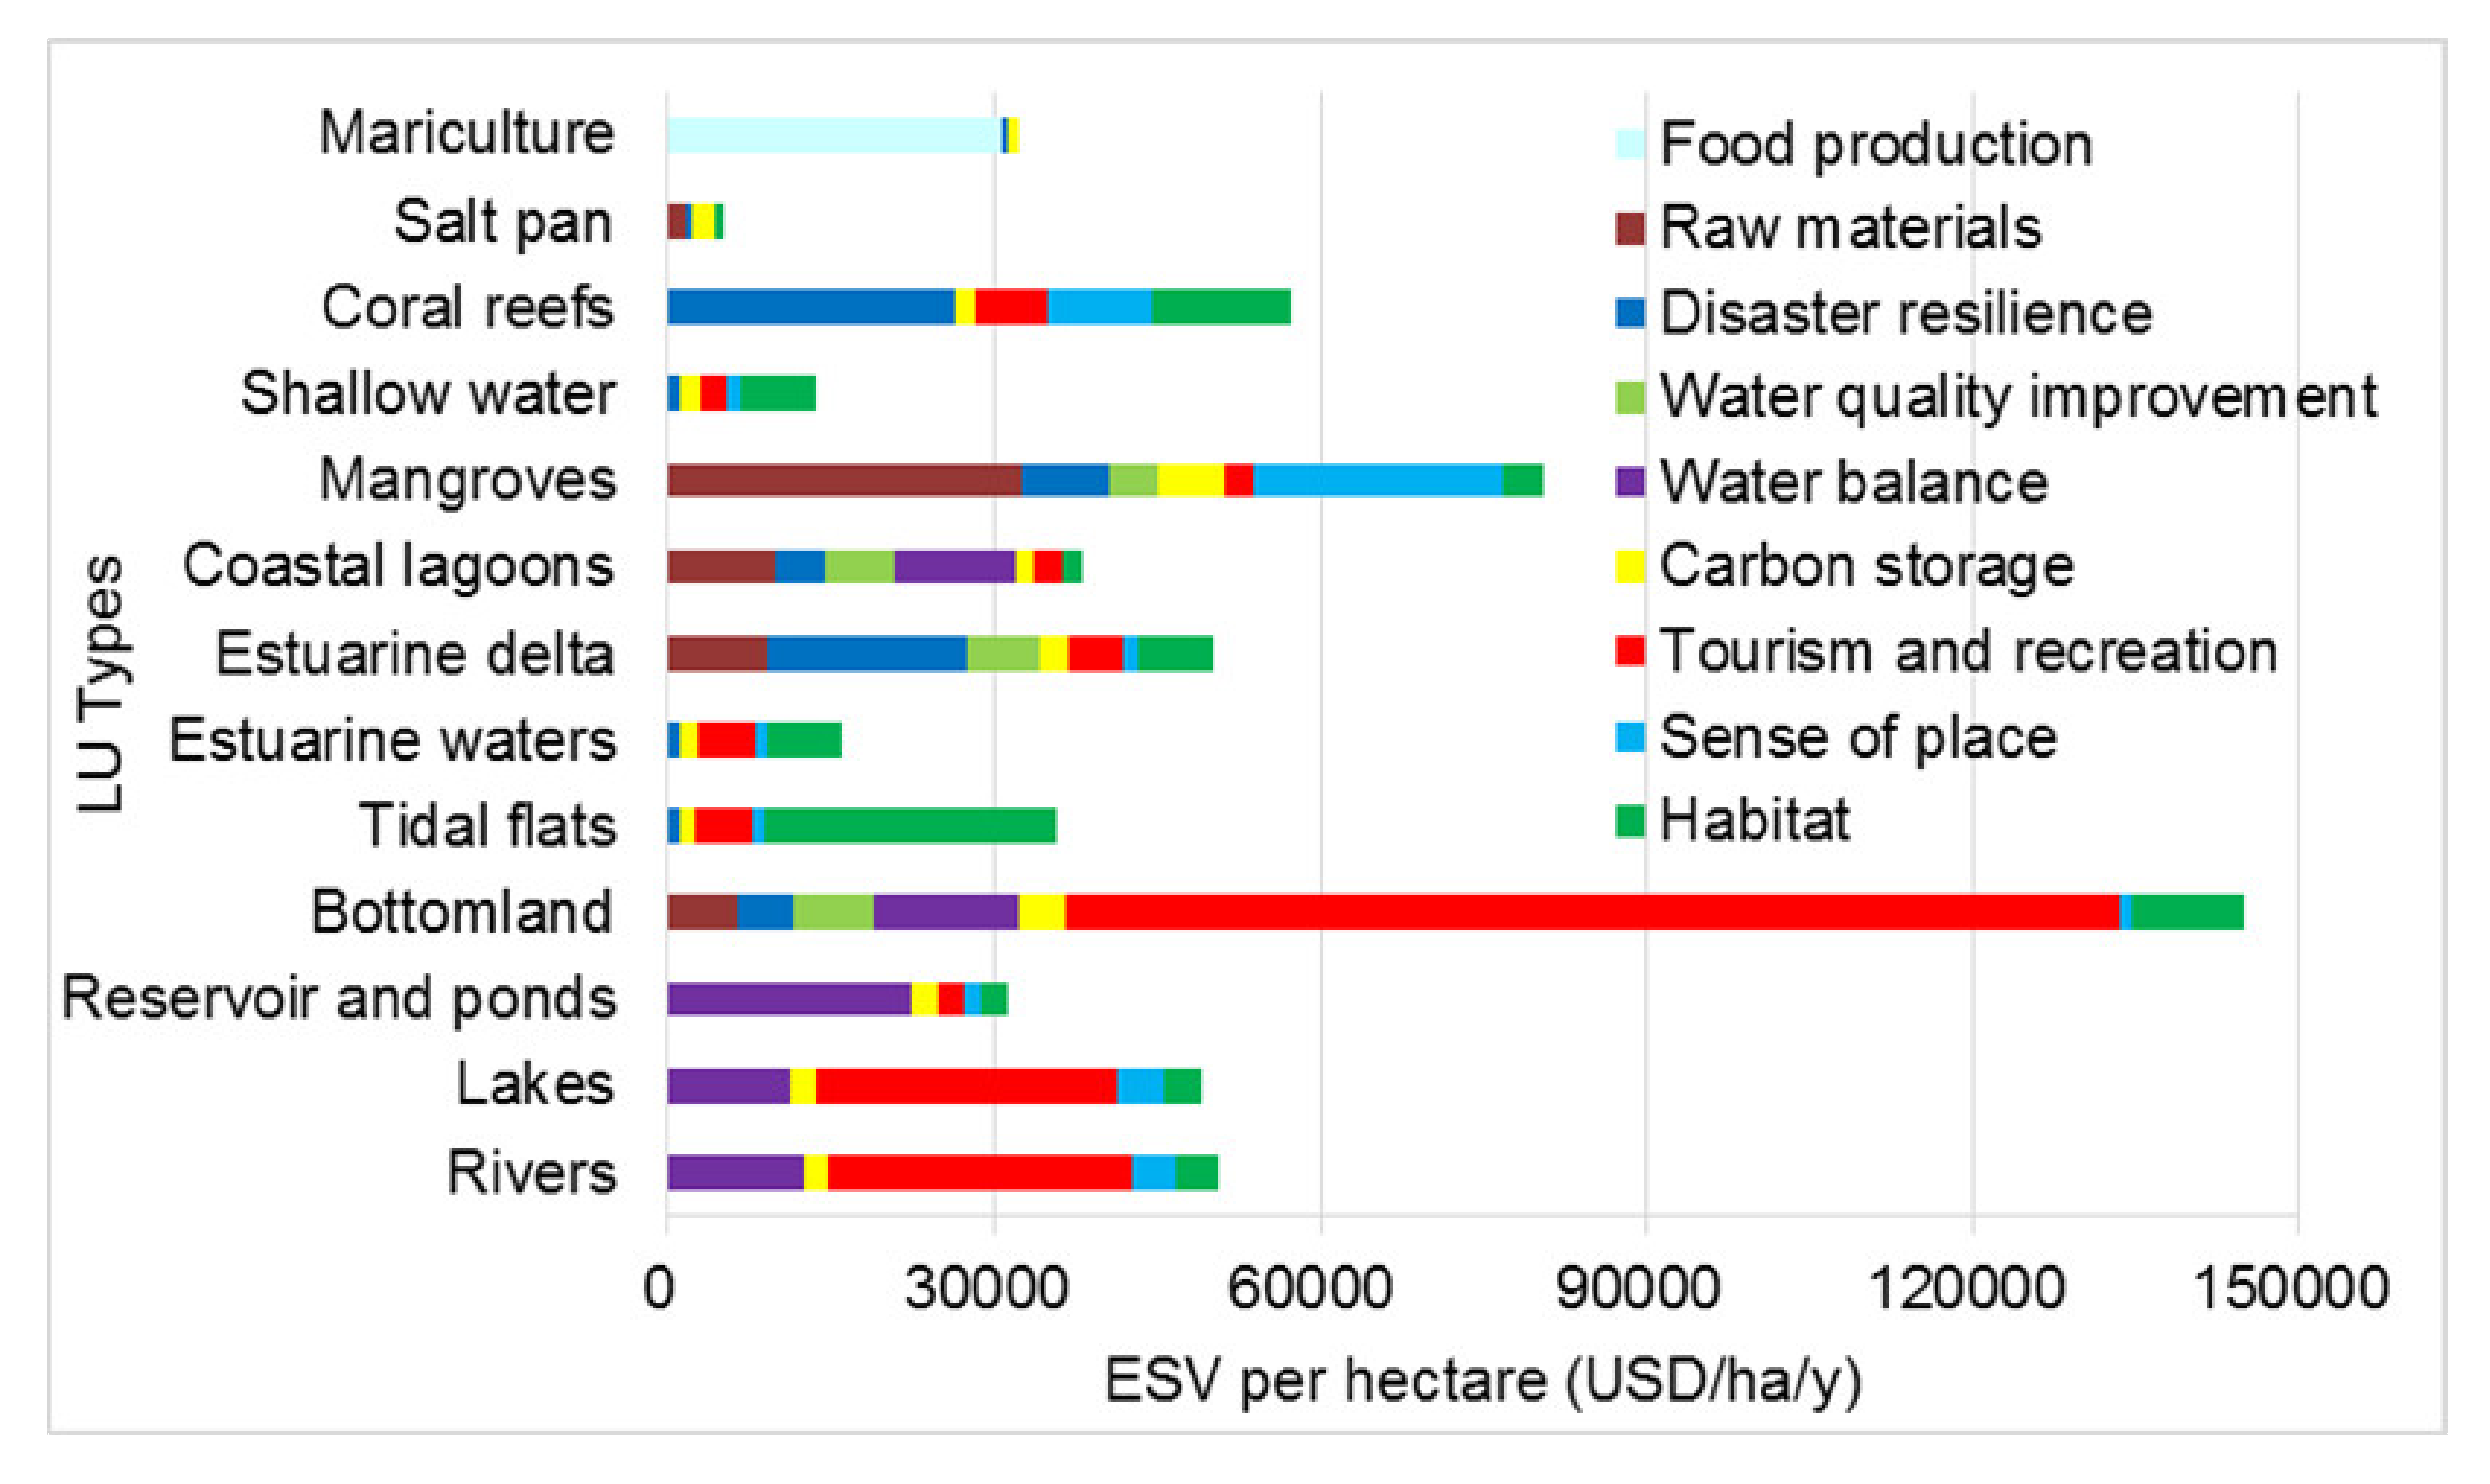
On the basis of the assessment results of the wetland ecosystem services in 35 national nature reserves, we compared the ESV per hectare of 13 wetland types (Figure 4). Bottomland had the highest ESV per hectare (144,842.33 USD/ha/y), followed by mangroves, coral reefs, rivers, estuarine delta, lakes, coastal lagoons, and tidal flats. The salt pan showed the lowest ESV per hectare (5,216.29 USD/ha/y). The value of food production of mariculture was greater than that of natural coastal wetlands, while those of other eight ecosystem services were 55%–100% lower in mariculture than that in natural coastal wetlands.
Figure 4.
ESV per hectare of 13 wetland types in 35 national nature reserves.
3.3. The Total ESV of 35 National Nature Reserves
The wetland ecosystem services in the 35 national nature reserves had a total value of 331.68 USDy−1 × 10⁸ (Table 4). Habitat was the most valuable ecosystem service (100.77 USDy−1 × 10⁸), followed by tourism and recreation and then disaster resilience services (55.15 and 48.67 USDy−1 × 10⁸, respectively). Water quality improvement was the least valuable ecosystem service (10.04 USDy−1 × 10⁸). The ESV of the four categories showed considerable variability. The supporting service provided the highest ESV (100.77 USDy−1 × 10⁸) due to the valuable habitat service. The regulating service also provided high ESV (99.85 USDy−1 × 10⁸) due to the contributions of disaster resilience and carbon storage services. The provisioning service contributed a low proportion (16.67%) of the total value.
Table 4.
Value composition for the wetland ecosystem services of the 35 national nature reserves.
4. Discussion
4.1. The Merits and Demerits of This Valuation Framework and Database
On the basis of LU, NPP, DEM, literature, and statistical data, we established a valuation framework and database for nine ecosystem services of 13 wetland types in China’s coastal zones. Considering the regional characteristics of the study area and the data accessibility, we made full use of the available resources, including spatial, statistical, and literature data based on local field survey of Chinese or English papers. This study provides an overall picture of the available data resources for estimating wetland ESV in China’s coastal zones.
This study shows that data from satellite (LU, NPP, and DEM), statistical yearbooks, and literature are useful and inexpensive in estimating the ESV of different wetland types in the coastal zone region. Compared with the long-term and large-scale field survey methods, these data enable a more reliable and rapid evaluation method of large areas [16,23], especially for wetlands in coastal zones on a national scale. On the one hand, the application of literature data based on local field survey can reduce the evaluation uncertainty. On the other hand, the application of satellite data can demonstrate the spatial distribution of the wetland ecosystem services.
The findings could empower environmental impact assessments knowledge at the international level. This study provides a picture of the ESV of 13 wetland types, which spans a latitudinal range from 19.3 N to 47 N in the Northern Hemisphere; it can contribute to wetlands valuation in coastal zones, especially for countries in the same latitude zone. The constructed valuation framework is an economically and temporally feasible method, and is practically applicable to other coastal countries, which could empower international wetland research collaboration in the future.
To a limited extent, this study valuated nine ecosystem services of 13 wetland types. This was due to the lack of suitable data and defensible methods. In future research, assessment of the nonlinear relationship between wetland size and ESV in the coastal zone region is necessary [33].
4.2. Insight in Wetlands Trade-Offs
This study provides additional insights into the trade-offs between different ecosystem services and wetland types [34,35].
In the past 30 years, large areas of natural wetlands in China’s coastal zones have been converted to salt pan and mariculture [7,36]. This conversion now presents serious problems, such as the loss of natural wetlands, coastal ecosystem degradation, and biodiversity decline [36]. The unit area value of salt pan obtained in this study was 5,216 USD/ha/y, and that of mariculture was 32,404 USD/ha/y. However, compared with natural wetlands, both types had lower regulating, cultural, and supporting services values per unit area, which also shows the importance of natural wetland protection from the ESV perspective.
In the past years, several wetland ecological projects have restored large areas to rivers and lakes in China’s coastal zones. Although rivers and lakes have a higher value of tourism and recreation services (27,876 USD/ha/y), their habitat service values (3,776 USD/ha/y and 3,402 USD/ha/y, respectively) are lower than that of other types of wetlands such as tidal flats, estuarine delta, and bottomland (26,742, 6,897, and 10,185 USD/ha/y, respectively). The important geographical position of China’s coastal zone in biodiversity protection necessitates emphasis on the restoration of habitat services in the design stage of wetland ecological restoration projects and the prioritization of wetland types with high habitat service values. Currently, to restore the mangrove forests in several “blue sea and silver beach” projects along the coastal zones of China, mangroves are planted on the tidal flats. Although mangroves have higher raw materials and disaster resilience service values than tidal flats, their habitat value is lower. Thus, the restoration of mangroves in tidal flats is inappropriate, especially in areas where tidal flats serve as valuable and irreplaceable habitat (e.g., as stopover sites for migratory birds). Therefore, finding ways to consider both habitat and other services by developing alternative options is critical to ensure a sustainable flow of services for both local and global stakeholders.
In such a case, comprehensive wetland valuation and trade-offs should be conducted in the design stage of wetland ecological restoration projects. Wetlands (i.e., tidal flats, estuarine delta, and bottomland) with high habitat service values should be priority in wetland restoration. A network approach should be conducted for understanding the opportunities and barriers to effective public participation in the management of protected areas. This valuation framework should be promoted through wetland conservation networks, such as the China Coastal Wetland Conservation Network, which incorporates the practitioners and stakeholders involved in the management of national nature reserves.
5. Conclusions
This study is the first attempt to establish a valuation framework and database for the nine ecosystem services of 13 wetland types in China’s coastal zones. We constructed a literature database containing over 170 papers (808 observations) on field-scale research for wetlands in China’s coastal zones. Using the literature database and data from LU, NPP, DEM, and statistical yearbooks, we evaluated the wetland ecosystem services provided by 35 national nature reserves in 11 coastal provinces/municipalities in China. The results showed that the wetland ecosystem services in the study area have a total value of 331.68 USDy−1 ×1 08. The wetland ESV also revealed considerable spatial variability along China’s coastal zones. This study provides a picture of the ESV of 13 wetland types and shows that spatial, statistical, and literature data are useful and inexpensive in estimating ESV of different wetland types in coastal zones. The application of literature data based on local field survey reduced the evaluation uncertainty. The application of satellite data demonstrated the spatial distribution of wetland ecosystem services, which can contribute to wetland ecosystem services mapping in coastal zones. The results provide insight into wetland trade-offs and the prioritization of wetland types with high service values, which would provide scientific support for resource managers and policy-makers in wetland conservation and restoration.
Supplementary Materials
The following are available online at https://www.mdpi.com/2071-1050/12/8/3131/s1, Table S1: Bibliography of studies collected in the literature database.
Author Contributions
Conceptualization, X.Y., X.H. and L.Z.; methodology, X.L., X.Y. and X.H.; formal analysis, X.L.; funding acquisition, X.Y.; investigation, X.L., X.H., Y.L. (Yubin Liu), H.L., Y.Z., S.X., Y.L.(Yu Liu), H.D., Y.W. and Y.D.; writing—original draft preparation, X.L.; writing—review and editing, X.Y., Y.Z. and M.Y.; supervision, X.Y., X.H. and L.Z.; project administration, Y.D. and S.X. All authors have read and agreed to the published version of the manuscript.
Funding
This research was funded by the SEE (Society of Entrepreneurs & Ecology) Foundation in the project of “Green Book: China’s Coastal Wetlands”, the National Natural Science Foundation of China (grant number 31500389), the Strategic Priority Research Program of the Chinese Academy of Sciences (grant number XDA19060205), and the National Natural Science Foundation of China (grant number 41561105).
Acknowledgments
We are grateful to Li Wu and Xianghong Di for their contributions during LU data downloading and processing. We are grateful to associate professors Yu Xiao and Wanqi Bai, and Ms. Zhiqin Zhou for their helpful comments on earlier manuscript drafts in Chinese. We also thank the anonymous reviewers for their precise and insightful comments.
Conflicts of Interest
The authors declare no conflict of interest.
References
- Mitsch, W.J.; Gosselink, J.G. Wetlands, 5th ed.; John Wiley & Sons, Inc.: Hoboken, NJ, USA, 2015. [Google Scholar]
- De Groot, R.; Brander, L.; van der Ploeg, S.; Costanza, R.; Bernard, F.; Braat, L.; Christie, M.; Crossman, N.; Ghermandi, A.; Hein, L.; et al. Global estimates of the value of ecosystems and their services in monetary units. Ecosyst. Serv. 2012, 1, 50–61. [Google Scholar] [CrossRef] [Scilit]
- Brander, L.M.; Florax, R.J.G.M.; Vermaat, J.E. The Empirics of Wetland Valuation: A Comprehensive Summary and a Meta-Analysis of the Literature. Environ. Resour. Econ. 2006, 33, 223–250. [Google Scholar] [CrossRef] [Scilit]
- Martínez, M.L.; Intralawan, A.; Vázquez, G.; Pérez-Maqueo, O.; Sutton, P.; Landgrave, R. The coasts of our world: Ecological, economic and social importance. Ecol. Econ. 2007, 63, 254–272. [Google Scholar] [CrossRef] [Scilit]
- Millennium Ecosystem Assessment. Ecosystems and Human Well-Being: Wetlands and Water Synthesis; World Resources Institute: Washington, DC, USA, 2005. [Google Scholar]
- Ma, Z.; Melville, D.S.; Liu, J.; Chen, Y.; Yang, H.; Ren, W.; Zhang, Z.; Piersma, T.; Li, B. Rethinking China’s new great wall-Massive seawall construction in coastal wetlands threatens biodiversity. Science 2014, 346, 912–914. [Google Scholar] [CrossRef] [Scilit]
- Murray, N.J.; Clemens, R.S.; Phinn, S.R.; Possingham, H.P.; Fuller, R.A. Tracking the rapid loss of tidal wetlands in the Yellow Sea. Front. Ecol. Environ. 2014, 12, 267–272. [Google Scholar] [CrossRef] [Scilit]
- Sun, Z.; Sun, W.; Tong, C.; Zeng, C.; Yu, X.; Mou, X. China’s coastal wetlands: Conservation history, implementation efforts, existing issues and strategies for future improvement. Environ. Int. 2015, 79, 25–41. [Google Scholar] [CrossRef] [Scilit]
- Murray, N.J.; Ma, Z.; Fuller, R.A. Tidal flats of the Yellow Sea: A review of ecosystem status and anthropogenic threats. Austral. Ecol. 2015, 40, 472–481. [Google Scholar] [CrossRef] [Scilit]
- Jiang, T.-T.; Pan, J.-F.; Pu, X.-M.; Wang, B.; Pan, J.-J. Current status of coastal wetlands in China: Degradation, restoration, and future management. Estuar. Coast. Shelf Sci. 2015, 164, 265–275. [Google Scholar] [CrossRef] [Scilit]
- Guerry, A.D.; Ruckelshaus, M.H.; Arkema, K.K.; Bernhardt, J.R.; Guannel, G.; Kim, C.-K.; Marsik, M.; Papenfus, M.; Toft, J.E.; Verutes, G.; et al. Modeling benefits from nature: Using ecosystem services to inform coastal and marine spatial planning. Int. J. Biodivers. Sci. Ecosyst. Serv. Manag. 2012, 8, 107–121. [Google Scholar] [CrossRef] [Scilit]
- Luisetti, T.; Turner, R.K.; Bateman, I.J.; Morse-Jones, S.; Adams, C.; Fonseca, L. Coastal and marine ecosystem services valuation for policy and management: Managed realignment case studies in England. Ocean Coast. Manag. 2011, 54, 212–224. [Google Scholar] [CrossRef] [Scilit]
- Himes-Cornell, A.; Pendleton, L.; Atiyah, P. Valuing ecosystem services from blue forests: A systematic review of the valuation of salt marshes, sea grass beds and mangrove forests. Ecosyst. Serv. 2018, 30, 36–48. [Google Scholar] [CrossRef] [Scilit]
- Jiang, W. Ecosystem services research in China: A critical review. Ecosyst. Serv. 2017, 26, 10–16. [Google Scholar] [CrossRef] [Scilit]
- Wang, C.; Li, X.; Yu, H.; Wang, Y. Tracing the spatial variation and value change of ecosystem services in Yellow River Delta, China. Ecol. Indic. 2019, 96, 270–277. [Google Scholar] [CrossRef] [Scilit]
- Zhao, B.; Kreuter, U.; Li, B.; Ma, Z.; Chen, J.; Nakagoshi, N. An ecosystem service value assessment of land-use change on Chongming Island, China. Land Use Policy 2004, 21, 139–148. [Google Scholar] [CrossRef] [Scilit]
- Yu, Y.; Suo, A.; Jiang, N. Response of Ecosystem Service to Landscape Change in Panjin Coastal Wetland. Procedia Earth Planet. Sci. 2011, 2, 340–345. [Google Scholar] [CrossRef] [Scilit]
- Xie, Z.; Xu, X.; Yan, L. Analyzing qualitative and quantitative changes in coastal wetland associated to the effects of natural and anthropogenic factors in a part of Tianjin, China. Estuar. Coast. Shelf Sci. 2010, 86, 379–386. [Google Scholar] [CrossRef] [Scilit]
- Sun, B.; Cui, L.; Li, W.; Kang, X.; Pan, X.; Lei, Y. A meta-analysis of coastal wetland ecosystem services in Liaoning Province, China. Estuar. Coast. Shelf Sci. 2018, 200, 349–358. [Google Scholar] [CrossRef] [Scilit]
- Xu, C.; Pu, L.; Zhu, M.; Li, J.; Chen, X.; Wang, X.; Xie, X. Ecological Security and Ecosystem Services in Response to Land Use Change in the Coastal Area of Jiangsu, China. Sustainability 2016, 8, 816. [Google Scholar] [CrossRef] [Scilit]
- Zhao, S.; Wu, C. Valuation of mangrove ecosystem services based on emergy: A case study in China. Int. J. Environ. Sci. Technol. 2013, 12, 967–974. [Google Scholar] [CrossRef] [Scilit]
- Zhang, Y.; Zhao, L.; Liu, J.; Liu, Y.; Li, C. The Impact of Land Cover Change on Ecosystem Service Values in Urban Agglomerations along the Coast of the Bohai Rim, China. Sustainability 2015, 7, 10365–10387. [Google Scholar] [CrossRef] [Scilit]
- Song, W.; Deng, X.; Yuan, Y.; Wang, Z.; Li, Z. Impacts of land-use change on valued ecosystem service in rapidly urbanized North China Plain. Ecol. Model. 2015. [Google Scholar] [CrossRef] [Scilit]
- Sun, C.; Wang, S.; Zou, W. Chinese marine ecosystem services value: Regional and structural equilibrium analysis. Ocean Coast. Manag. 2016, 125, 70–83. [Google Scholar] [CrossRef] [Scilit]
- Xie, G.; Zhang, C.; Zhen, L.; Zhang, L. Dynamic changes in the value of China’s ecosystem services. Ecosyst. Serv. 2017, 26, 146–154. [Google Scholar] [CrossRef] [Scilit]
- Wang, W.; Guo, H.; Chuai, X.; Dai, C.; Lai, L.; Zhang, M. The impact of land use change on the temporospatial variations of ecosystems services value in China and an optimized land use solution. Environ. Sci. Policy 2014, 44, 62–72. [Google Scholar] [CrossRef] [Scilit]
- Di, X.; Hou, X.; Wang, Y.; Wu, L. Spatial-temporal characteristics of land use intensity of coastal zone in China during 2000–2010. Chin. Geogr. Sci. 2015, 25, 51–61. [Google Scholar] [CrossRef] [Scilit]
- Di, X.; Hou, X.; Wu, L. Land Use Classification System for China’s Coastal Zone Based on Remote Sensing. Resour. Sci. 2014, 36, 0463–0472. [Google Scholar]
- Hou, X.; Di, X.; Hou, W.; Wu, L.; Liu, J.; Wang, J.H.; Su, H.; Lu, X.; Wu, T. Accuracy evaluation of land use mapping using remote sensing techniques in coastal zone of China. J. Geoinf. Sci. 2018, 20, 1478–1488. [Google Scholar] [CrossRef]
- Running, S.; Mu, Q.; Zhao, M. MOD17A3 MODIS/Terra Net Primary Production Yearly L4 Global 1 km SIN Grid V055 [Data set]; NASA EOSDIS Land Processes DAAC: Sioux Falls, SD, USA, 2011. [Google Scholar]
- Zhao, M.; Heinsch, F.A.; Nemani, R.R.; Running, S.W. Improvements of the MODIS terrestrial gross and net primary production global data set. Remote Sens. Environ. 2005, 95, 164–176. [Google Scholar] [CrossRef] [Scilit]
- Brouwer, R. Environmental value transfer: State of the art and future prospects. Ecol. Econ. 2000, 32, 137–152. [Google Scholar] [CrossRef] [Scilit]
- Barbier, E.B.; Koch, E.W.; Silliman, B.R.; Hacker, S.D.; Wolanski, E.; Primavera, J.; Granek, E.F.; Polasky, S.; Aswani, S.; Cramer, L.A.; et al. Coastal ecosystem-based management with nonlinear ecological functions and values. Science 2008, 319, 321–323. [Google Scholar] [CrossRef] [Scilit]
- Sharma, B.; Rasul, G.; Chettri, N. The economic value of wetland ecosystem services: Evidence from the Koshi Tappu Wildlife Reserve, Nepal. Ecosyst. Serv. 2015, 12, 84–93. [Google Scholar] [CrossRef] [Scilit]
- Wu, W.; Yang, Z.; Tian, B.; Huang, Y.; Zhou, Y.; Zhang, T. Impacts of coastal reclamation on wetlands: Loss, resilience, and sustainable management. Estuar. Coast. Shelf Sci. 2018, 210, 153–161. [Google Scholar] [CrossRef] [Scilit]
- WWF. The Comprehensive Report of the Yellow Sea Ecoregion Support Project 2007–2014; WWF, KIOST: Gland, Swizerland, 2014. [Google Scholar]

© 2020 by the authors. Licensee MDPI, Basel, Switzerland. This article is an open access article distributed under the terms and conditions of the Creative Commons Attribution (CC BY) license (http://creativecommons.org/licenses/by/4.0/).