Article

Linking Changes in Land Cover and Land Use of the Lower Mekong Basin to Instream Nitrate and Total Suspended Solids Variations

1
School of Biological, Earth and Environmental Sciences, Faculty of Sciences, University of New South Wales, Sydney 2052, Australia
2
Faculty of Engineering, School of Civil and Environmental Engineering, University of New South Wales, Sydney 2052, Australia
*
Author to whom correspondence should be addressed.
Sustainability 2020, 12(7), 2992; https://doi.org/10.3390/su12072992
Submission received: 2 February 2020 / Revised: 31 March 2020 / Accepted: 2 April 2020 / Published: 8 April 2020
(This article belongs to the Collection Sustainability of Water Environment)

Abstract

:
Population growth and economic development are driving changes in land use/land cover (LULC) of the transboundary Lower Mekong River Basin (LMB), posing a serious threat to the integrity of the river system. Using data collected on a monthly basis over 30 years (1985–2015) at 14 stations located along the Lower Mekong river, this study explores whether spatiotemporal relationships exist between LULC changes and instream concentrations of total suspended solids (TSS) and nitrate—as proxies of water quality. The results show seasonal influences where temporal patterns of instream TSS and nitrate concentrations mirror patterns detected for discharge. Changes in LULC influenced instream TSS and nitrate levels differently over time and space. The seasonal Mann–Kendall (SMK) confirmed significant reduction of instream TSS concentrations at six stations (p < 0.05), while nitrate levels increased at five stations (p < 0.05), predominantly in stations located in the upper section of the basin where forest areas and mountainous topography dominate the landscape. Temporal correlation analyses point to the conversion of grassland (r = −0.61, p < 0.01) to paddy fields (r = 0.63, p < 0.01) and urban areas (r = 0.44, p < 0.05) as the changes in LULC that mostly impact instream nitrate contents. The reduction of TSS appears influenced by increased forest land cover (r = −0.72, p < 0.01) and by the development and operation of hydropower projects in the upper Mekong River. Spatial correlation analyses showed positive associations between forest land cover and instream concentrations of TSS (r = 0.64, p = 0.01) and nitrate (r = 0.54, p < 0.05), indicating that this type of LULC was heavily disturbed and harvested, resulting in soil erosion and runoff of nitrate rich sediment during the Wet season. Our results show that enhanced understanding of how LULC changes influence instream water quality at spatial and temporal scales is vital for assessing potential impacts of future land and water resource development on freshwater resources of the LMB.

1. Introduction

Increasing development pressures have altered land use/land cover (LULC) patterns in many river basins around the world. The expansion of agricultural, industrial, and urban areas and the reduction of once pristine forest areas have the potential to affect river water quality, and present a real challenge for water resource managers. Understanding freshwater quality changes through space and time is important for sustainable use and exploitation of this finite resource and for anticipating future impact of land development on aquatic ecosystems. The interactions between LULC changes and stream integrity have been well documented [1,2,3,4,5]; previous studies have examined their impacts spatially [6,7,8,9] and temporally [8,9,10]. Specifically, studies have shown the highest instream sediment concentrations in agricultural areas [11,12], while correlations between instream nitrate concentrations and the proportion of agricultural and urban areas have been documented [10,13,14].
While studies on the effects of LULC on water quality have been explored in many river basins, we found a lack of such studies for large transboundary river basins, such as the Lower Mekong Basin (LMB), where differences exist between countries that make up the basin in terms of topography, LULC compositions, human–environmental interactions, and priorities for development and conservation policies. Despite these differences, rapid economic development is undertaken in many parts of the basin, driving LULC change and pressuring the integrity of the basin environment. Already, studies (Figure 1a) have evidenced that the improved road access and the integration of the countries into the Association of Southeast Asian Nations (ASEAN) Economic Community have resulted in the conversion of areas traditionally used for subsistence agricultural practices to areas of intensified agricultural activities and commercial cash crop production [15]. Similarly, intensification of paddy rice cultivation for global export has led to the expansion of agricultural areas at the expense of forest areas in the eastern part of the basin [16,17]. Additionally, changes in the economy have led to the expansion of urban and agricultural areas within the 3S (Sekong, Sesan, and Srepok) sub-basin, affecting its environment and water resources [18]. Improvement of the socioeconomic status of the population living in the Mekong Delta (MD) has been cited as the factor for the increased industrial and urban areas at the expense of forest and agricultural areas, which pose a serious threat to the region’s biodiversity and food security [19].
Alongside these drivers, the undergoing and planned development of hydropower projects are threatening to further damage the river ecosystem, causing irreversible change to LULC and destroying habitats of local aquatic and terrestrial animals. Hydropower development (Figure 1a) has been highlighted as one of the key drivers influencing hydrological and sediment patterns of the Lower Mekong River (LMR) [22,23]. The operations of the mainstream dams located in the Upper Mekong River (UMR) (also known as the Lancang River (LR)), for example, have proven to be efficient in trapping suspended sediment with estimations according to [24] that about 32–42 Mt of sediments were trapped annually, leading to a reduction of sediment levels in the MD by about 43% [25]. Furthermore, floodplain sedimentation of the MD could be further decreased by 40%, according to [23], with a possibility of diminishing about half of the current sediment load entering the South China Sea if all planned projects become operational. The effects could be even more profound in areas upstream of the delta, with research by [22] projecting that the annual sediment load of the Tonle Sap Lake is likely to be reduced by nearly 60% as a direct result of the changing wet and dry season flow regimes due to hydropower operation.
Therefore, understanding how these LULC change drivers influence instream water quality at spatial and temporal scales is vital for assessing potential impacts of future land and water resource development on freshwater sources. Addressing this knowledge gap, this paper presents a research undertaken in the LMB, a transboundary river basin undergoing major changes in LULC, with the objectives of (1) conducting a spatiotemporal exploratory analysis of how these changes affected water quality indicators (total suspended solids (TSS) and nitrate) using records gathered between 1985 and 2015 at 14 monitoring stations located along the Lower Mekong River (LMR), and (2) identifying trends and observed seasonality of historical TSS and nitrate concentrations. The results are analyzed to ascertain whether changes in LULC affect the river instream TSS and nitrate levels. Furthermore, ancillary information on land management practice and soil types is used to further explain the observed trends.

2. Material and Methods

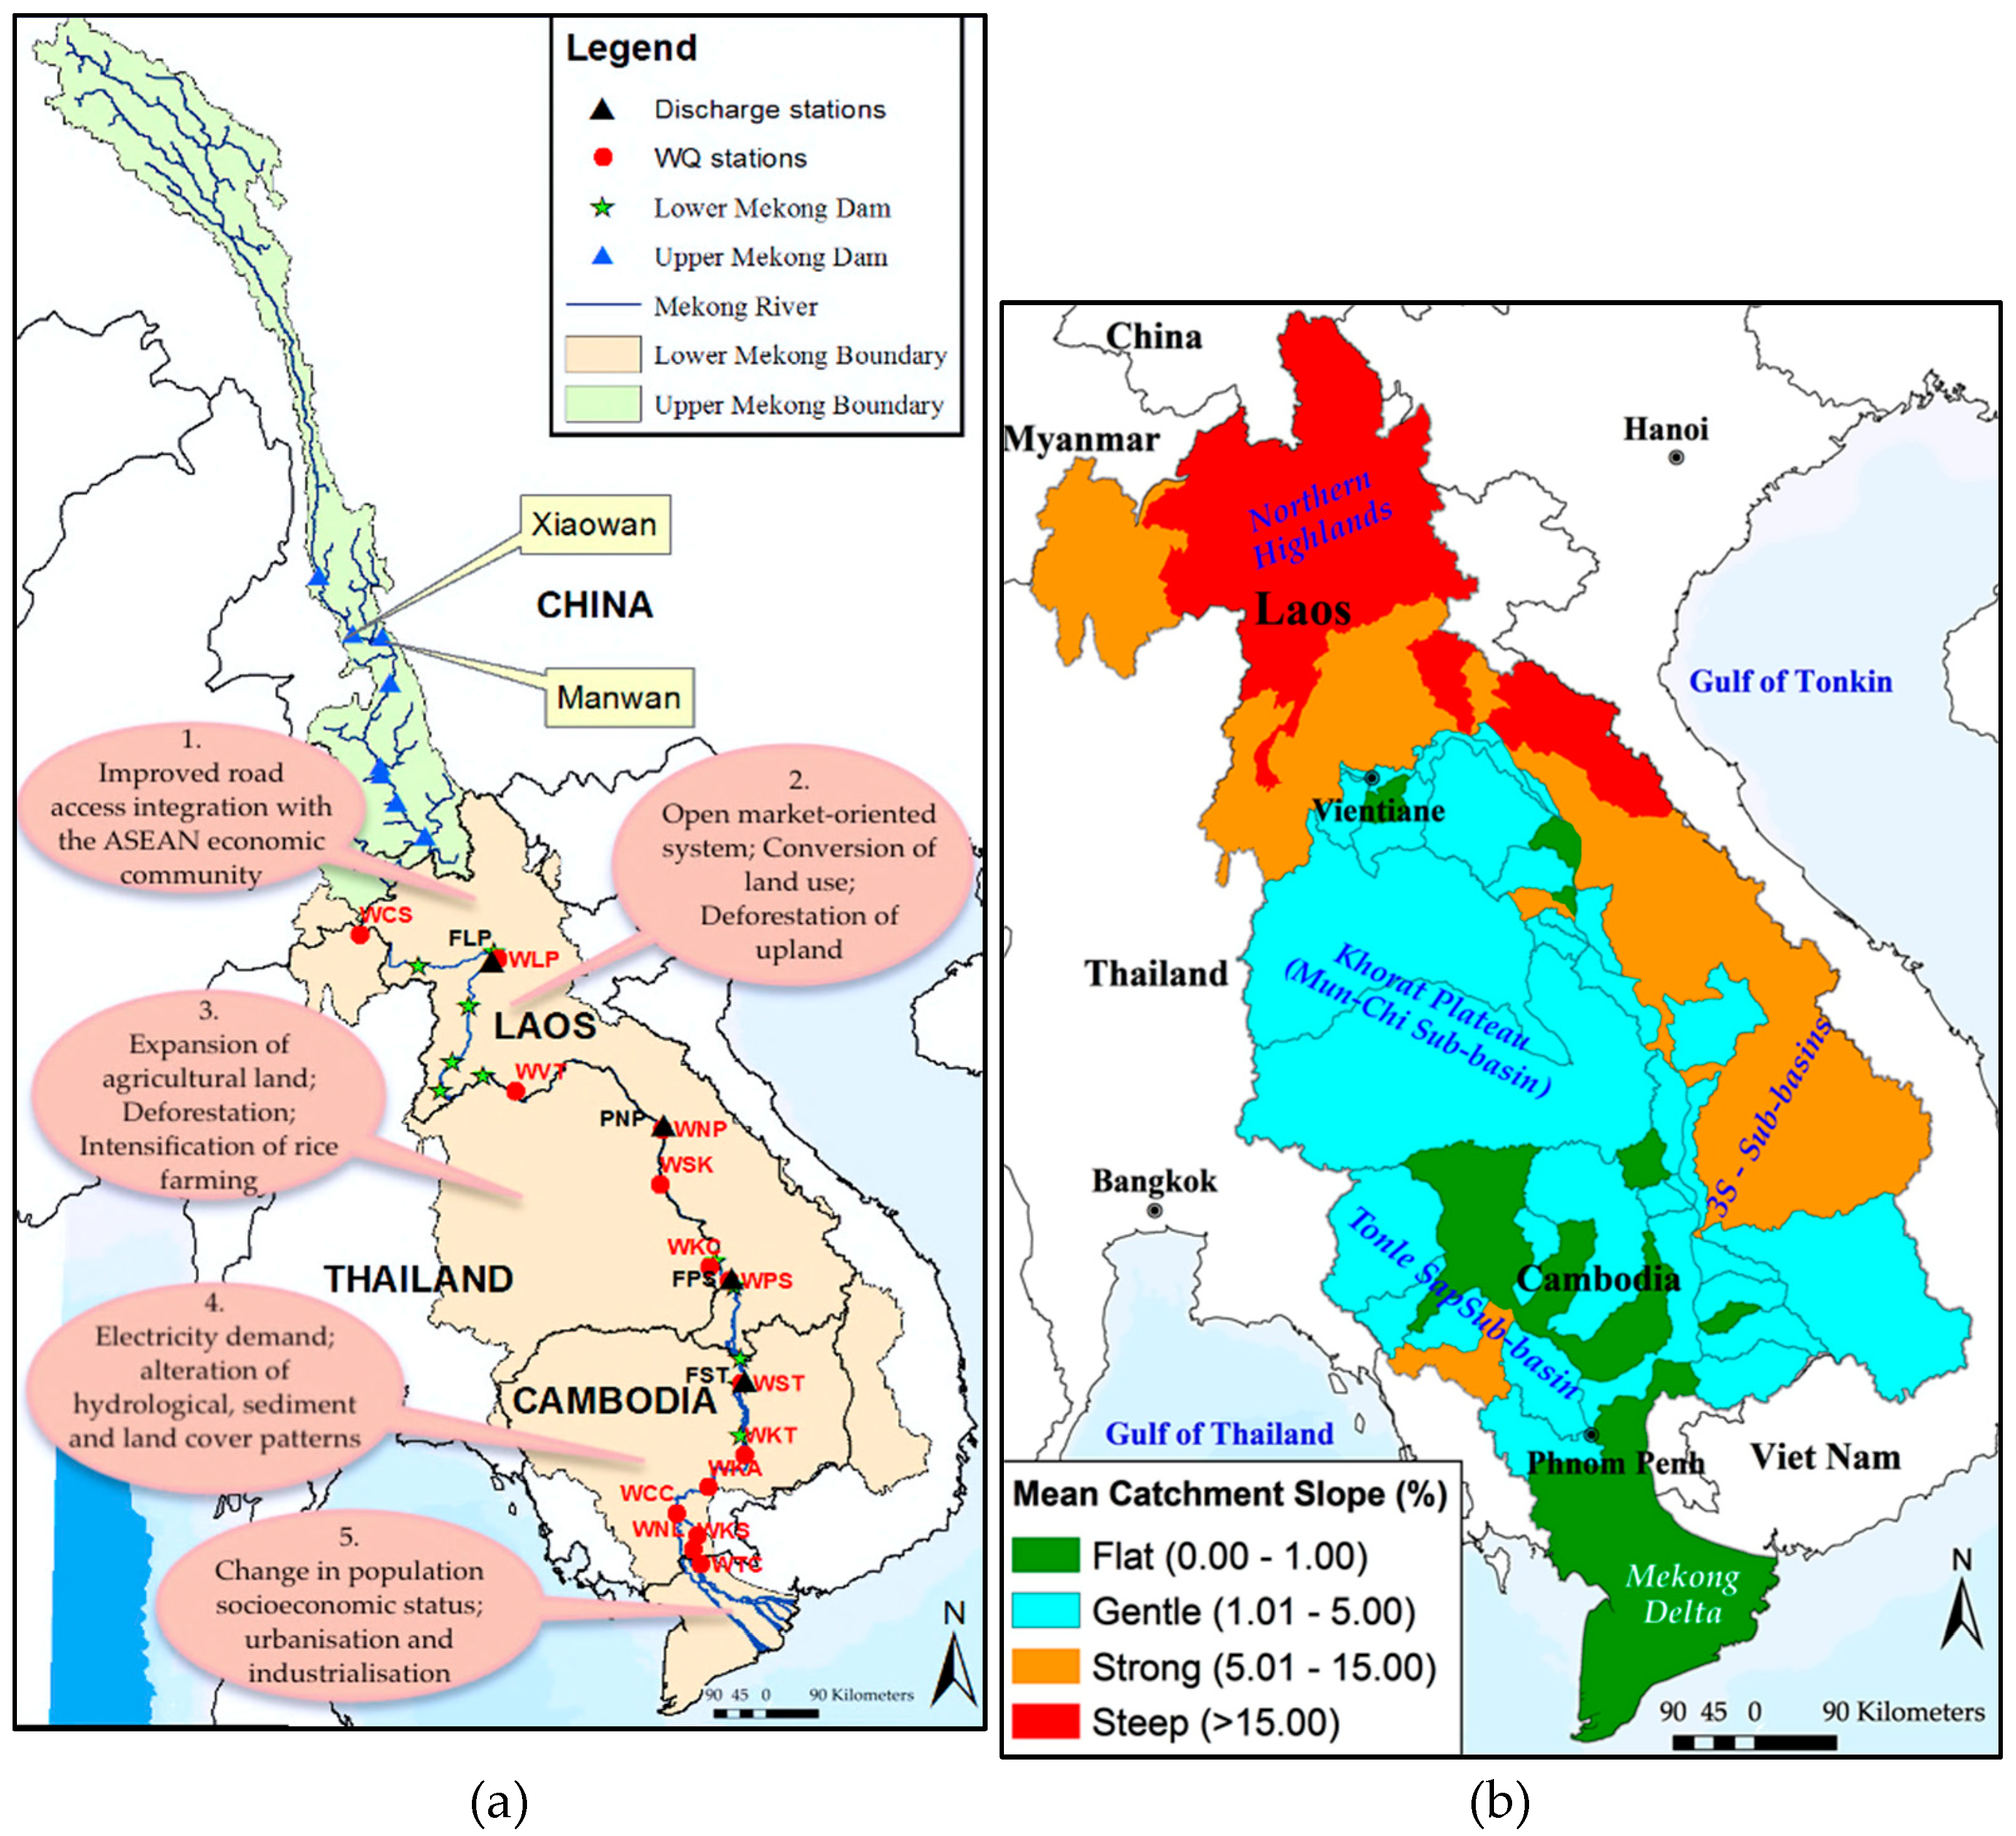
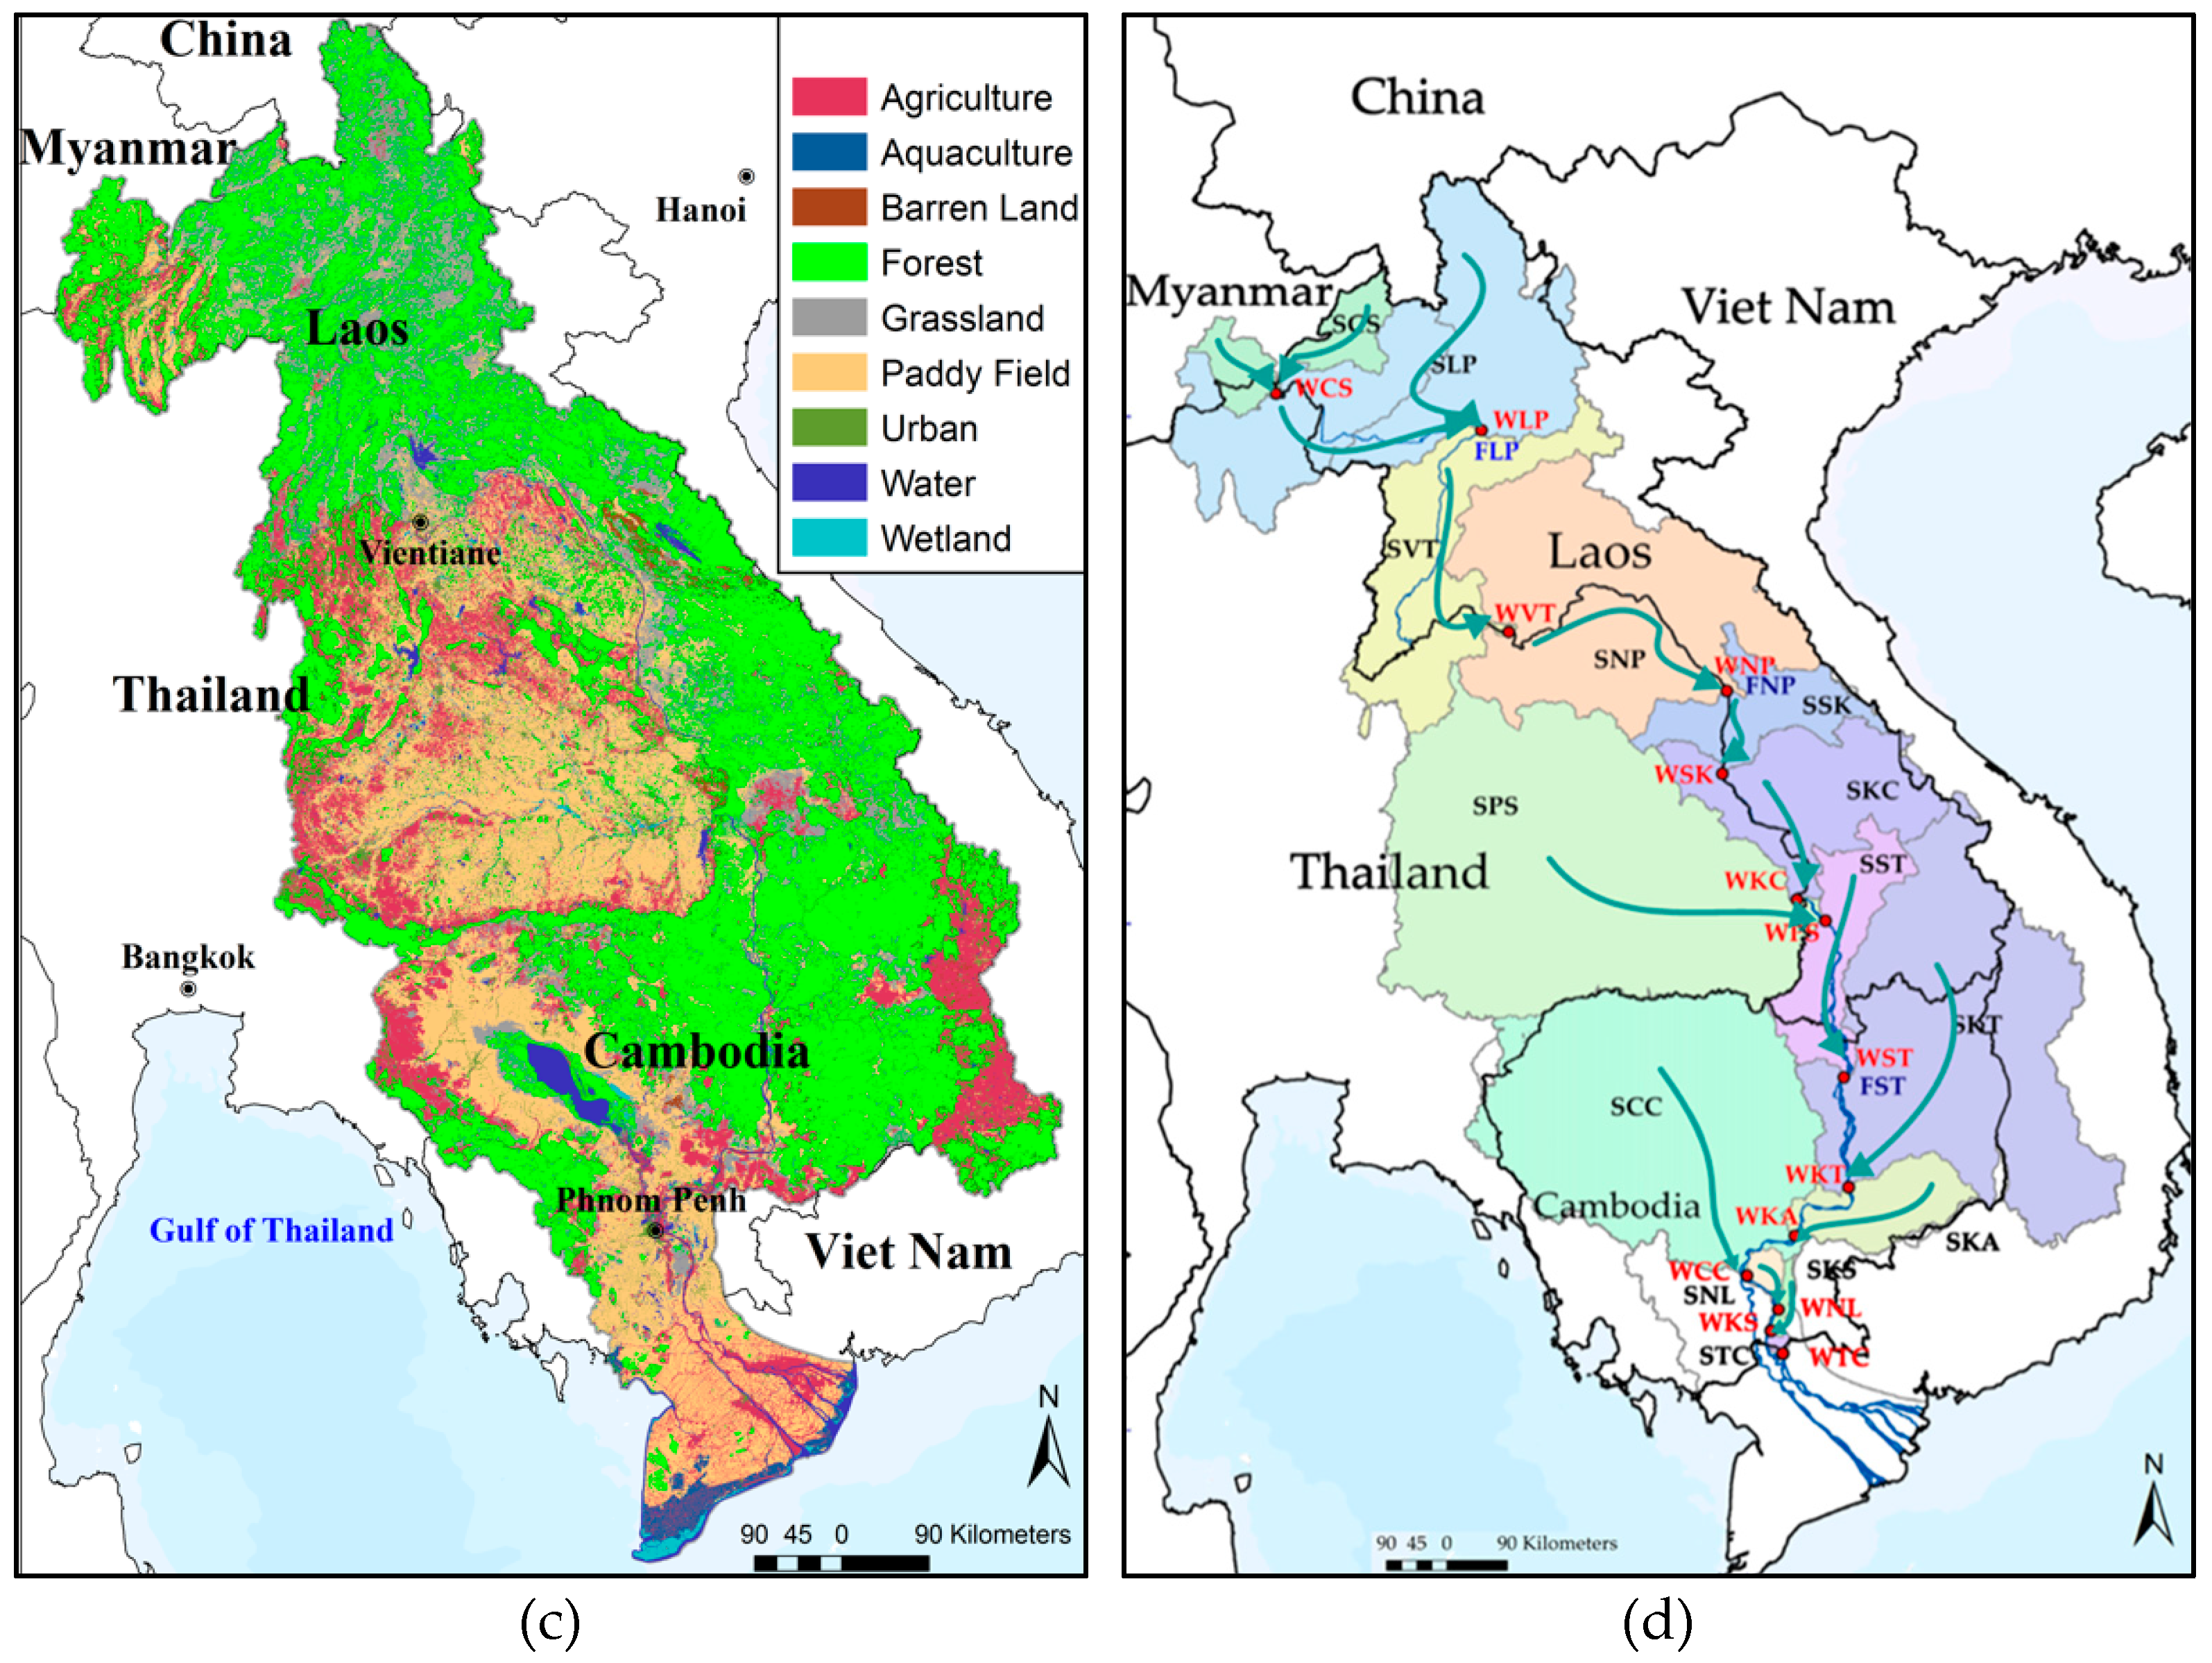
2.1. Study Area Characterization

Located in Southeast Asia, the Mekong River is one of the most important rivers in the world, and is ranked as the 8th largest in terms of mean annual flow when discharging into the South China Sea at 14,500 m3/s [26]. Originating on the Tibetan Plateau, the river passes through six countries (China, Myanmar, Lao PDR, Thailand, Cambodia, and Viet Nam) occupying an area of approximately 795,000 km2, and it is divided into upper and lower basins. The upper basin is located mainly in China. The lower basin, which is the study area of this research, covers approximately 571,000 km2, and encompasses land area made up of Lao PDR, Thailand, Cambodia, and Viet Nam [26]. Therefore, the LMR refers to the length of the river from the point it enters Lao PDR to where it discharges into the South China Sea.
Due to its size, the LMB is characterized by four physiographic regions with an elevation range from 0 to about 2800 m above sea level [26]. The highest elevations are found in the upper part of the basin where mountain ranges and steep valleys dominate the landscape (Figure 1b). In the eastern part, where the Khorat Plateau formed, the landscape is mostly flat, with low-gradient draining rivers and wide floodplains. Further south, the Tonle Sap Basin forms the largest freshwater lake in Southeast Asia and provides a unique ecosystem with enormous hydrological, biological, nutritional, and cultural values to the region [22,27]. As it enters the delta region, the Mekong River splits into two main channels before discharging into the South China Sea [28].
The distributions of rainfall over these regions are highly variable, ranging from less than 1000 mm in the western part to more than 3000 mm in the northern and eastern parts of the basin [26]. Between May and September, the climate is influenced by the southwest monsoon, which generates much of the precipitation over the basin. From October to April, the climate over the basin becomes drier due the effects of the cold air from the Himalayas.
About 60% of the basin is dominated by clay-rich soils of high acidity and low fertility [26], which poses limitations for agriculture; therefore, these areas are commonly forested (Figure 1c). Most forested areas, which in the definition of the Mekong River Commission (MRC) include evergreen, deciduous, coniferous, bamboo, and plantation forests, occur in the mountain ranges of Lao PDR and Cambodia. However, in recent years, acid-tolerant cash crops (e.g., corn, cassava) have been introduced in these areas [29], resulting in the loss of forest area at the annual rate of about 0.4%, according to [30]. Government incentives to limit shifting cultivation have led to an increase of teak, rubber, and biofuel tree plantations in many parts of the basin [31]. In the lowland areas of the Khorat Plateau, Tonle Sap sub-basin, and central to southern parts of Lao PDR, the availability of fertile soil allows a permanent form of agriculture. Therefore, these areas are dominated by paddy rice fields.
Due to the diverse topography and variability in soil types and climatology, the LMB is subject to varying intensities of soil erosion, with mountainous areas of Lao PDR being highly erosive [32]. In particular, areas with slopes of more than 25% have been found to experience mean annual soil erosion of 13 to 32.2 t/ha/year, while areas with slopes between 0% and 6% have been found to have a mean annual soil erosion of about 0.0 to 4.4 t/ha/year [32].
Population distribution and density vary greatly over the basin, with the largest human concentrations occurring in the MD and urban areas, such as Phnom Penh and Vientiane. The population density at these areas ranges from 200 to 700 persons per km2. In comparison, rural areas in the northern part of Lao PDR have population densities of 20 persons per km2 [26].

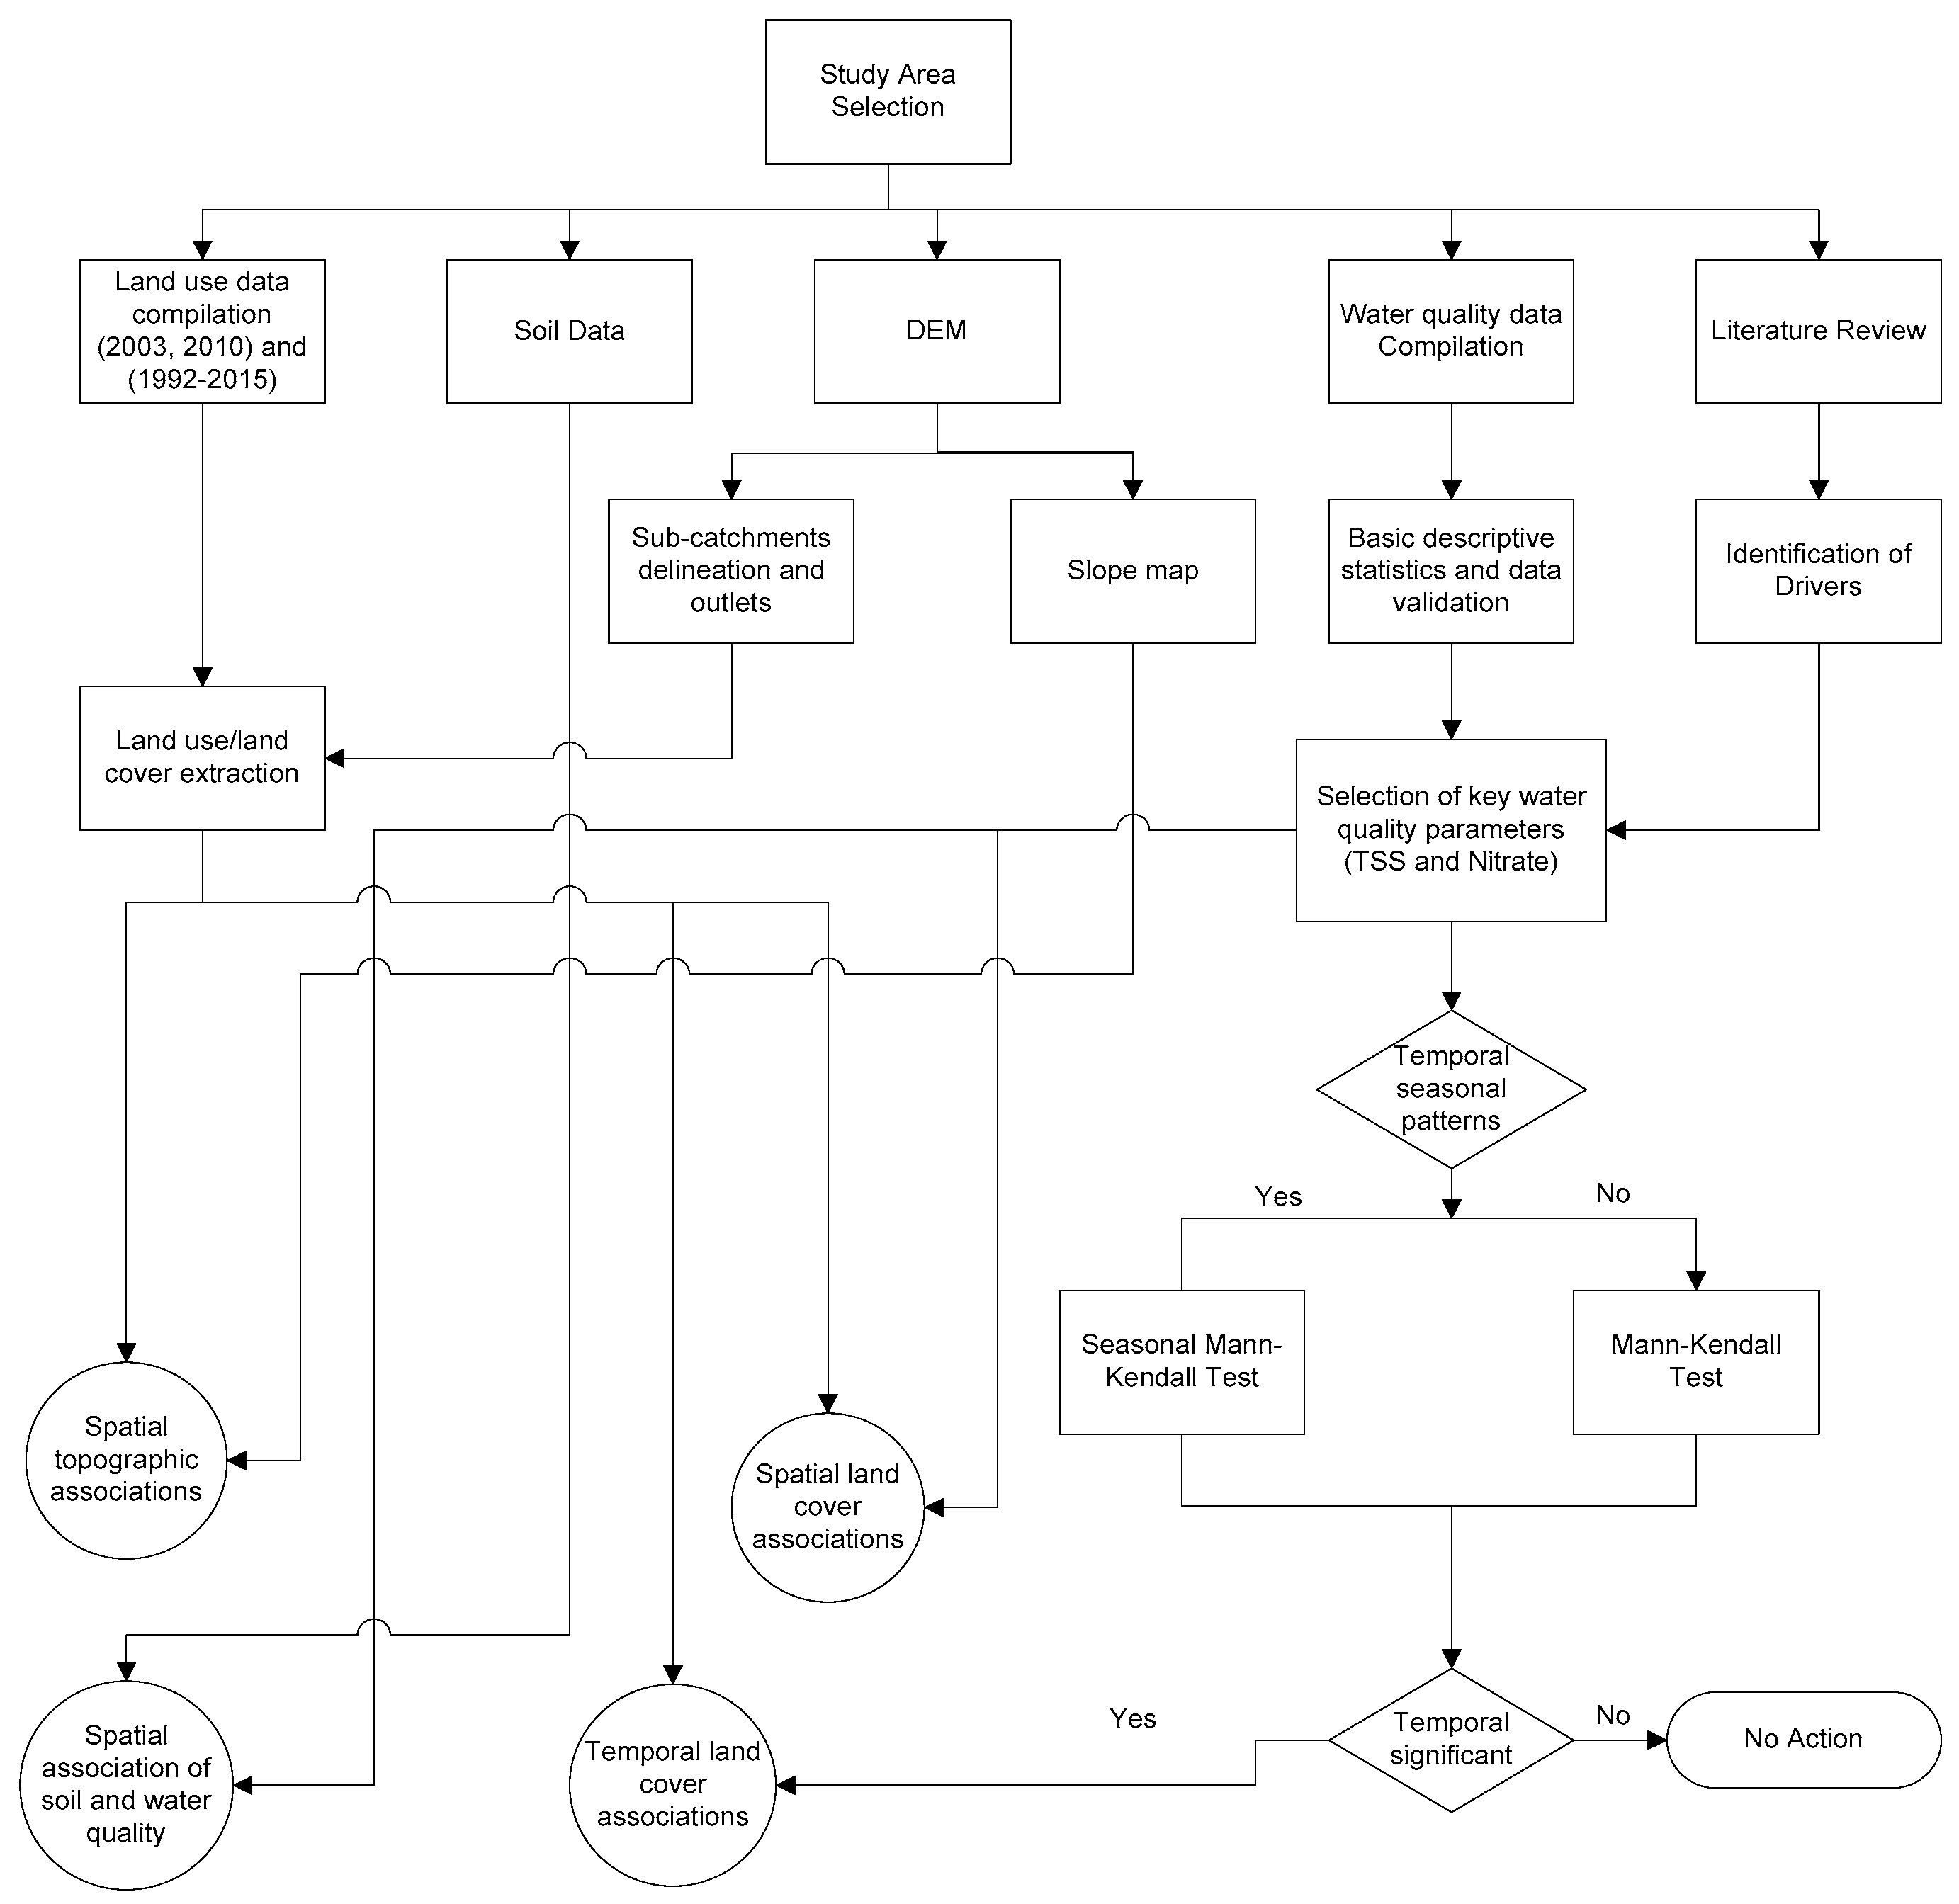
2.2. Data and Method

Figure 2 illustrates the methodological framework designed for this study and associated techniques, with each step being detailed hereafter.

2.2.1. LULC and Watershed Data

LULC data were compiled from two different sources: A 2010 MRC land use map (Figure 1c) and the European Space Agency (ESA) Annual Global Land Cover Time Series (AGLCTS) from 1993 to 2015. The 2010 MRC land cover data were used for spatial association of LULC and water quality indicators, while the ESA 1993–2015 land cover time series were used to explore temporal associations between changes in LULC and water quality (refer to Section 2.4). The MRC 2010 land cover data were produced using Landsat-5 Thematic Mapper images with 30 m spatial resolution, complemented with field surveys. The Food and Agricultural Organization of the United Nations (FAO)’s Land Cover Classification System (LCCS) [33] guided the selection of the 19 land cover type classes.
The ESA annual global land cover time series uses images from five different satellite missions (NOAA-AVHRR HRPT, SPOT-Vegetation, ENVISAT-MERIS FR and RR, ENVISAT-ASAR, and PROBA-V), and is provided at a spatial resolution of 300 m. The annual land cover maps contain 22 main categories also based on the LCCS [33]. The LMB boundary was used to extract a subset of 23 annual land cover datasets (i.e., 1993–2015) for further analysis. To facilitate statistical analysis, classes for both the MRC and ESA datasets were aggregated into nine main LULC types, including forest, paddy field, urban, grassland, barren land, wetland, water, and aquaculture (Appendix A).
Elevation data were sourced from the MRC Digital Terrain Model (DTM), available at 50 m spatial resolution for the entire river basin. The ArcGIS 10.3 spatial analyst toolbox [34] was used to delineate stream networks and sub-basin boundaries using the water quality monitoring stations as the outlets. Detailed methods used for deriving flow direction and accumulation are described in [35]. The lack of vertical precision in flat areas precluded the generation of sub-catchments for the region of the MD, and only 14 sub-catchments were generated as a consequence (Figure 1d). Only land cover data generated from these sub-catchments were used to further explore and better understand the behavior of the selected water quality indicators over time and space. Spatiotemporal information of LULC (types and percentages) for each delineated sub-basin was extracted from the 2010 MRC land use data (Figure 3) and the ESA landcover dataset (1993–2015) (Appendix B) by overlaying boundaries of each sub-basin on the LULC maps.
To facilitate the analysis and discussion of the results, the basin was divided into two sections (upper and lower) based on their topographic differences (Table 1): The upper section was characterized by the mountain ranges and plateaus of Lao PDR and Thailand, and the lower section by the mostly flat areas of Cambodia and Viet Nam.

2.2.2. Data on Water Quality and Quantity

Data on water quality and quantity were obtained from the MRC Water Quality Monitoring Network (WQMN). Water quality data were sourced from 14 mainstream stations expanding across four countries. Nine of these 14 stations have records dating back to 1985, three began recording observations in the early 1990s, and records of two stations date back to the early 2000s. Water quality data contain time series of more than 20 water quality parameters. The time series collected under the MRC WQMN are not continuous, and measurements for each parameter are collected monthly. Measurement and analysis of each water quality parameter are carried out in accordance with the methods outlined in the Standard Methods for the Examination of Water and Wastewater [36]. A total of 72,230 records of all parameters were available for this study. Of those, 8712 points contain information on TSS and nitrate, the proxies that this study adopts to assess water quality.
Data on water quantity, in the form of water level, were sourced from the MRC at Nakhone Phanom (FNP) and Stung Treng (FST) for the period of 1985–2015. Discharge data were also recorded at these stations, but only from 1985 to 2005. Using the available data, the MRC has developed rating curves representing the relationship between discharge and water level of the LMR, enabling the estimation of discharge as a function of recorded water levels.

2.3. Statistical Analysis of Water Quality Data

2.3.1. Data Pre-Processing and Statistics Summarization

The quality of the collected data was assessed using MATLAB (R2010a) [37]. A total of 4270 and 4442 data points for TSS and nitrate, respectively, were found suitable for further analysis. Descriptive statistics (i.e., mean, maximum, minimum, and standard deviation) were applied on these data to quantitatively describe the main characteristics. Furthermore, time-series analysis using box-and-whisker plots was carried out for TSS and nitrate datasets for all stations to allow comparisons of their levels, ranges, and distributions. In addition, the strength and direction of the relationship between instream TSS and nitrate concentrations and river discharge were evaluated using Pearson’s correlation to help explain any patterns detected during the analysis.

2.3.2. Decomposition of TSS and Nitrate Time Series

Similarly to other long-term environmental monitoring time series, historical data on water quality often exhibit seasonal patterns, non-normal distribution, and missing data points. As such, analysis of seasonal variability and long-term trends for each dataset was conducted using the Seasonal and Trend decomposition Loess algorithm (STL) [38]. The use of STL for decomposition of water quality time series has been discussed extensively by [38,39], including the internal circulation process of STL [40].
STL has been reported as robust to outliers and missing data values in addition to the ability to handle a large of number of time series [41]. These are attractive attributes given the characteristics of the available TSS and nitrate data in the LMB.
The open source R Studio statistical package [42] was used for time series decomposition and identification of trends. TSS and nitrate time series for each station were filtered into trend, seasonal, and remainder components, using a locally weighted regression approach [43]. Trends were identified by removing the influence of seasonal and reminder components from the time series [39].

2.3.3. Seasonal Mann–Kendall Trend Analysis

Ref. [44] summarized statistical tools available for analyzing water quality data, ranging from graphical methods to provide visual summarization of time series to computationally-driven methods for analyzing and forecasting trends of large dataset. Given the characteristics of long-term water quality monitoring data (Section 2.3.2), the seasonal Mann–Kendall test (SMK) [45] was used to determine the monotonic trends of TSS and nitrate time series at each station. SMK is a nonparametric method that can be used to detect trends in time series with seasonal variation and missing values. Furthermore, the test was developed specifically for analyzing trends of water quality data collected on a monthly basis [45]. This is an attractive feature of the test considering that TSS and nitrate data obtained for this study are available on a monthly time scale. In a dataset where X is the entire sample consisting of monthly subsamples from January to December [X = (X1, X2, …, X12)], and each monthly subsample (Xi) contains nj annual values such that, for January, subsample X1 = (x11, x12, …, x1n), the null hypothesis (H0) is that there is no monotonic trend in time for a dataset where X is a sample of independent variables (xij) in an evenly distributed Xi. Therefore, the alternative hypothesis H1 is that the monthly random subsample (Xi) is not identically distributed and monotonic trends exist in time. The detailed statistical analysis for SMK can be found in [45]. In this study, the p-value of 0.05 defined statistical significance. Z statistics were also used to determine the upward (positive Z value) and downward (negative Z value) trends of TSS and nitrate levels.

2.4. Spatial and Temporal Association of LULC and Water Quality Indicators

The relationships between LULC and water quality indicators were explored temporally and spatially. To explore spatial relationships, the proportion of individual LULC types extracted from the MRC 2010 land cover data (see Section 2.2.1) was correlated with the mean concentrations of TSS and nitrate collected in 2010. The year 2010 was selected due to the available MRC data for LULC, TSS, and nitrate. The Pearson’s correlation analyses were carried out for the delineated sub-basins (Section 2.2.1 and Figure 1d) to describe the overall correlations between LULC and water quality indicators.
Analyses of temporal association of LULC and water quality indicators were undertaken for a station which exhibited significant change in both TSS and nitrate trends, as shown by SMK. Percentages of LULC types extracted from the European Space Agency land cover maps (1993–2015) (see Section 2.2.1 and Appendix B) were used for the analyses. Temporal analyses were carried out at a sub-catchment scale by Pearson’s correlation analysis, allowing the association of the mean annual concentrations of TSS and nitrate with the percentages of individual LULC types within the selected sub-catchment. In addition, Factor Analysis [46] was used to further explain the underlying temporal relationships between LULC and water quality indicators.

3. Results and Discussion

3.1. Summary of Statistics of Water Quality Indicators

Descriptive statistics for water quality indicators at the 14 water quality monitoring stations (Table 2) show that mean concentrations for TSS range from 67.4 to 314.9 mg/L, which indicates a sign of spatial variation. On average, the highest TSS levels occurred in the upper part of the basin with the maximum mean concentration recorded at Vientiane (WVT). TSS levels decrease as the river traverses from the upper part of the basin to the MD. Nitrate levels were less variable, with concentrations fluctuating from non-detectable to 1.17 mg/L. Similarly to the patterns obtained for TSS, nitrate levels were also highest in the upper part of the river, with the mean concentration calculated to be as high as 0.34 mg/L at Chiang Sean (WCS).

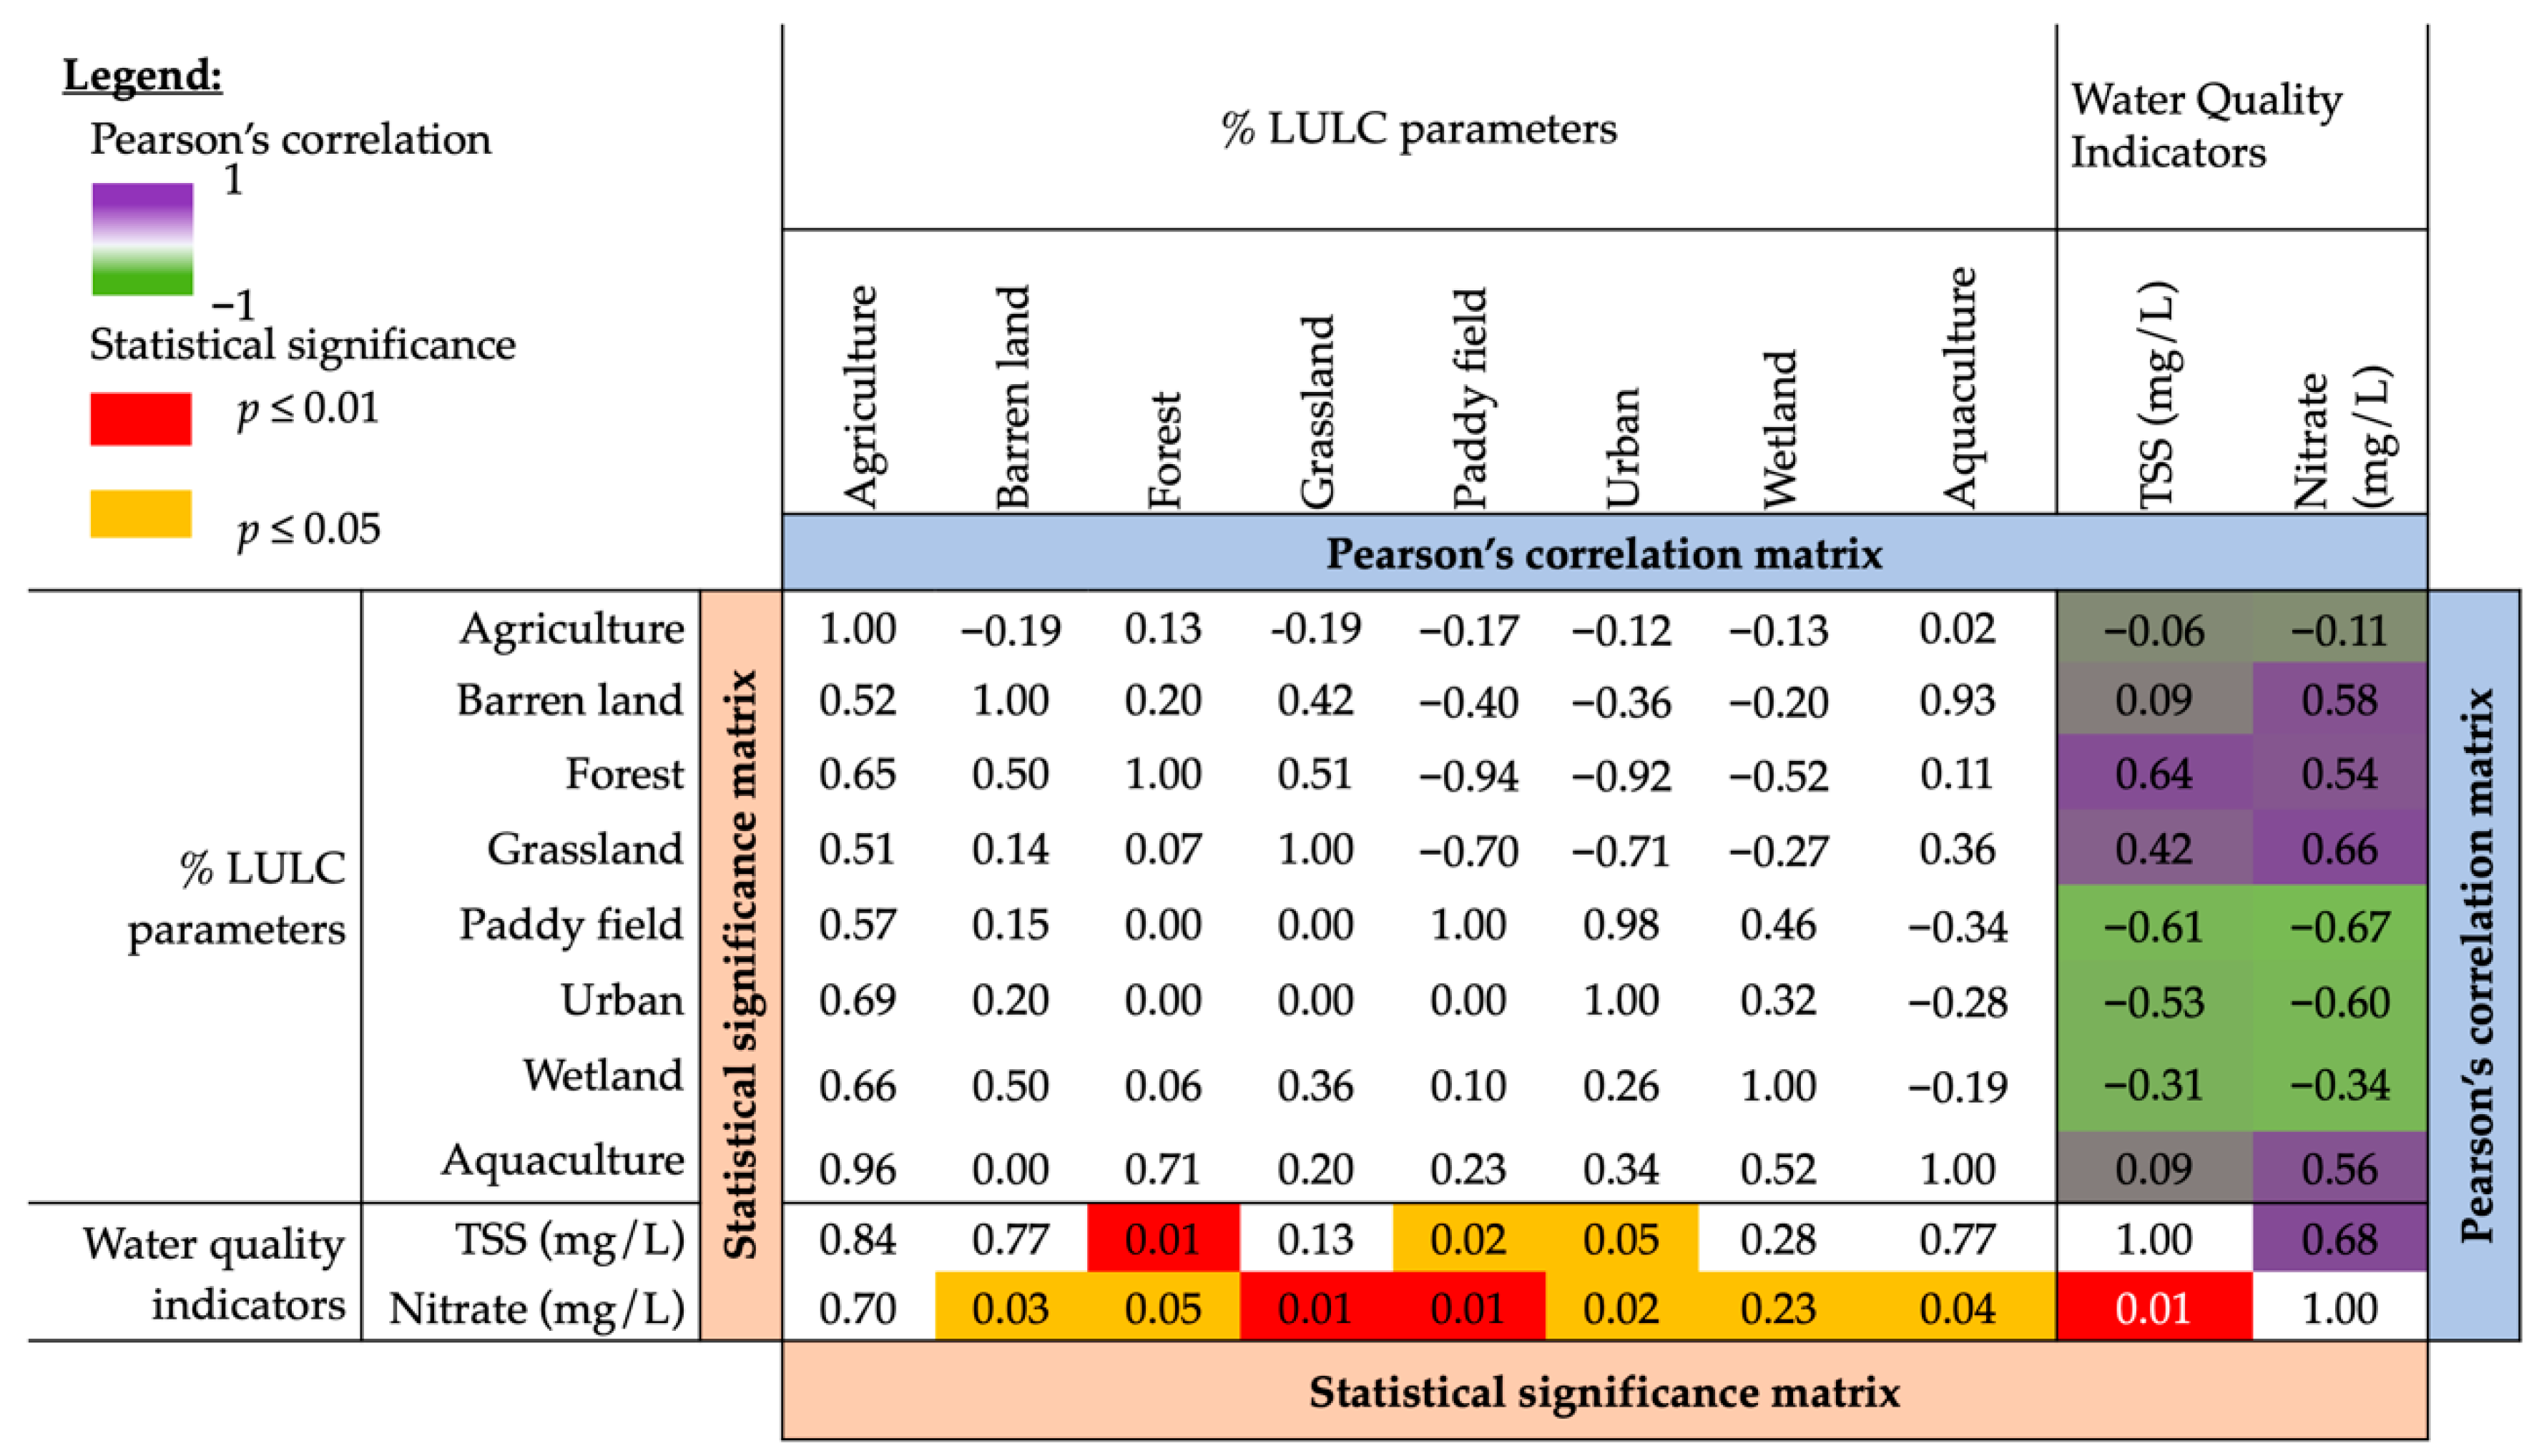
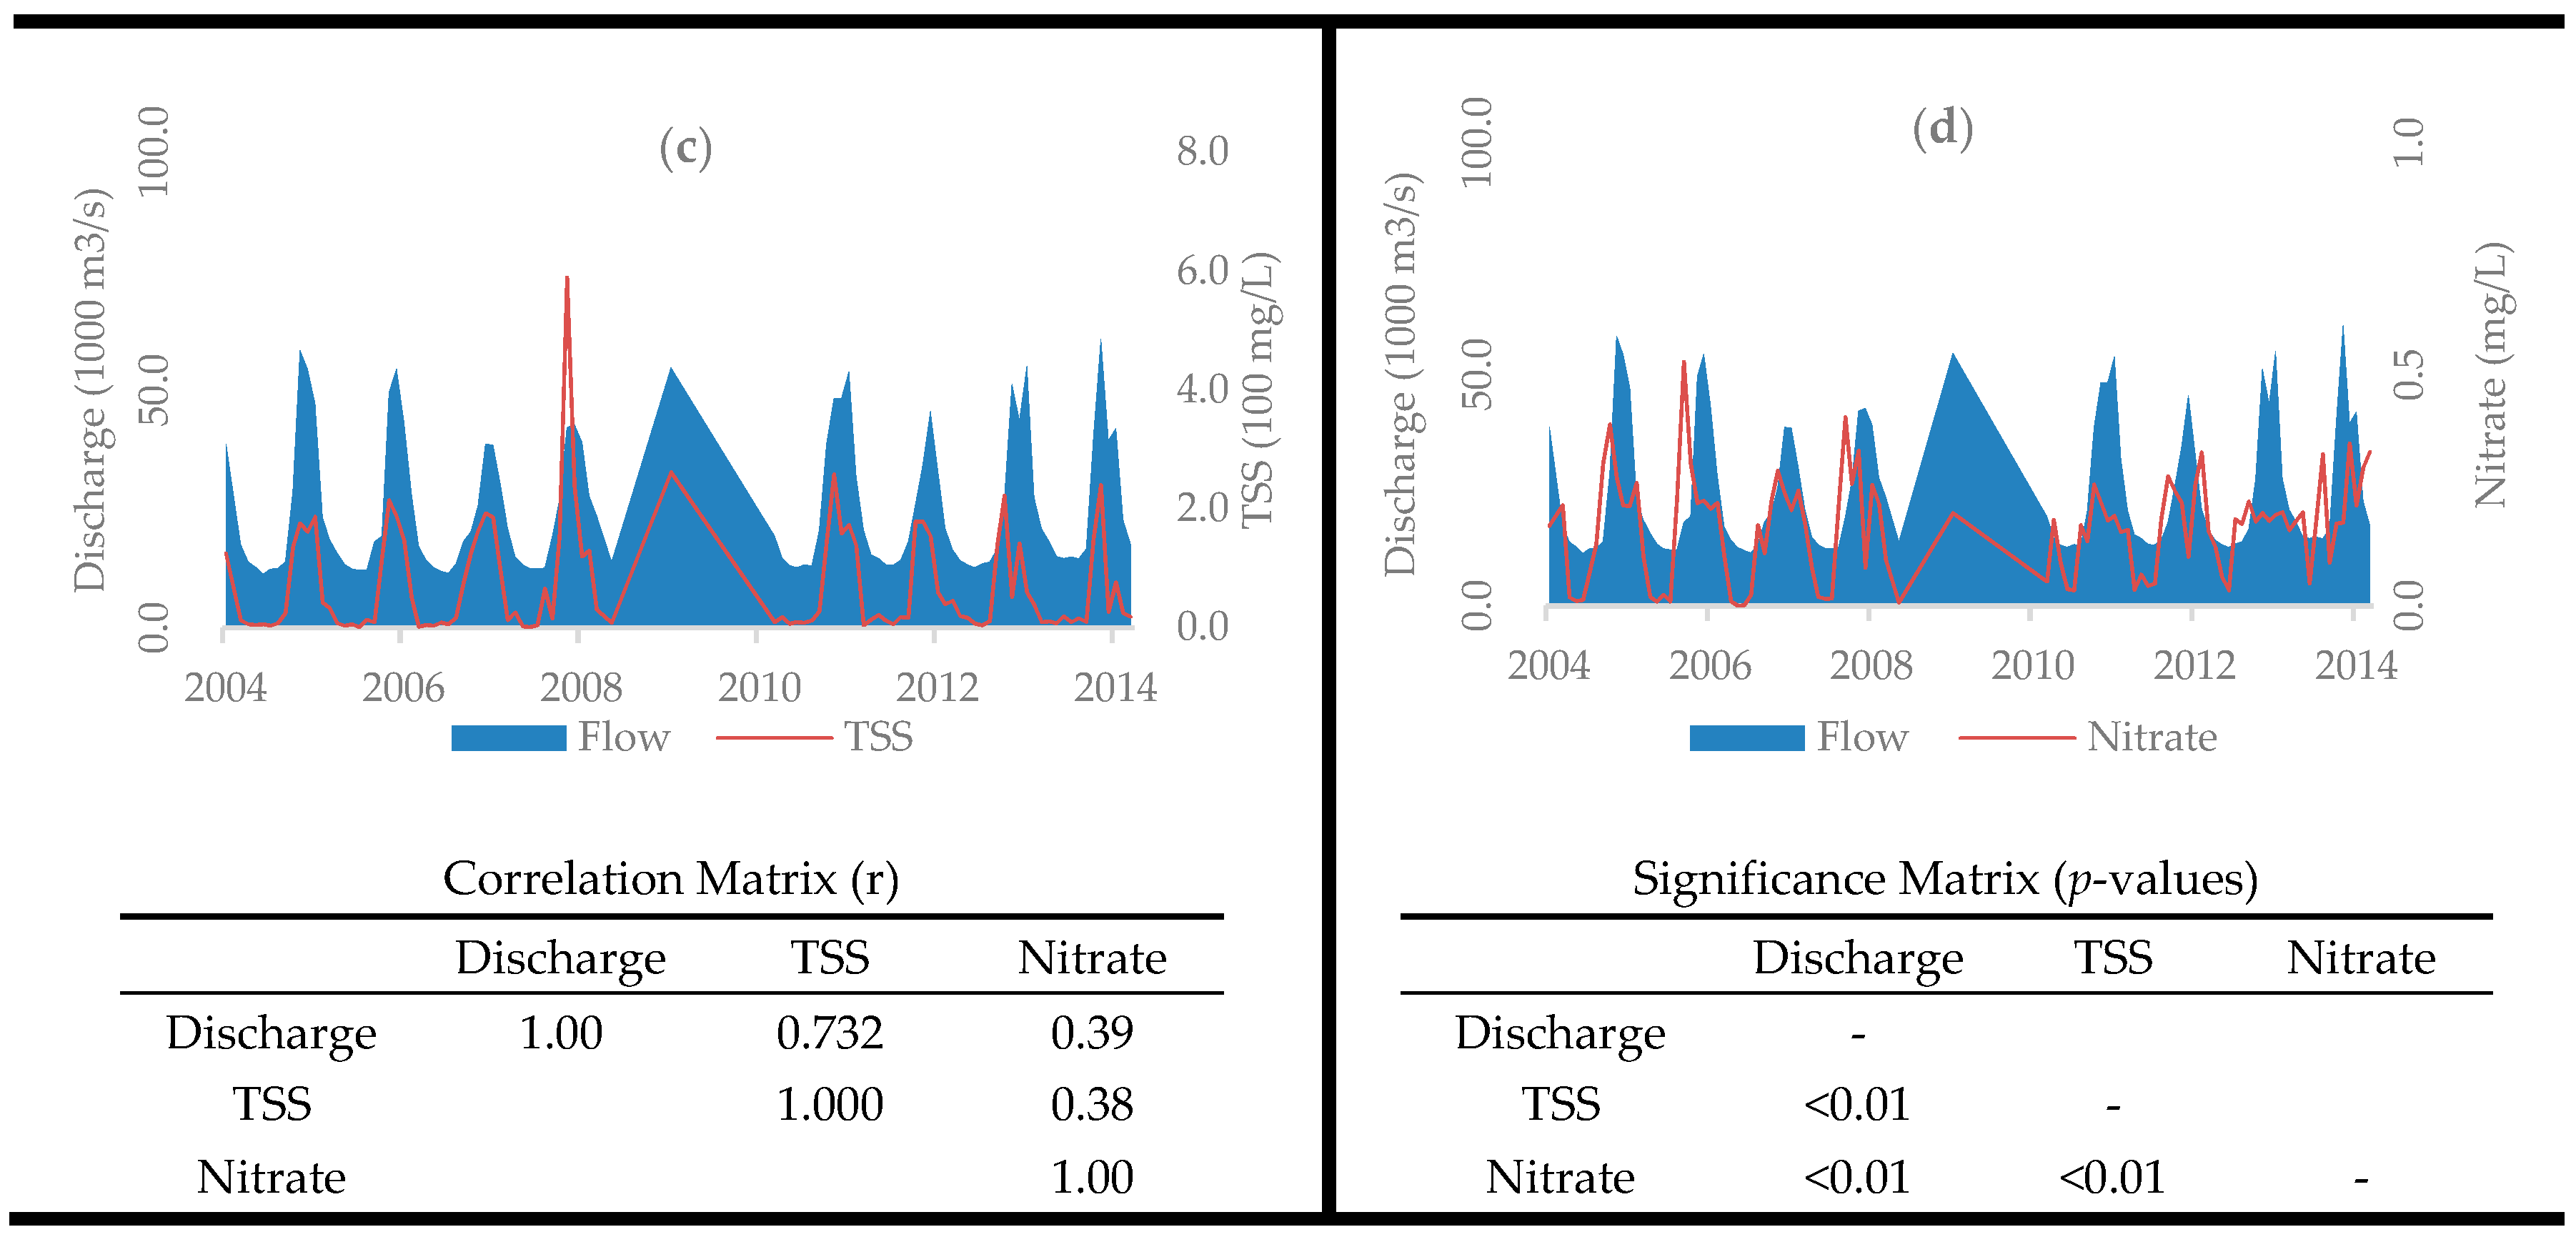
3.2. Spatial Relationships between LULC and Water Quality Indicators

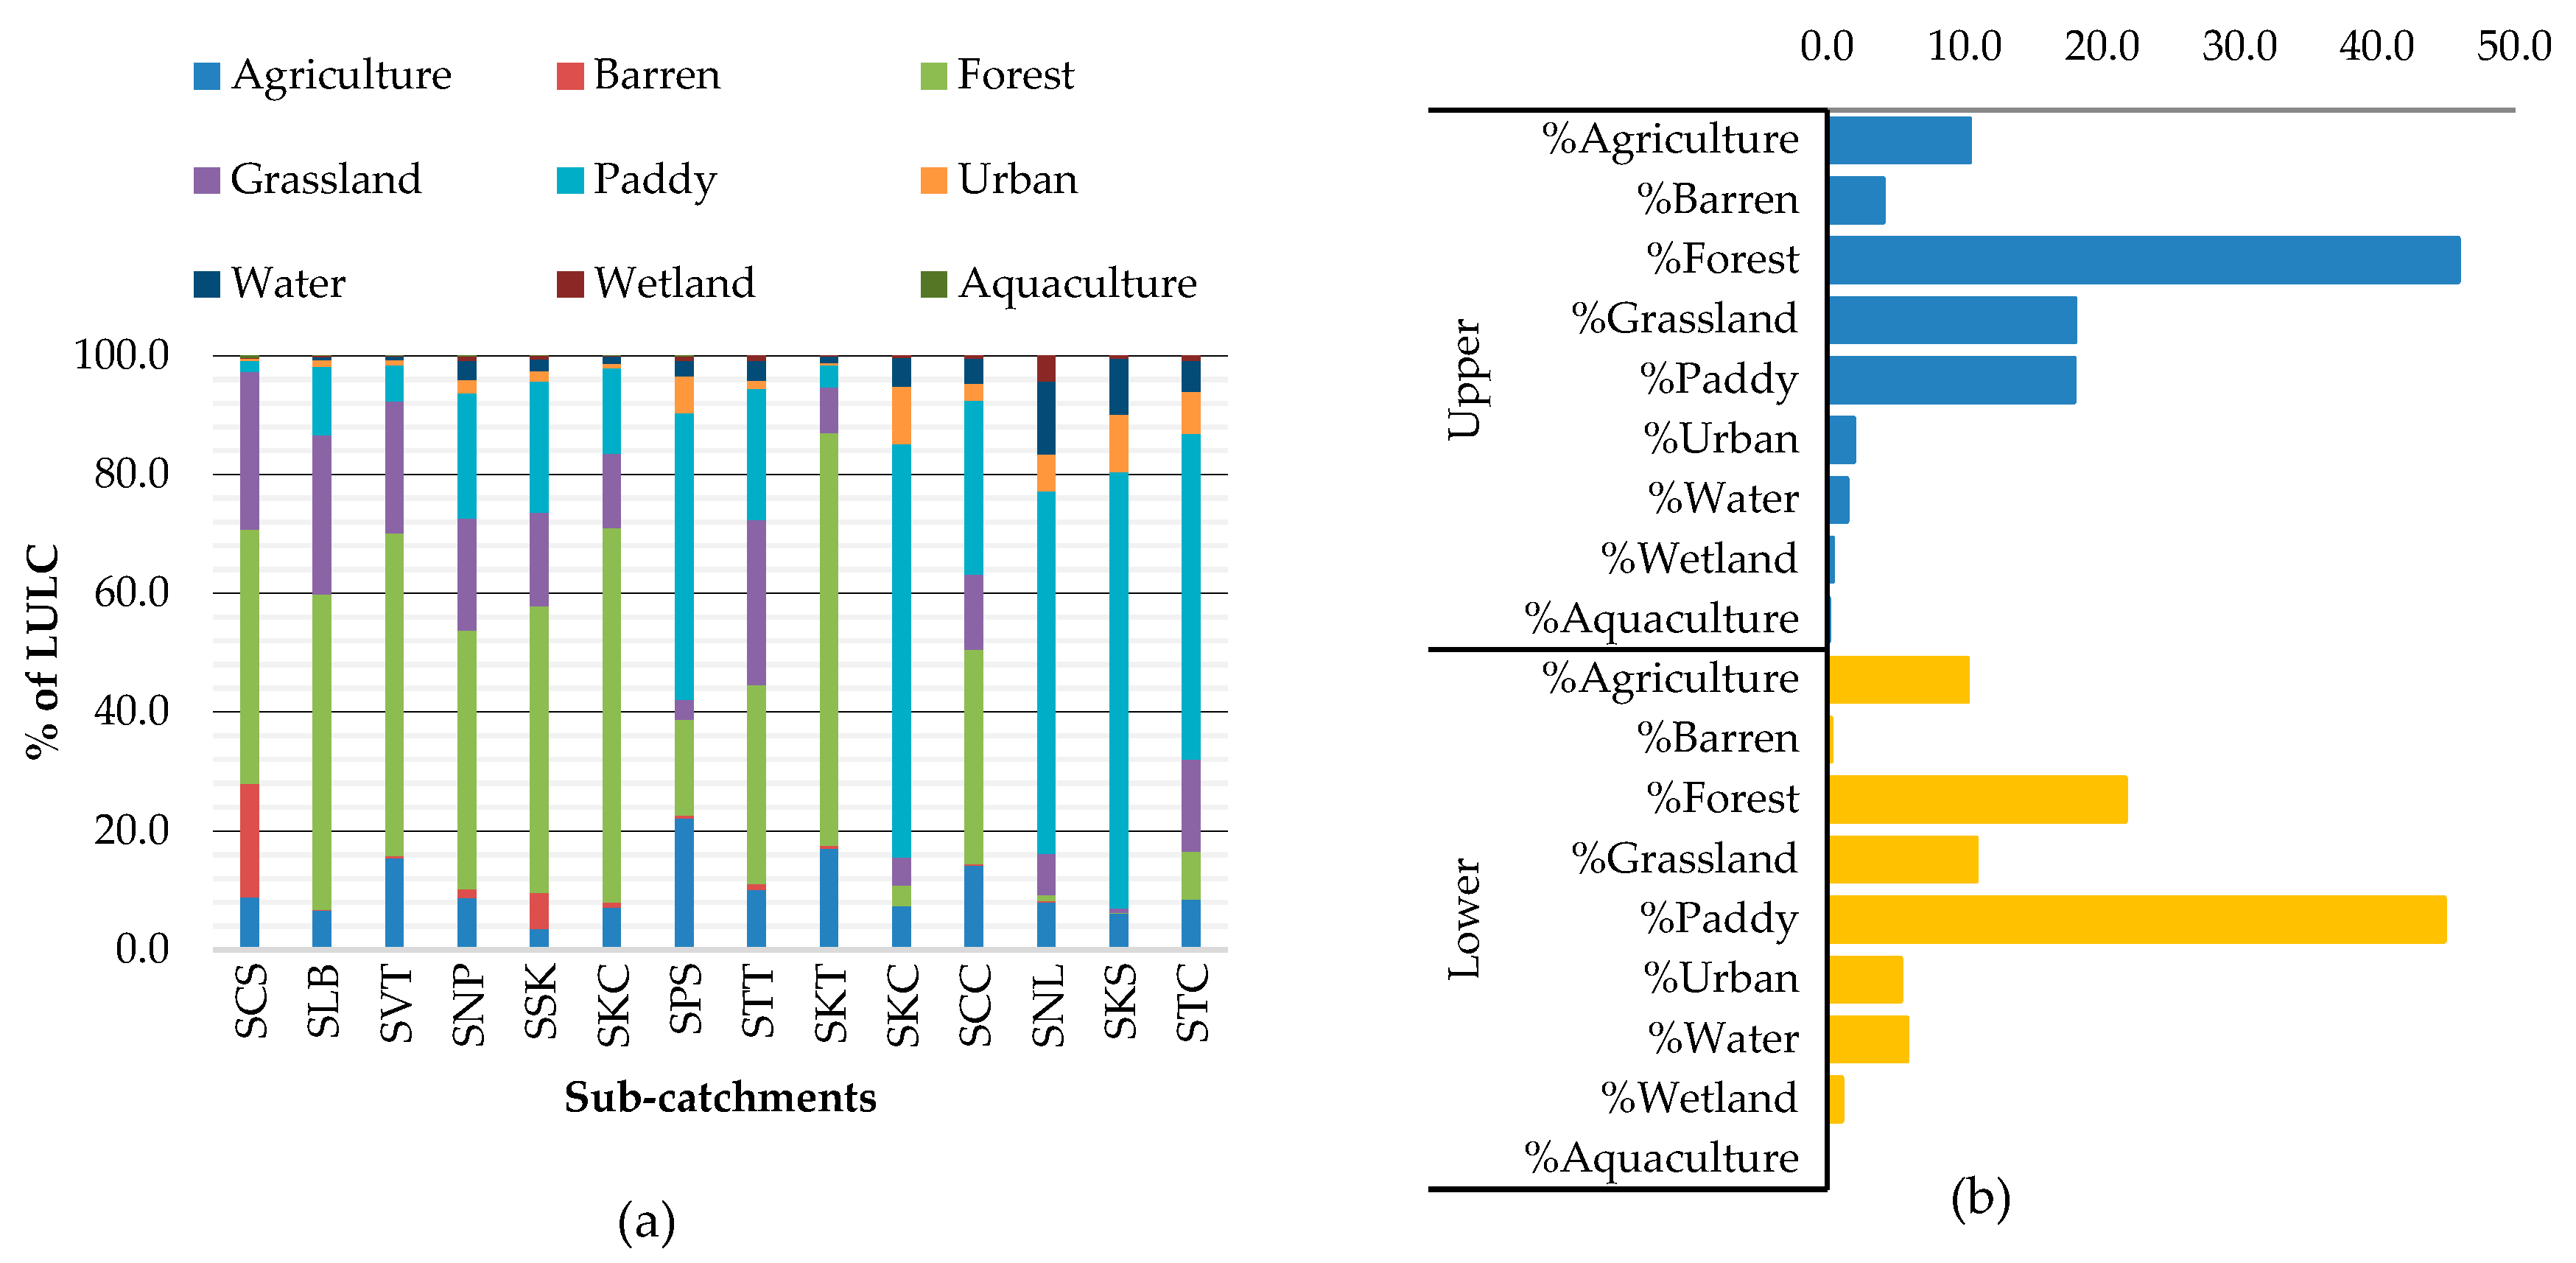
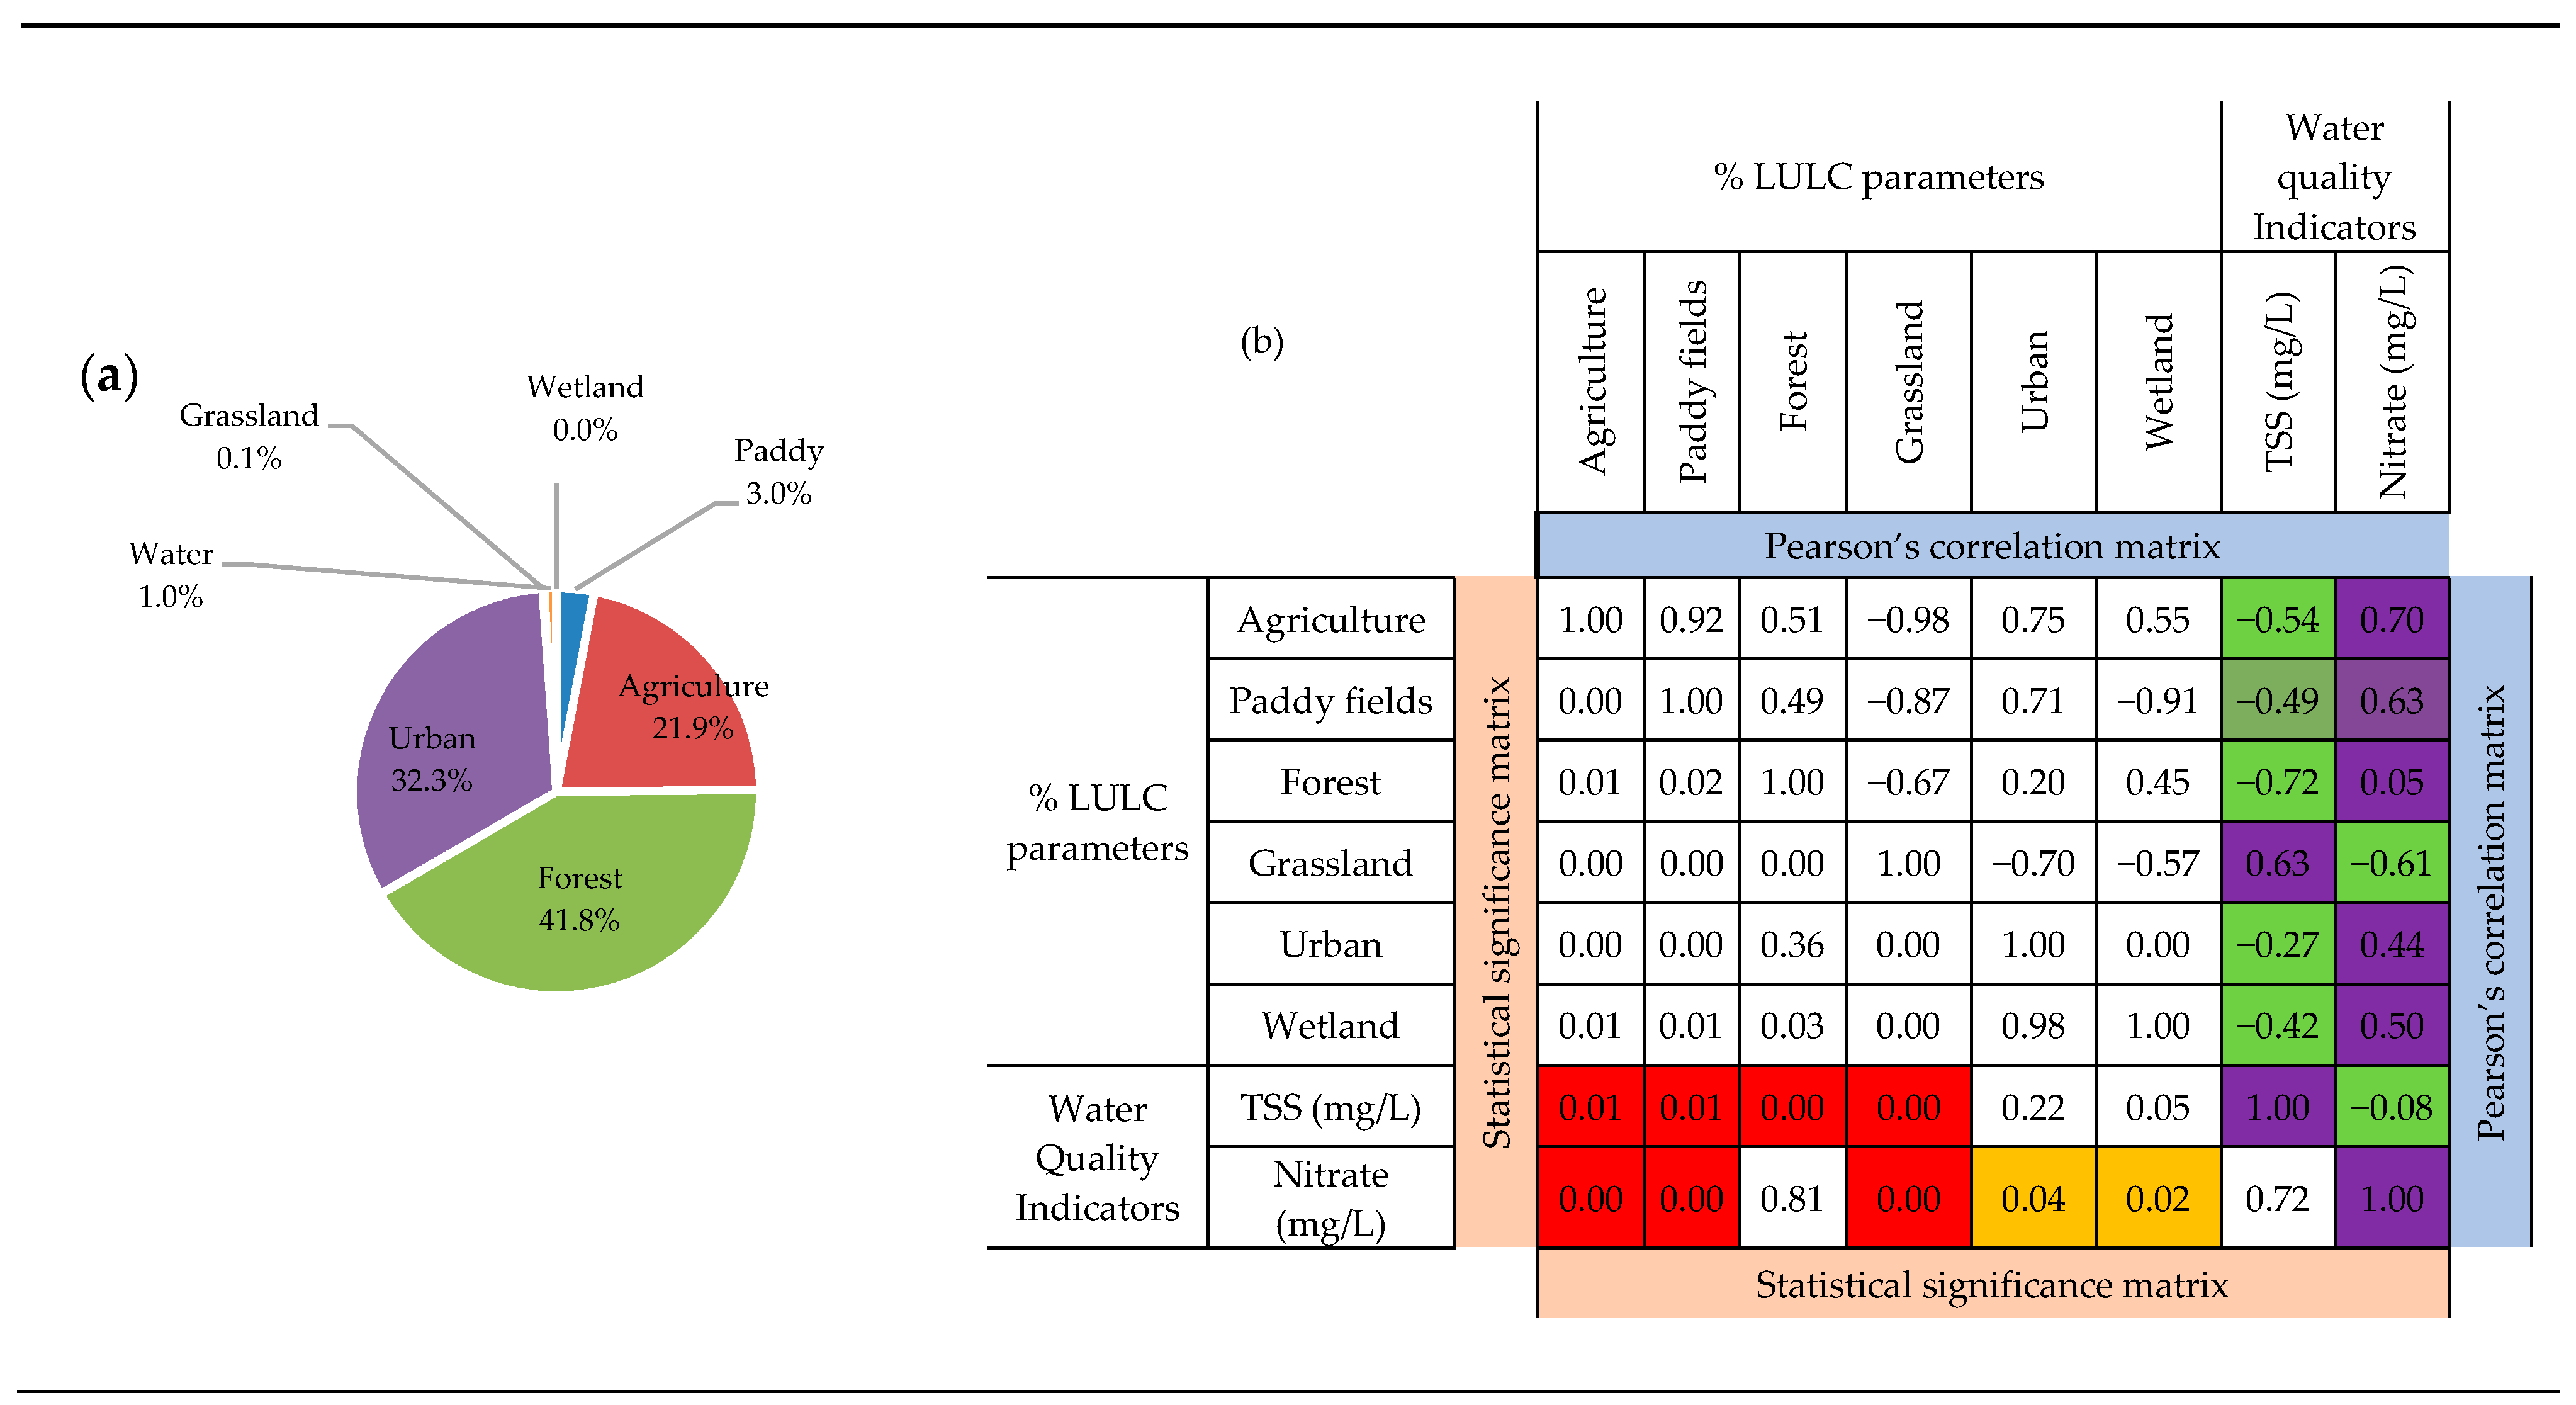
3.2.1. Characteristics of the 2010 LULC

In 2010, forest and paddy rice were the dominant LUCL types in the studied sub-basins (Figure 3). Forest land accounted for about 33% of the total land area, while paddy fields accounted for about 31%. However, the proportions of individual LULC types varied greatly between each sub-basin (Figure 3a). In the upper section, where topography is characterized by hilly terrains and steep slopes (see Section 2.1), forest was the main LULC, accounting for approximately 46% of the total surface area that makes up the section (Figure 3b). The mosaic of plains and plateaus intertwined with mountains in this part of the LMB facilitates conversion of forest areas to paddy fields and other forms of agriculture (18 and 10%, respectively). On the other hand, the lower part of the basin is characterized by large areas of plains and low rises suitable for permanent forms of agricultural activities. Therefore, this section of the basin is dominated by paddy field areas (45%), with the exception of the Kratie (SKT) sub-basin, where 70% of its area remained forested. In the MD, which includes the Neak Loung (SNL), Kraorm Samnor (SKS), and Tan Chau (STC) sub-basins, 63% of the LULC were paddy fields, with forest areas covering merely 3% of the total land area (Figure 3b).

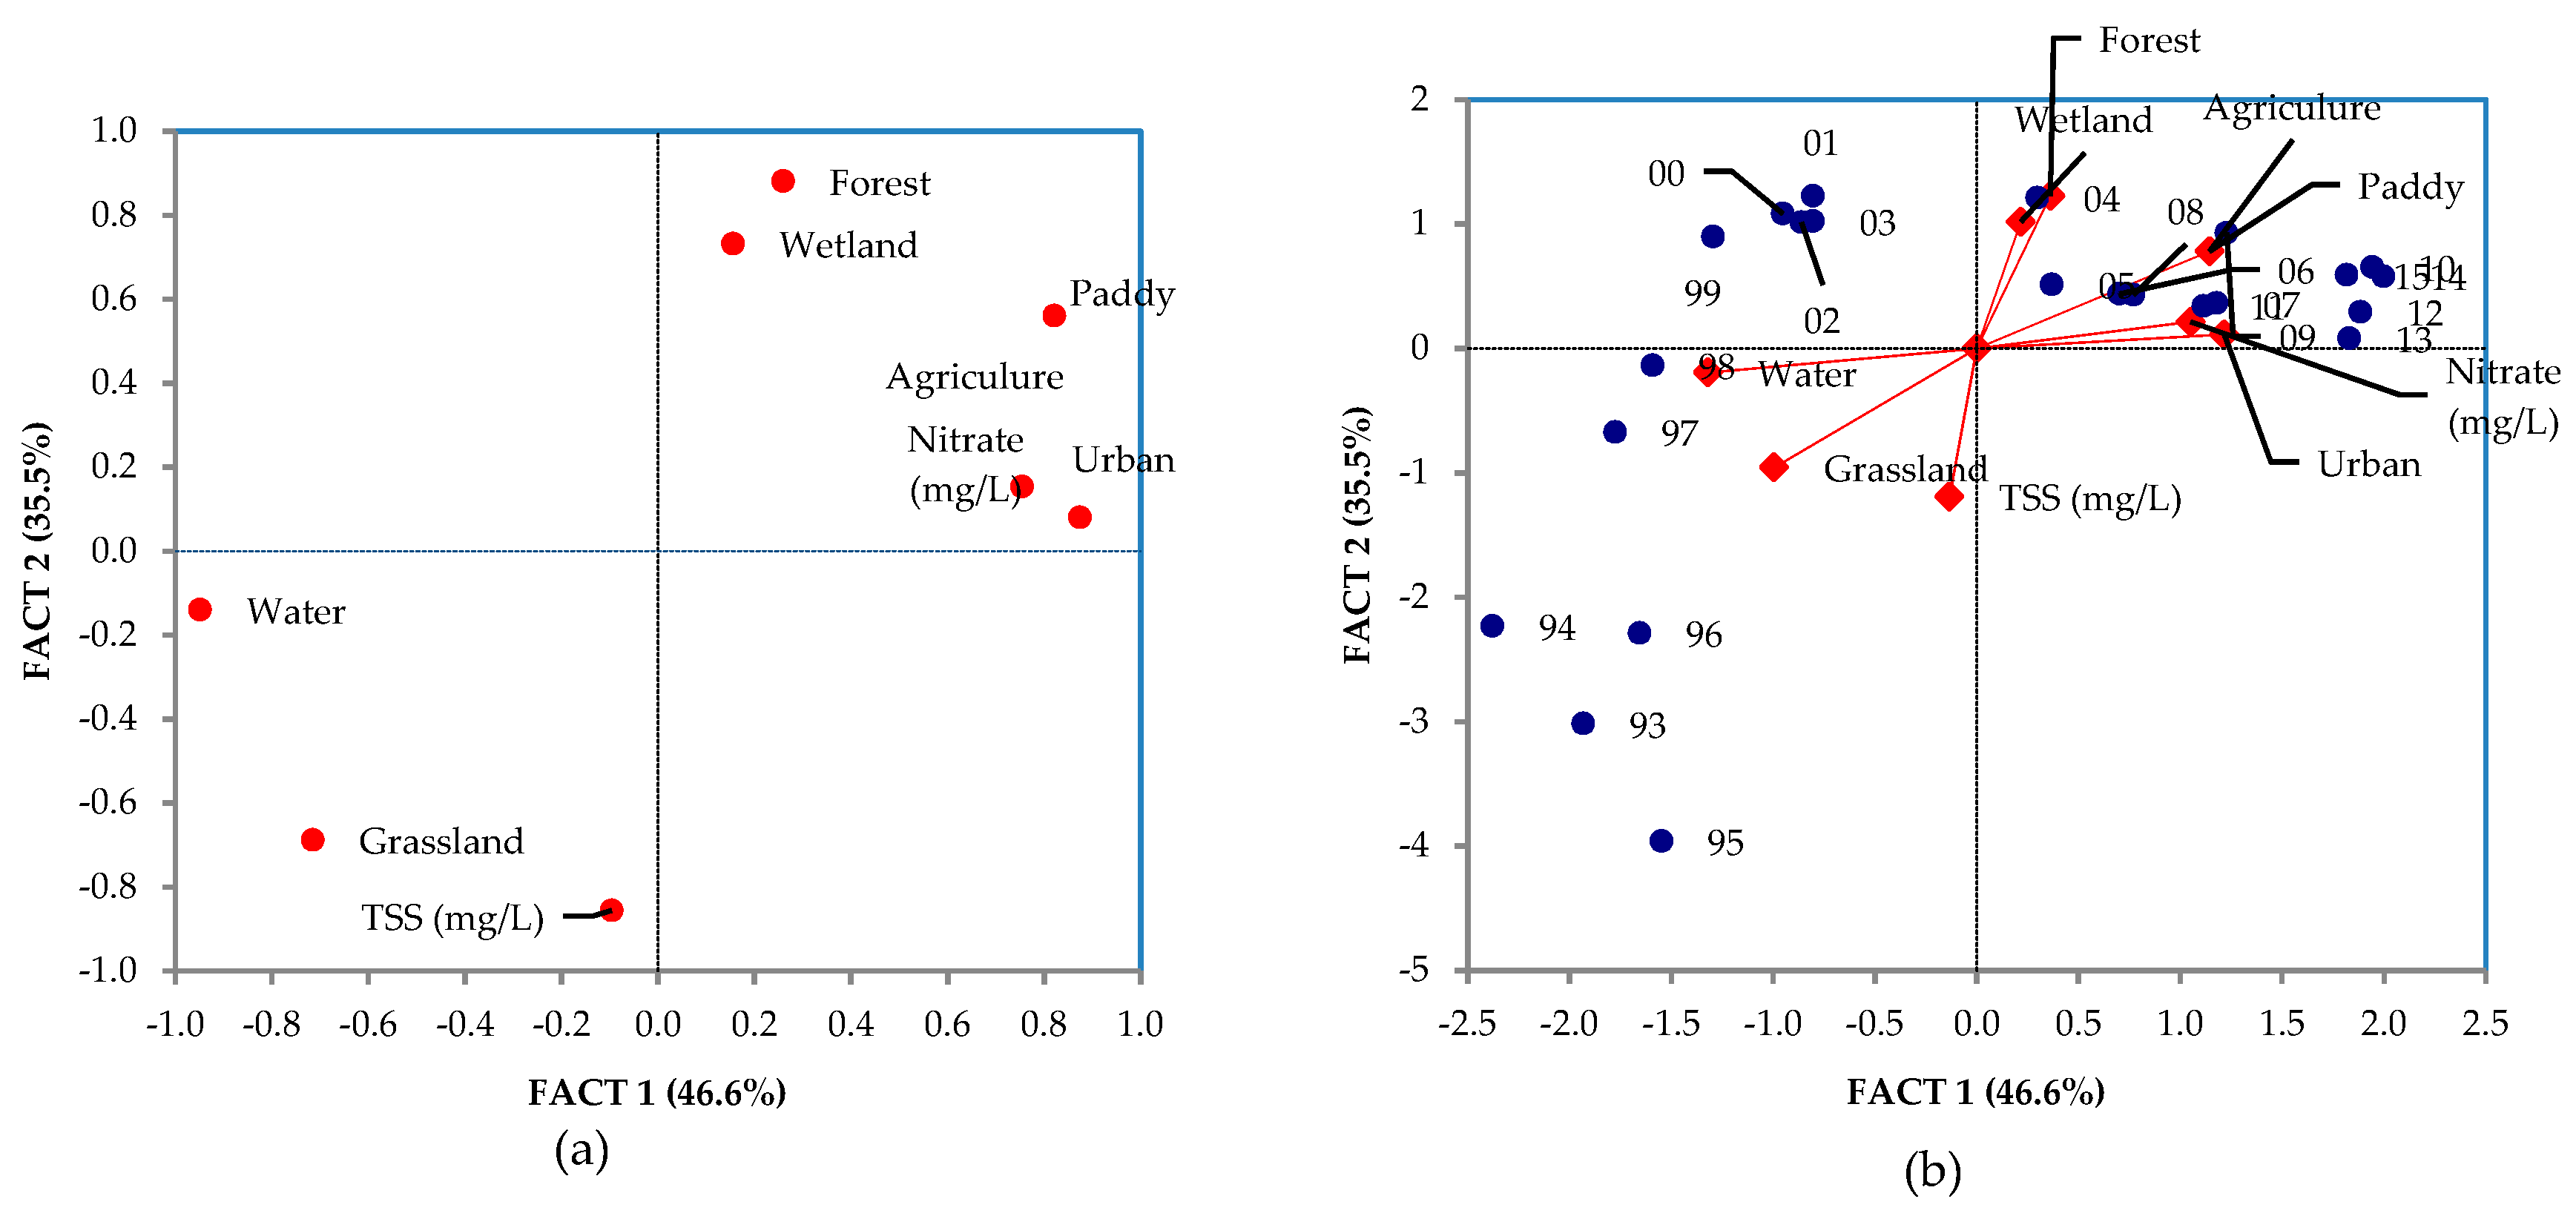
3.2.2. Spatial Association between LULC and Water Quality Indicators

The Pearson’s analysis of spatial correlation among LULC parameters and water quality indicators over the entire LMB (Figure 4) showed a strong positive association (p = 0.01) between TSS levels and forest areas with a correlation coefficient (r) of 0.64, whereas the association between TSS and paddy fields was strongly negative (r = −0.61, p = 0.02), as it was with urban areas (r = −53, p = 0.05). While correlation existed between TSS and areas covered by grassland (r = 0.42), these relationships were not statistically significant (p > 0.05).
Statistically significant relationships (p < 0.05) were observed between nitrate levels and seven LULC parameters (Figure 4). Positive associations were noted with forest land cover (r = 0.54), grassland (r = 0.66), aquaculture areas (r = 0.56), and barren land (r = 0.58). Among these four LULC parameters, the strongest association (p = 0.01) was with grassland. The three LULC parameters negatively associated with nitrate were paddy fields (r = −0.67) and urban areas (r = −0.60). These results appear to contradict outcomes of previous studies, including those described in Section 1, where their outcomes revealed that catchments dominated by agricultural land use export higher nitrate levels to their receiving water [47], while catchments with high vegetation cover tend to reduce erosion and, therefore, reduce sediment runoff [2,48].
From the analysis of Figure 4, it seems that sub-basins of the LMB with greater proportions of forest land cover tend to yield higher TSS and nitrate concentrations, whereas the opposite occurs in sub-catchments with higher proportions of paddy fields. A plausible explanation to support these findings is that in the LMB, traditional land use management (see Section 3.2.2.1), soil composition (Appendix C), and topography (Section 3.2.2.2) influence the proxy indicators selected to assess water quality. More to the point, while about 33% of the basin (46% in the upper section) was forested in 2010, prior research [49] evidenced the impact of human disturbances—shifting cultivation, logging, and poor infrastructure development—within this land cover. These activities tend to reduce ground vegetation cover, exposing the topsoil to increased sediment detachment and transport during the wet season. For example, many road networks have been constructed through forested areas, applying low engineering standards that failed to account for the easily erodible conditions of the soil, which in turn increases sediment production [50]. Where forest areas are subject to intensive logging, soil erosion in connection with road networks is even more extreme, with a soil loss rate of close to 80% [51]. With few little sustainable land management practices occurring in the area, sediment transportation to the stream network can be exacerbated by natural hazards, i.e., landslides caused by high-intensity rainfall during the monsoon months [52]. These disturbances, along with the effects of hydropower dams (Section 1 and Figure 1a) operating in the upper part of the catchment, can explain the observed positive relationship between forest land cover and instream TSS and nitrate levels of the LMR.

3.2.2.1. Land Management Influencing TSS and Nitrate Deposition

Time series analysis reveals that TSS and nitrate levels were consistently highest in the upper part of the river where sub-basins are dominated by forest land cover and hilly topography with strong to steep slopes (mean slope greater than 15% (see Section 2.1 and Figure 1b)). Traditional shifting cultivation practiced in hillsides and sloping lands requires no fertilizer inputs, but involves vegetation clearance and burning to provide nutrients for crops [53,54], and has led to the degradation of the forest ecosystem in the upper part of the LMB [55], exposing land to increased soil erosion during rainfall events. As mentioned in Section 2.1, croplands in steep slopes are subject to high rainfall–runoff factors (7986 to 12,599 MJ.mm/ha2) becoming highly erosive (mean annual soil erosion of about 13 to 32.2 t/ha/year) [32]. Areas of high soil erosion are also susceptible to soil nutrient displacement that can lead to increased eutrophication and sedimentation of the river system [49].
Shifting cultivation practices cause erosion (i.e., approximately 5.7 Mg/ha/year of topsoil are lost during cultivation, and about 0.7 Mg/ha/year during fallow years, according to [12], though they are not the only land use practice to be blamed for soil erosion in the LMB. Incentives for eliminating shifting cultivation (see Section 2.1) have led to a conversion of upland rice areas to tears, mazes, and tree plantations (teak, rubber, palm trees) [31,49,56]. Changes from upland rice to mazes and job’s tears, for example, have been found to almost double the rate of sediment production, from about 6 to about 11 Mg/ha/year [12]. Along with the conversion of upland rice farming to other types of cash crops, tree plantations have become more prominent in the mountainous region of the LMB. Increased areas of tree plantations, particularly in connection with teak plantation, have also been found to increase overland flow and sediment yield due to the increased throughfall kinetic energy created by their high canopies and large leaves [57].

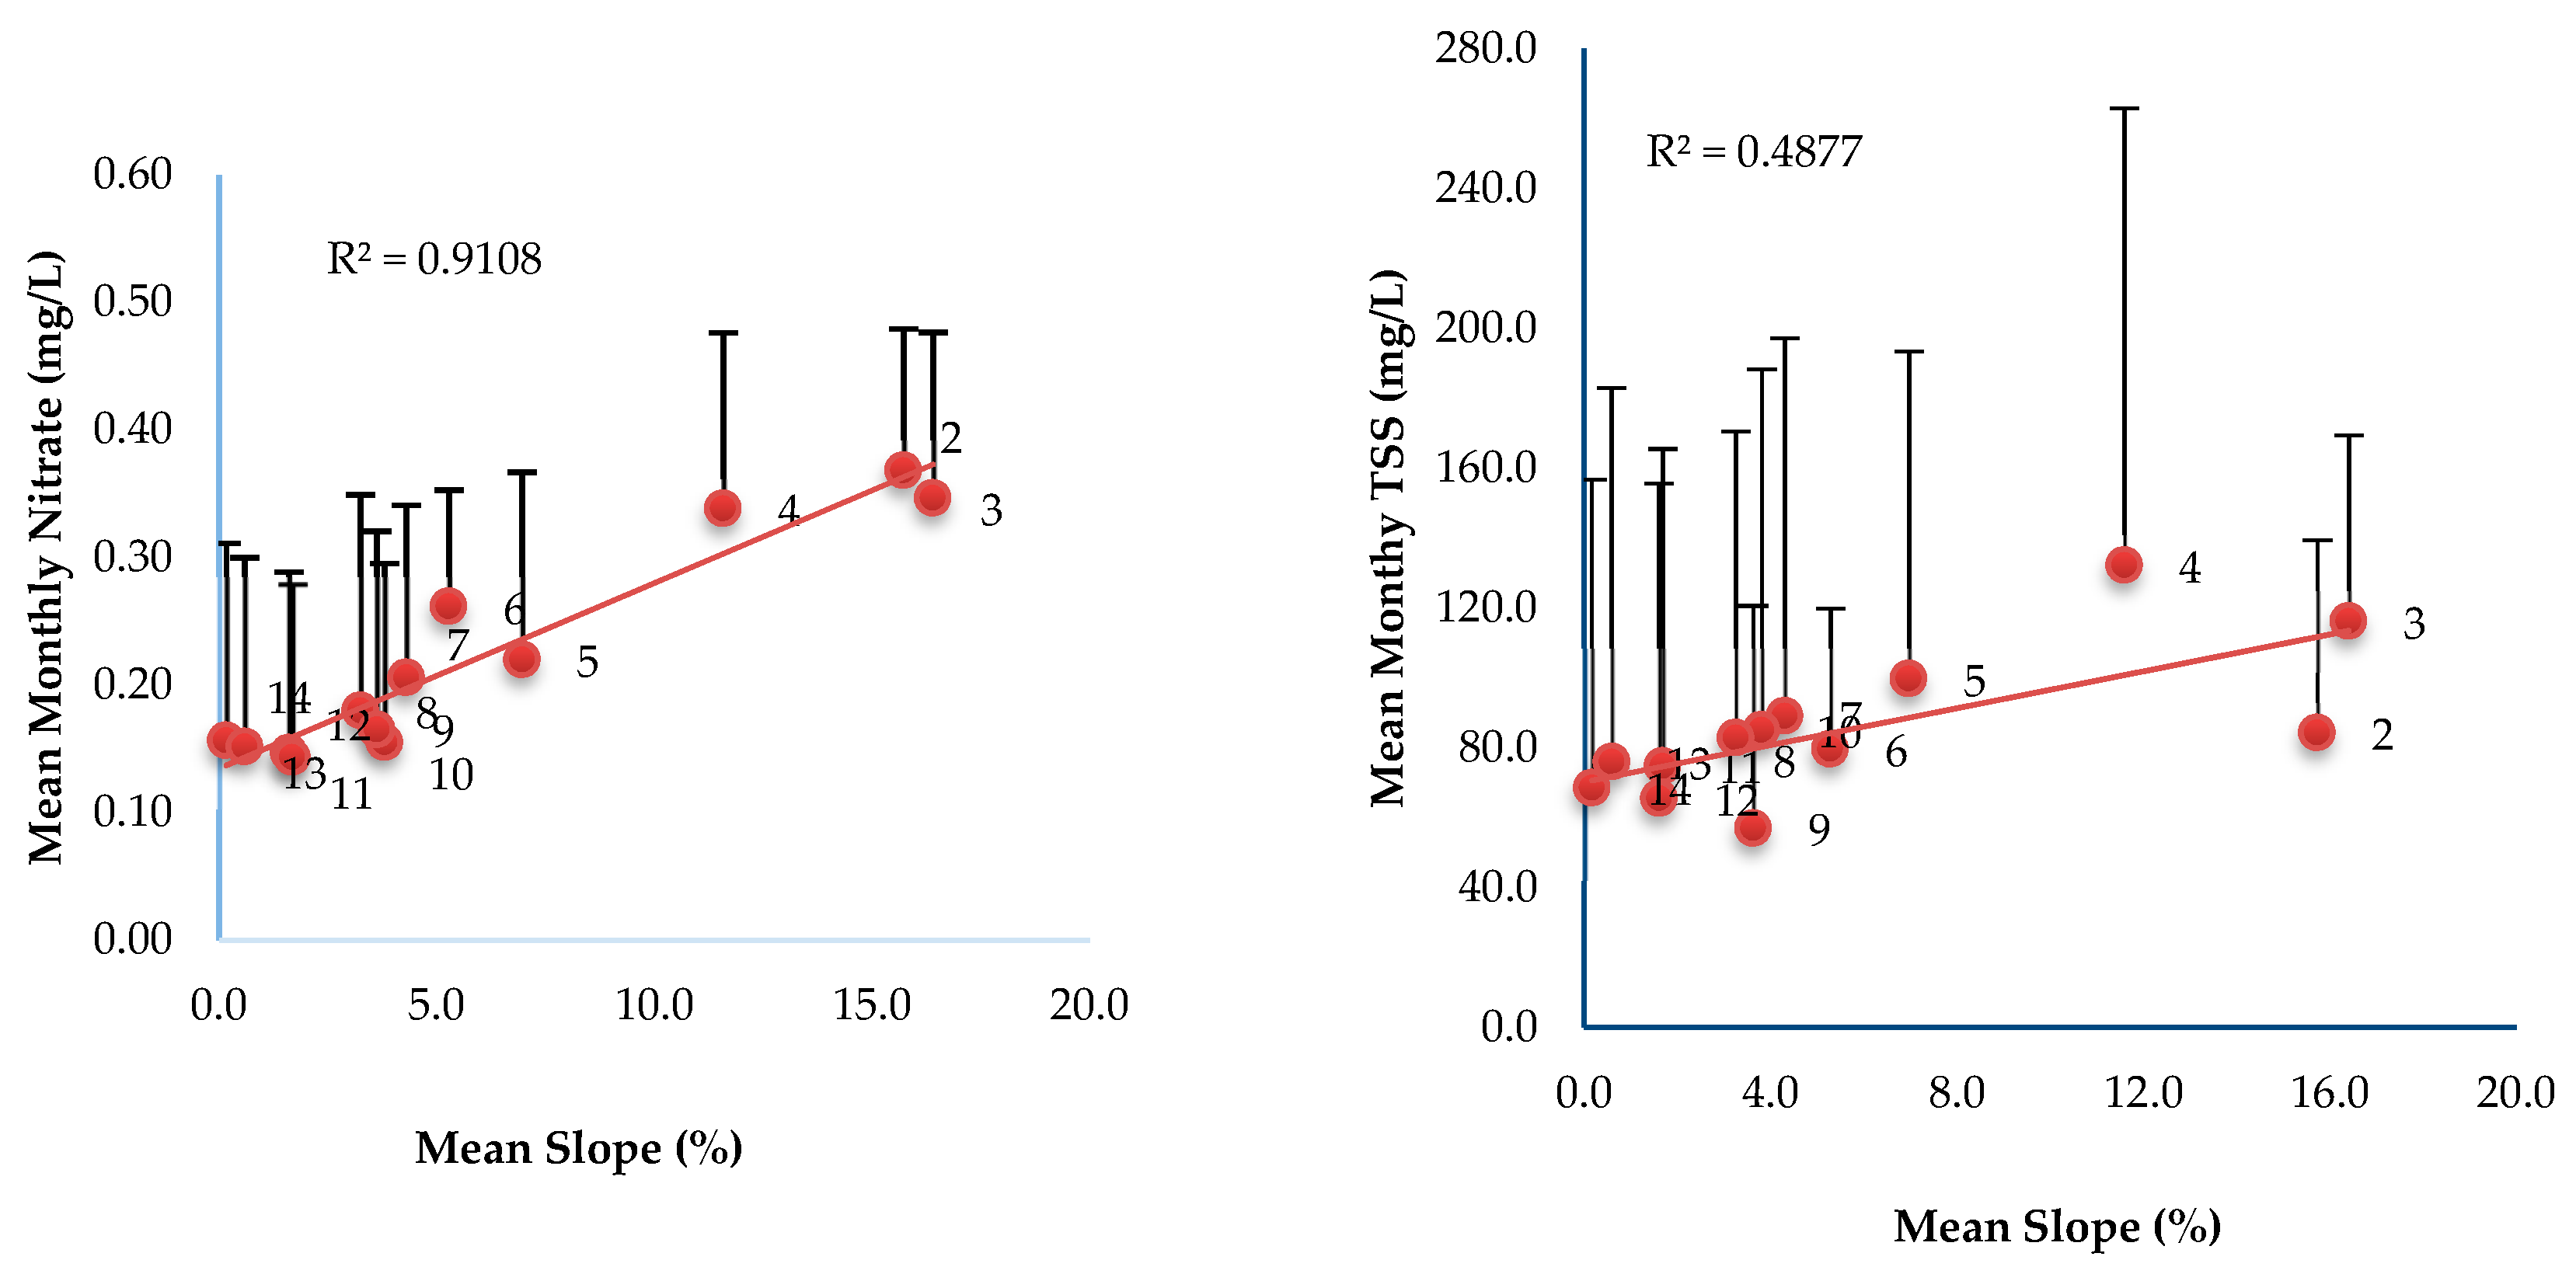
3.2.2.2. Impact of Topography and Soil Type

An assessment of whether landscape variables such as topography (using slope percentage) and soil types influence instream concentrations of TSS and nitrates (Figure 5) shows that both were positively associated with the mean slope percentage values of the sub-basins. The highest nutrient and TSS levels were recorded at Luang Prabang (WLP) (2), WVT (3), and Nakhon Phanom (WNP) (4), which are located in the upper part of the basin, where the topography is dominated by steep slopes (mean slope greater than 15%). As the river flows further downstream, lower concentrations of TSS and nitrate were recorded. As previously mentioned (see Section 2.1), these areas of the Khorat Plateau, Tonle Sap Basin, and MD are mostly flat land with low-gradient draining rivers and wide floodplains. In these areas, and more so in the MD region, sediment deposition reduces the concentrations of suspended sediment due to the low river gradient, decreasing instream TSS levels [58].
An examination of the soil characteristics (Appendix C) reveals that the LMB is dominated by Acrisol soils of low natural fertility, which are acidic and susceptible to erosion once vegetation clearance is carried out [59]. Triangulation of our results with prior research conducted in the study area points to soil characteristics, along with steep slopes and agricultural practices, as the primary drivers of the high TSS and nitrate levels observed in the upper part of the basin.

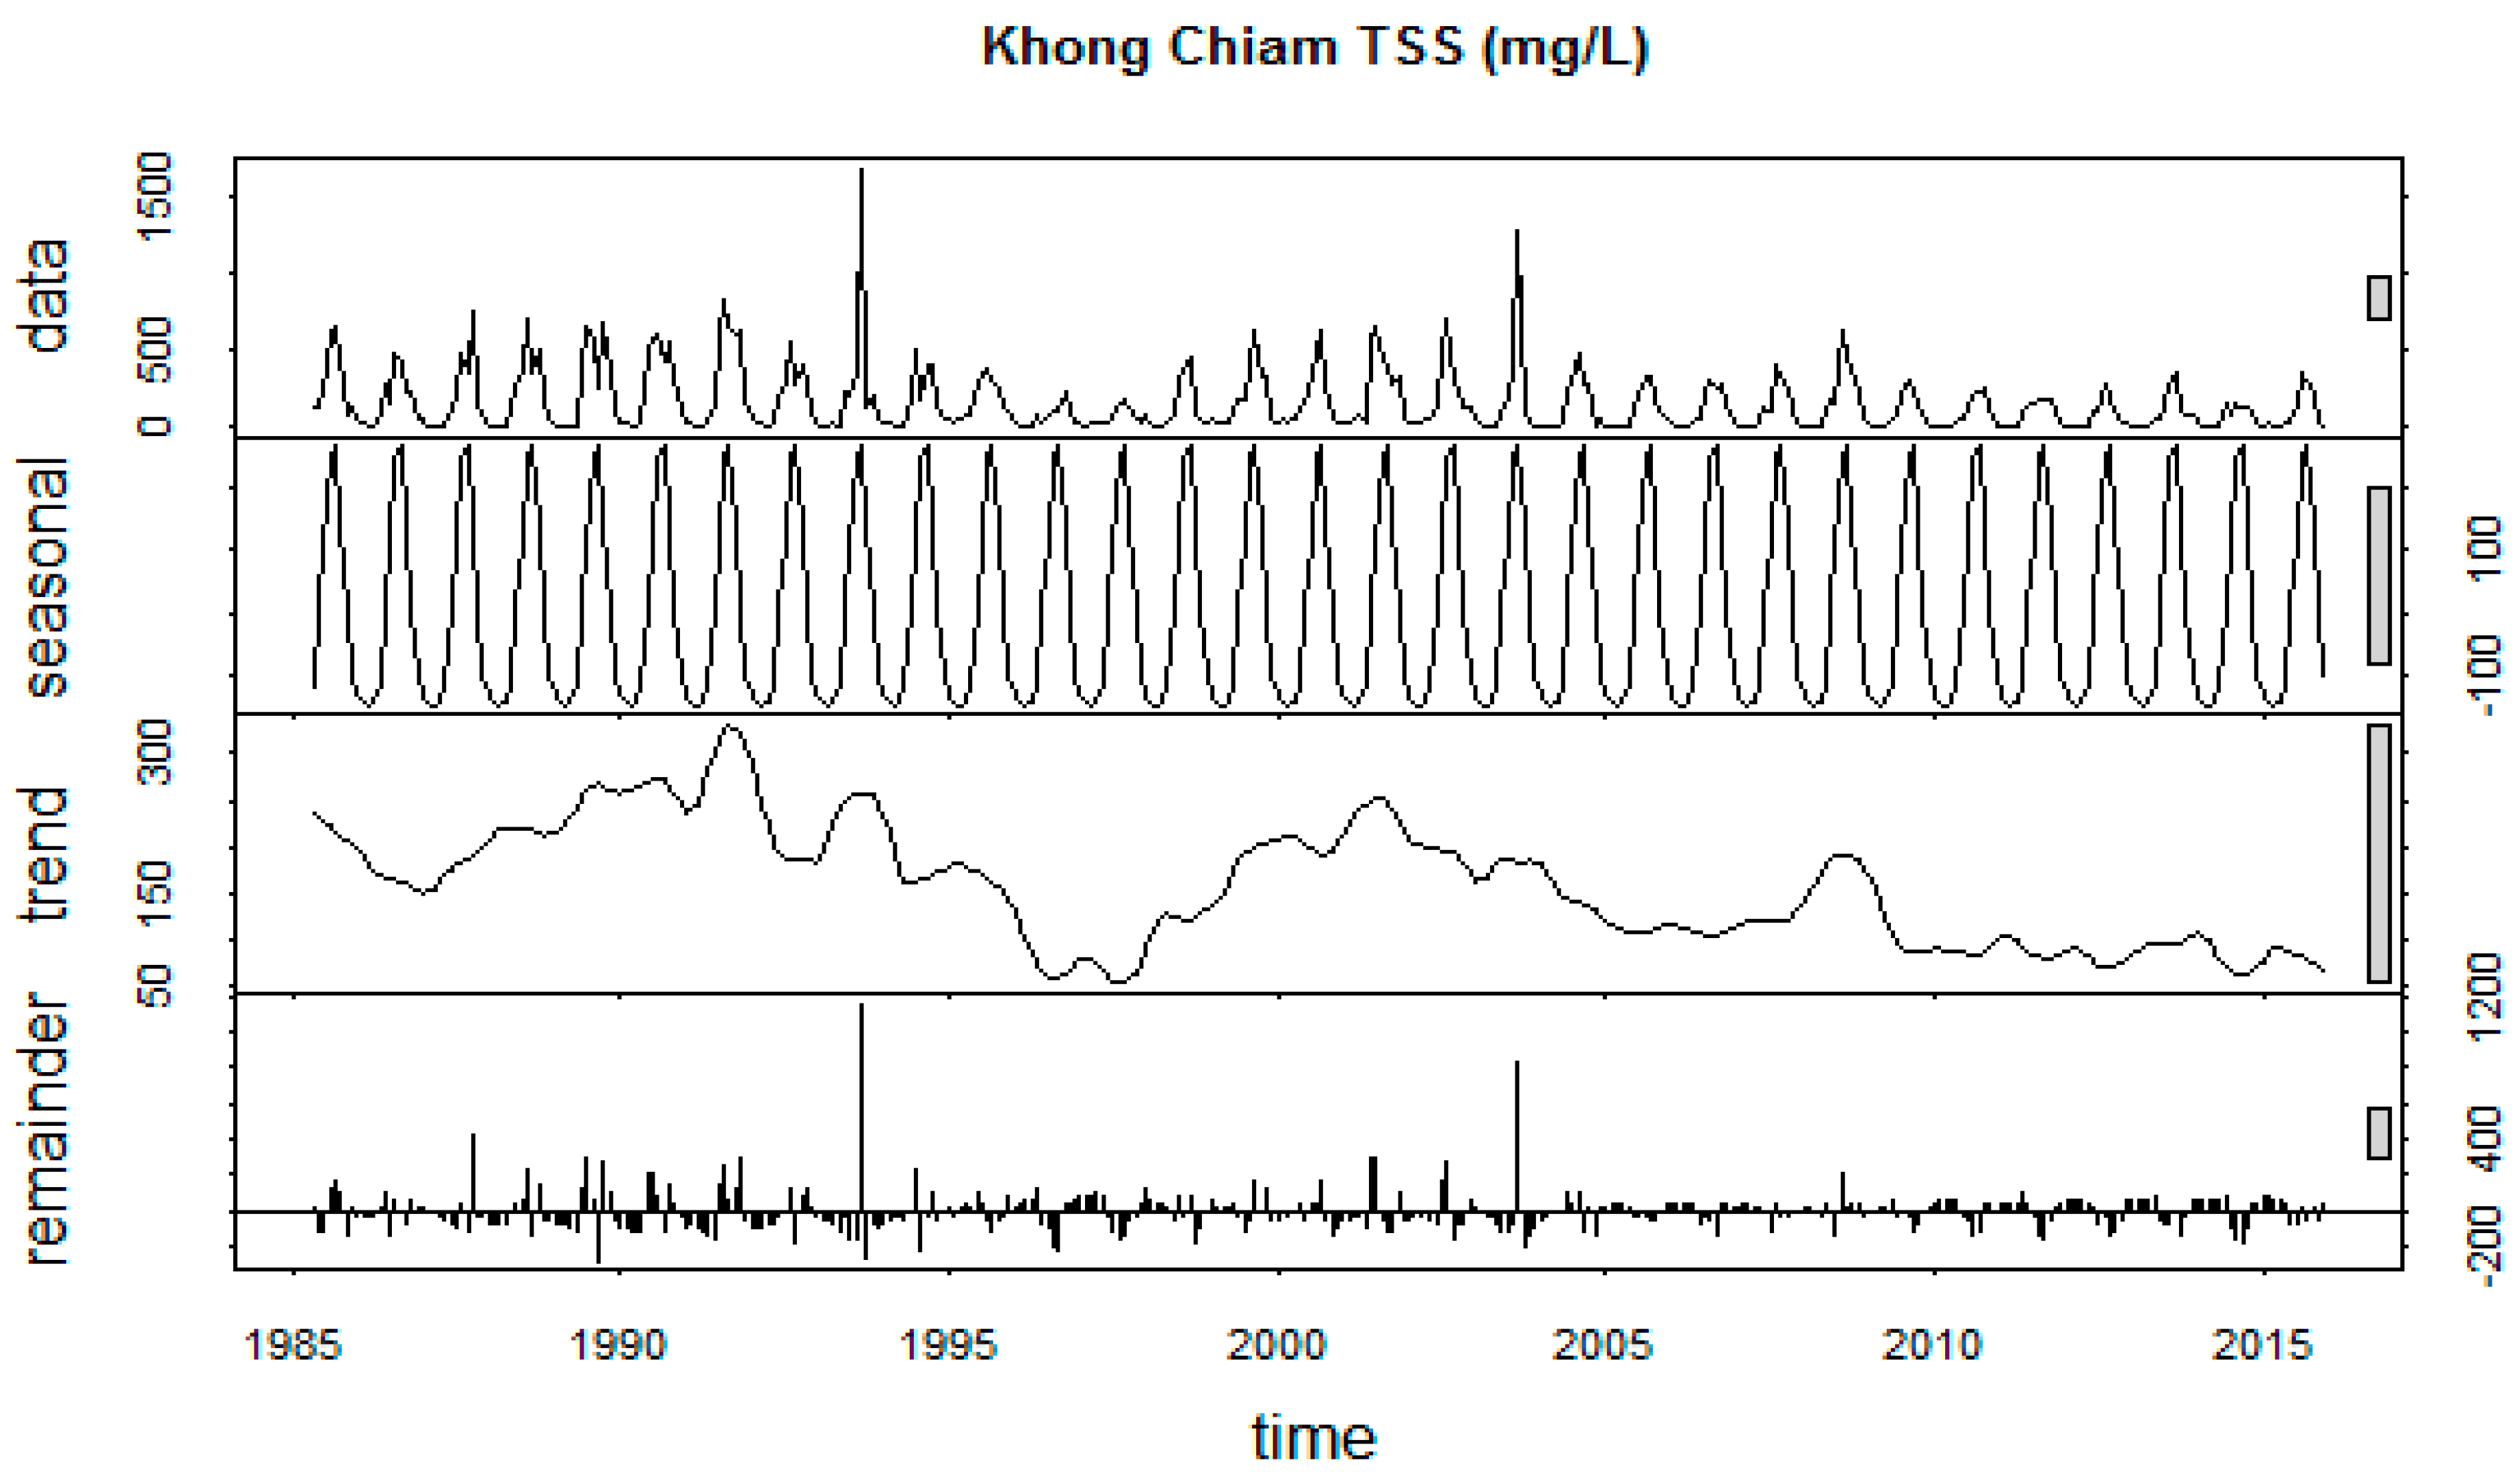
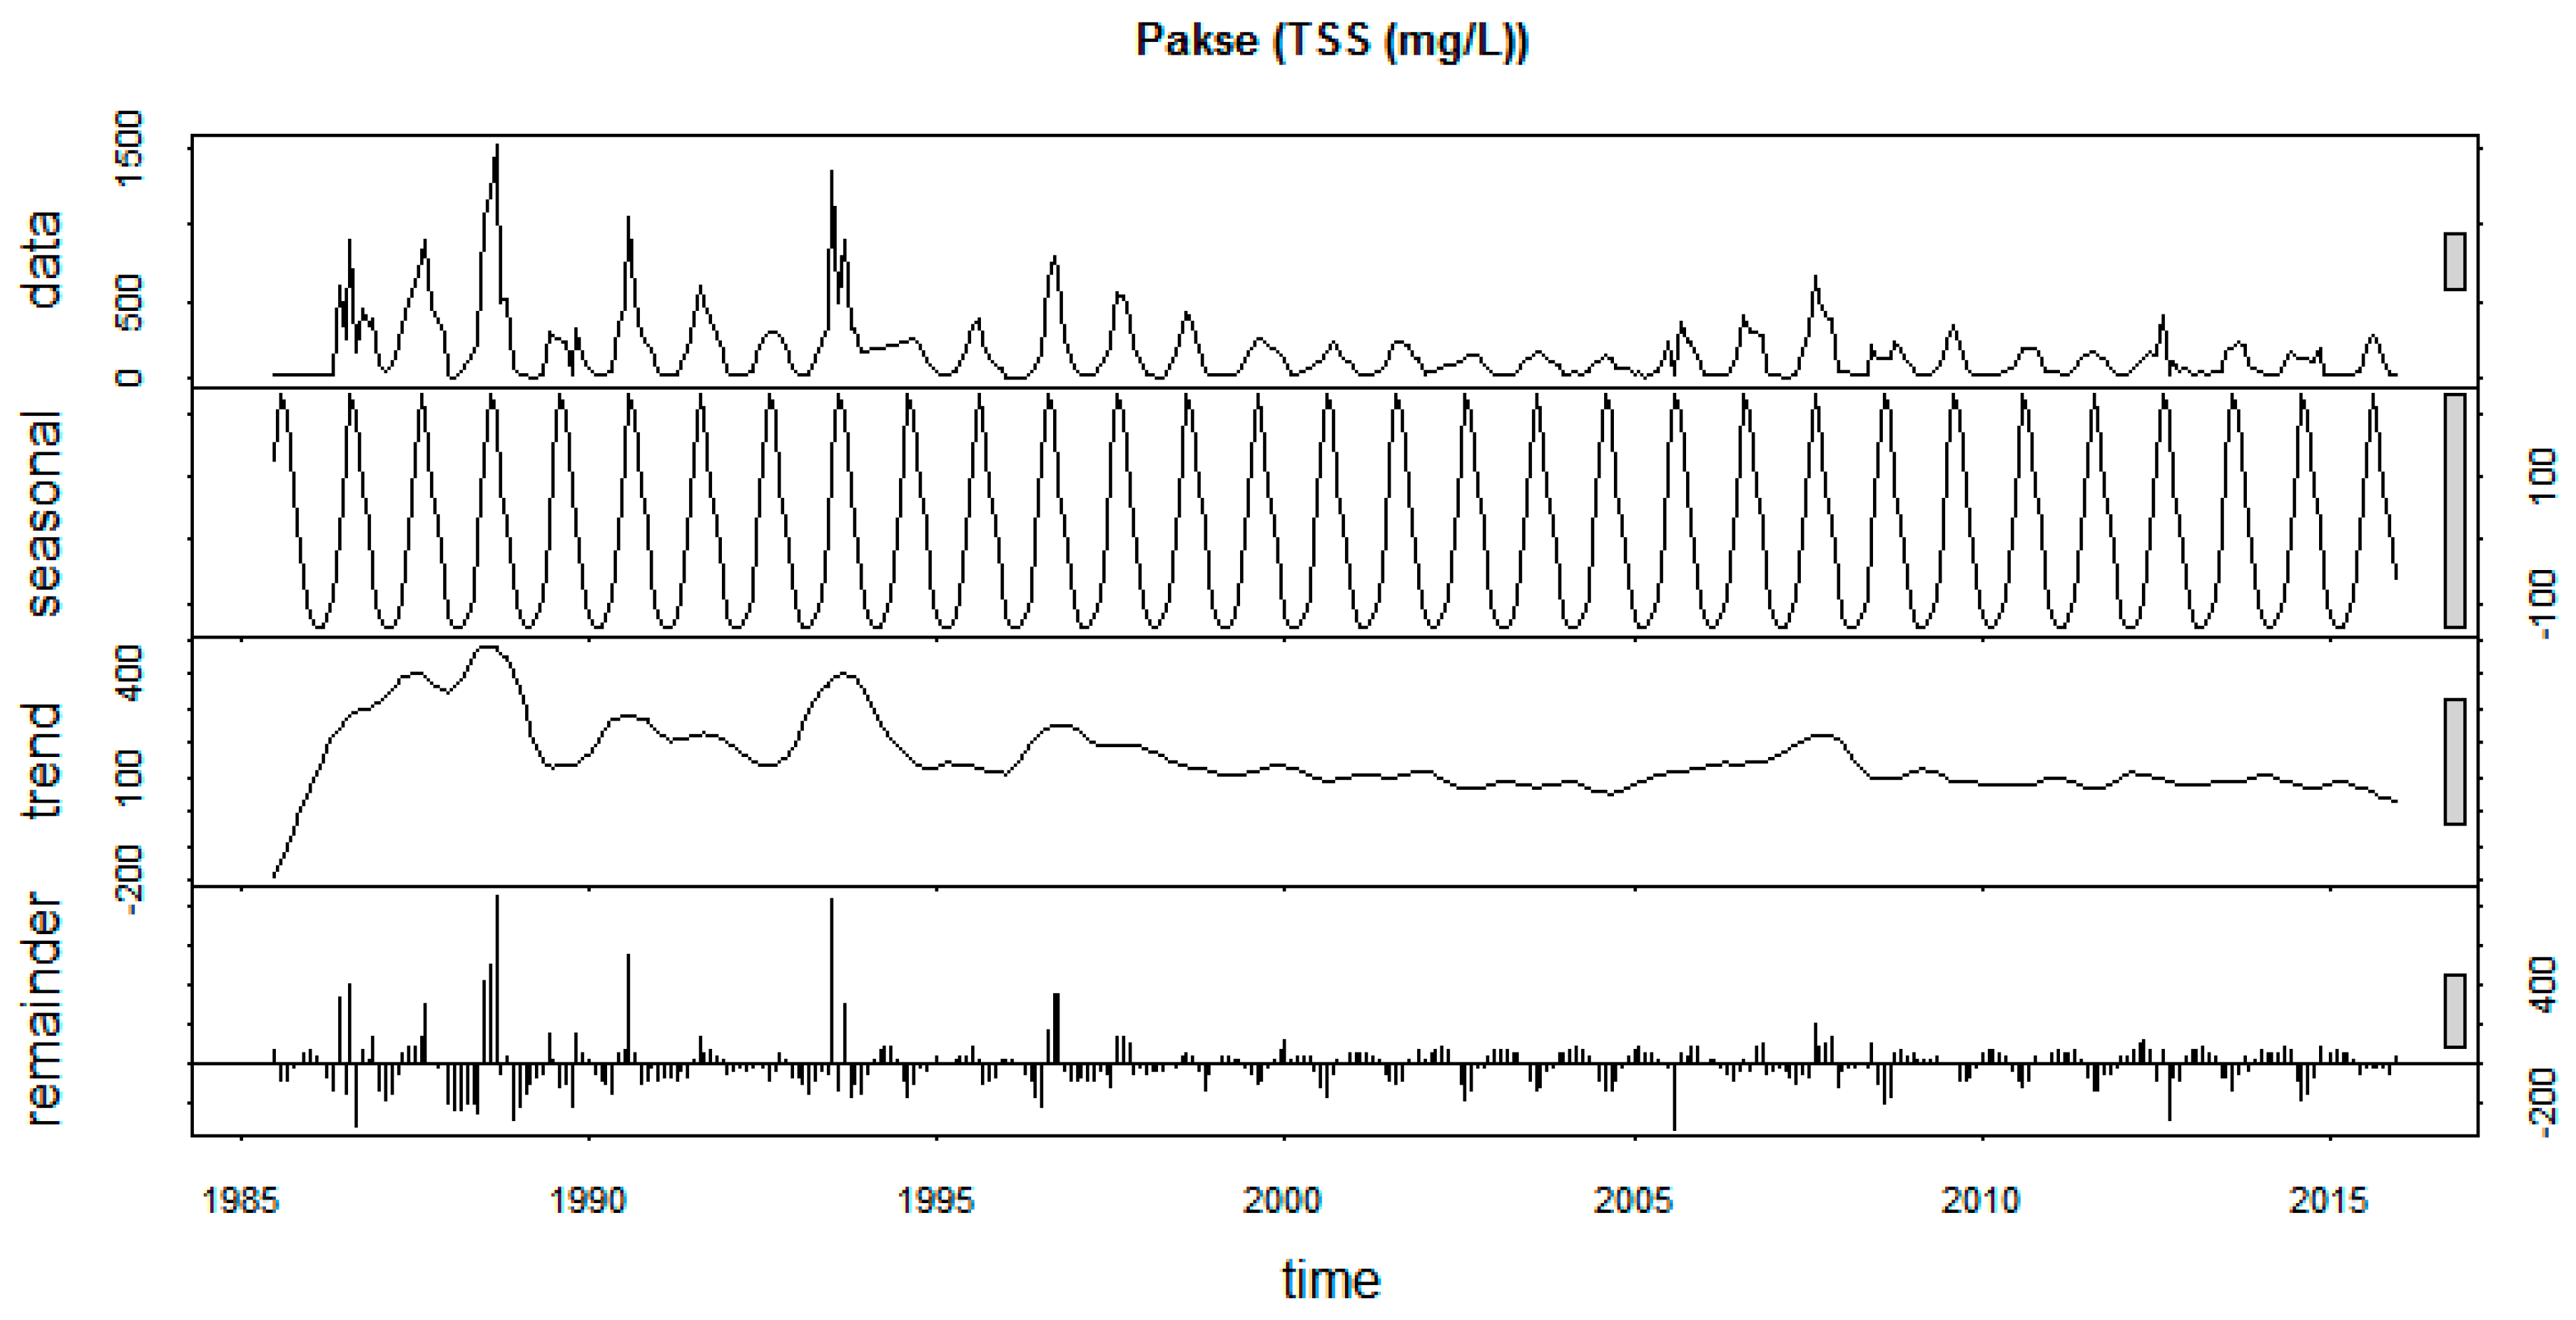
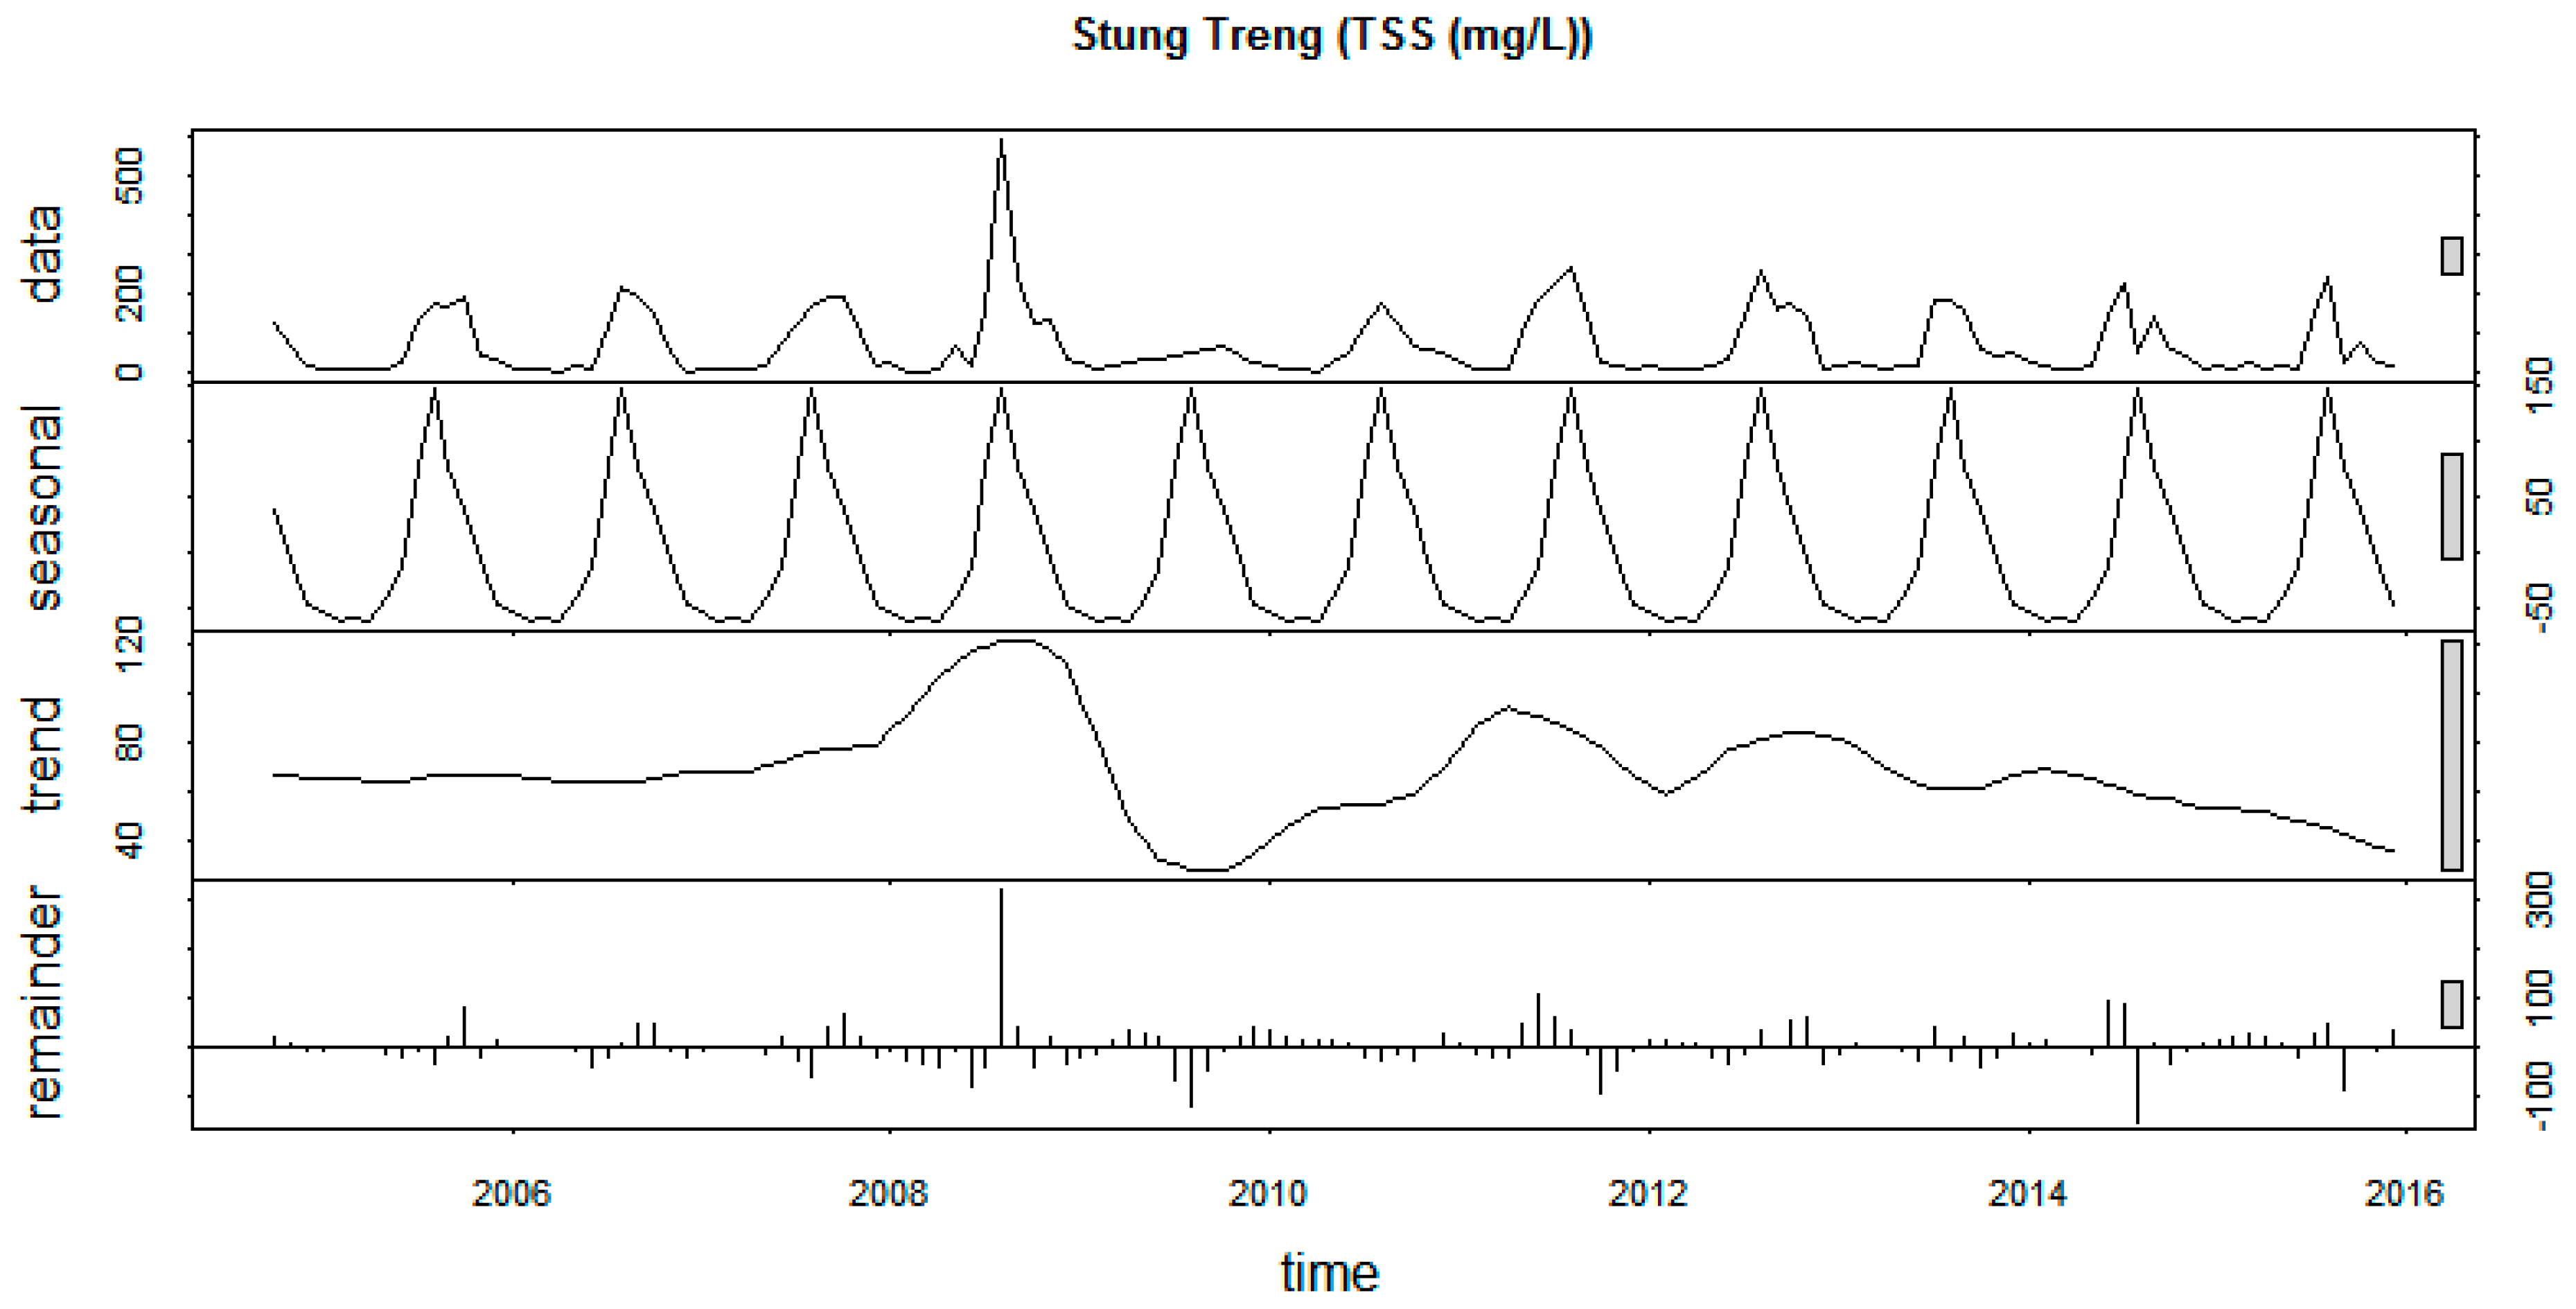
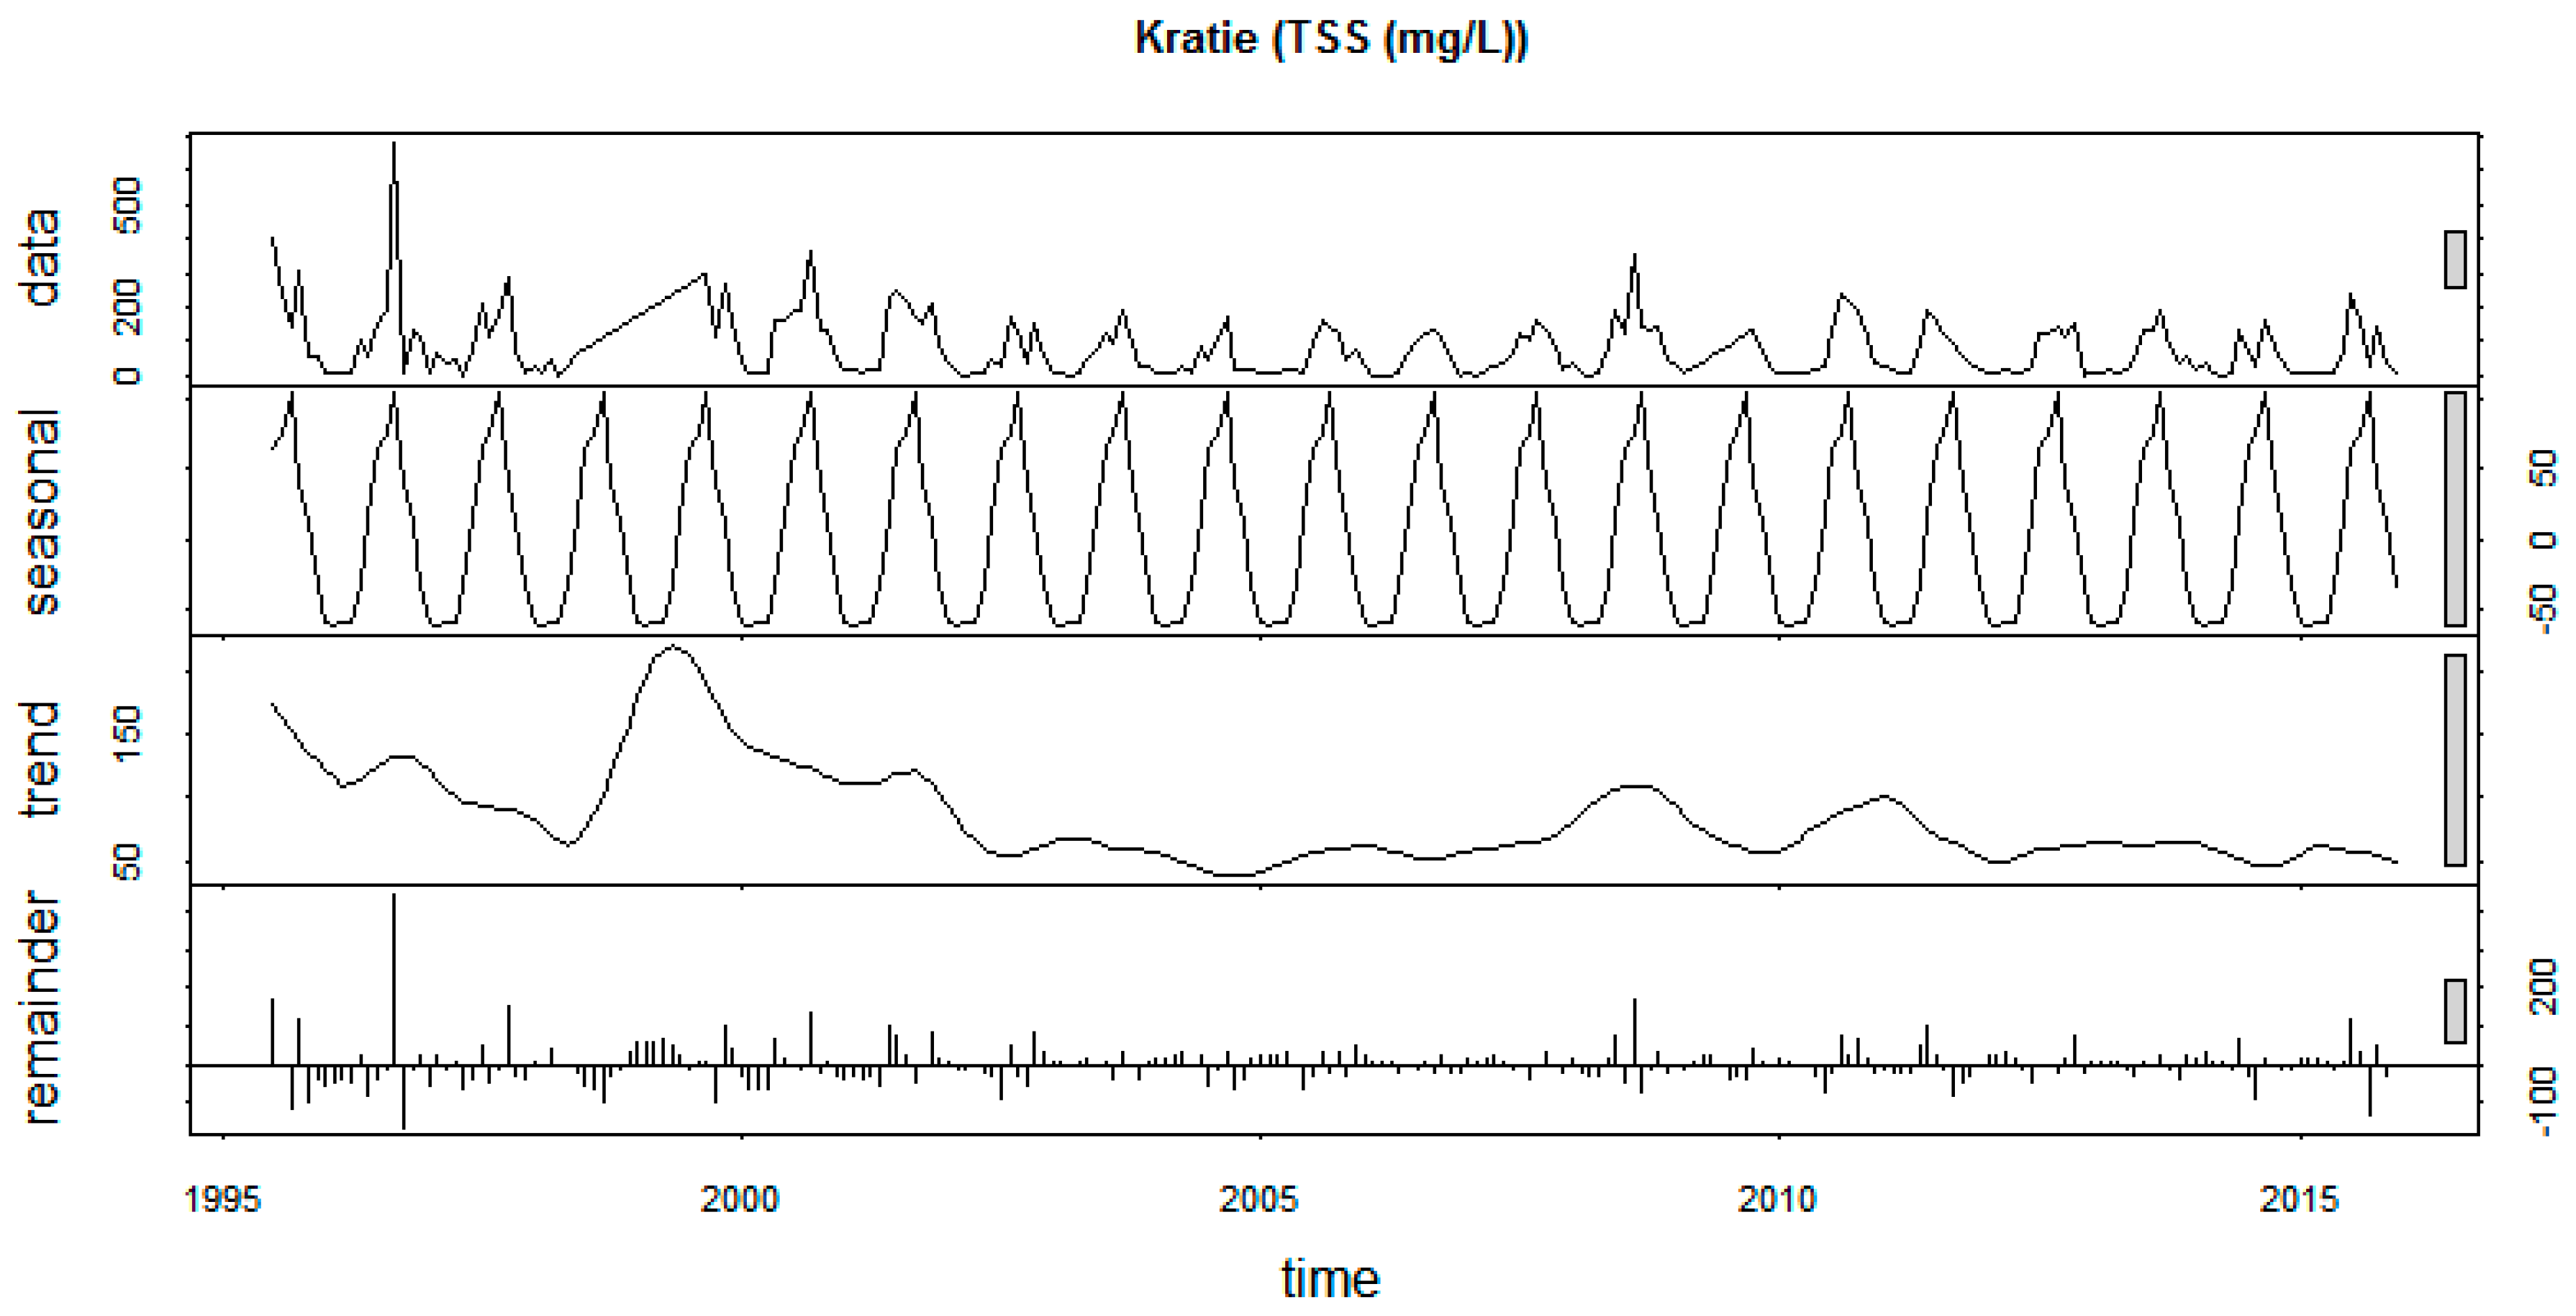
3.3. Seasonal Decomposition of Water Quality Time Series

Results of the decomposition of the water quality time series for the 14 monitoring stations are presented in Appendix D. Figure 6 and Figure 7 show results of the decomposition of TSS and nitrate time series at WCS, WLP, Kampong Cham (WKA), and WTC by the STL (Section 2.3.2). These stations represent typical characteristics of stations located in the upper and lower sections of the basin, respectively. The STL decomposition of the water quality time series shows that seasonal factors strongly influence TSS and nitrate levels in the LMR (Figure 6 and Figure 7 and Appendix D).

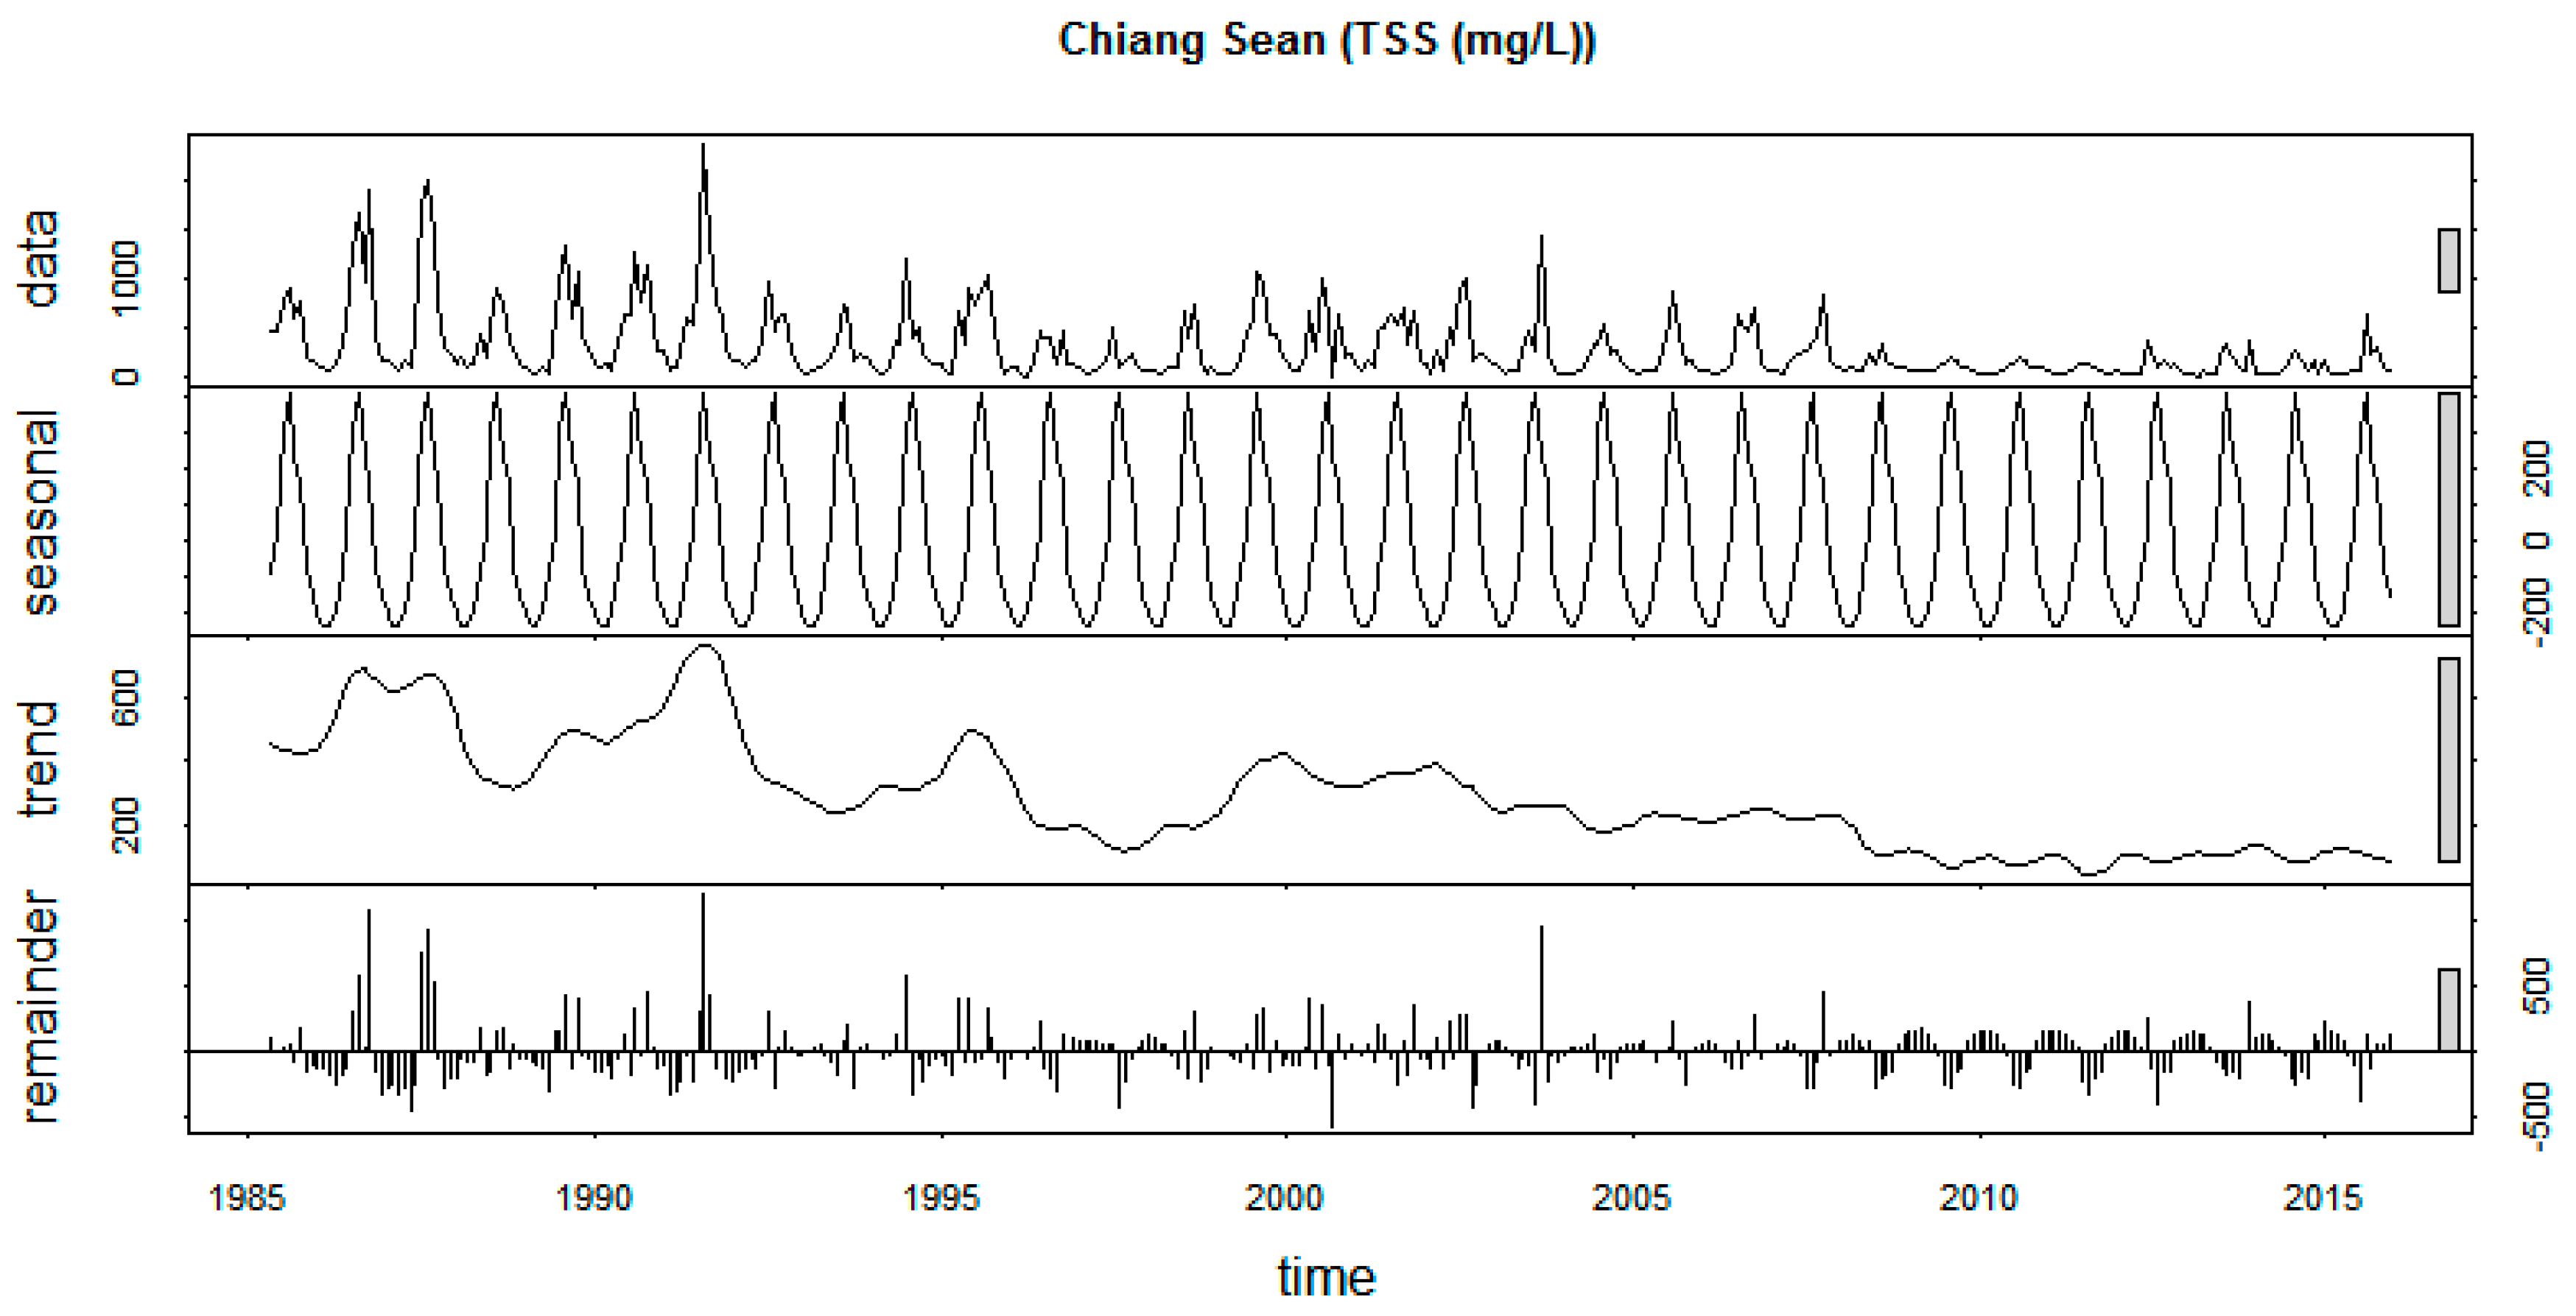
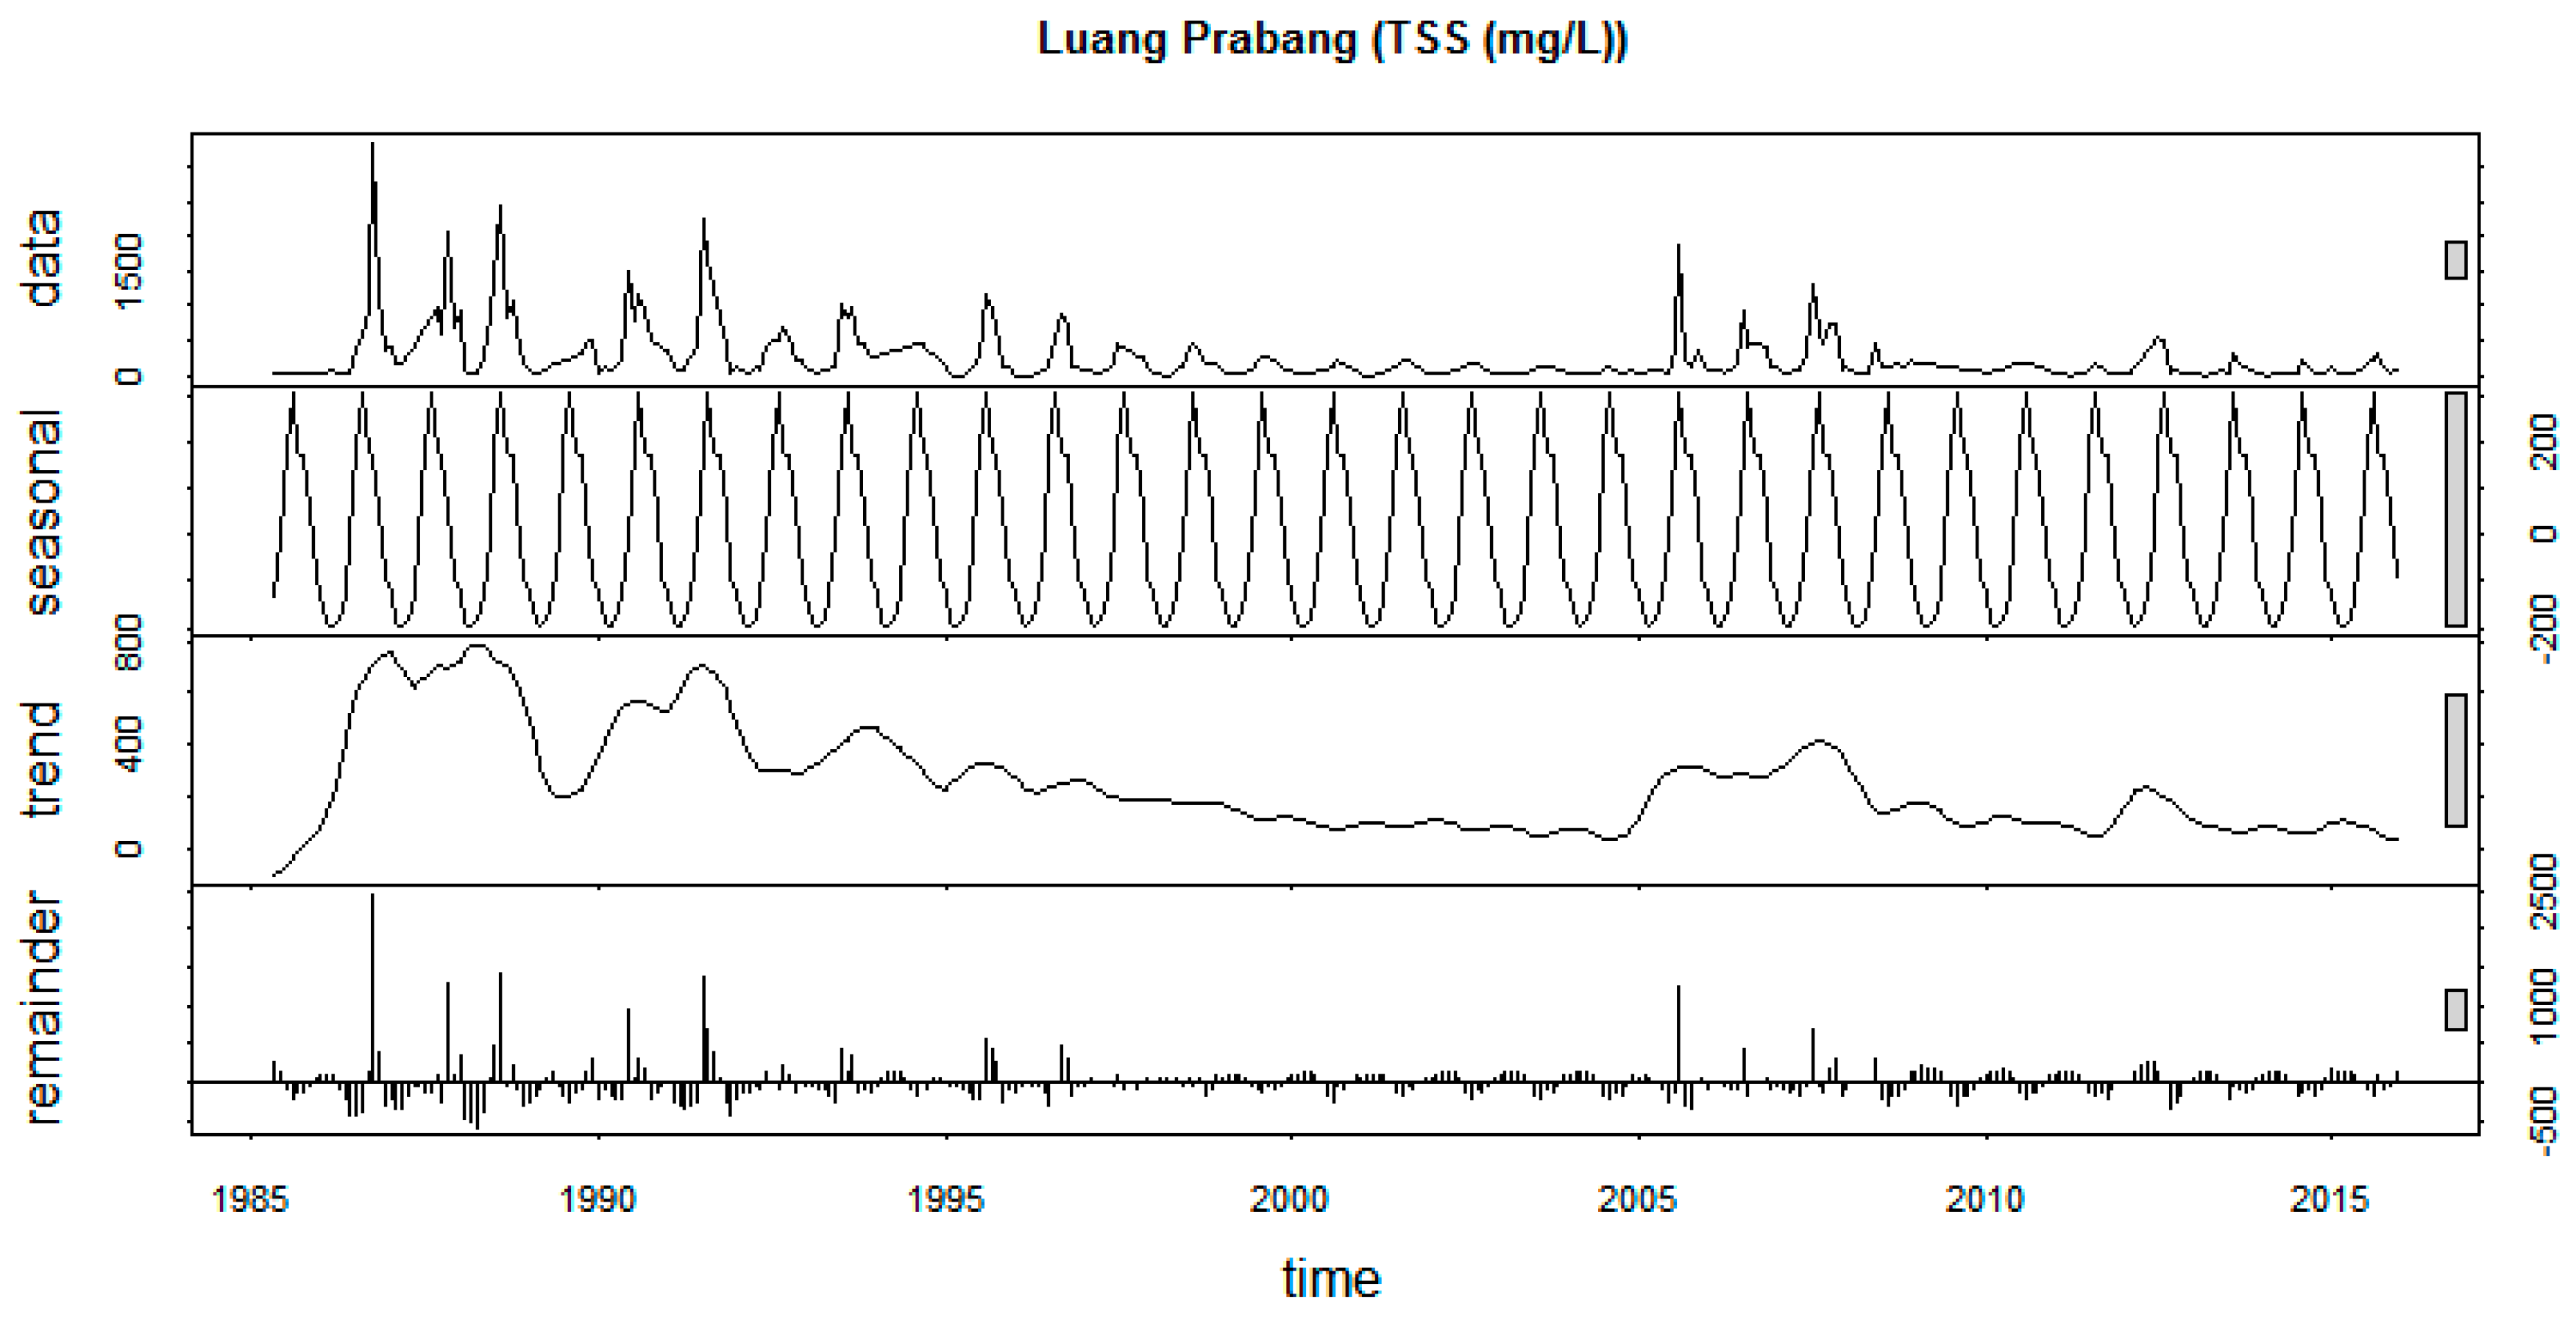
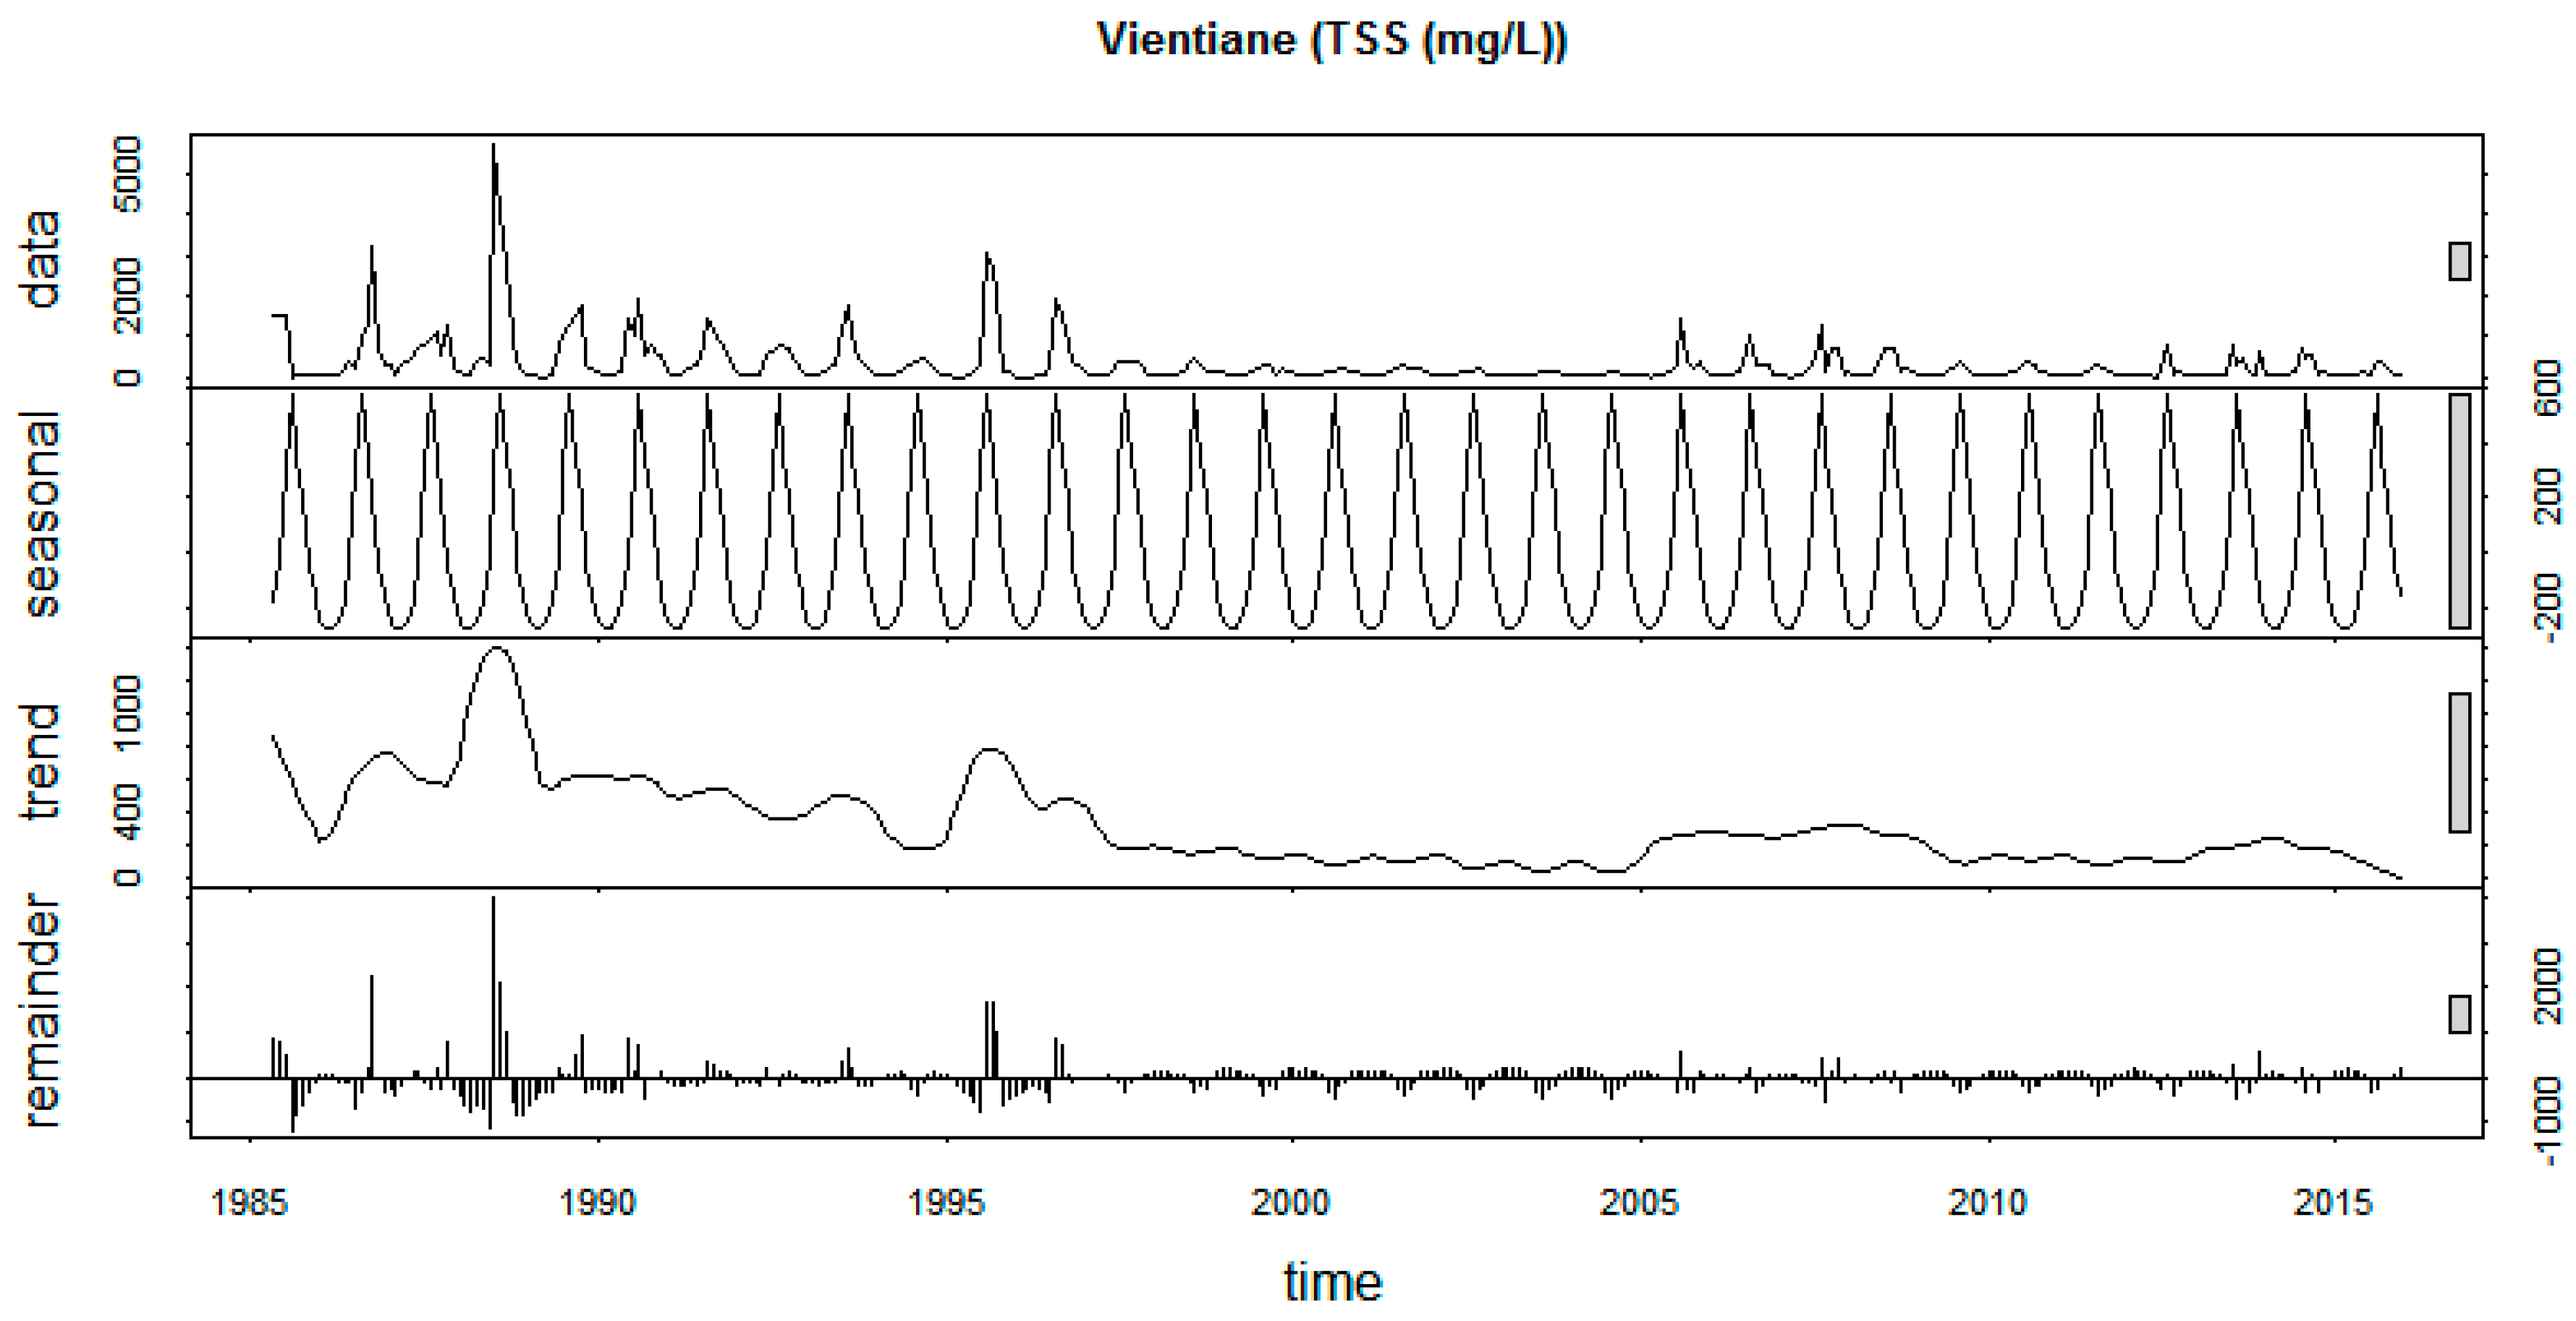
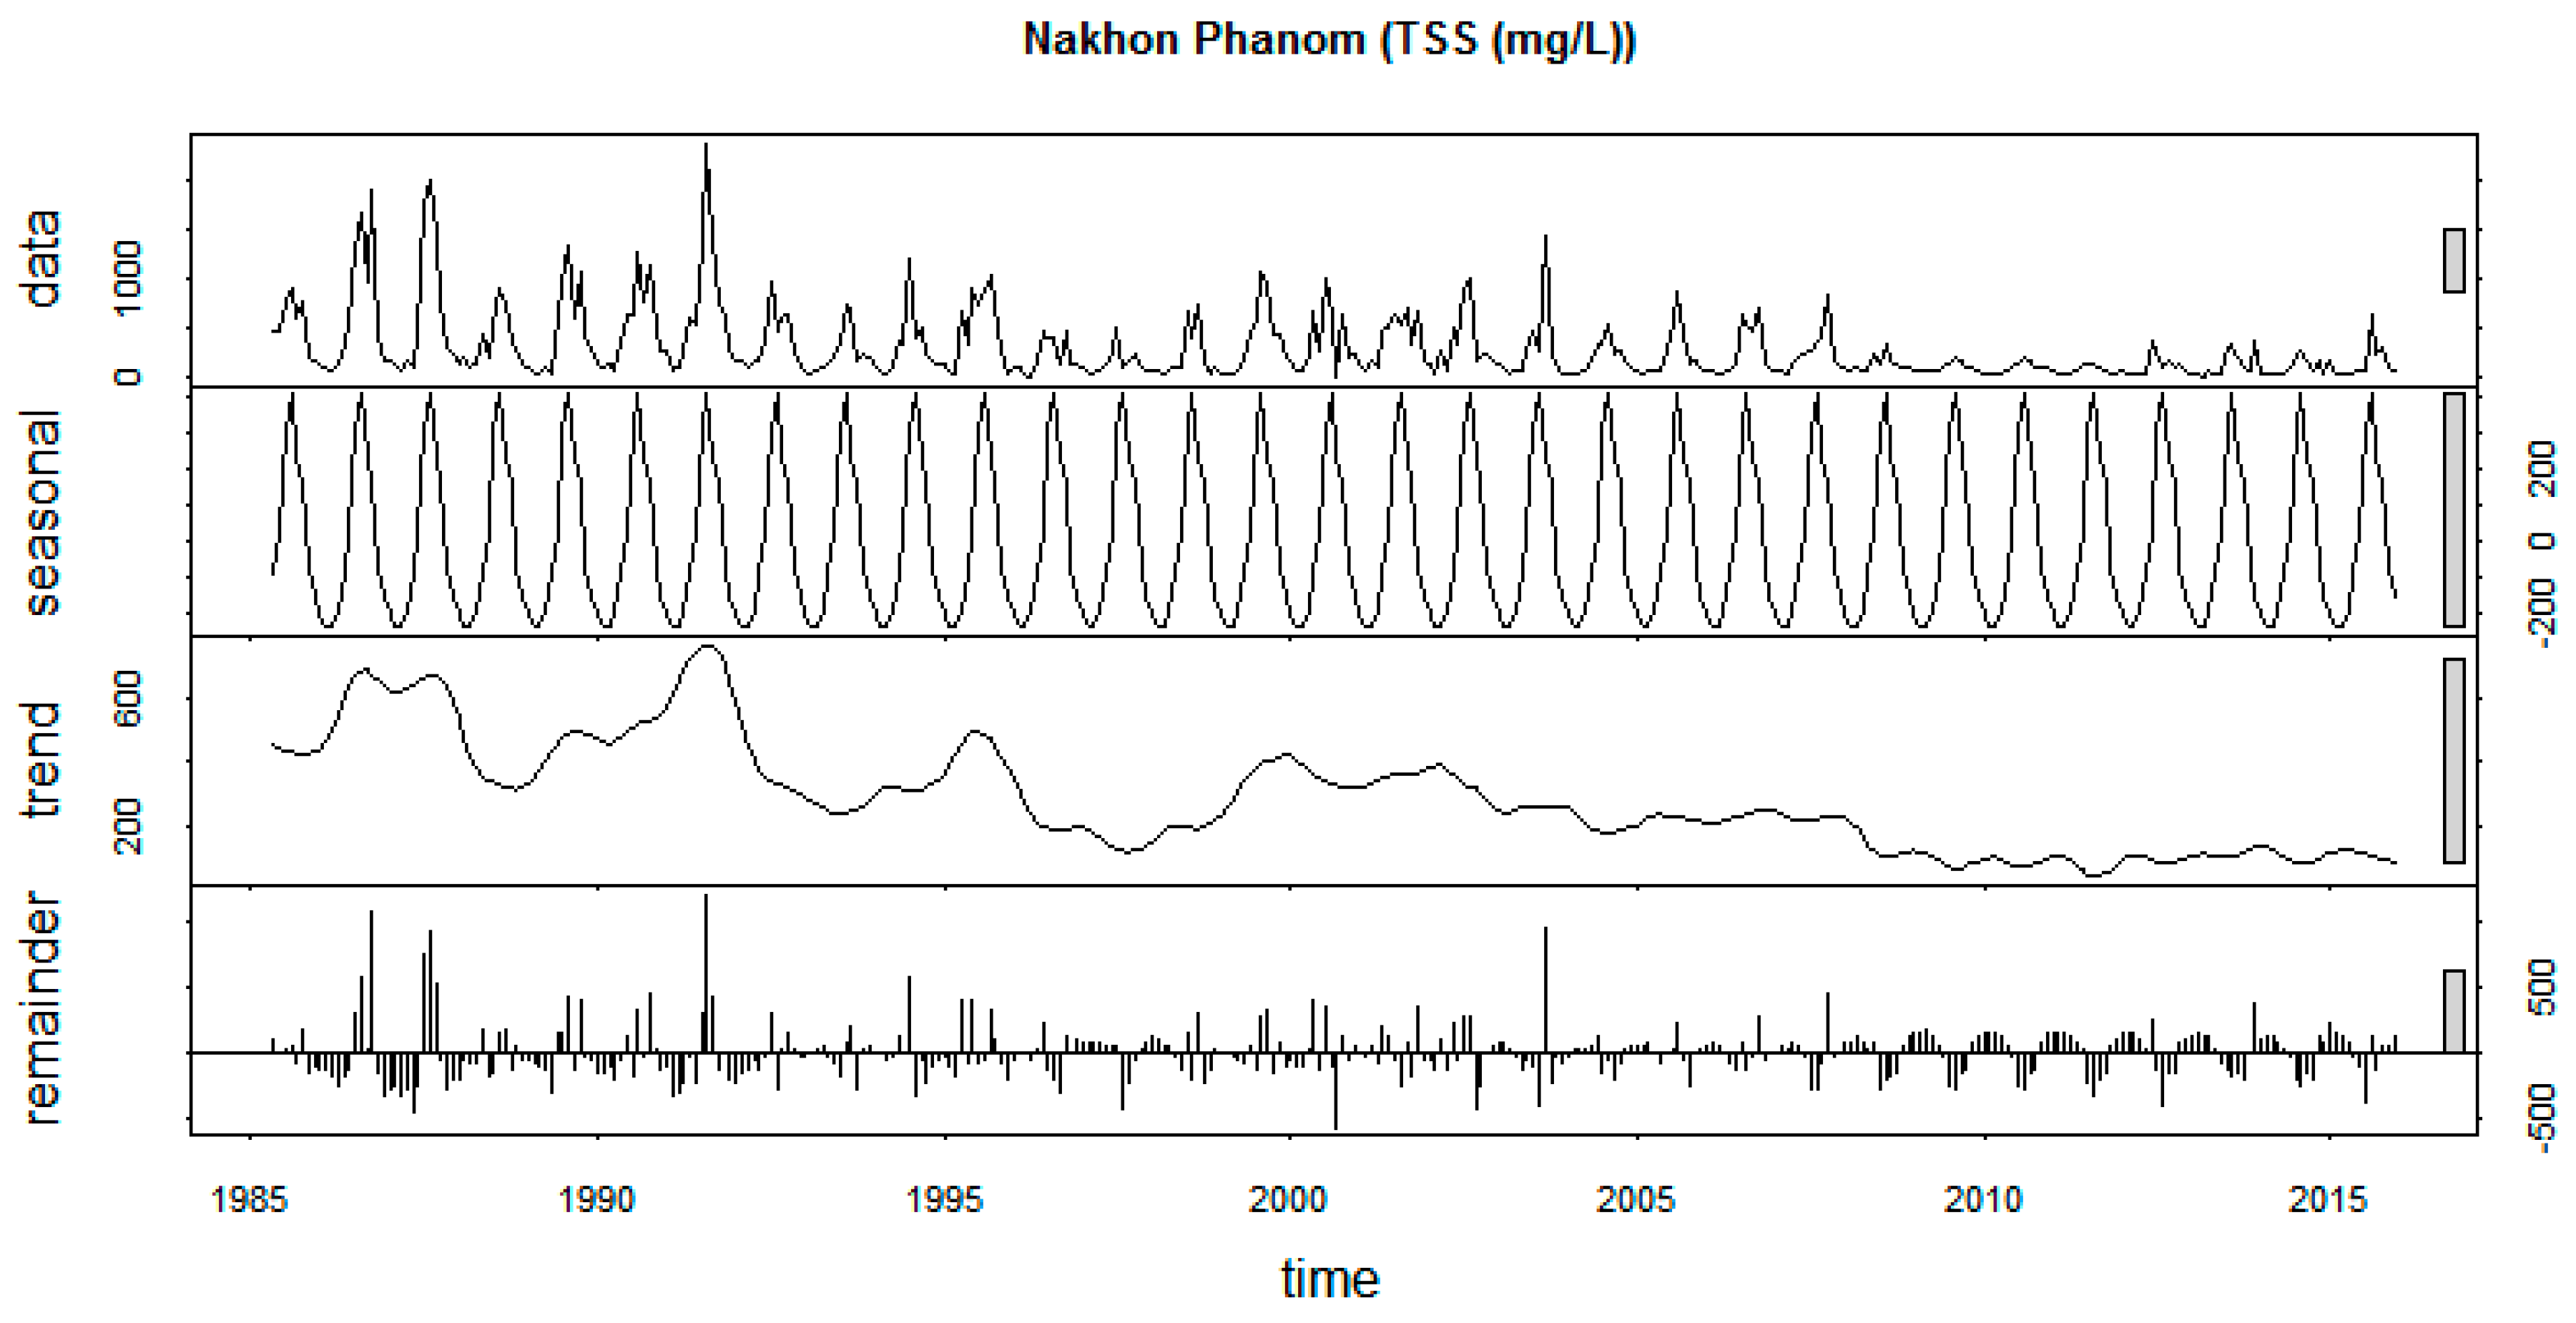
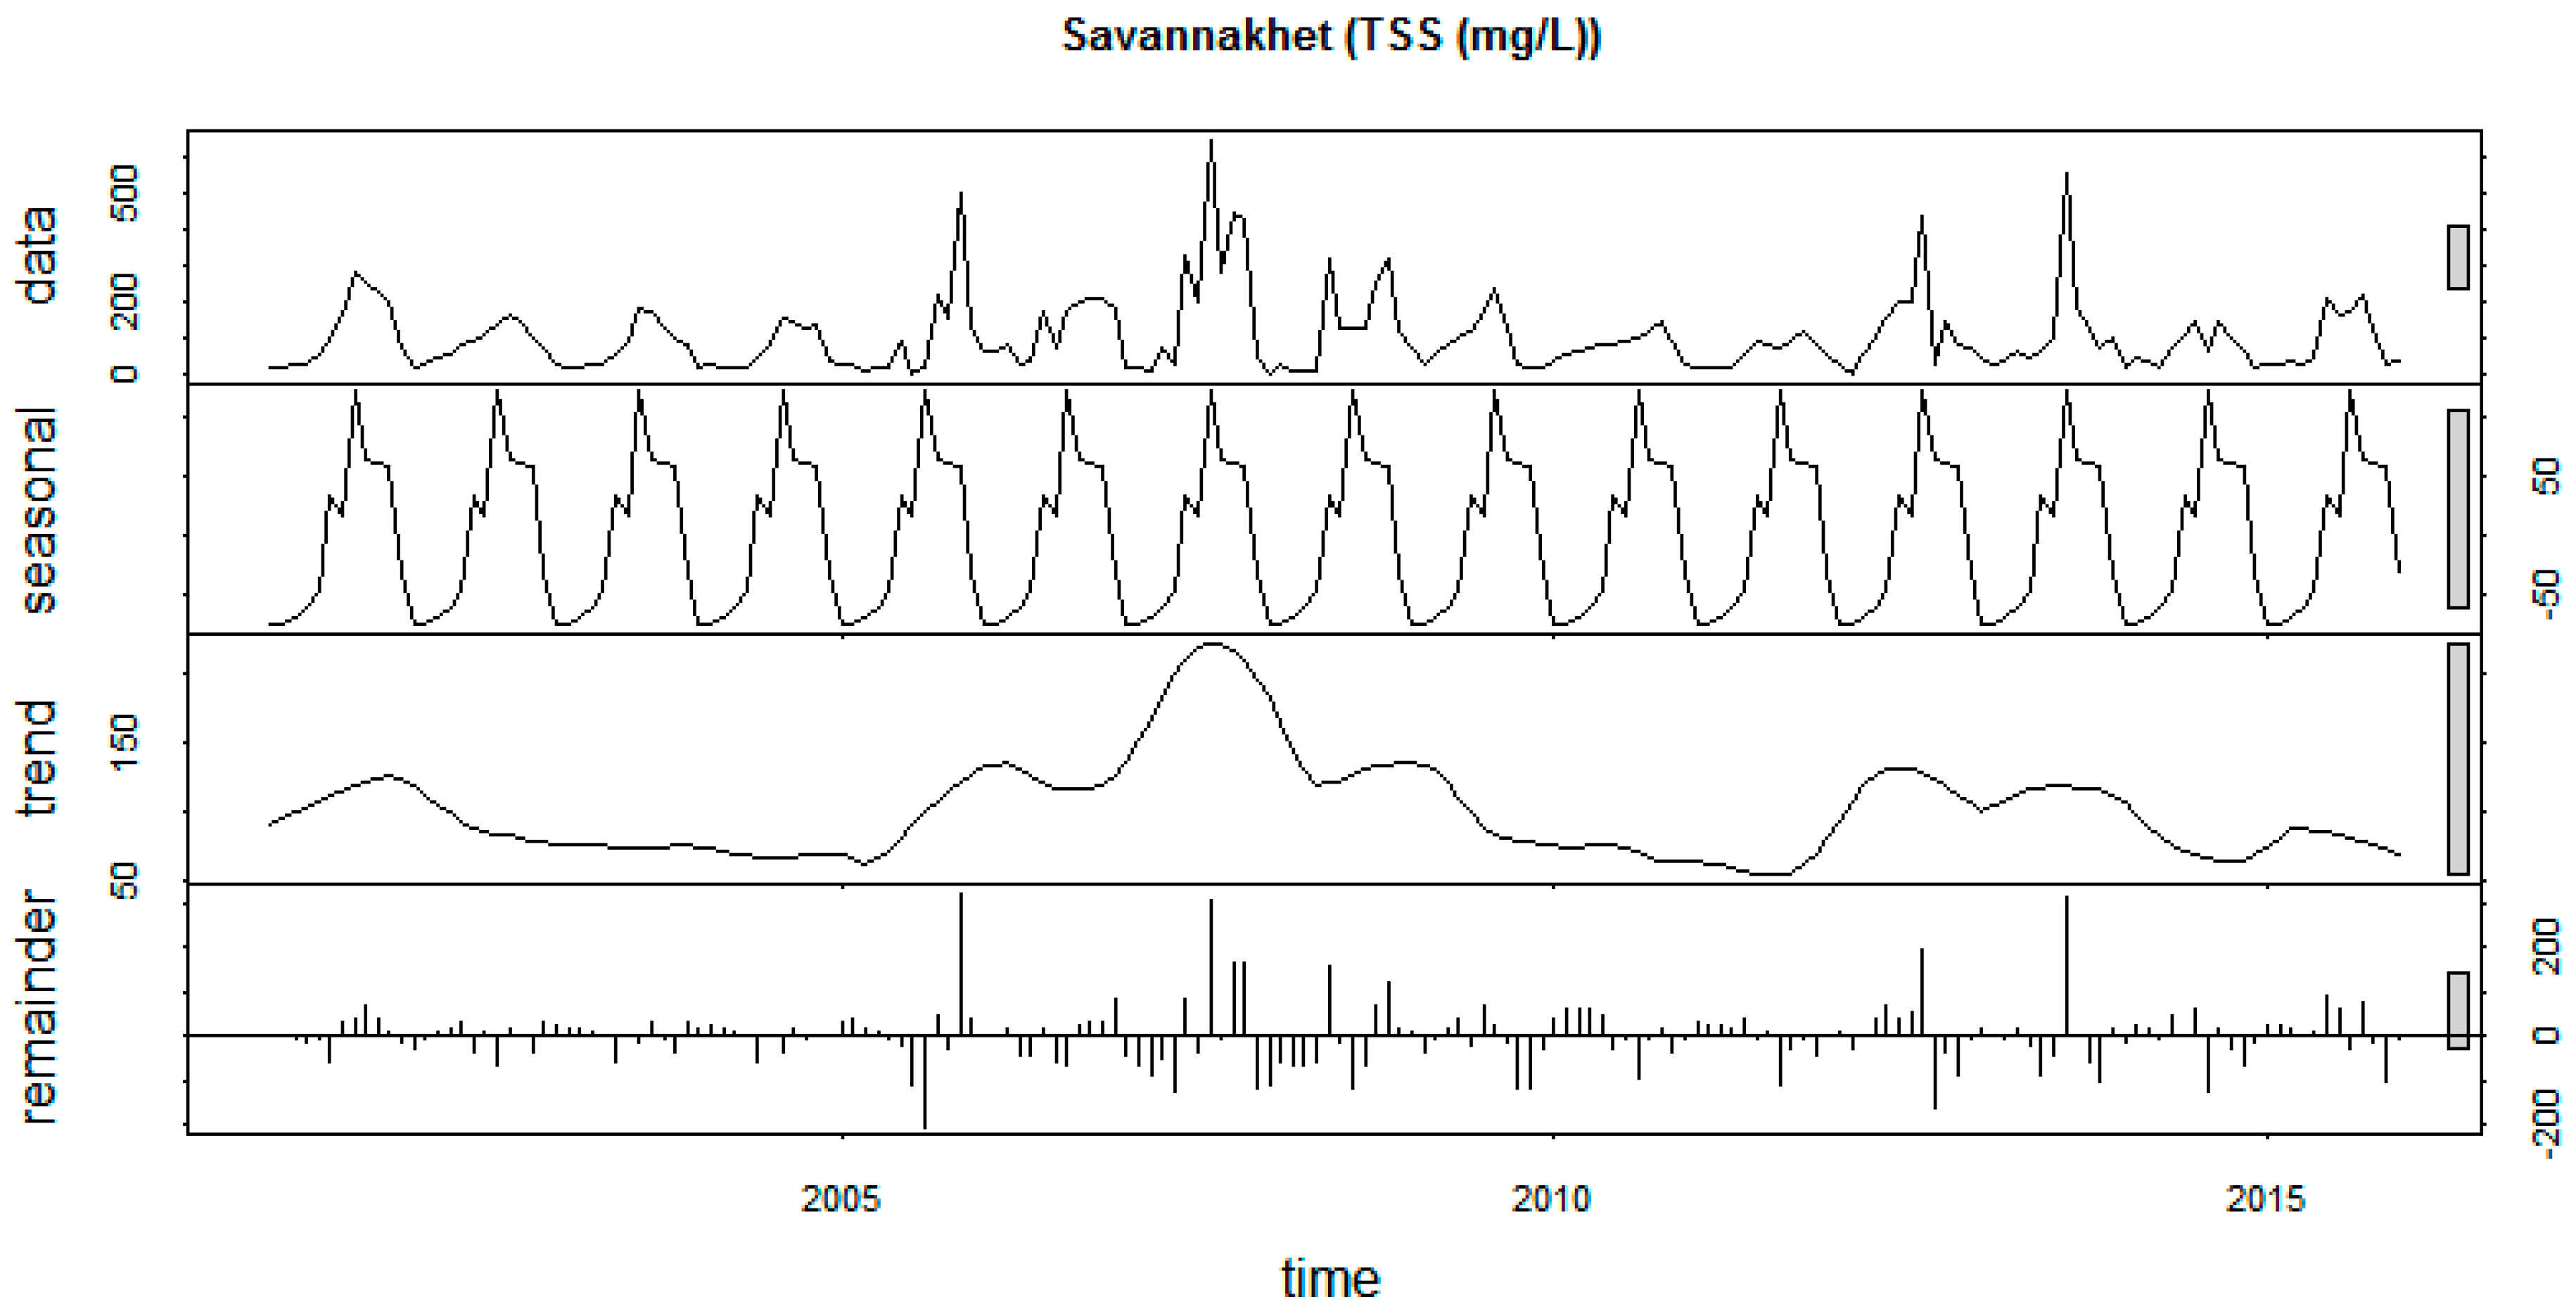
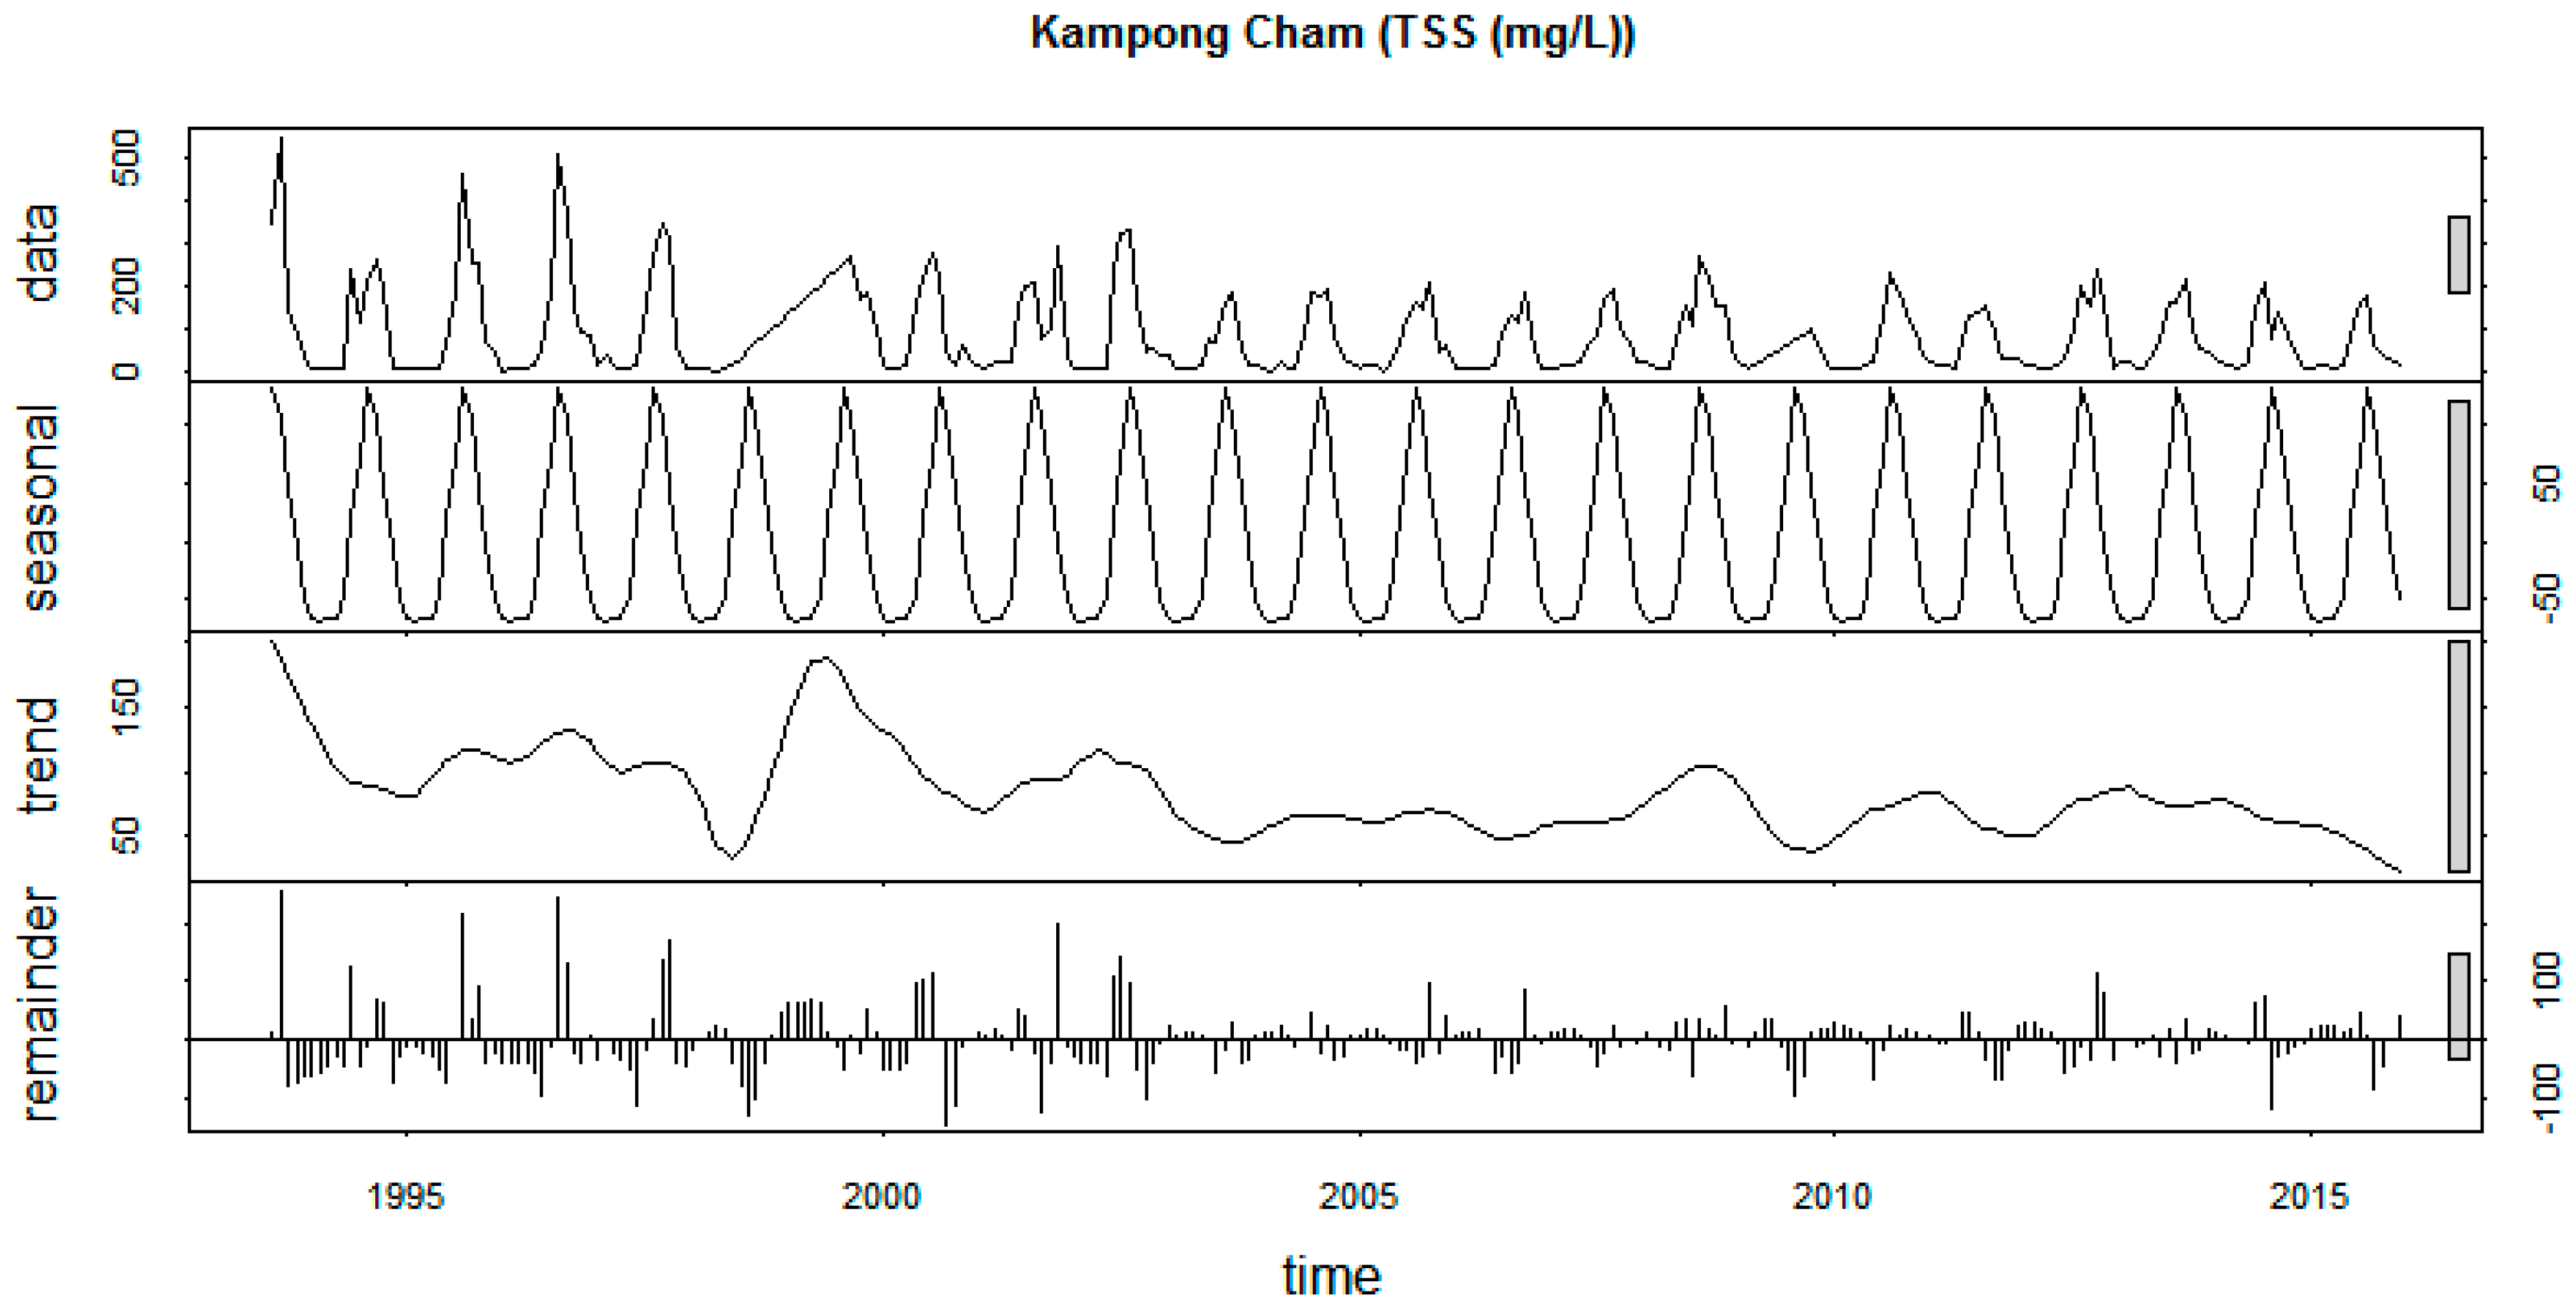
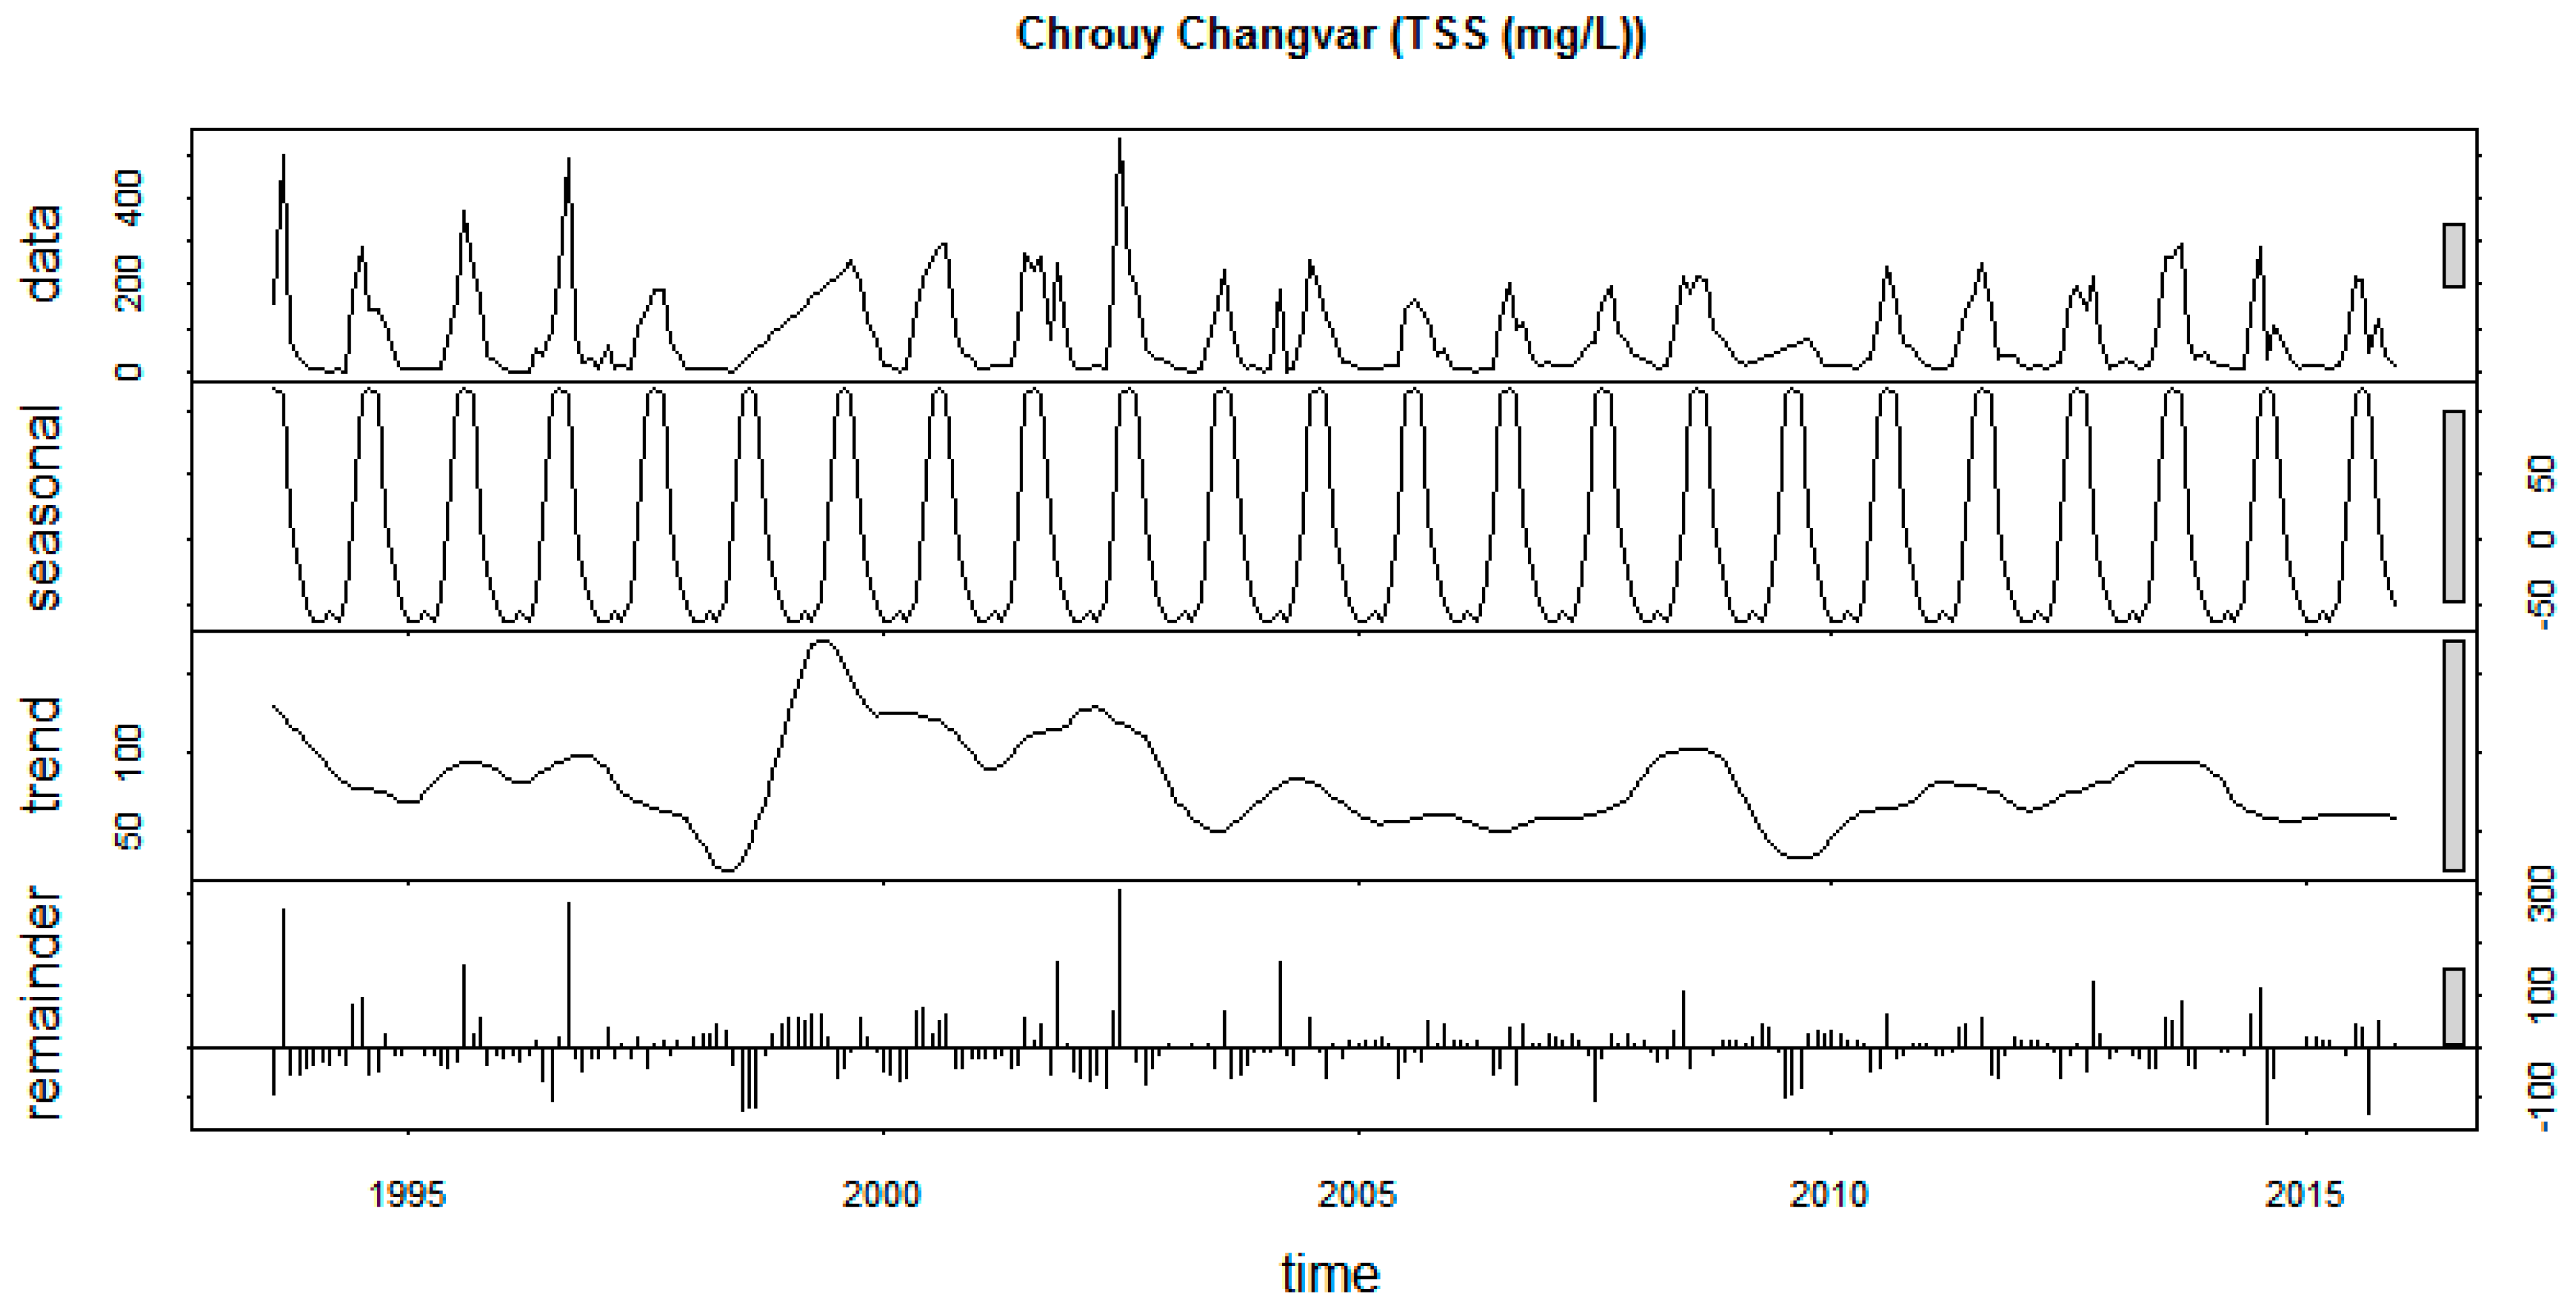
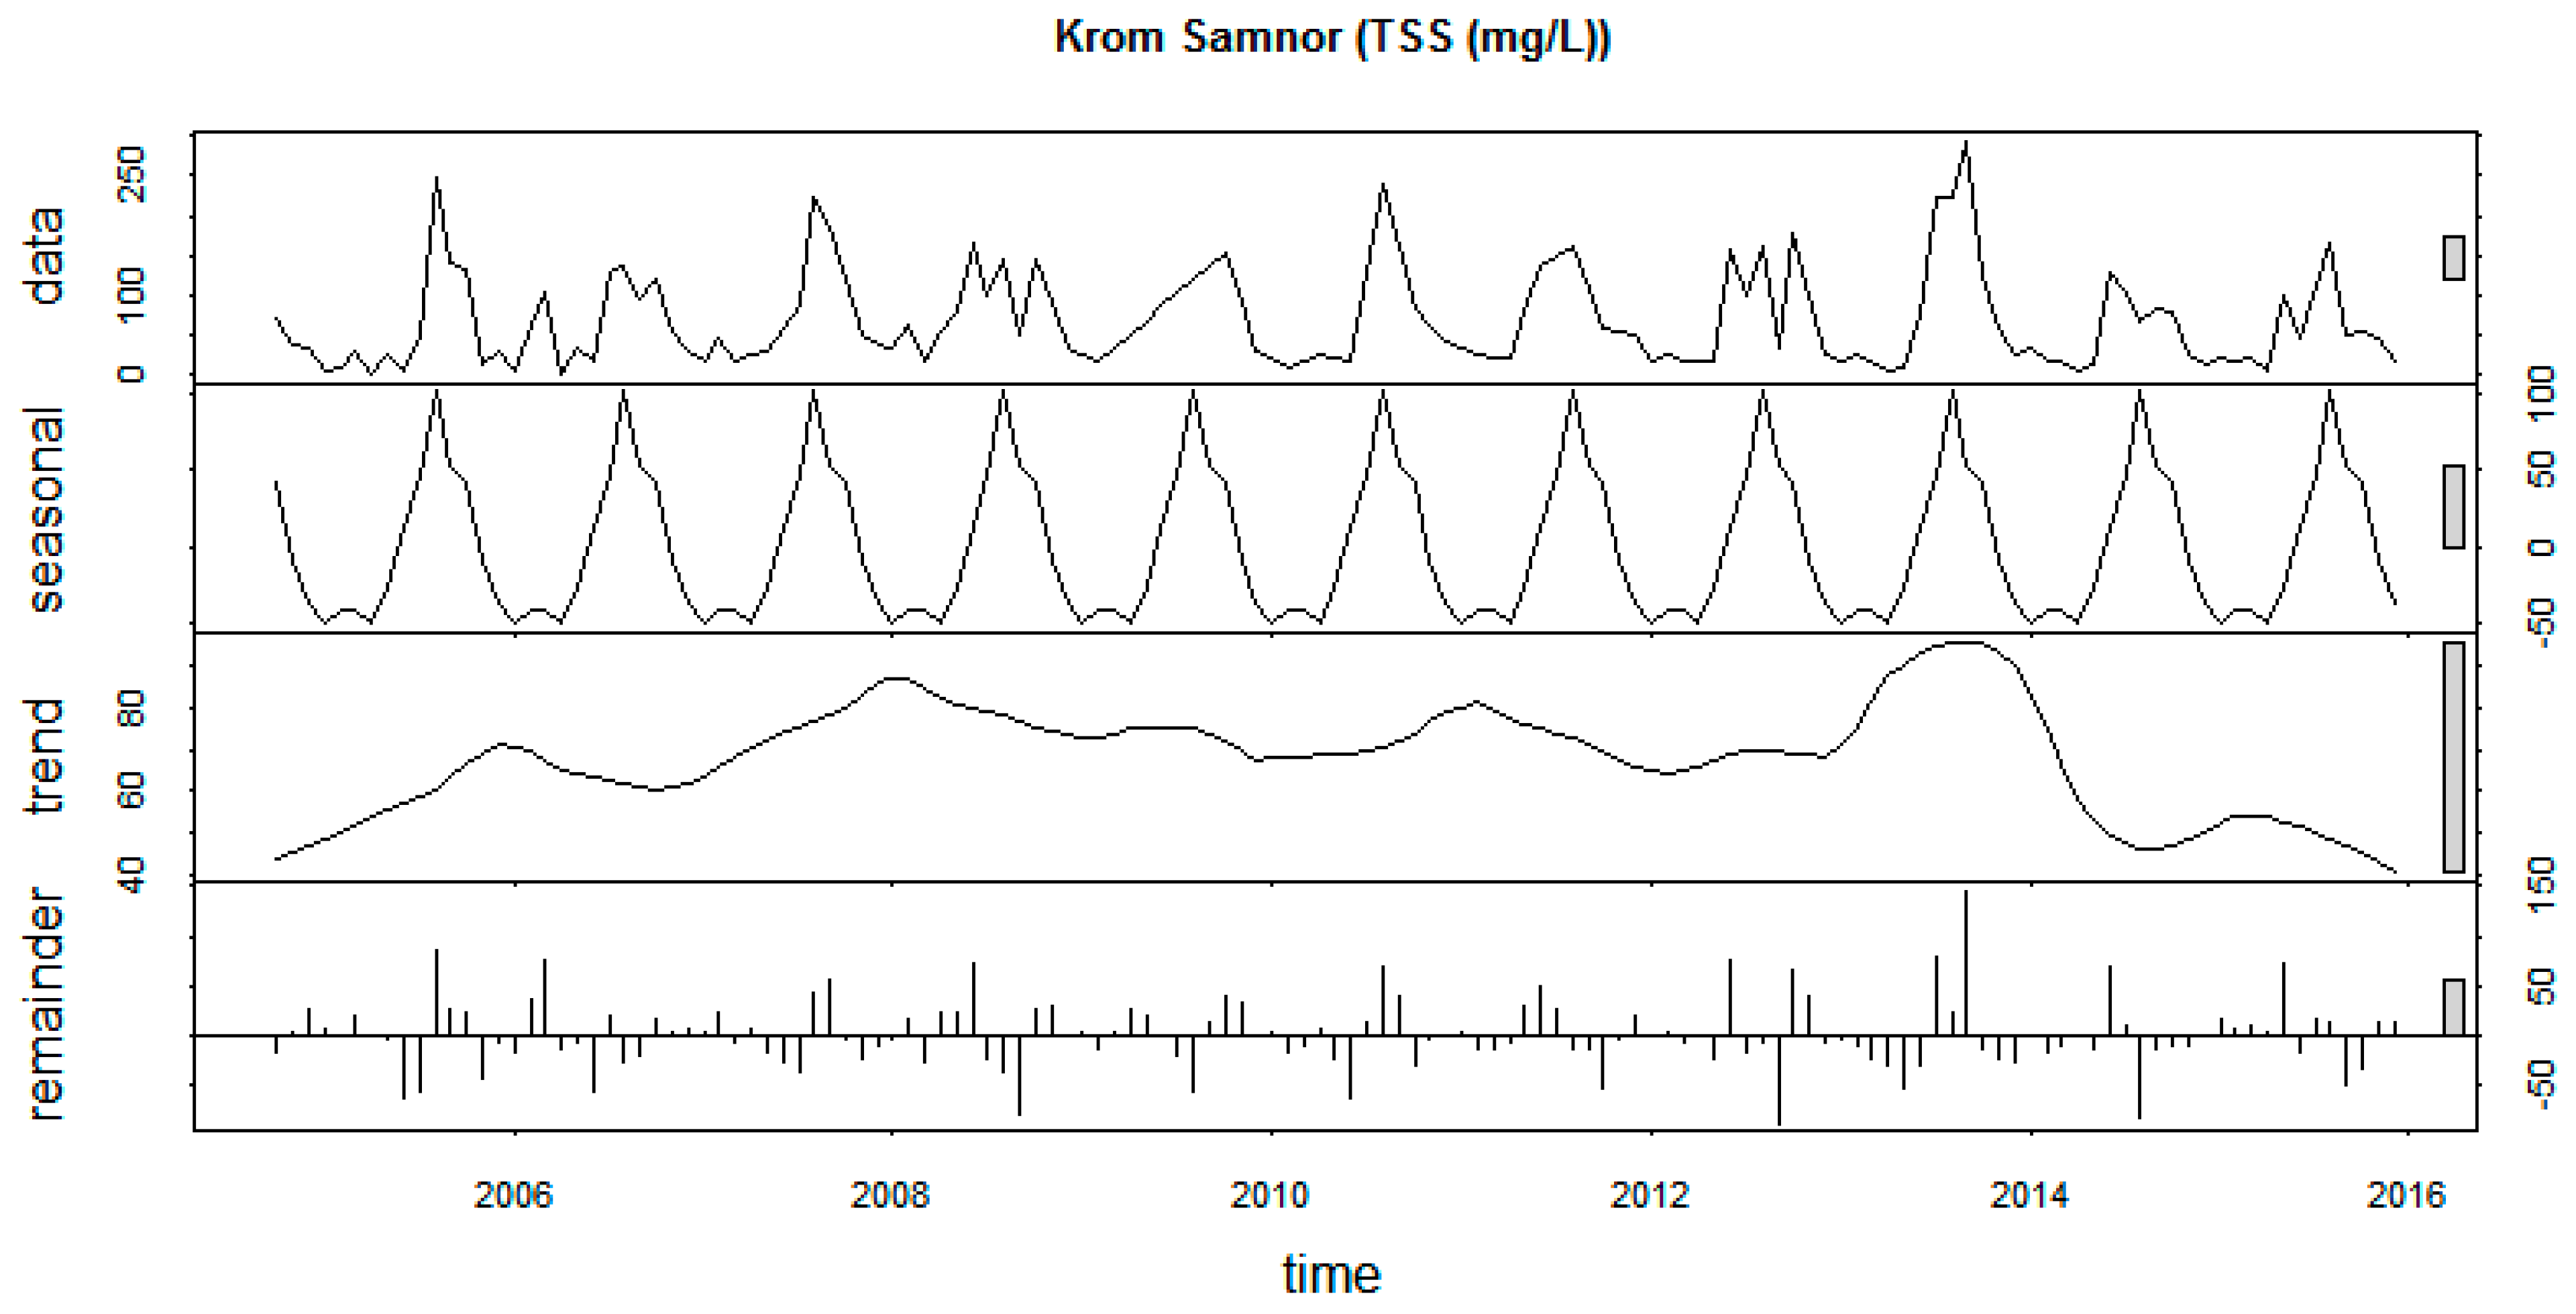
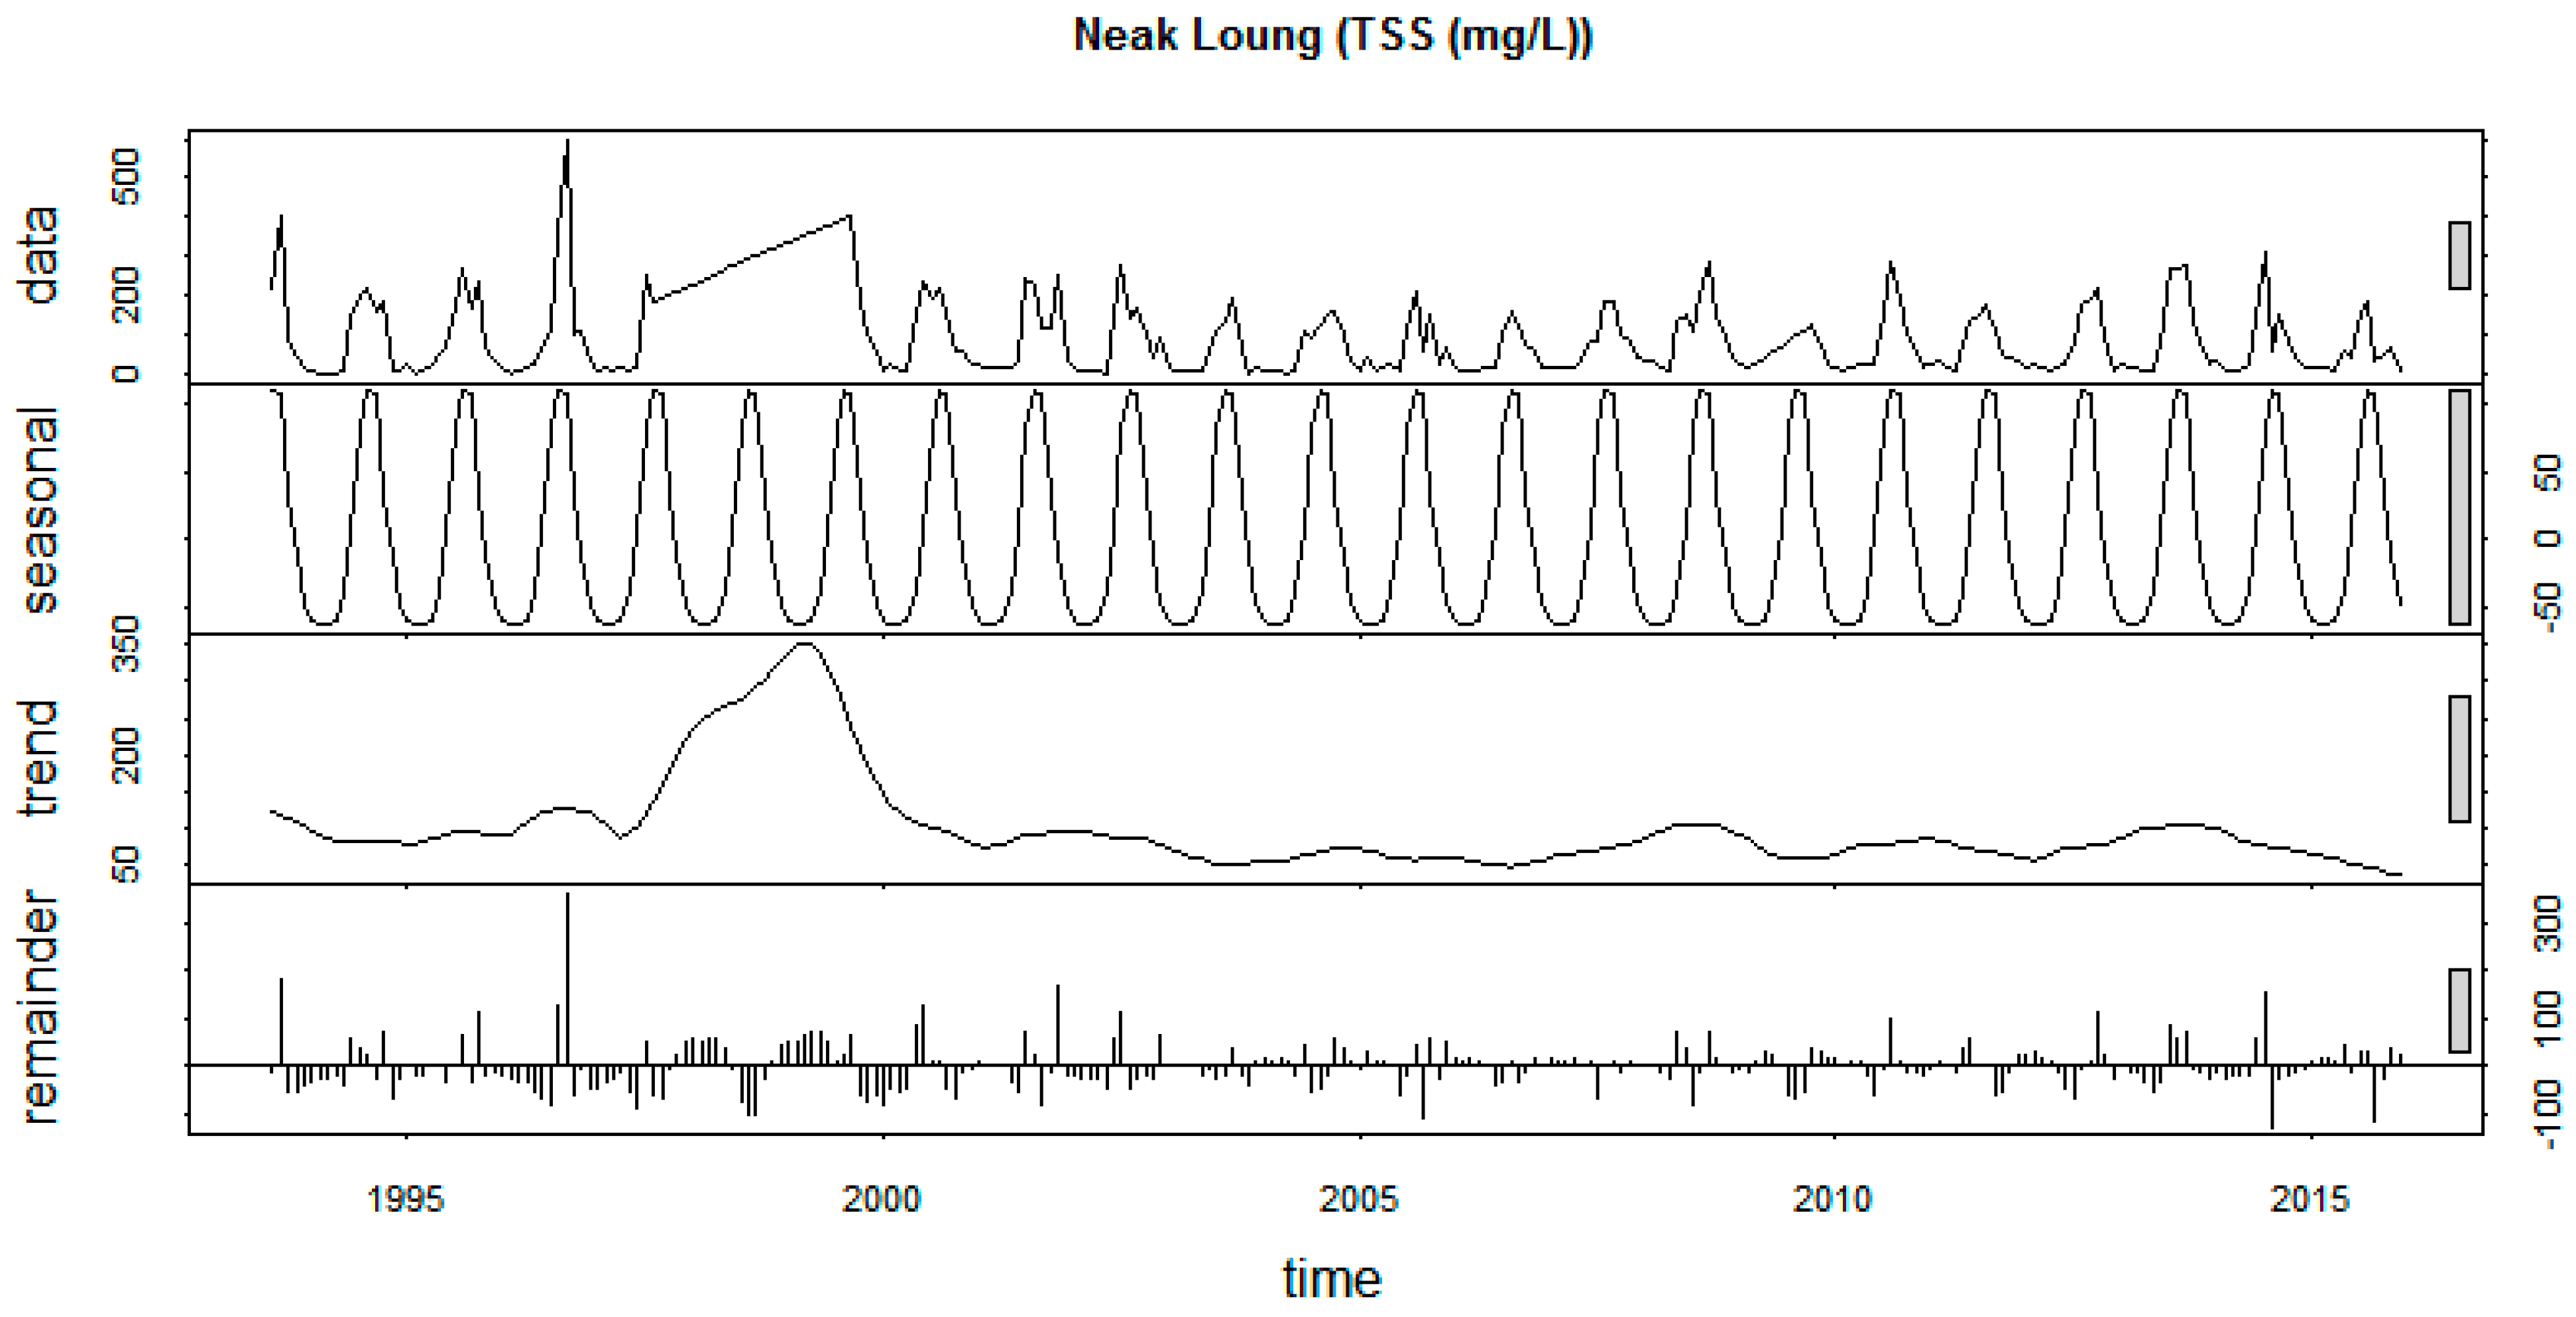
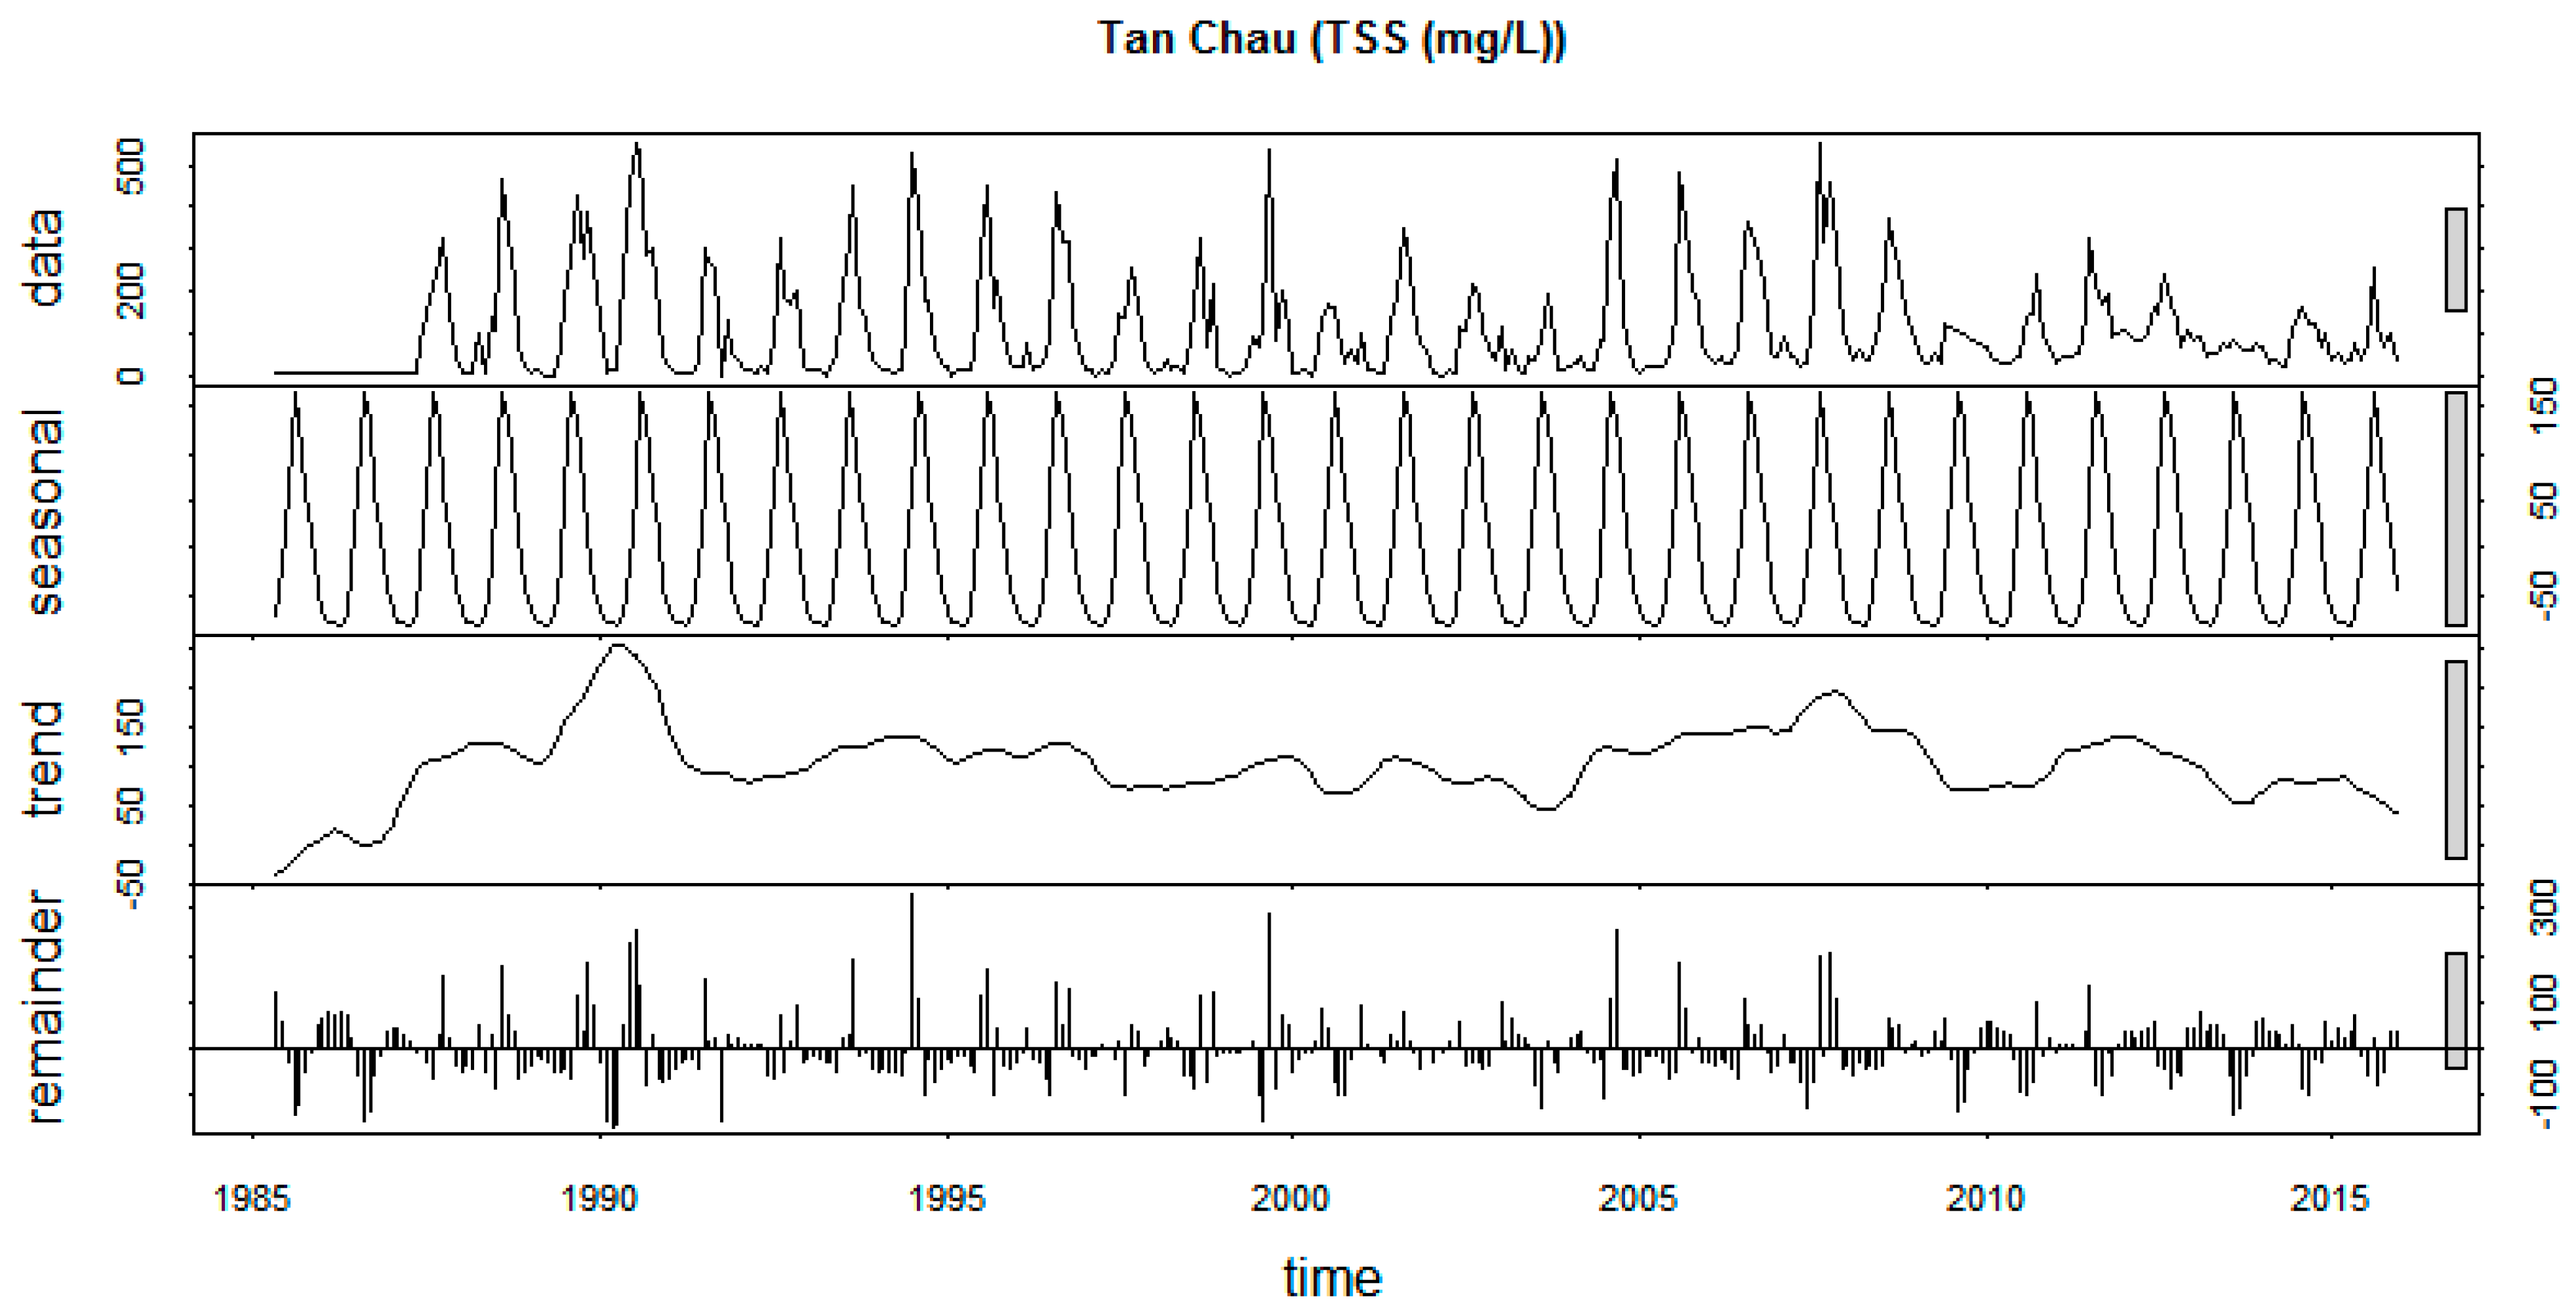
3.3.1. Seasonal Decomposition of TSS Time Series

Long-term trends of TSS levels in the upper section of the LMB (represented by WCS and WLP in Figure 6a,b) displayed decreasing patterns over the period monitored. In addition to being influenced by factors discussed in Section 3.2, a closer examination of the trend component at these stations reveals reversal patterns in their overall trends, increasing from 1985 to 1993 and reaching their highest peak during this period. These were followed by sharp decreasing patterns from 1993 to 1994, and then increasing again from 1994 to 1995, before gradually decreasing to the level observed in 2015. The patterns appear to coincide with the completion and operation periods of the Manwan Dam, located in the LR (Figure 1a). Since 1993, TSS levels recorded at stations located in the upper section of the river have been less variable, with the mean annual concentration at WCS reduced by over 300%. The reduction appears to have been influenced by factors independent from those operating on seasonal time scales. More to the point, studies have shown that damming of the LR has decreased sediment transport through the river, and that the decline in sediment concentrations at stations located in the LMR occurred following the Manwan Dam development in 1993 [22,25,28]. Since it became operational, approximately 60% of TSS originating in the Upper Mekong Basin (UMB) were lost due to sediment trapping [60]. A recent study by [25] found that the Manwan Dam lost approximately 17% of its storage capacity (10.6 × 10⁸ cubic meters) between 1993 and 2009. In addition, this same study reported a reduction in suspended sediment loads of about 83%, 50%, and 43% in the upper, middle, and lower parts of the LMR following the construction of the Xiaowan Dam [25].
In the lower section of the basin, where the topography is flatter (Figure 1b), TSS levels were less variable (Table 2). Visual examination of temporal trends at these stations did not show obvious patterns, though a number of patterns of reversal are observed throughout the trend component of the STL, as shown in Figure 6c,d for WKA and WTC, respectively. Since the time series data for WKA and all stations located in Cambodia started in 1995, it is unclear whether the completion of the Manwan Dam affected TSS levels in this section.
The seasonal component of the STL in all stations shows a cyclic pattern of sinusoidal behavior, which confirms the seasonality of their time series. Furthermore, temporal patterns of TSS and nitrate times series of all 14 stations followed those of discharge, exhibiting rising and falling concentration levels. Figure 8a–d provide examples of the cyclic variation obtained from the analysis of discharge, TSS, and nitrate time series at FNP/WNP (flow/water quality stations in the upper section) and FST/WST (flow/water quality stations in the lower section). Pearson’s correlation analysis of the three water quality and quantity indicators (TSS, nitrate, and flow) revealed strong relationships. In particular, the results of the analysis suggest that flow was a dominant factor influencing instream TSS and nitrate concentration levels. Positive correlations between discharge and TSS and nitrate levels (r = 0.79, p < 0.01 and r = 0.74, p < 0.01, respectively) were obtained at WNP (Figure 8a,b). Similar relationships were also obtained further downstream at WST, with strong correlation values for both TSS and nitrate in relation to discharge (Figure 8c,d). These relationships further confirm the seasonality of the two water quality indicators, particularly when considering the two distinct seasons (Wet and Dry seasons) of the region and the annual rising and falling periods of the Mekong water levels.

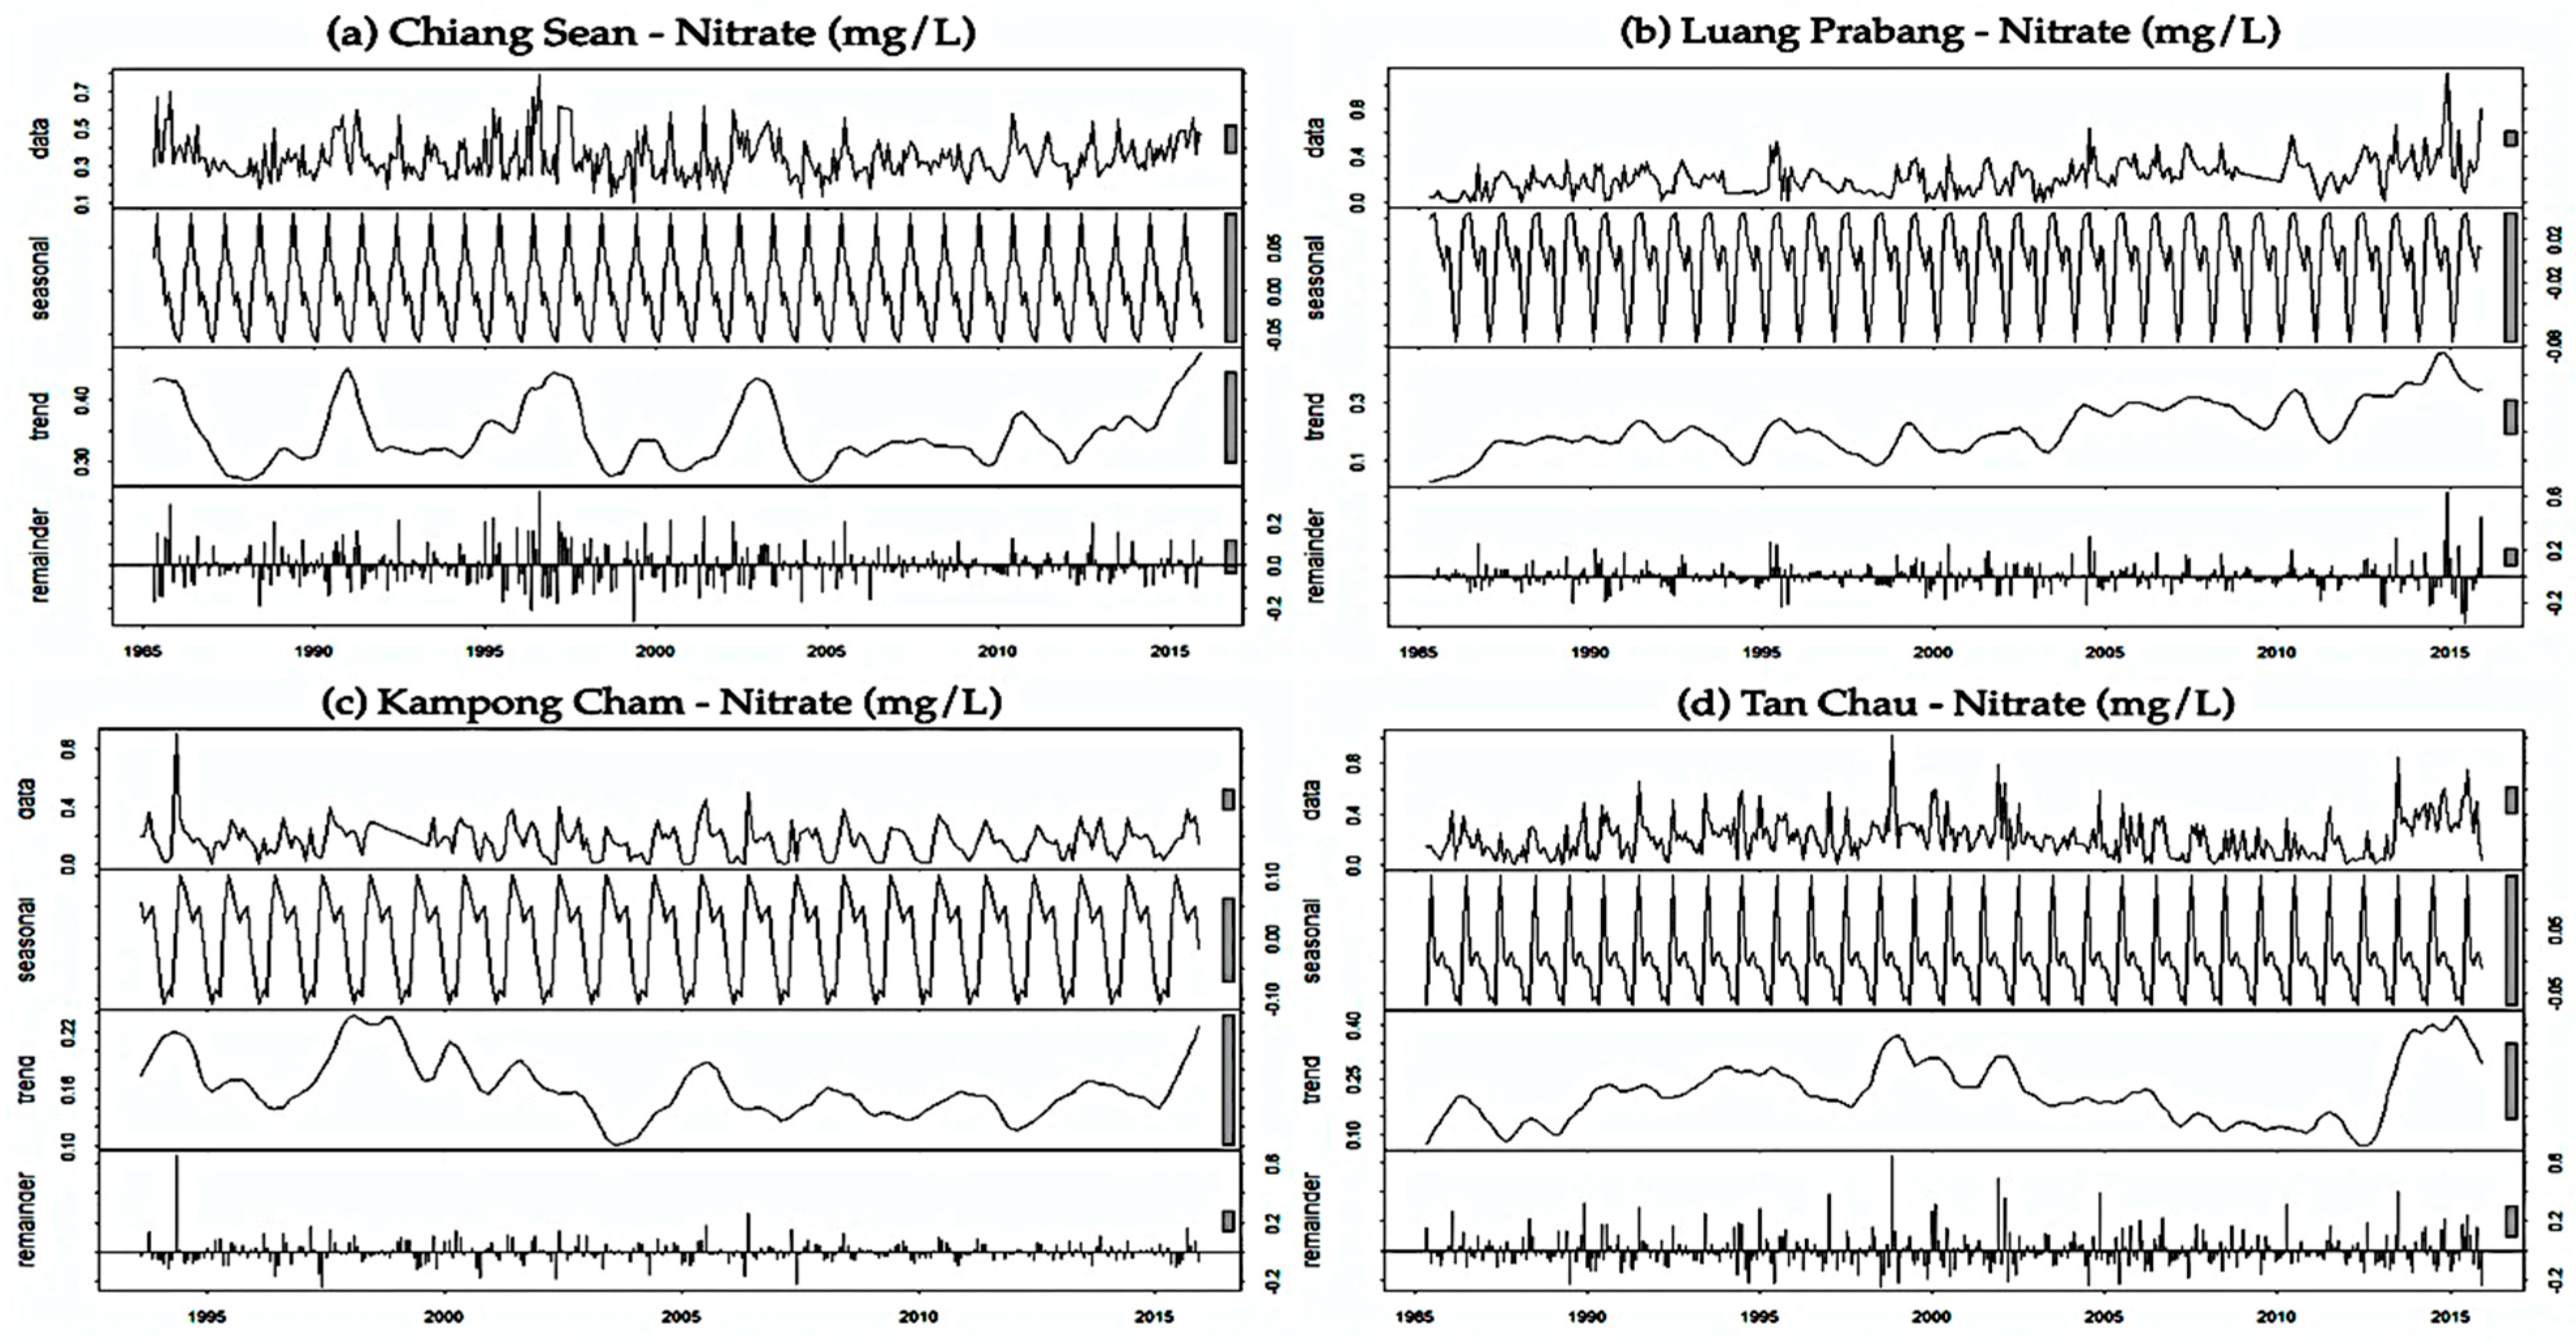
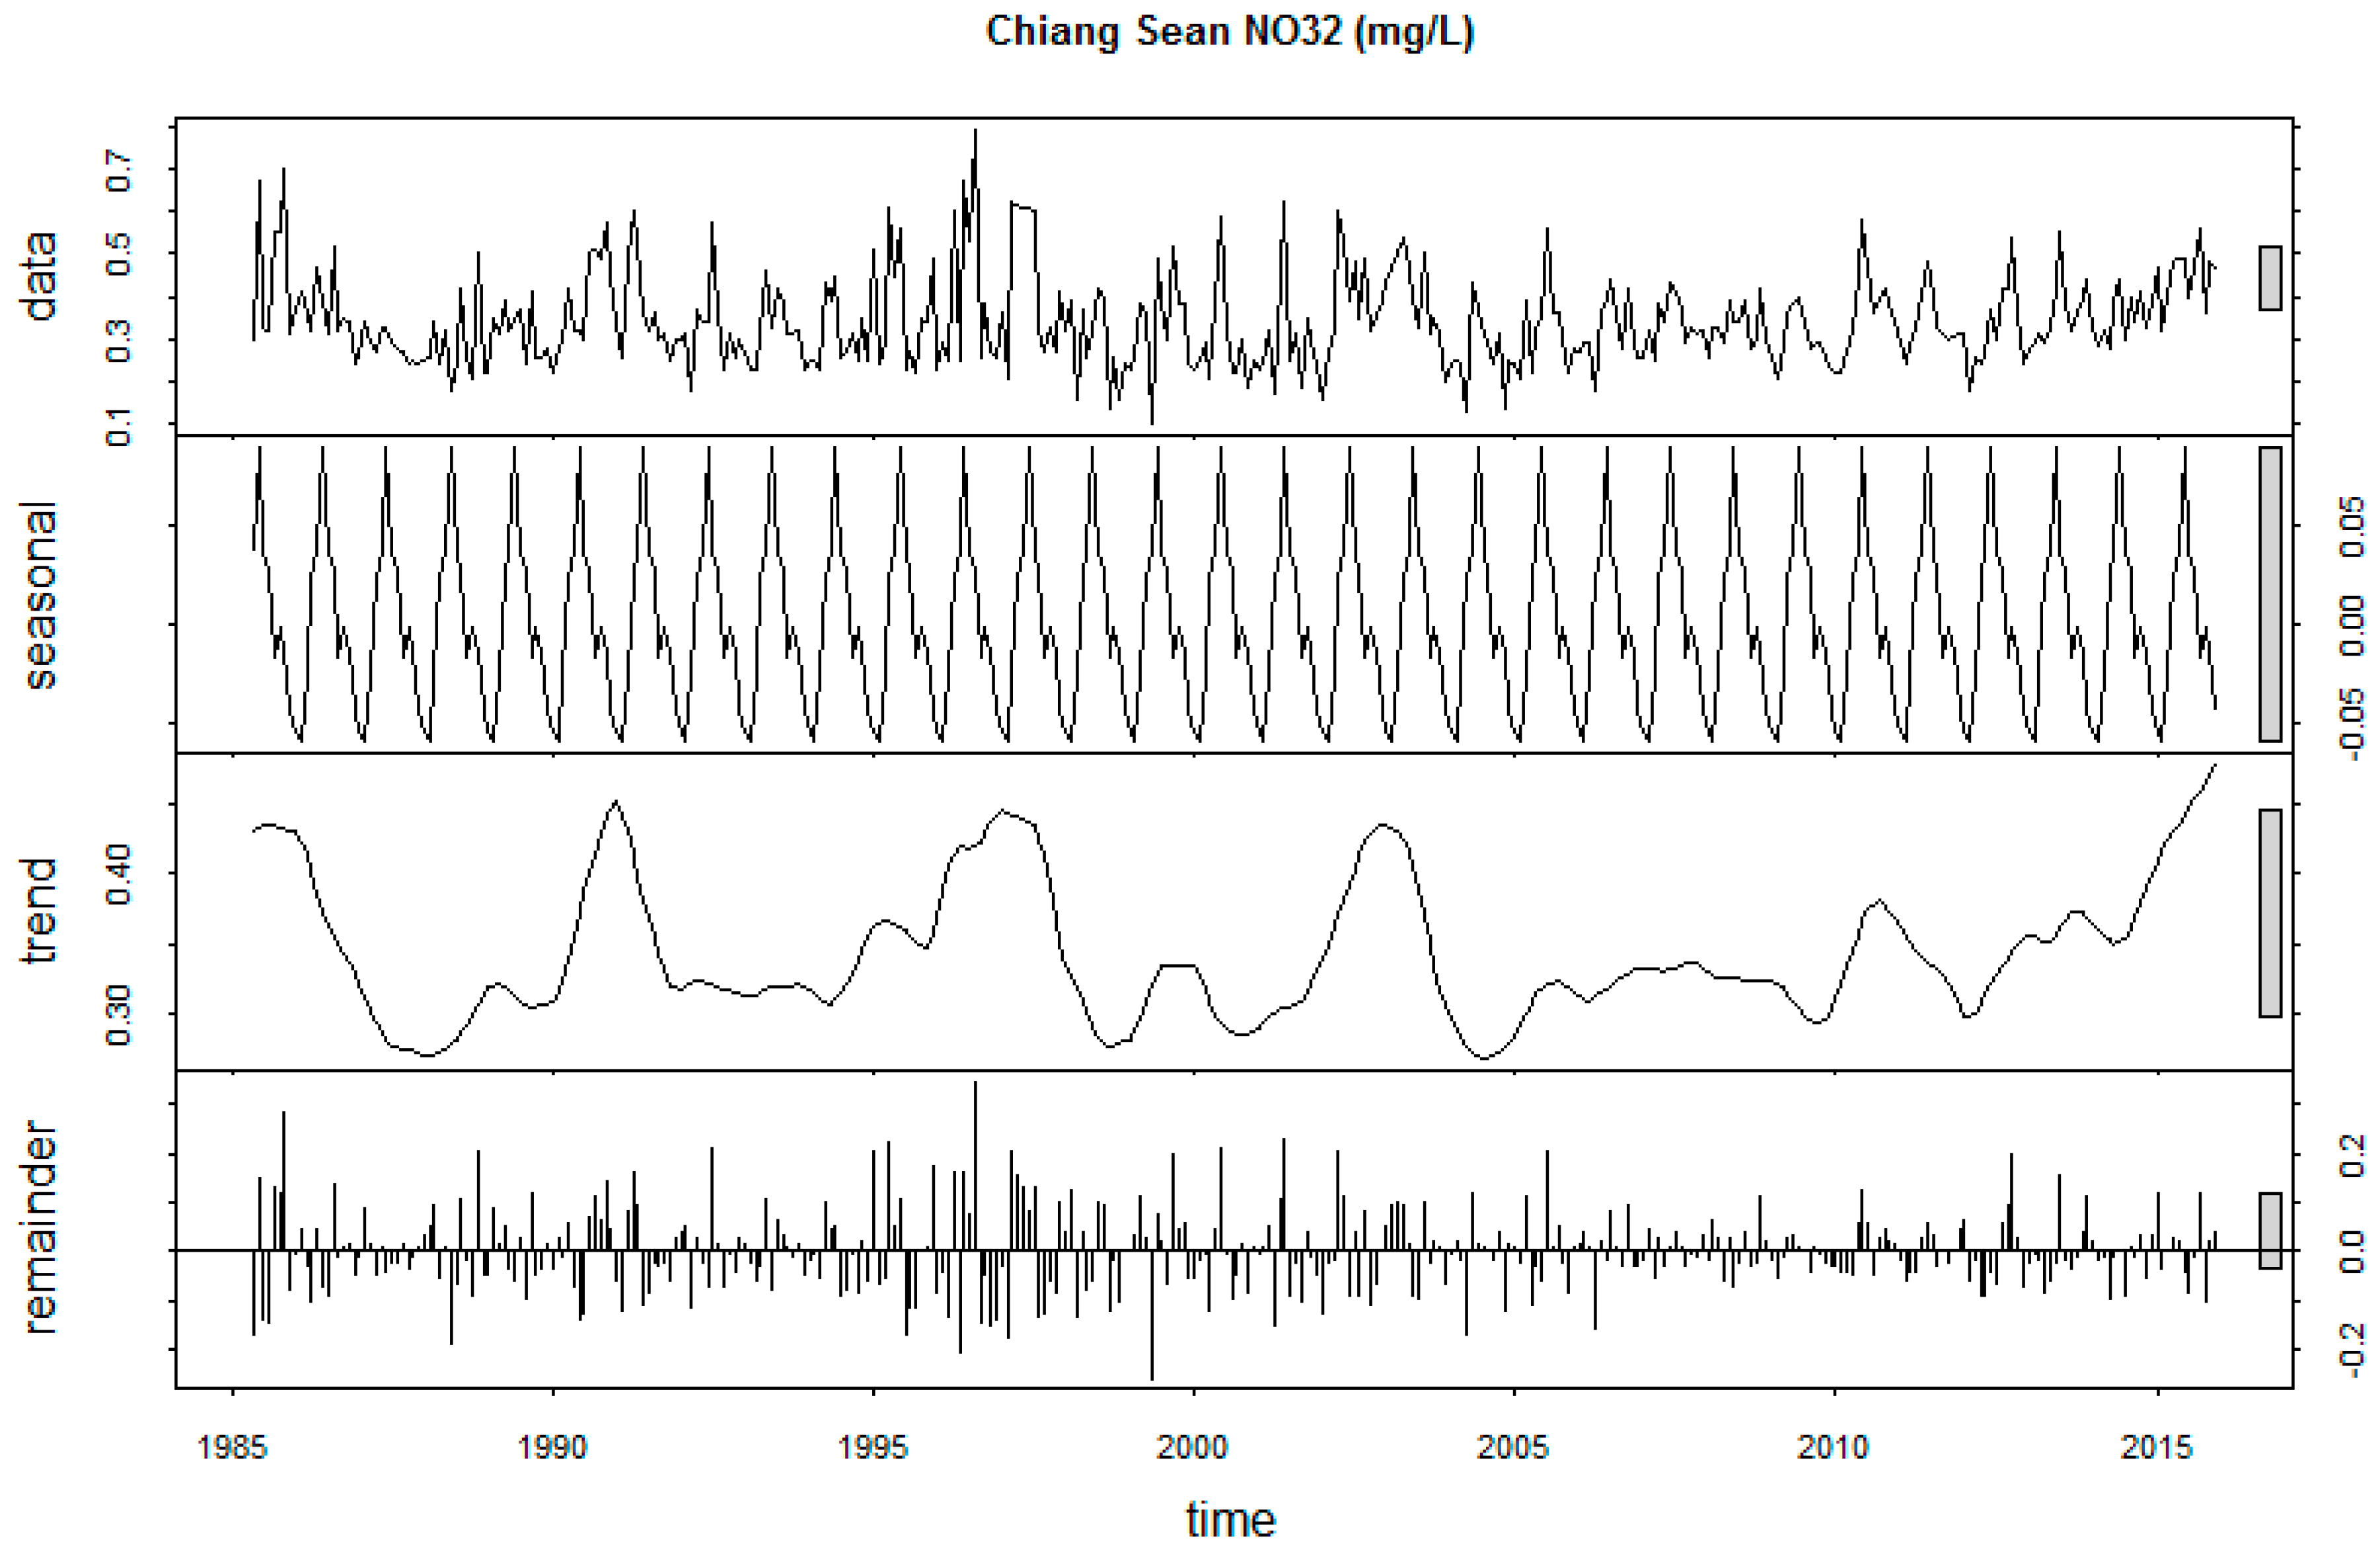
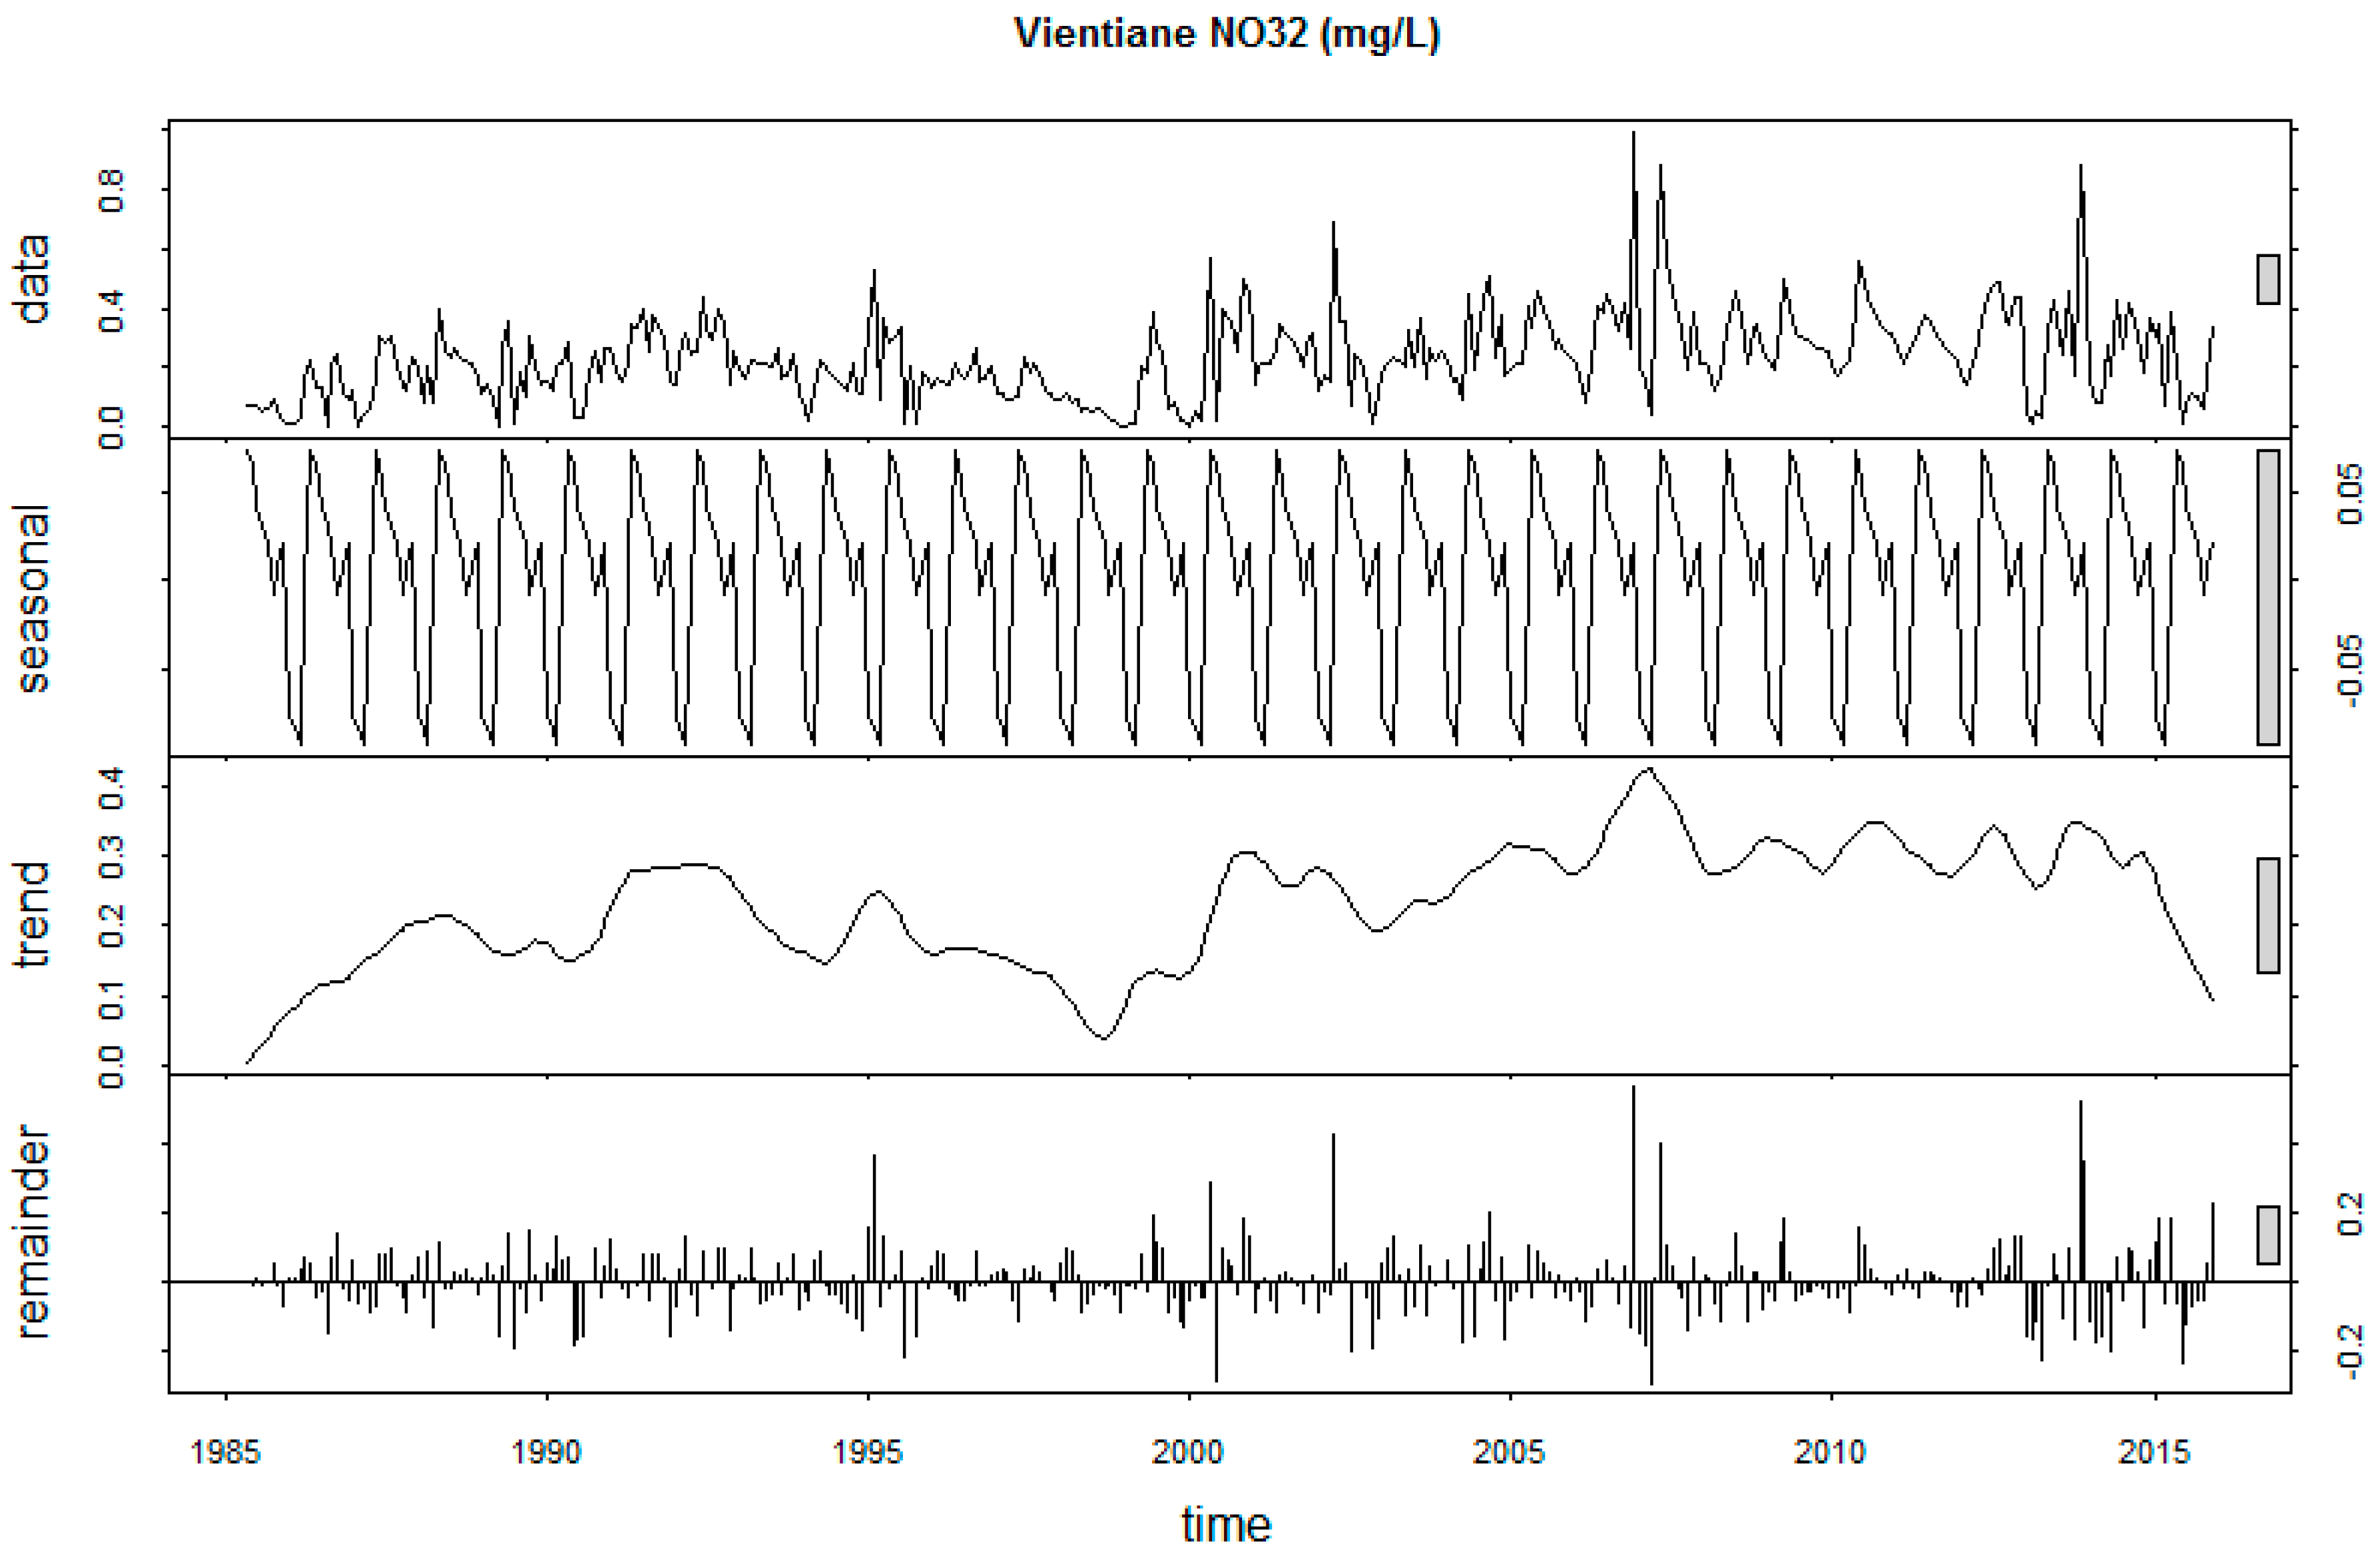
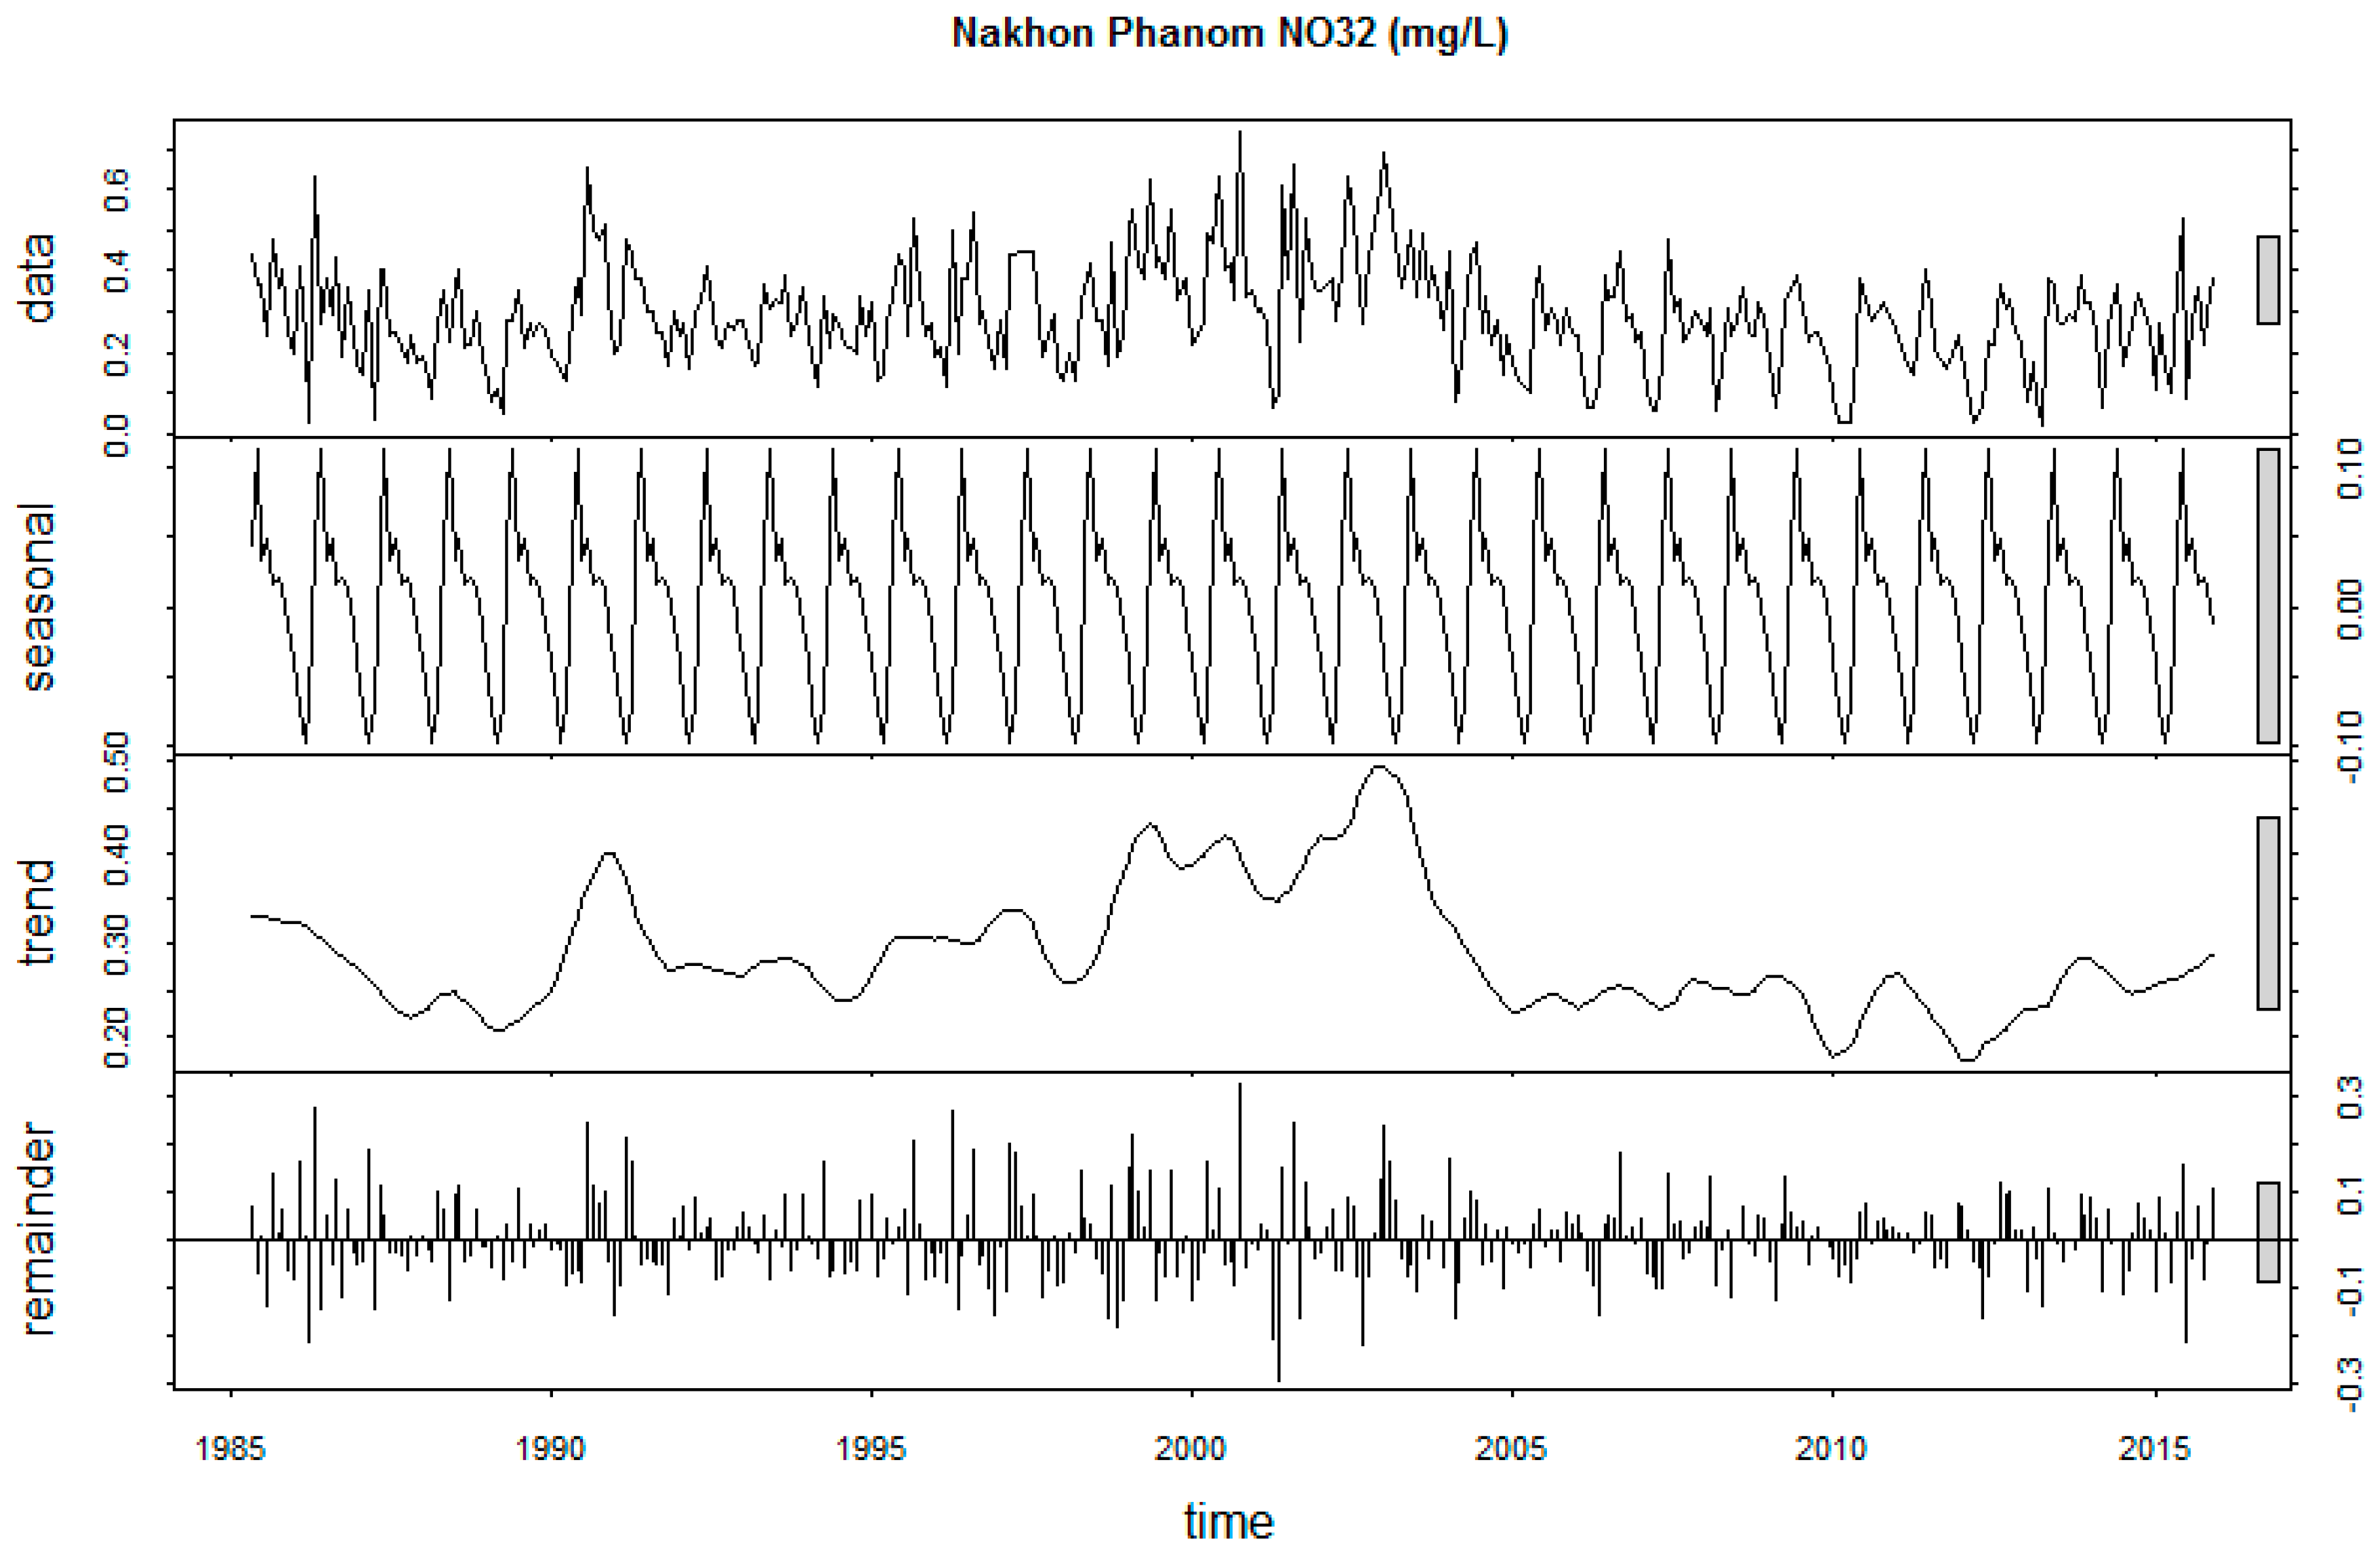
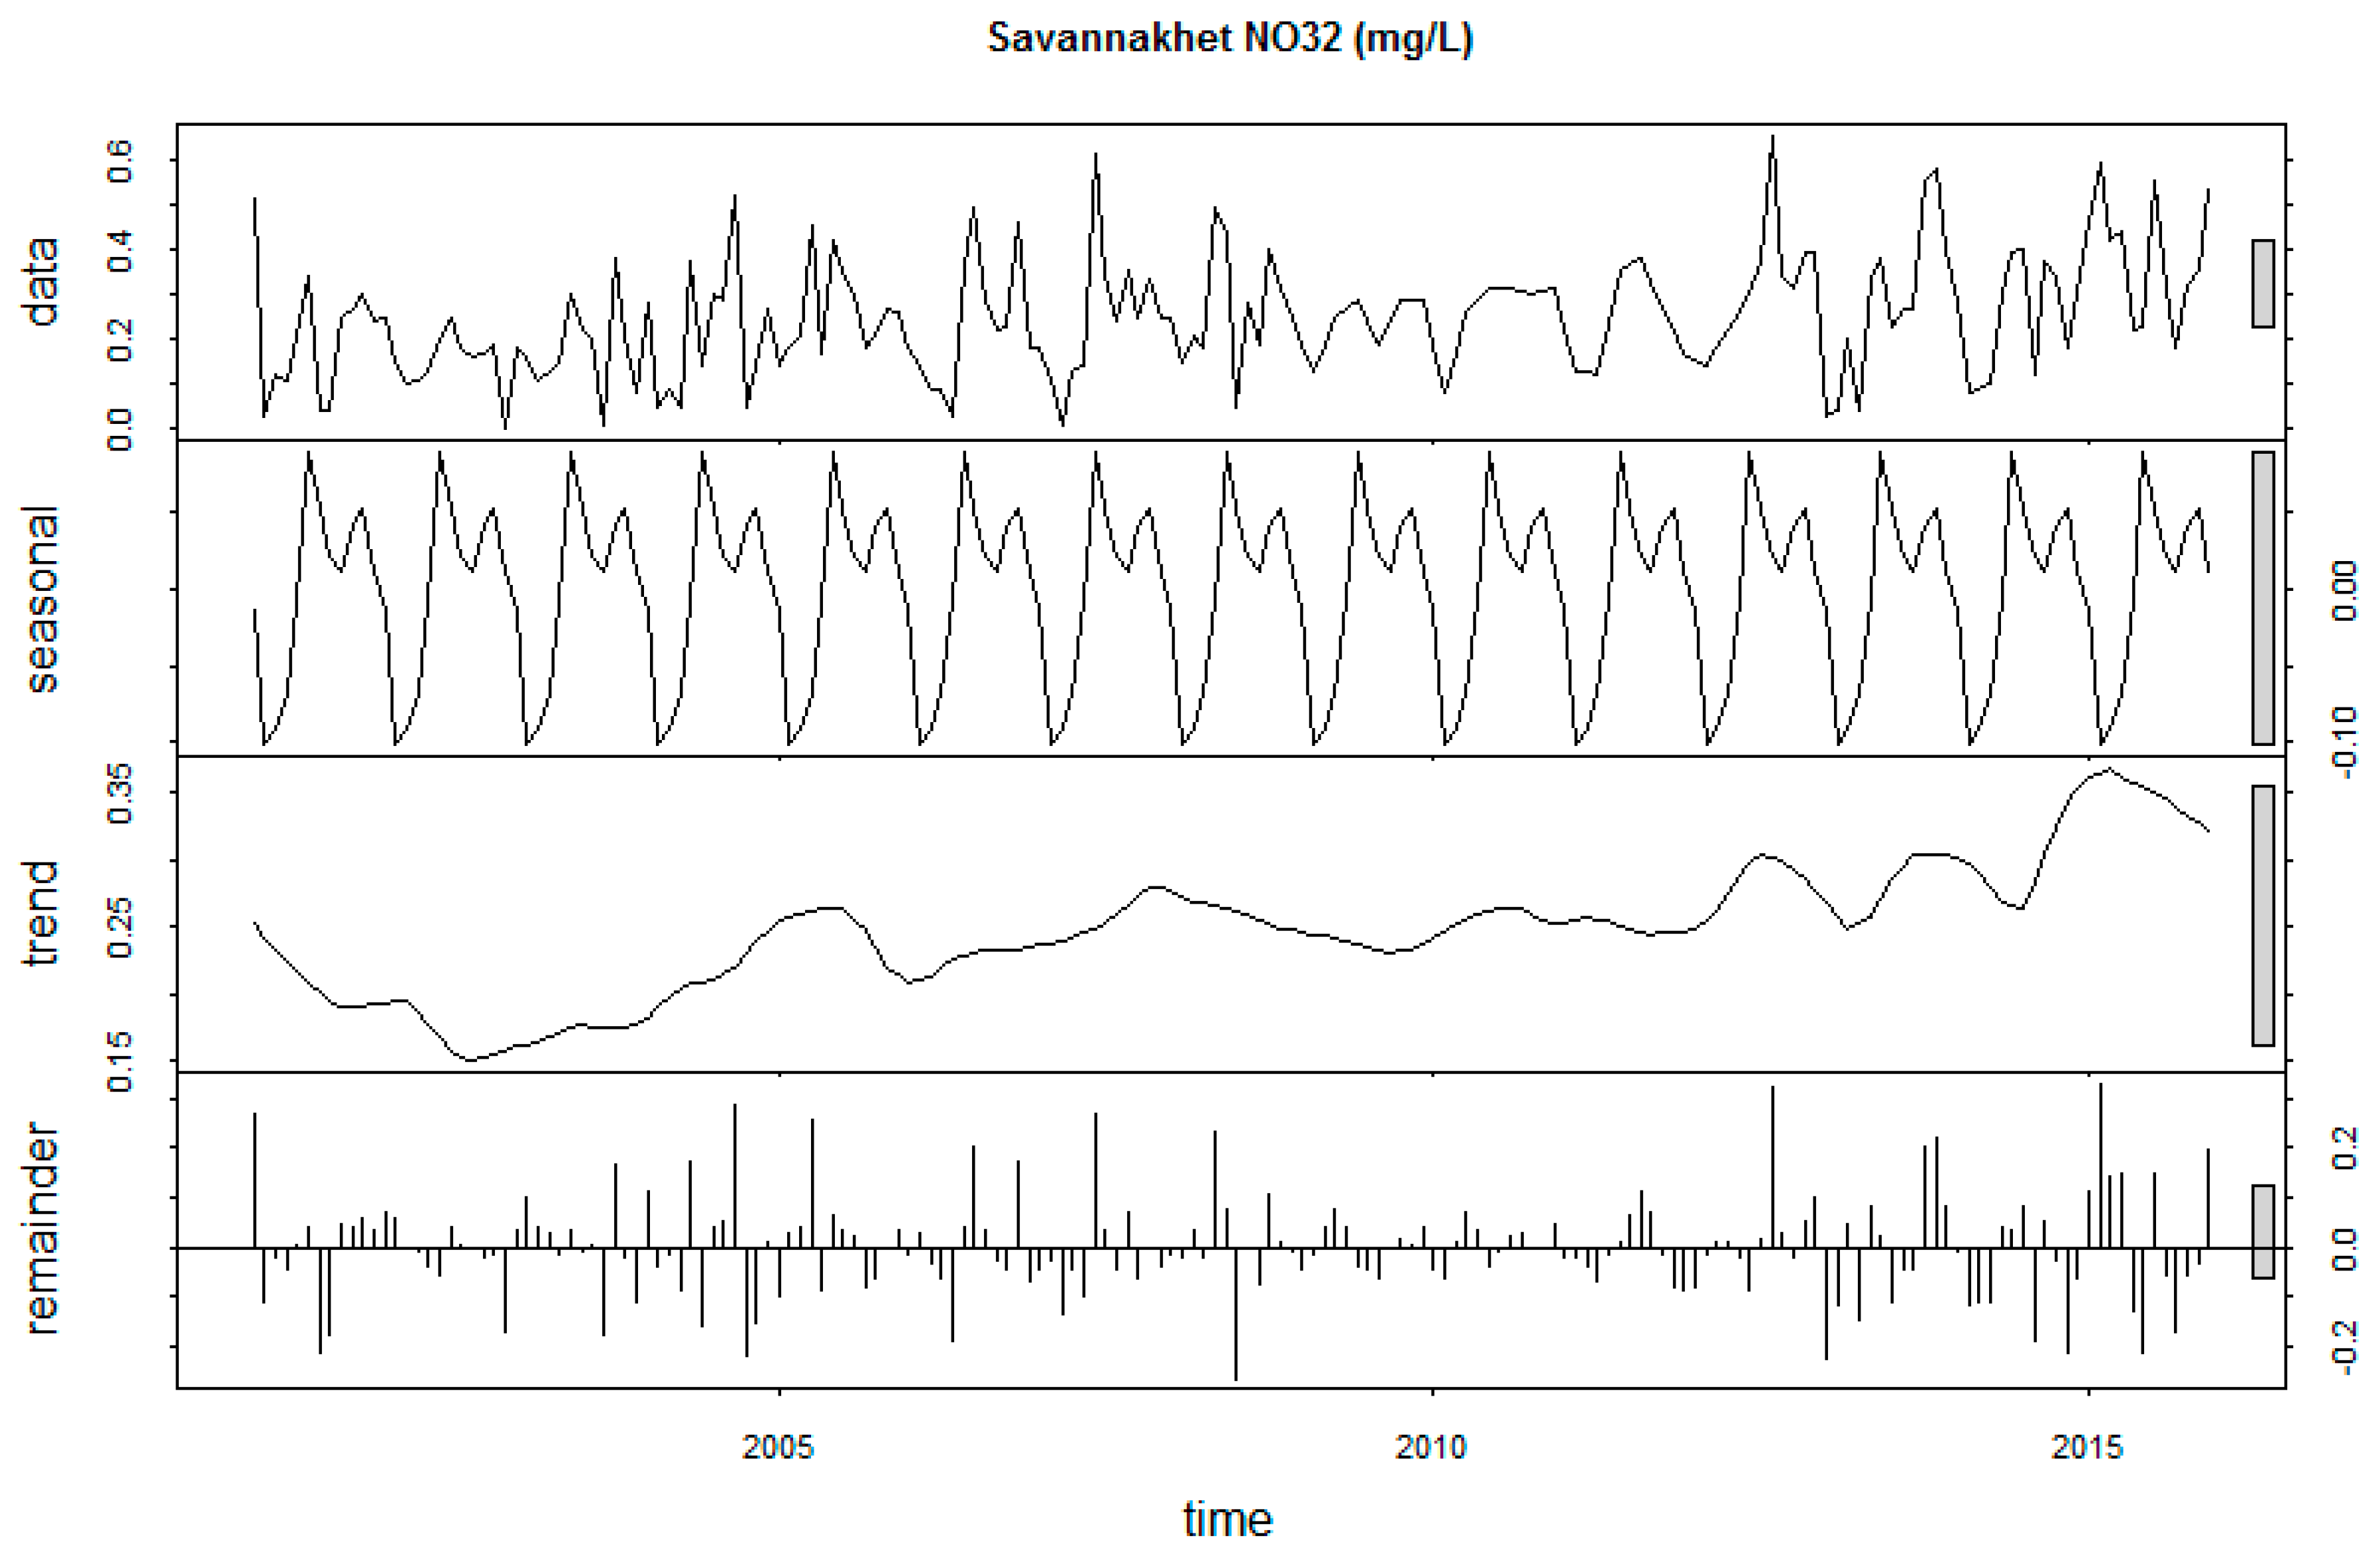
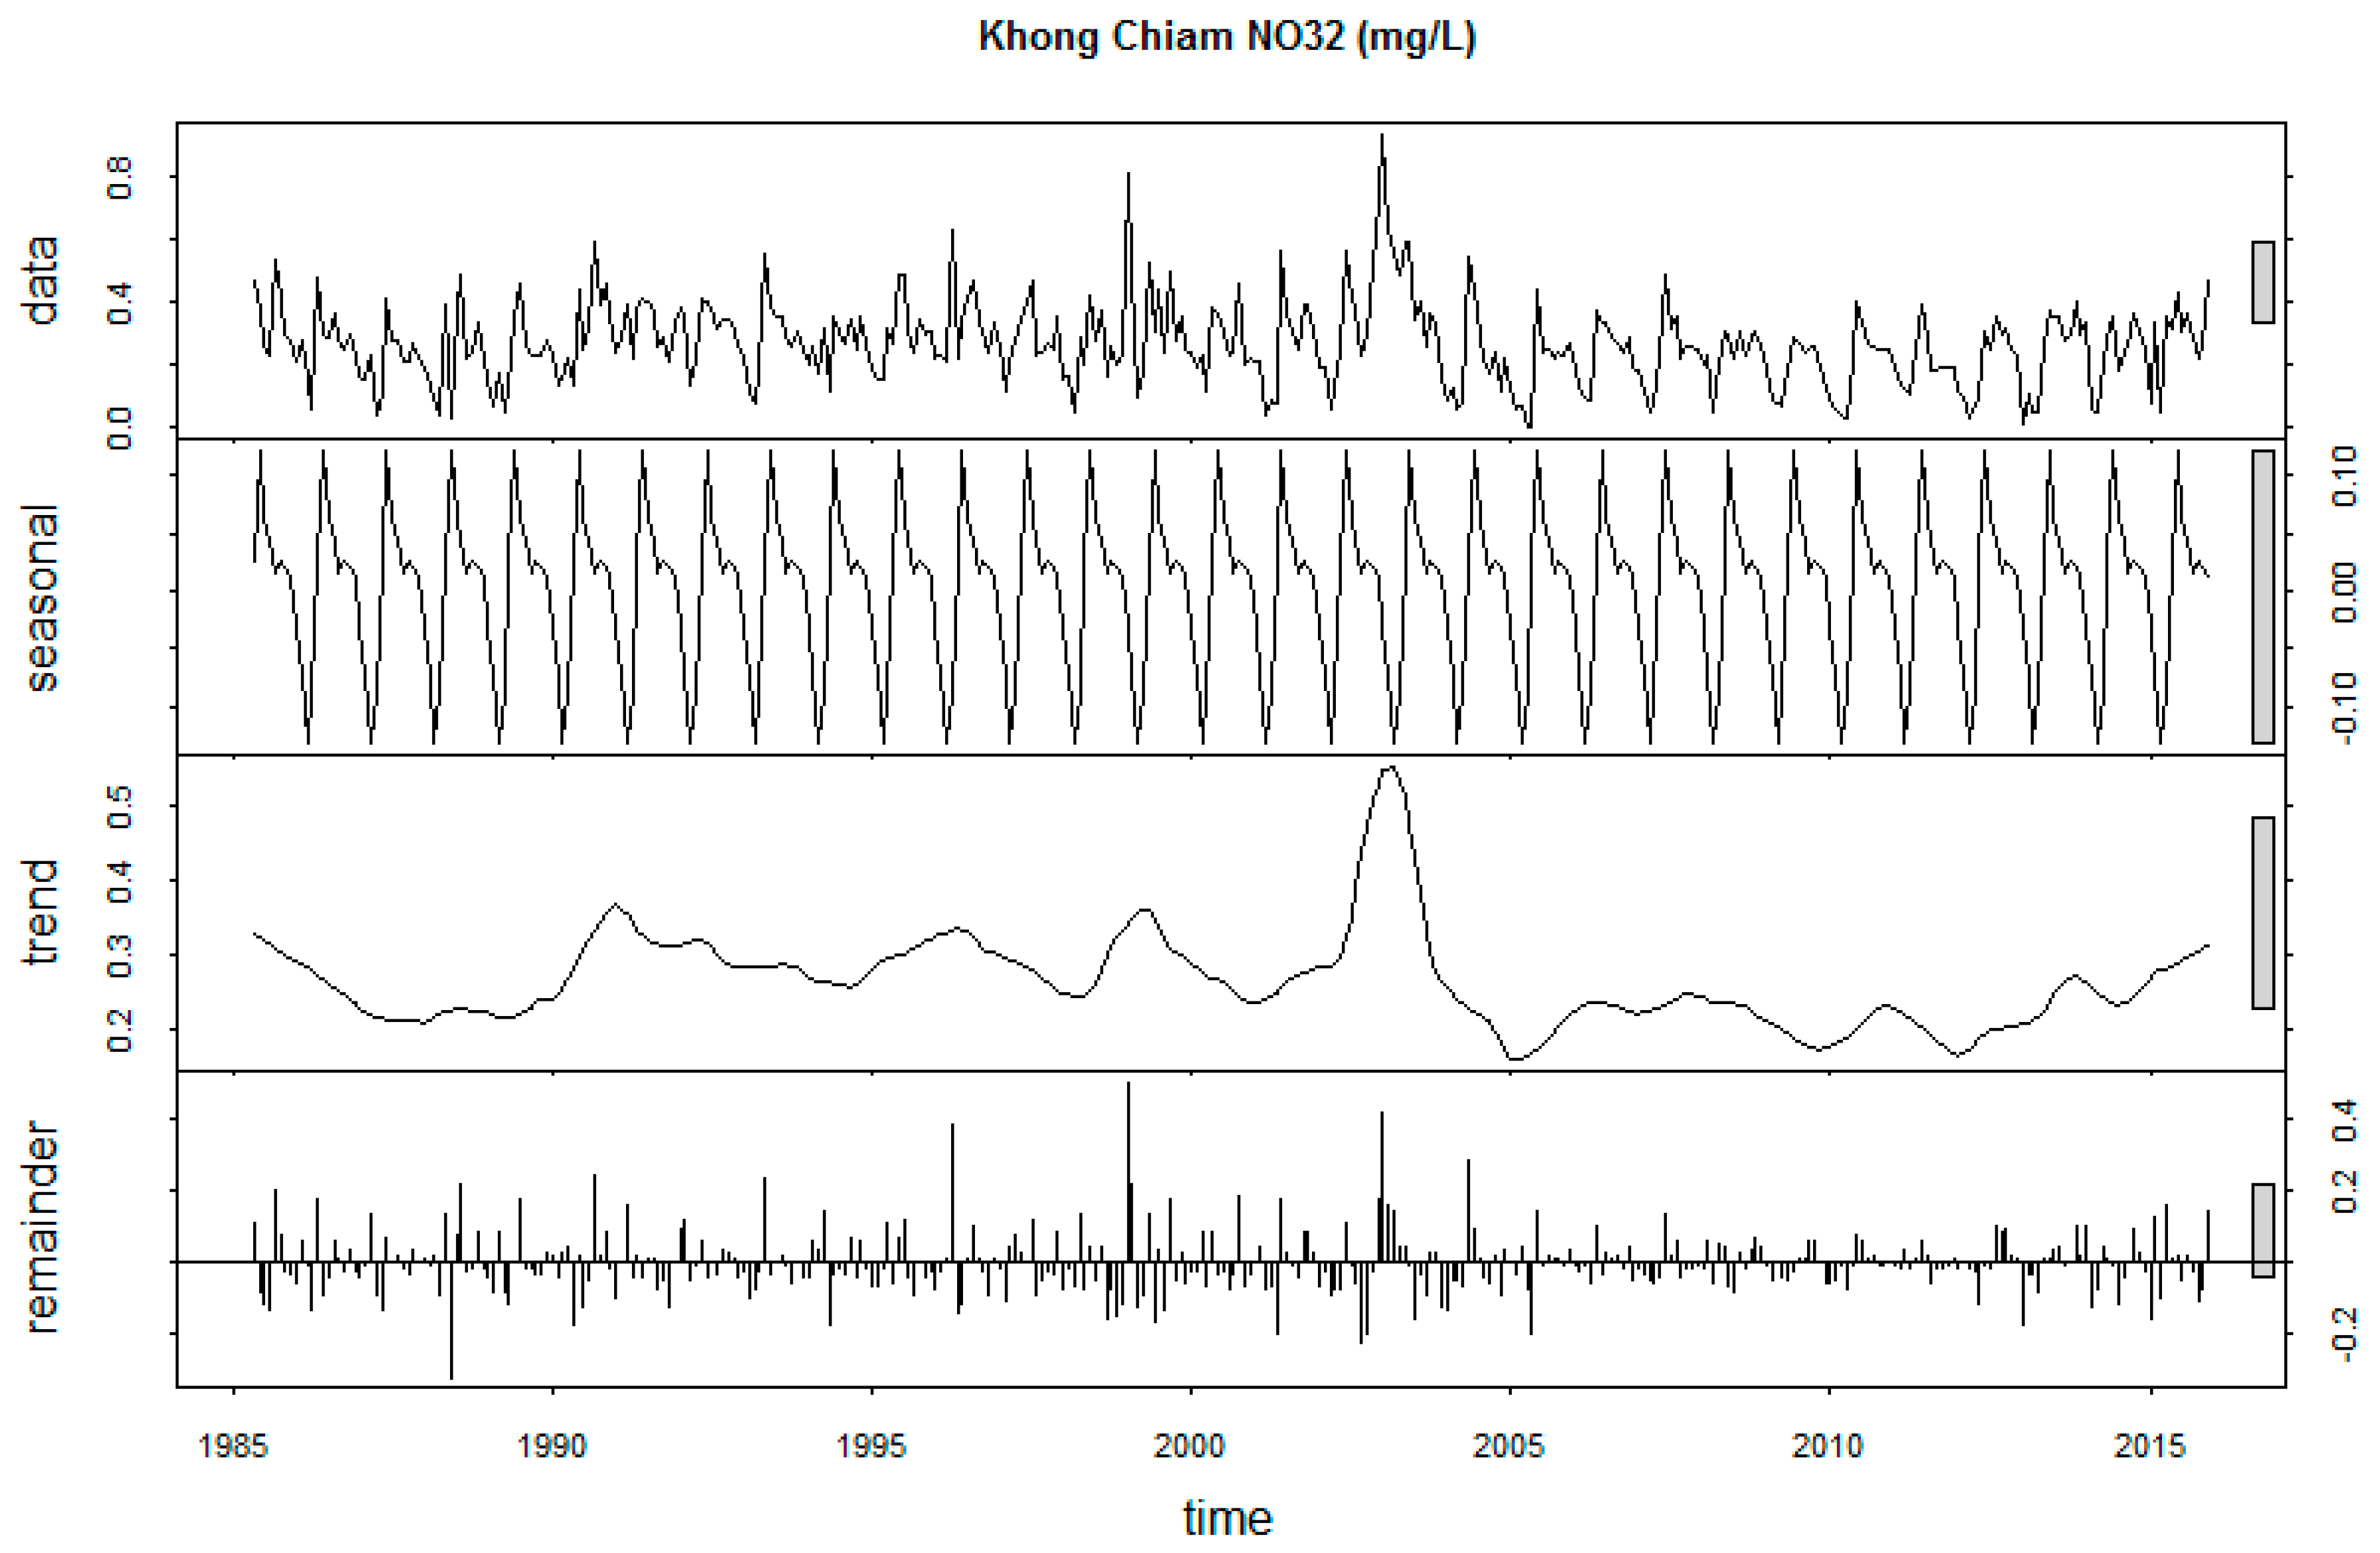
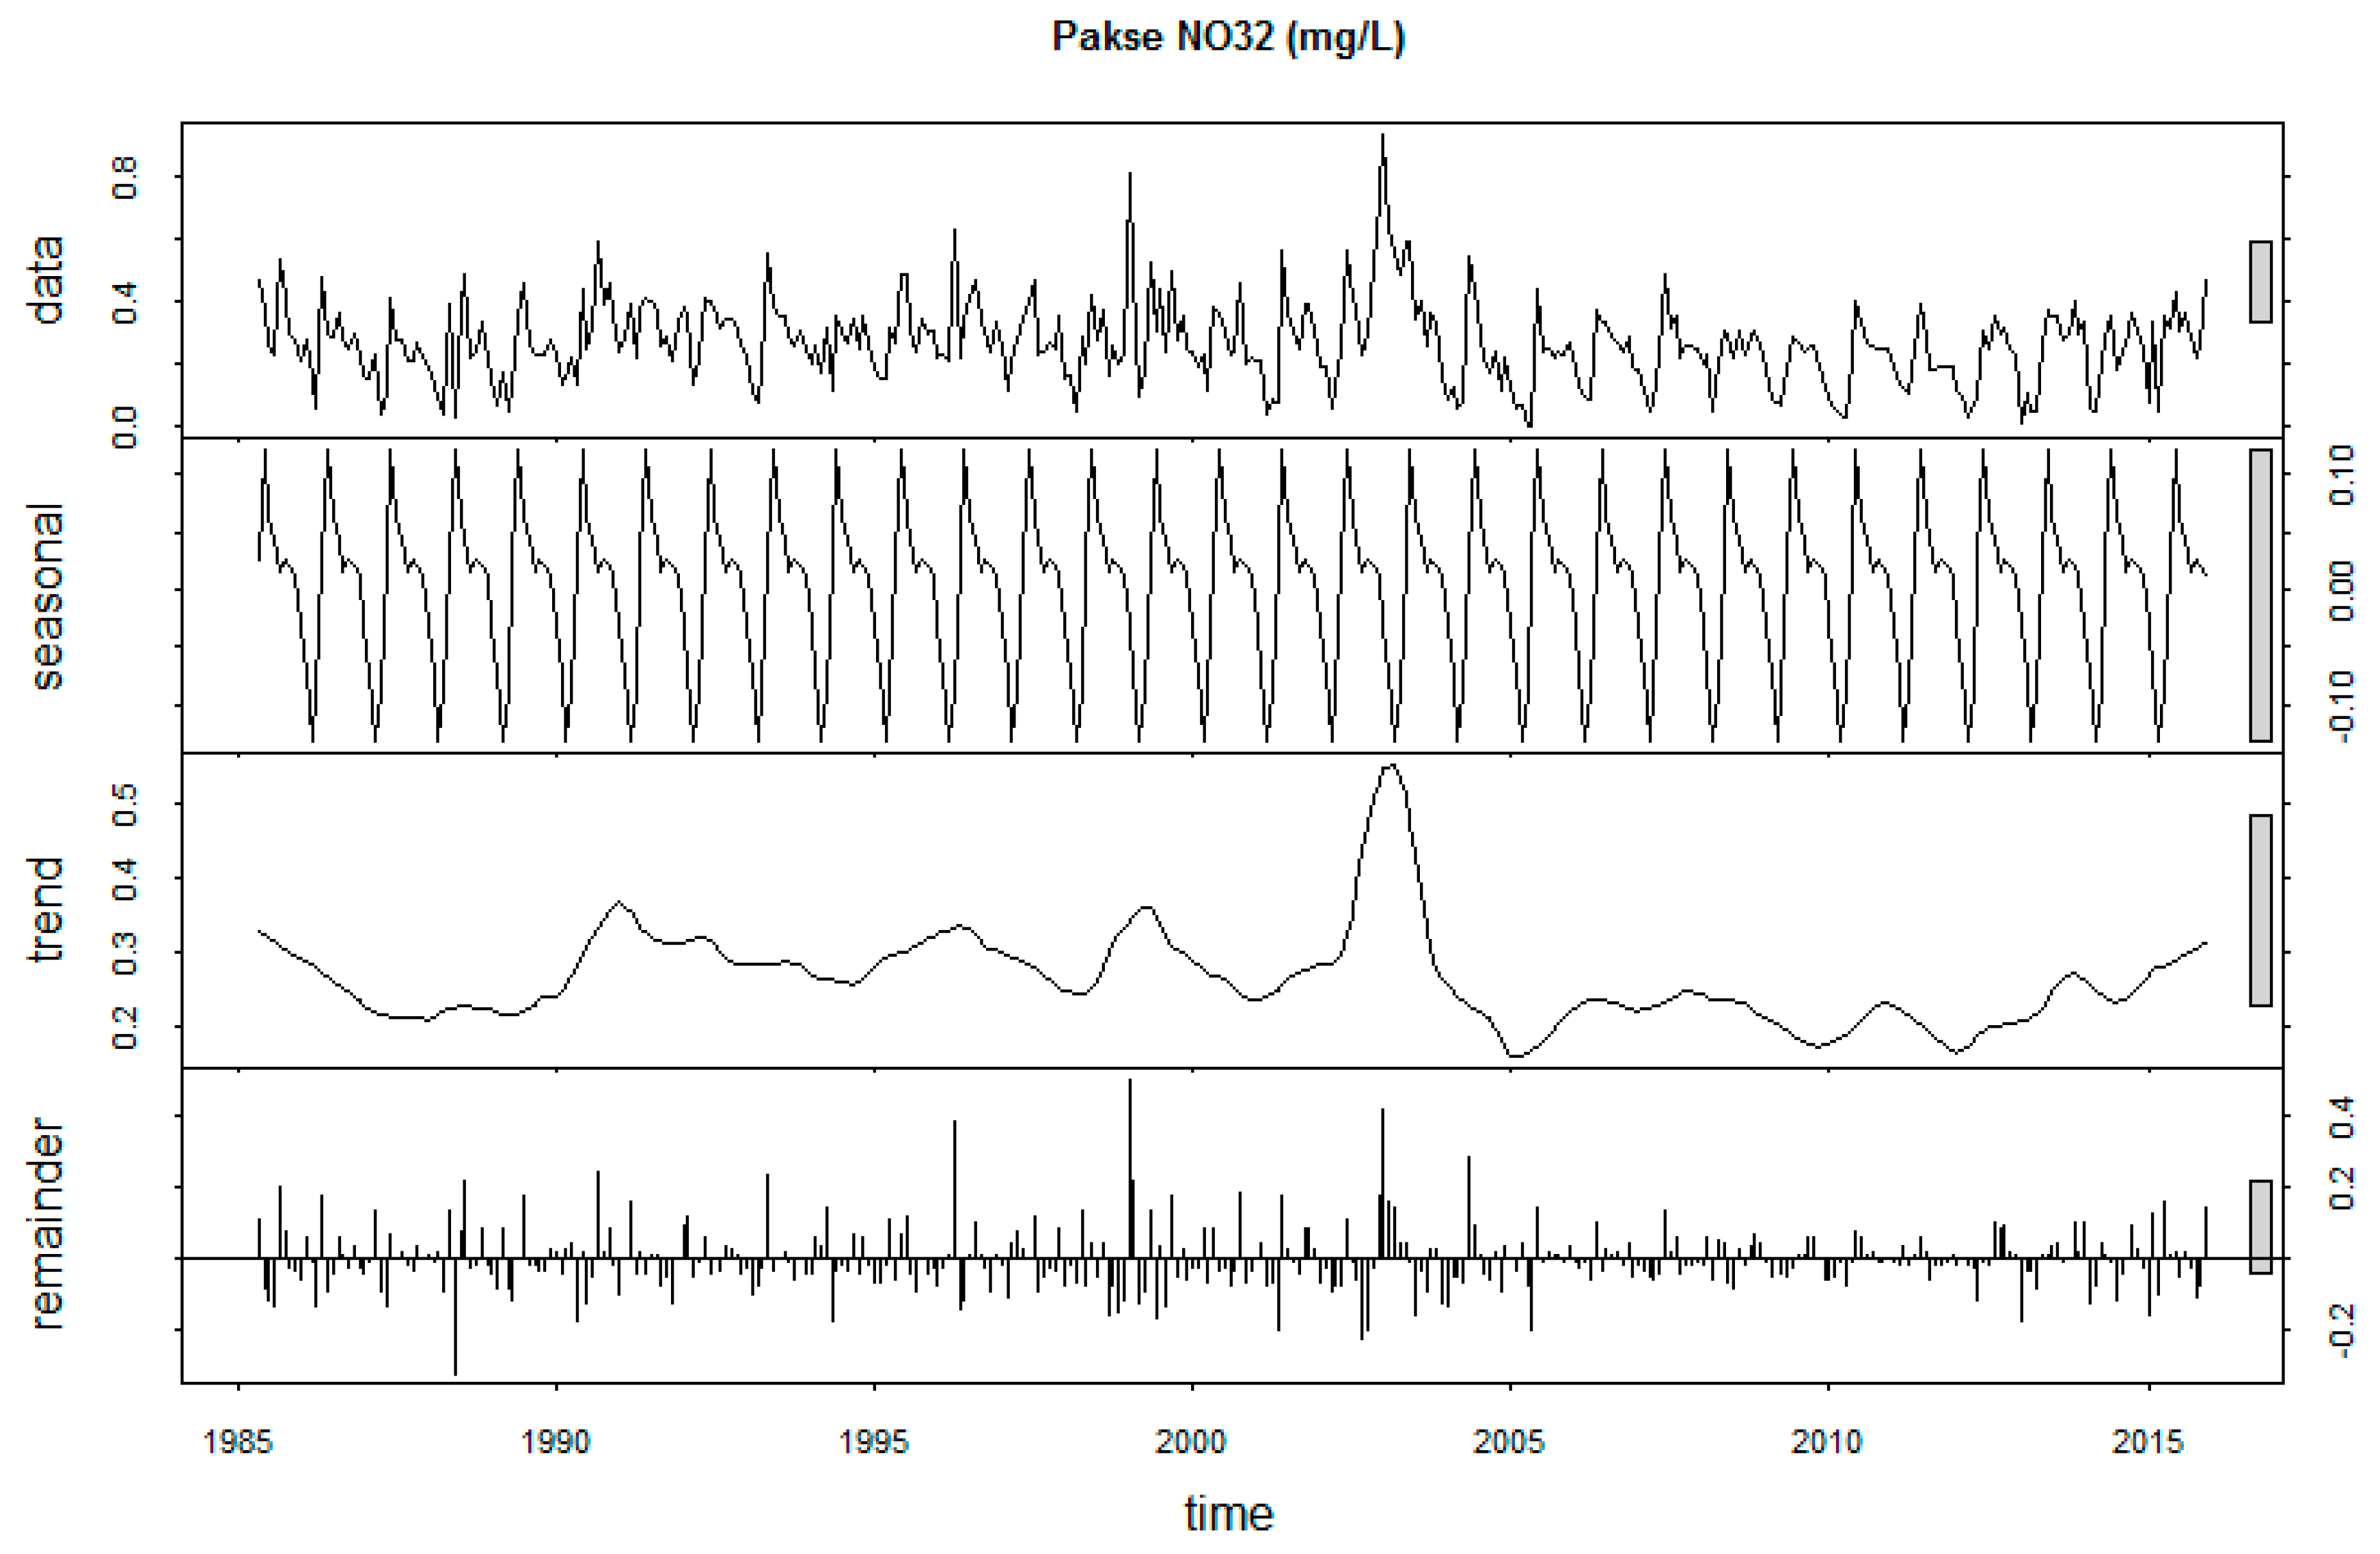
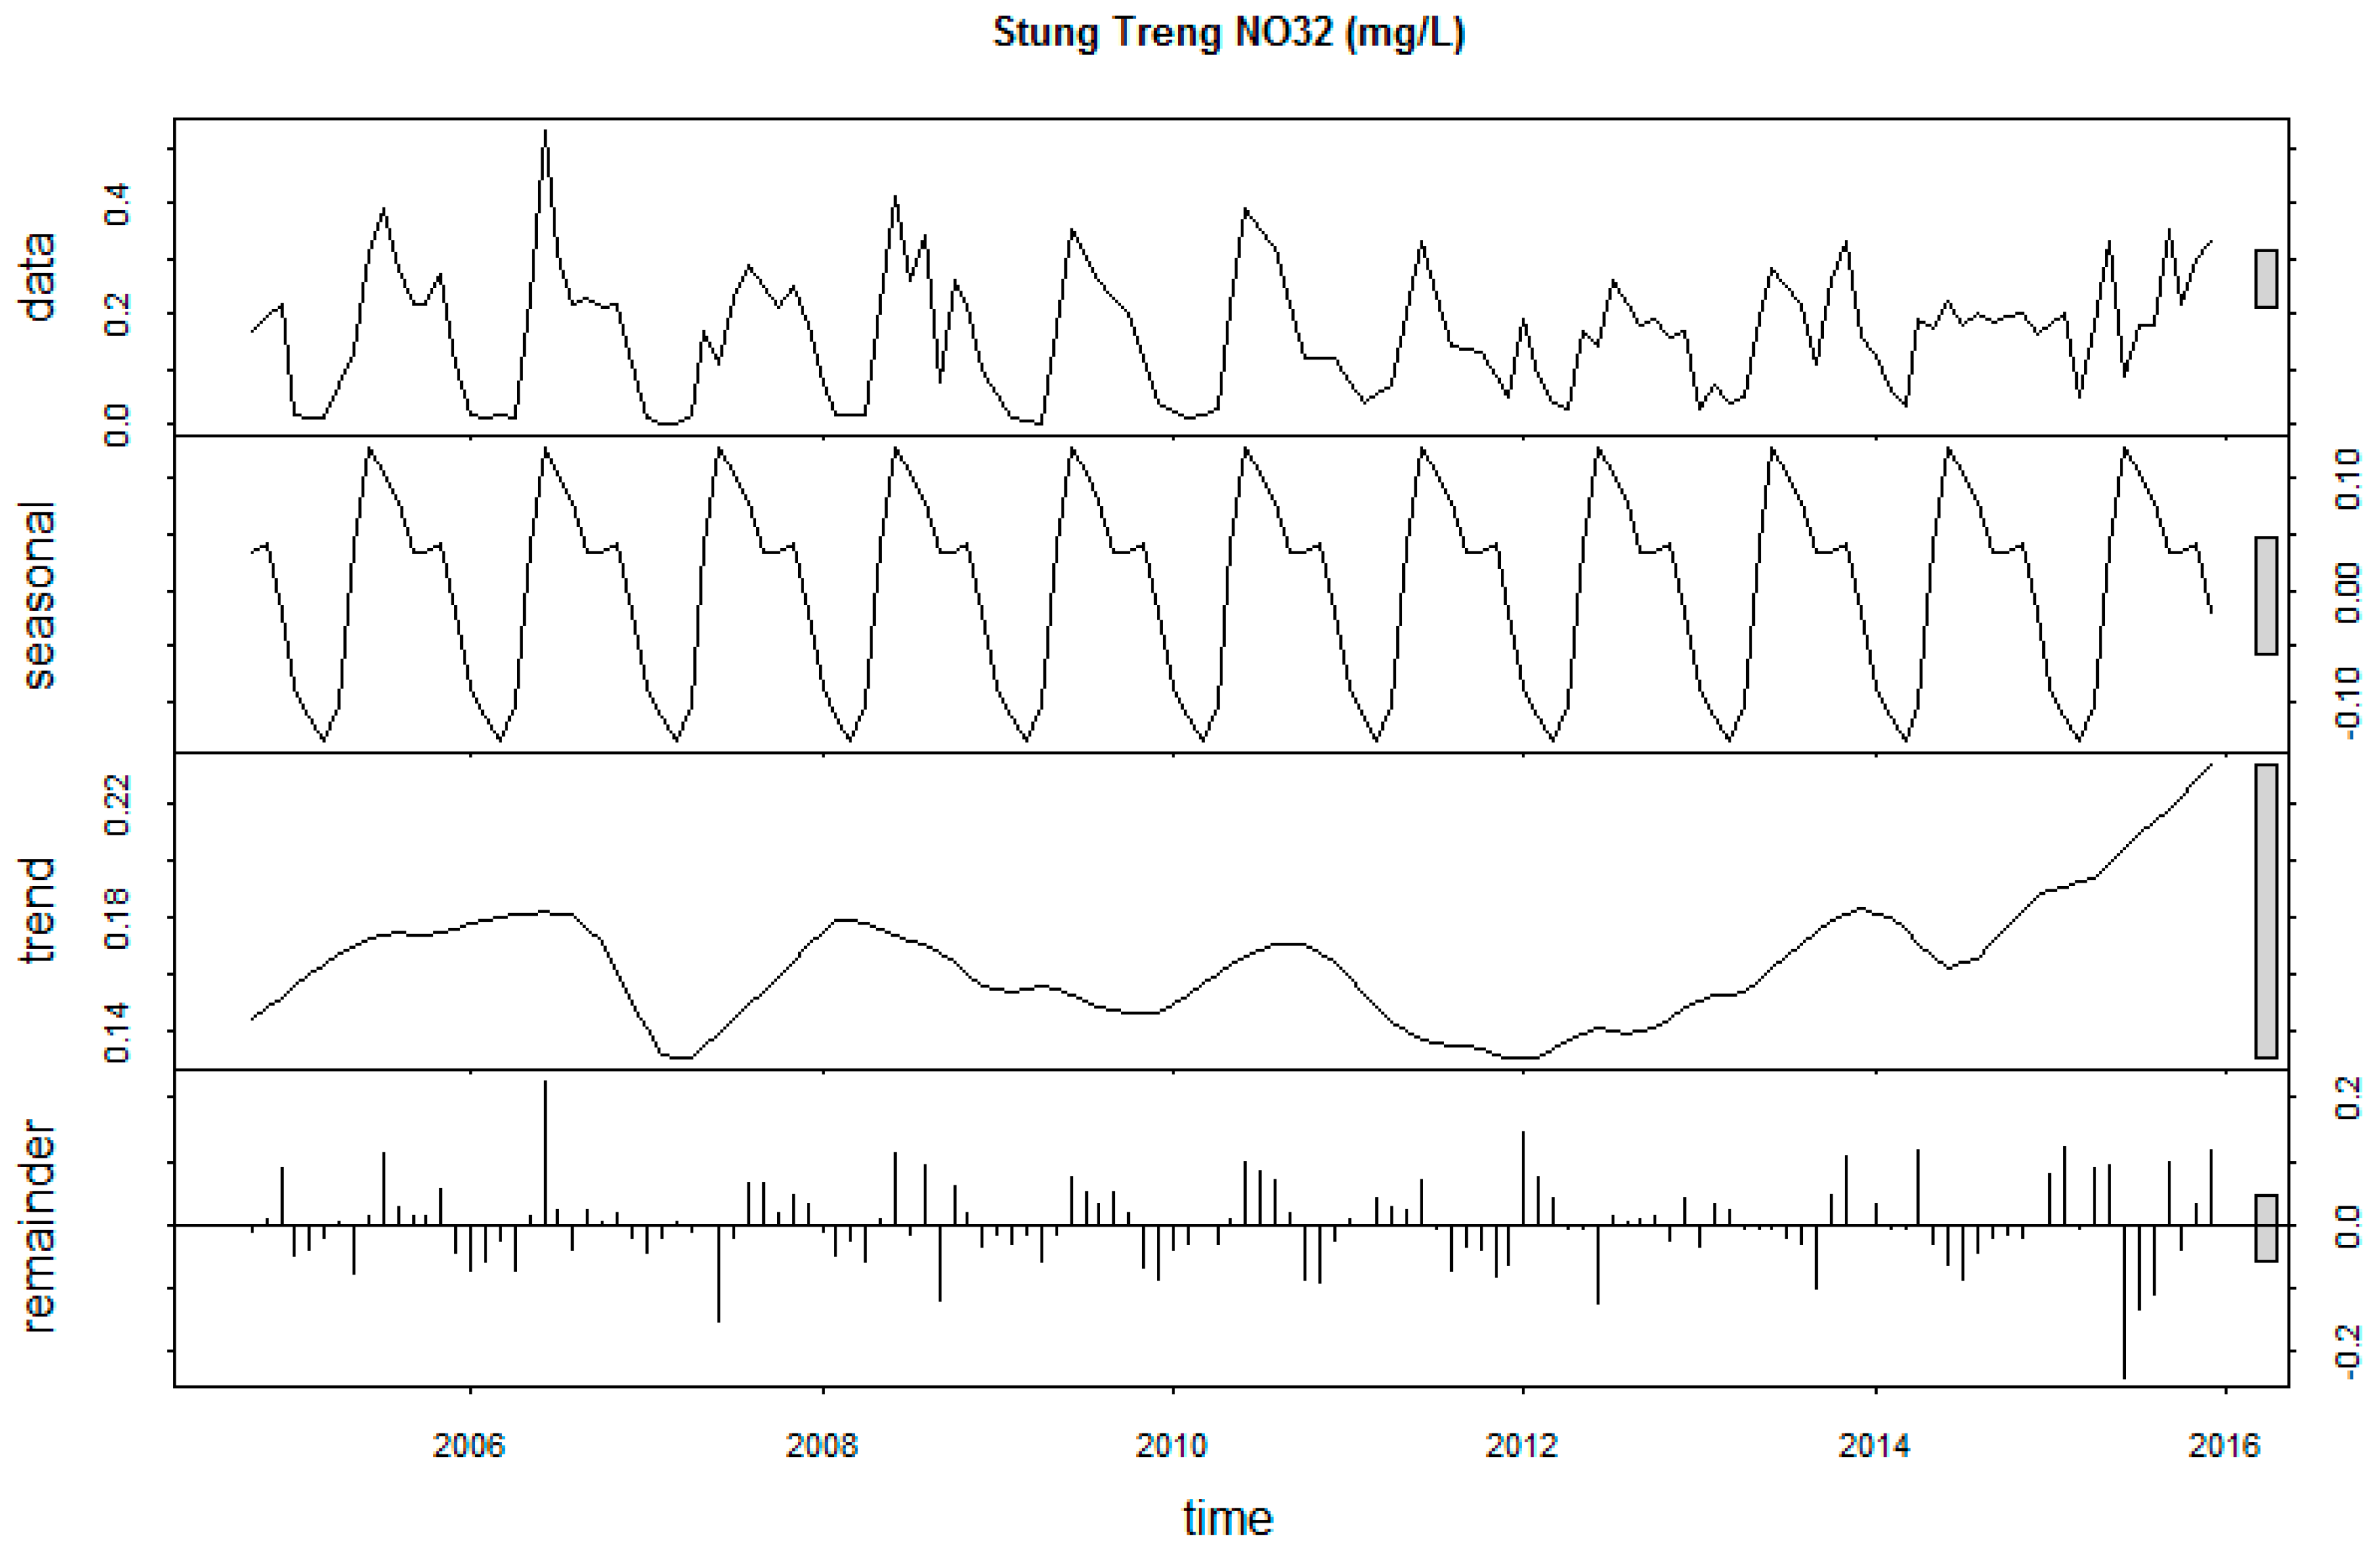
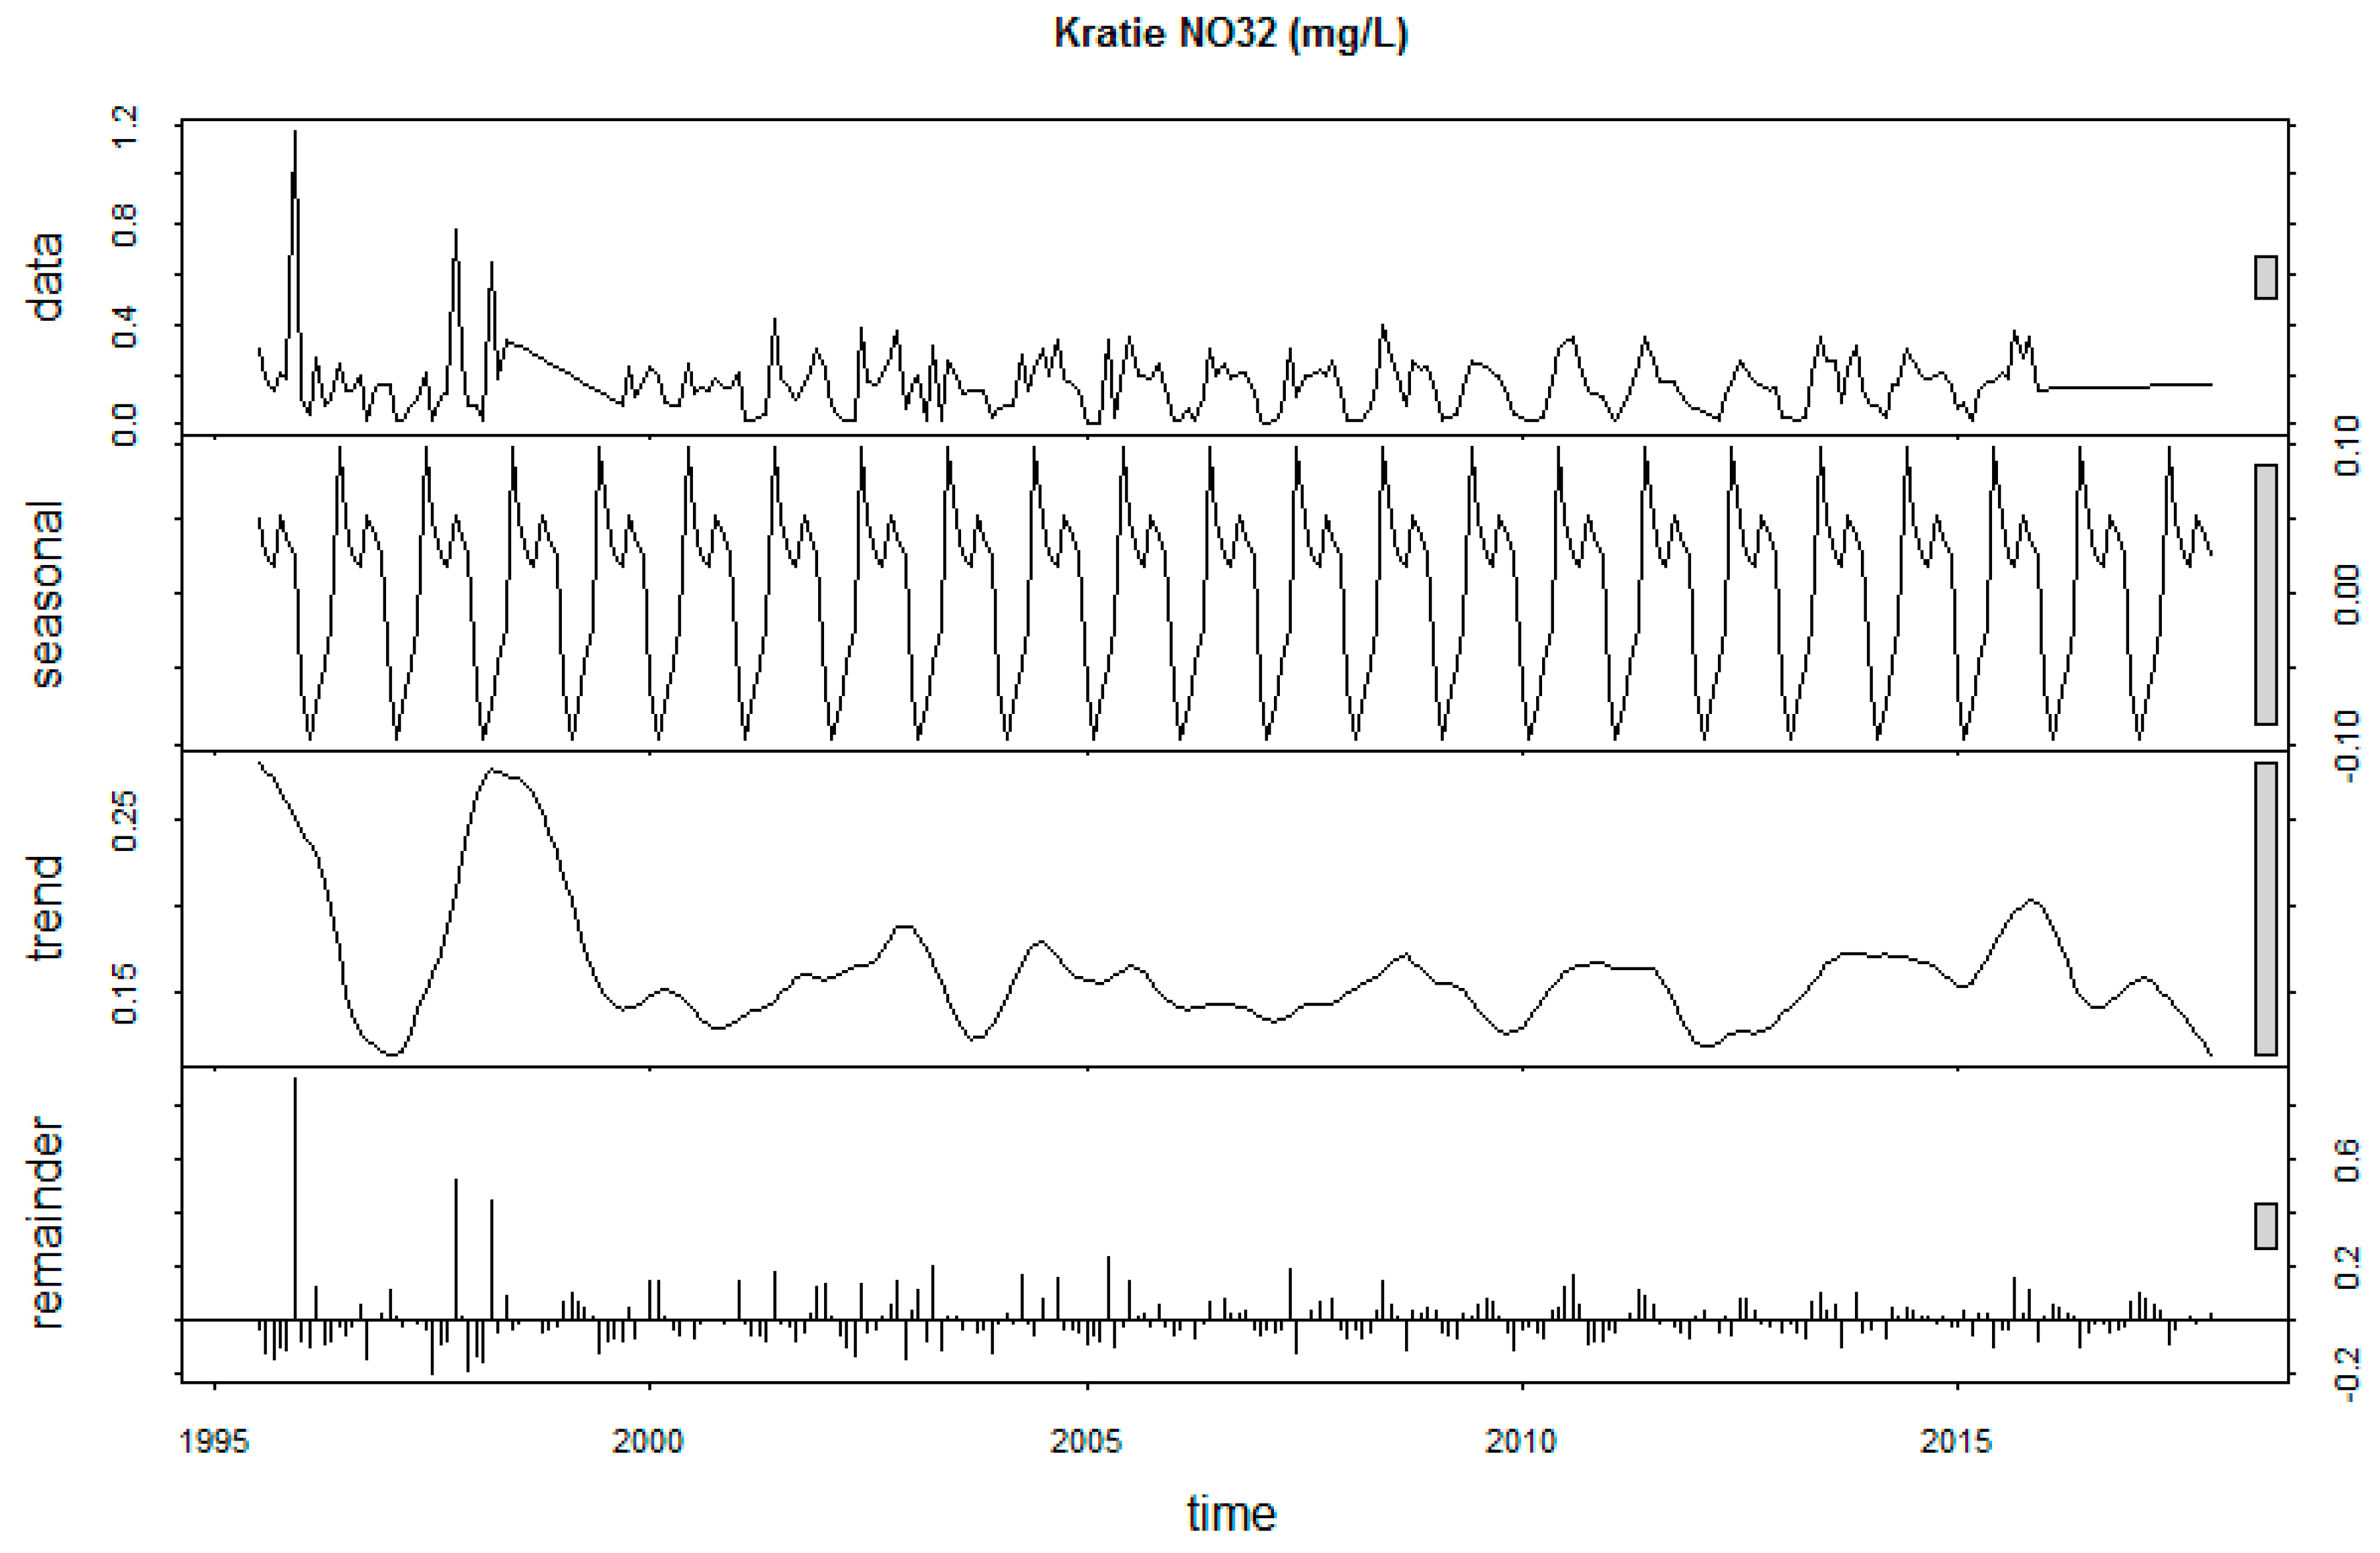
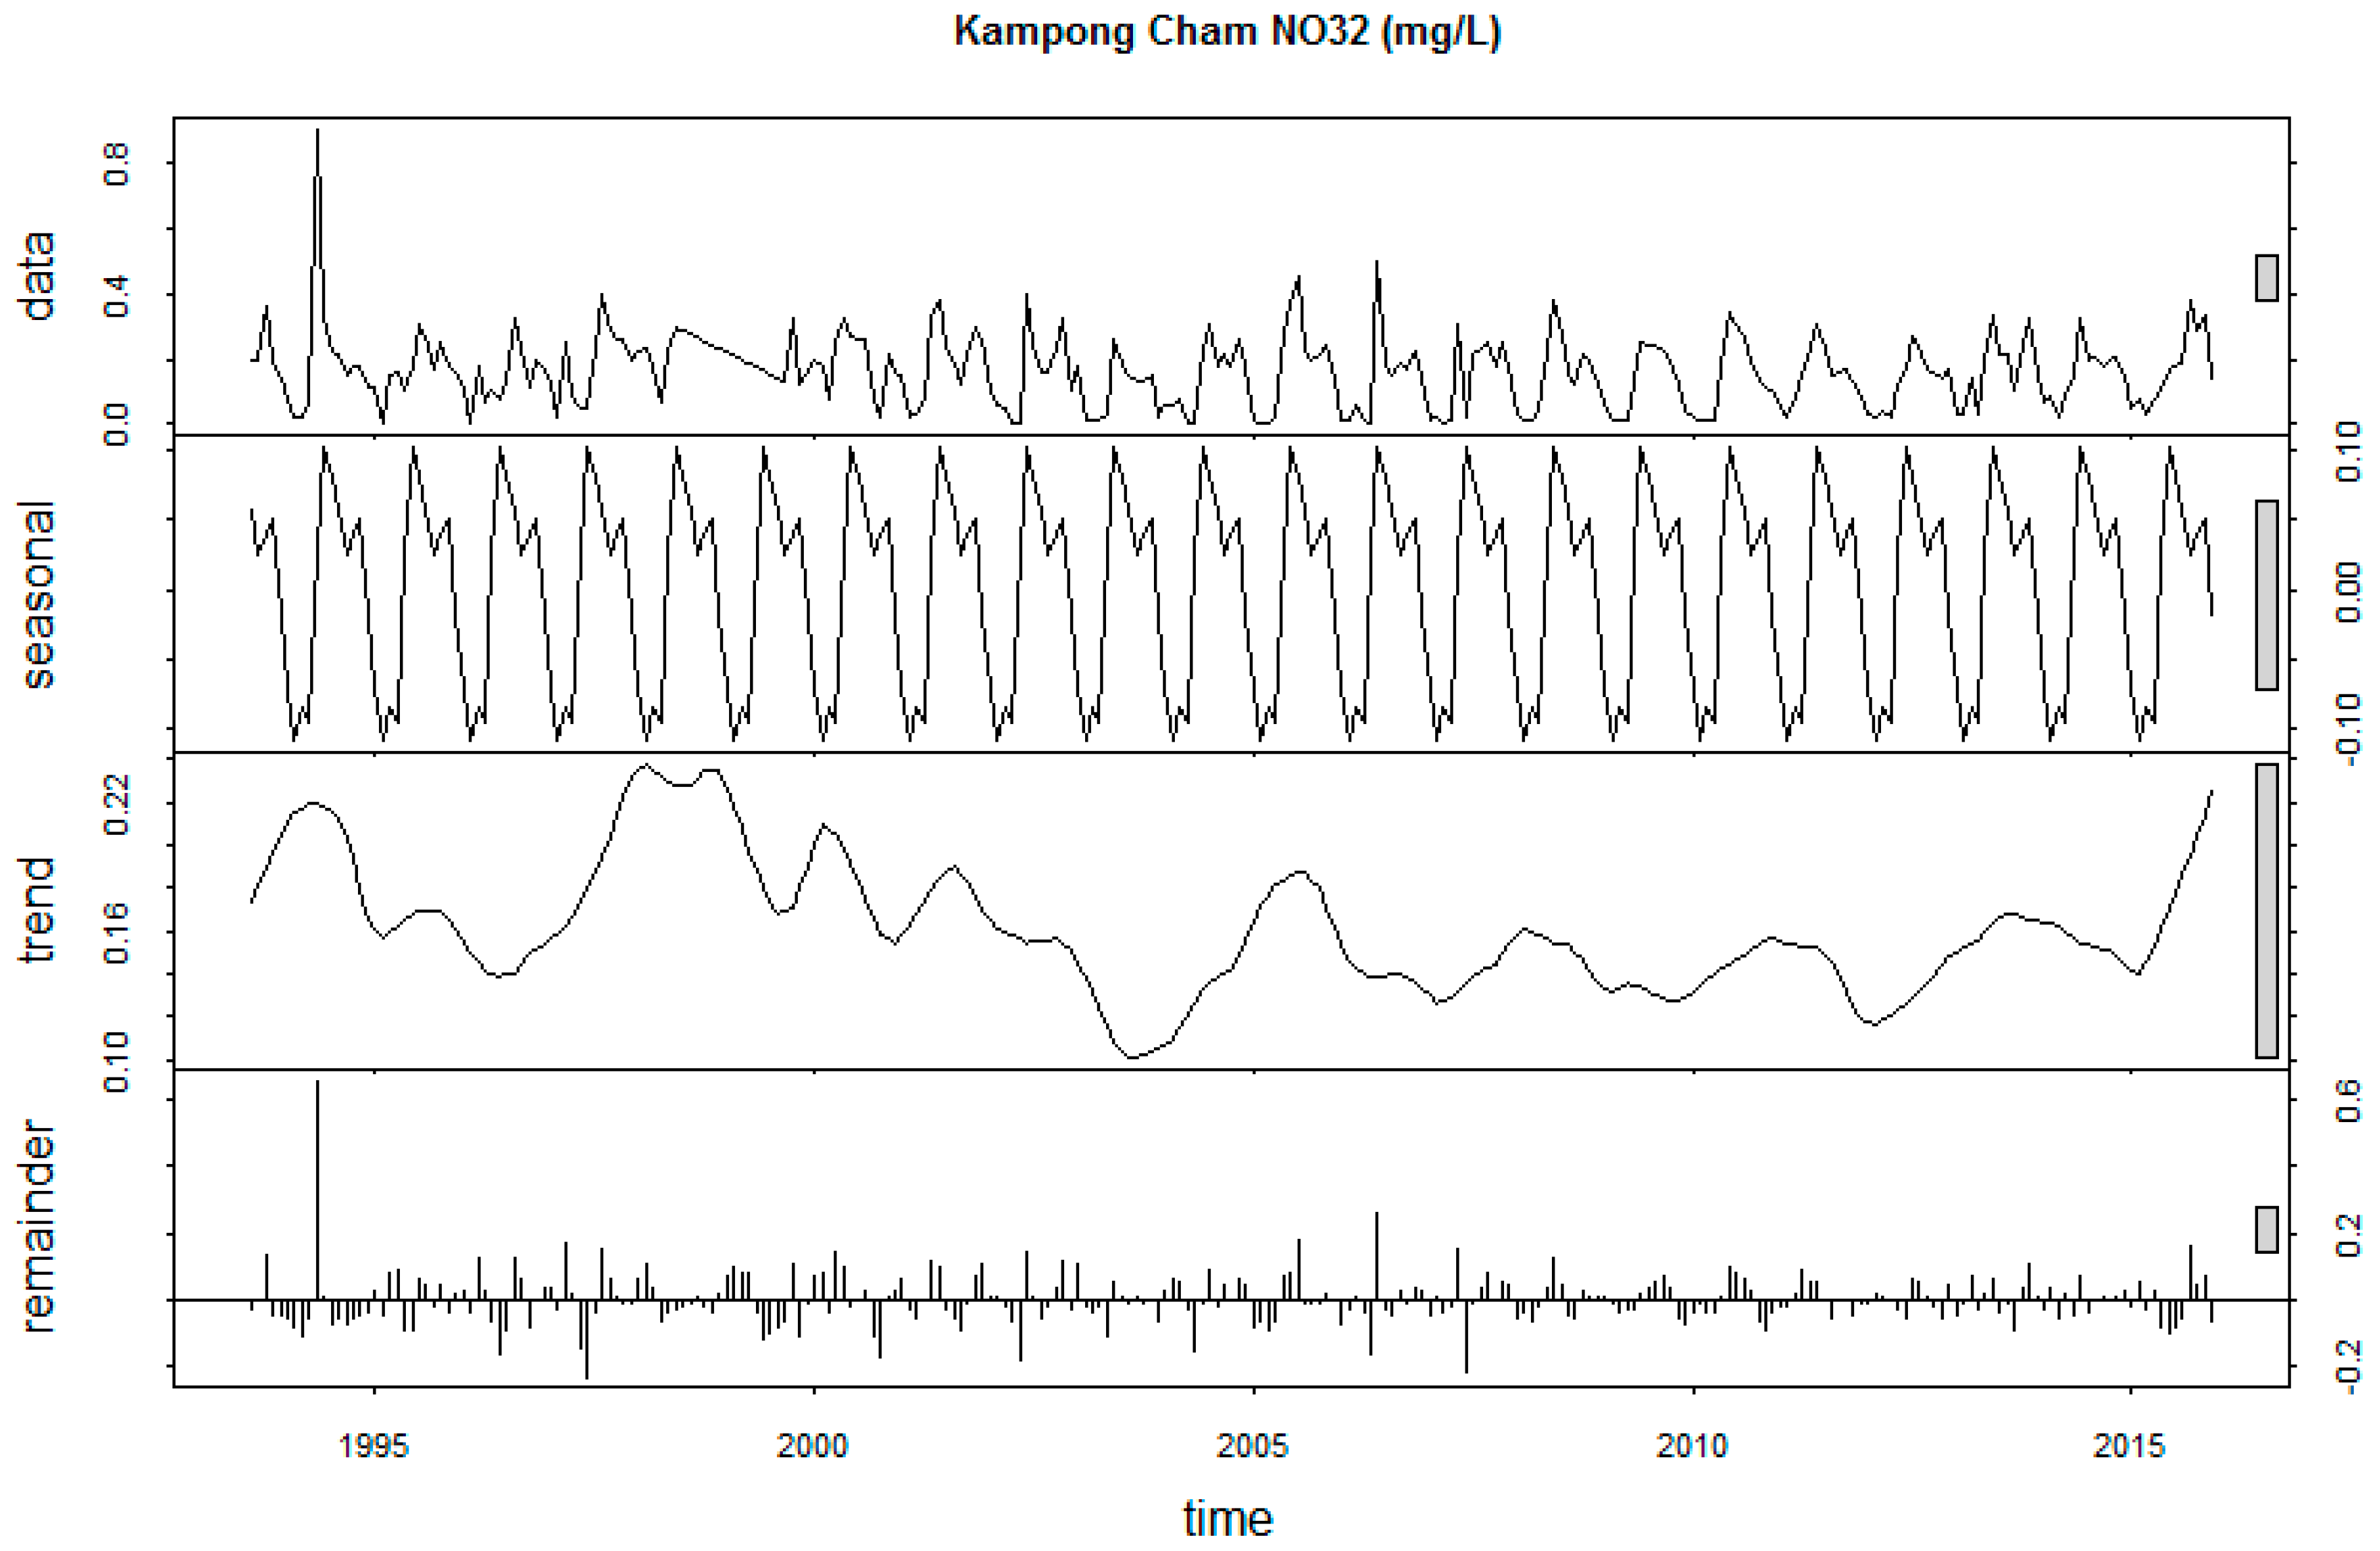
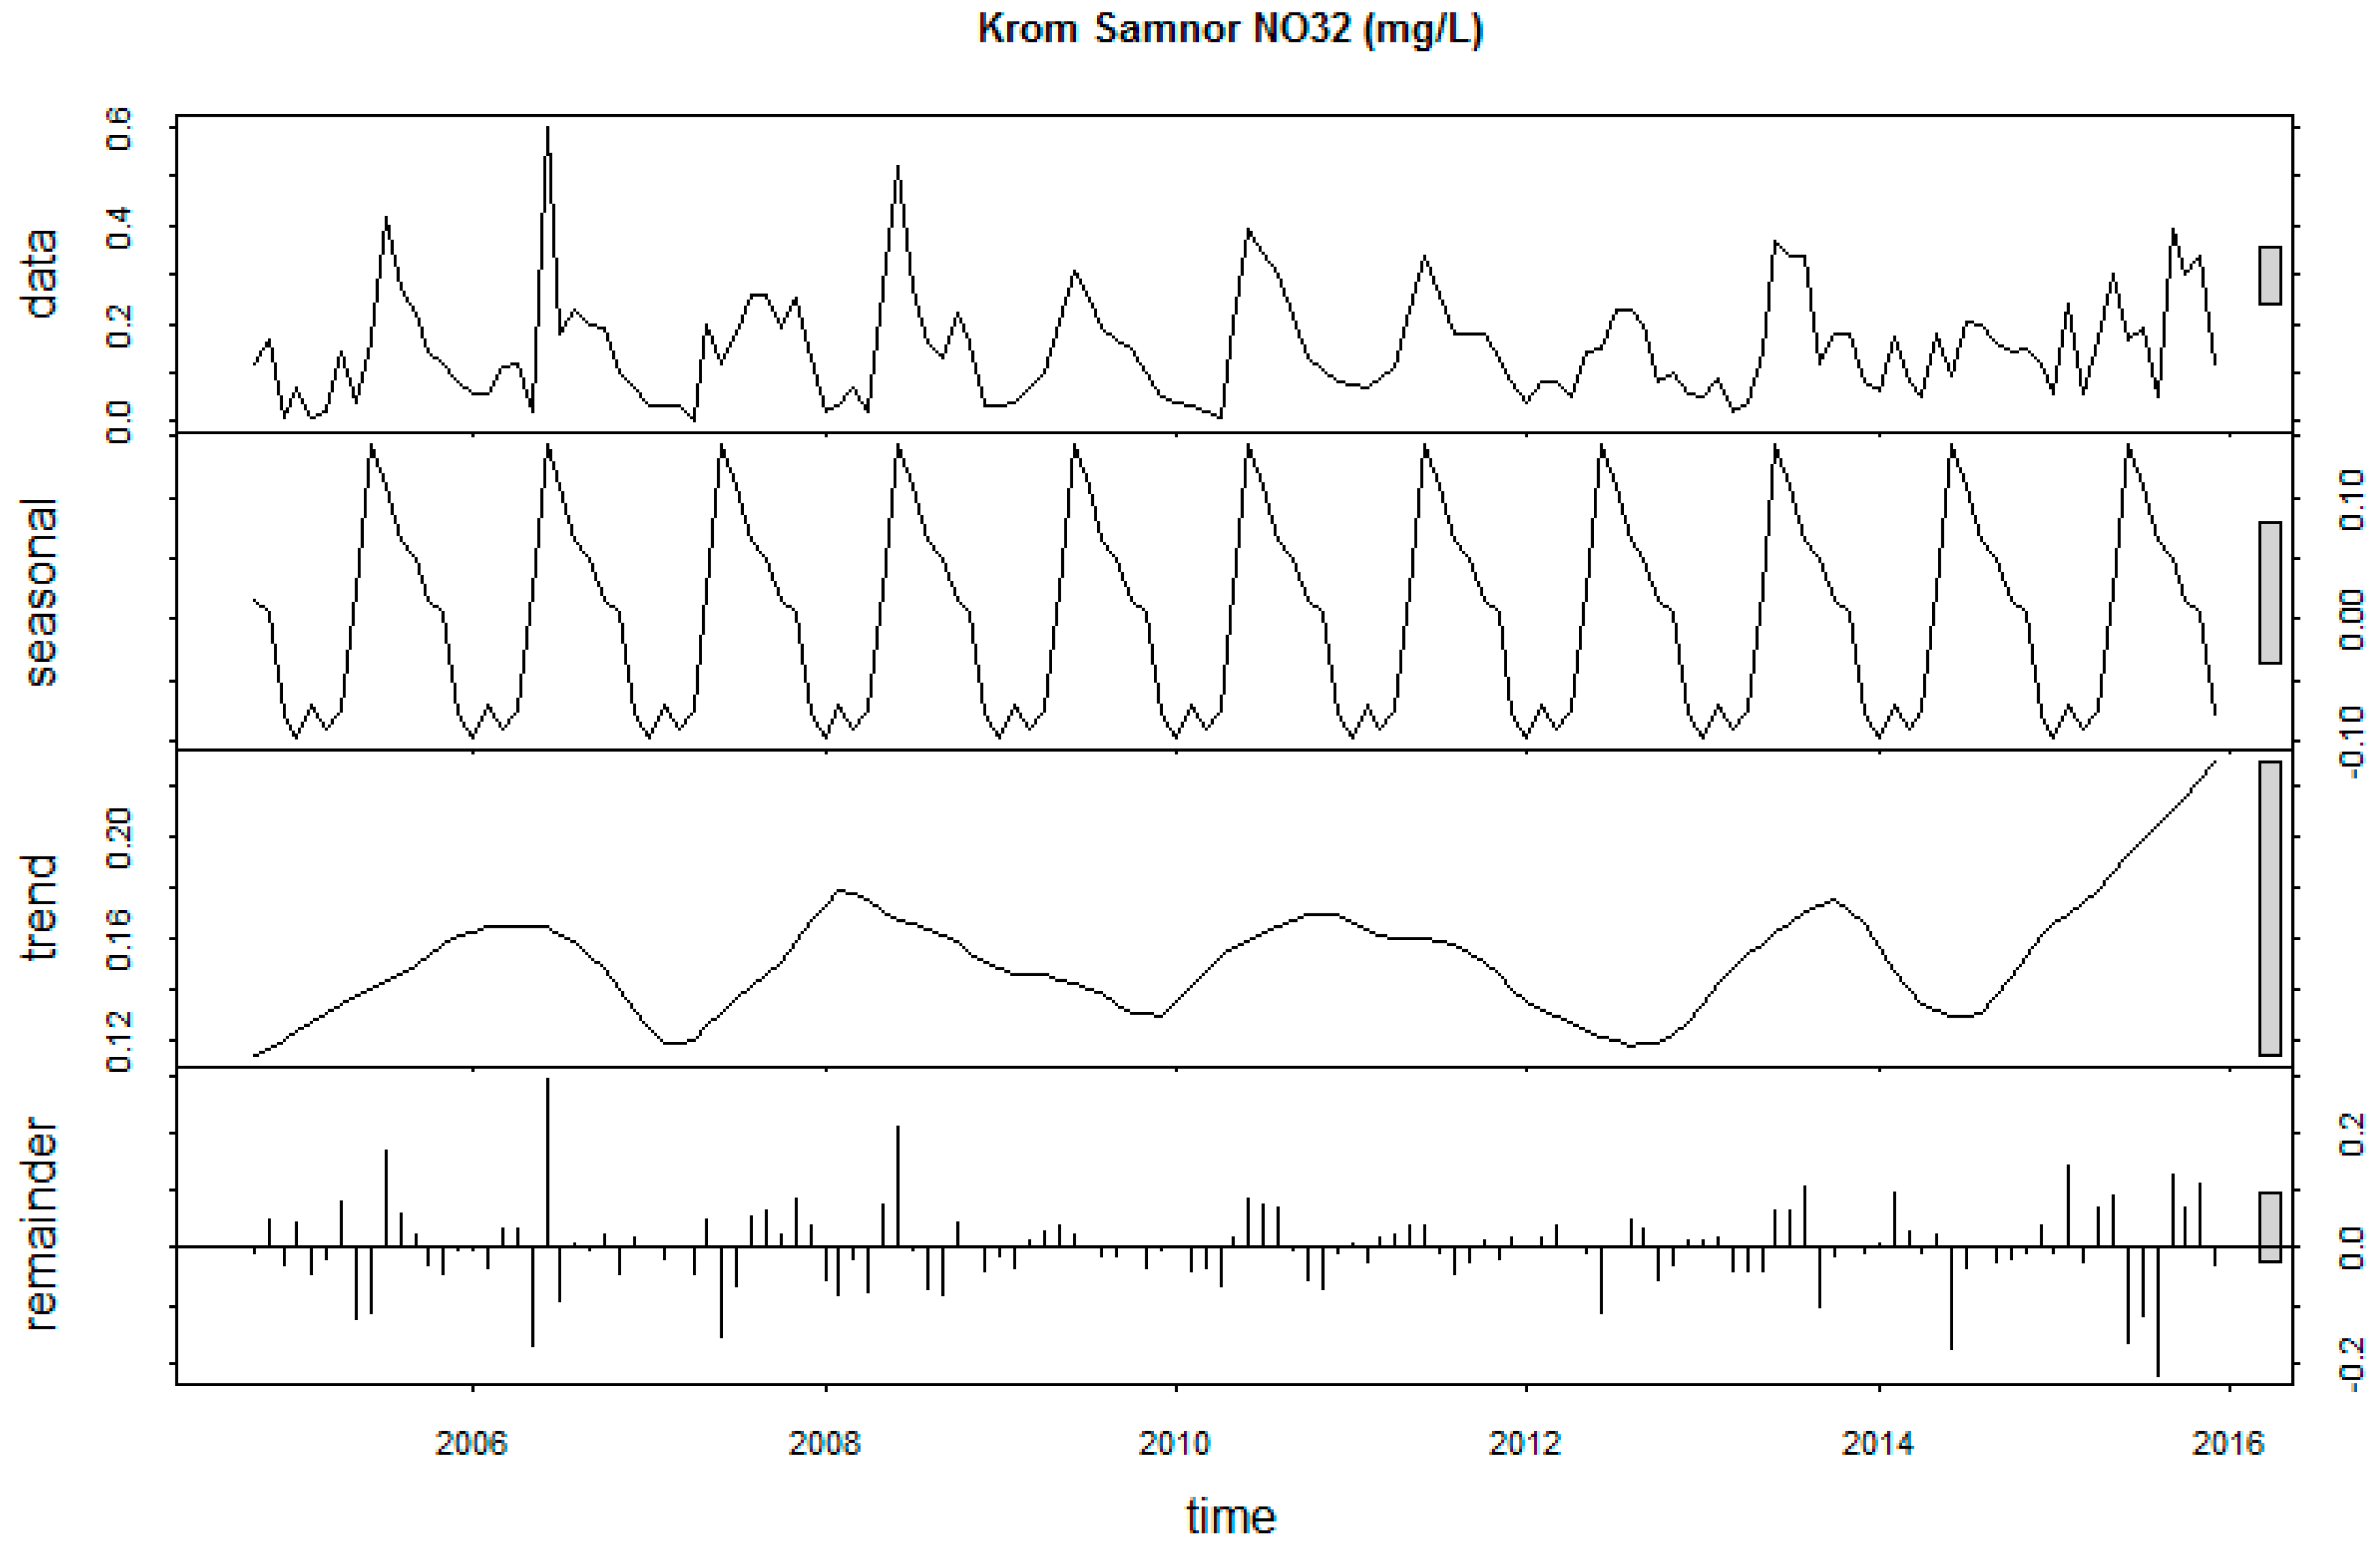
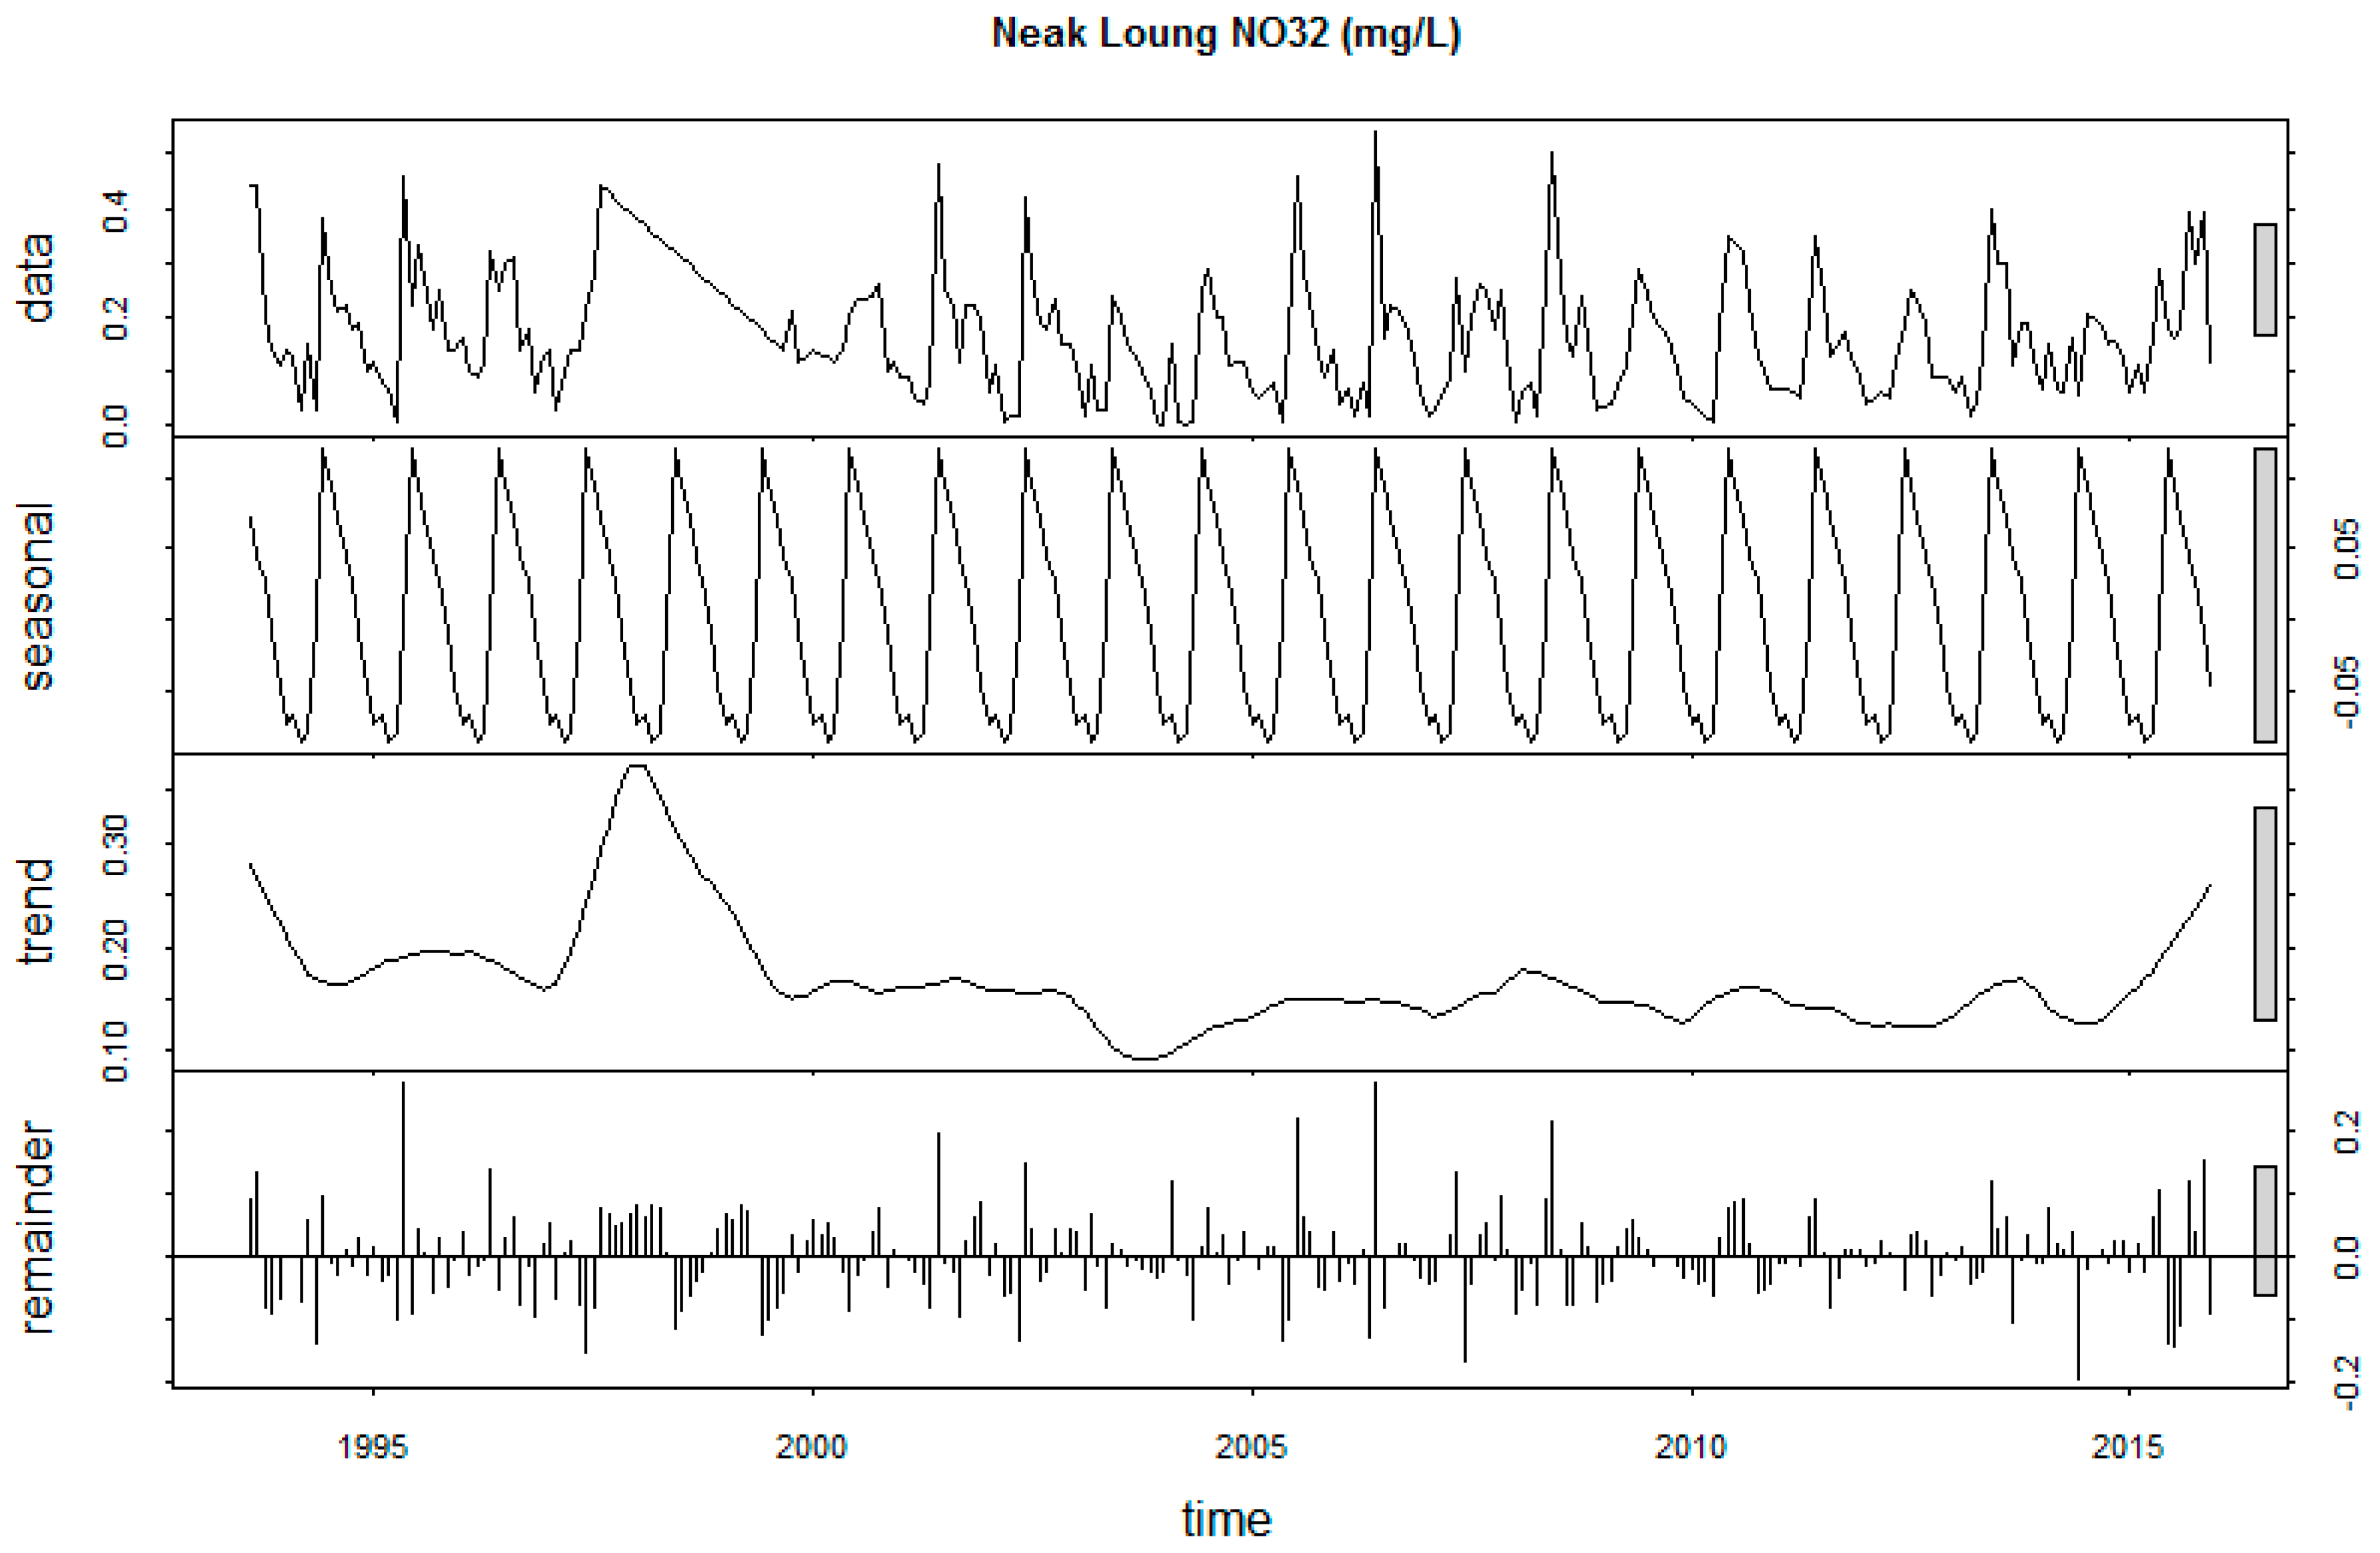
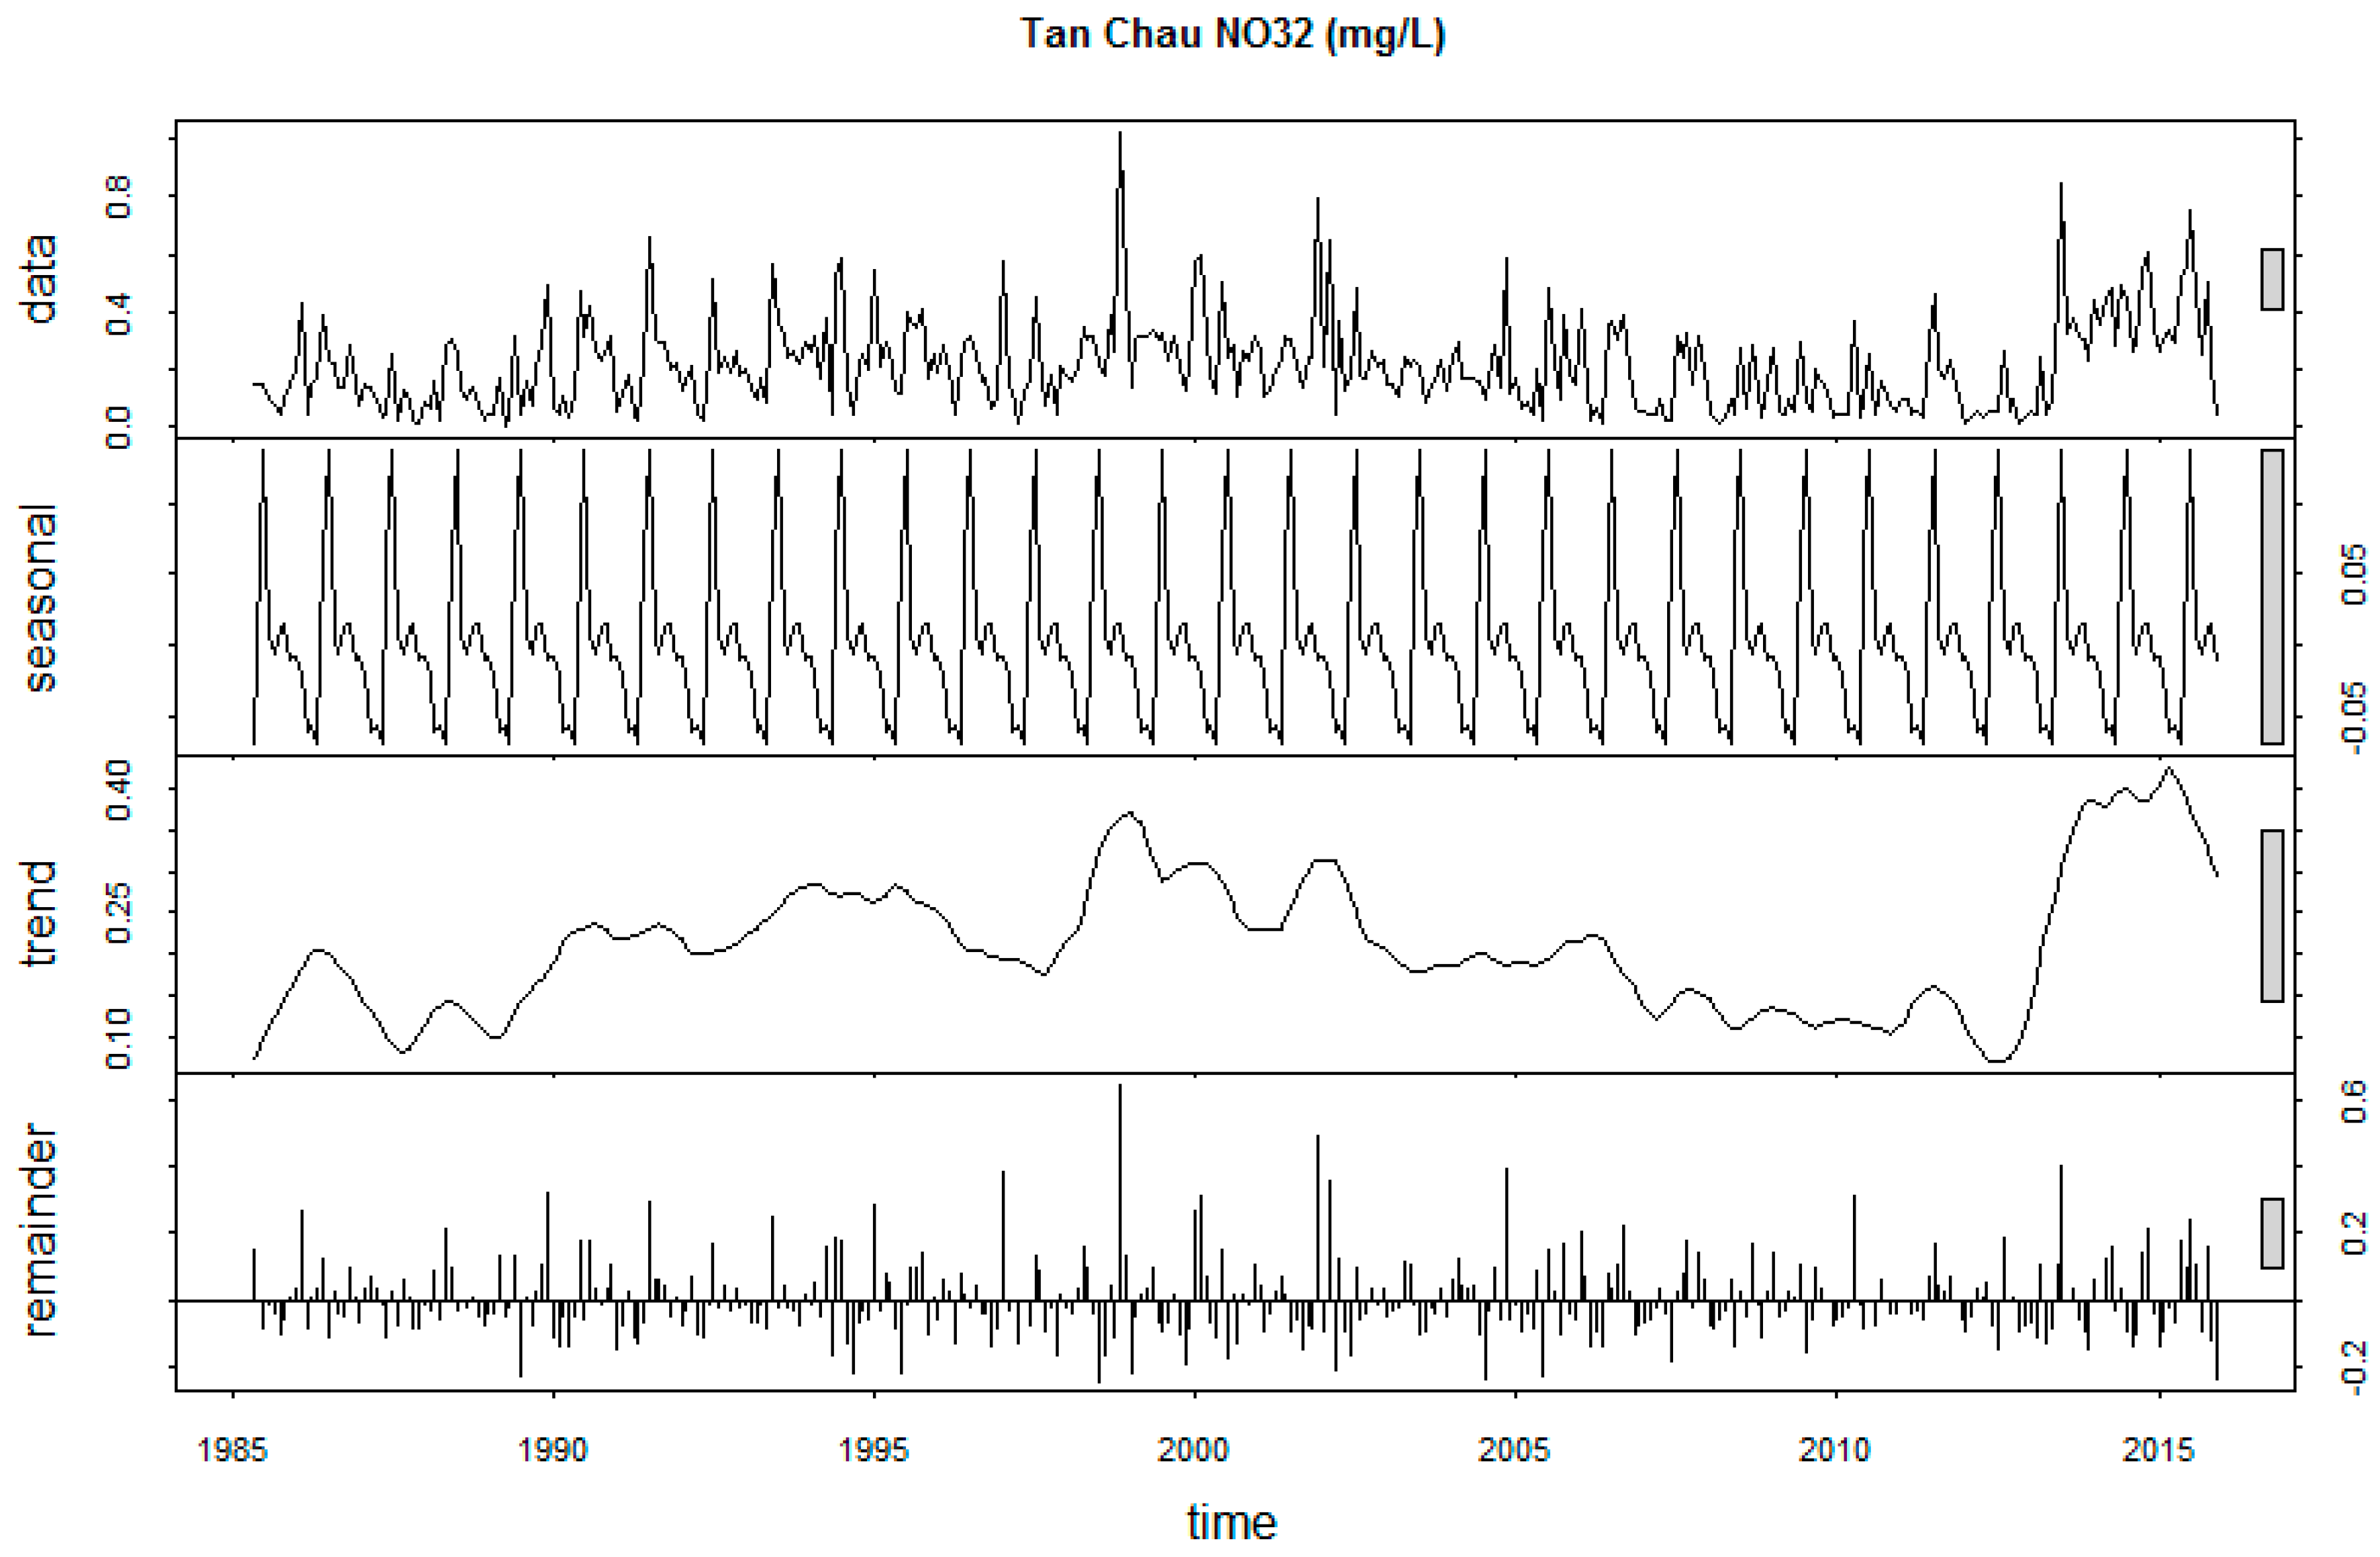
3.3.2. Seasonal Decomposition of Nitrate Time Series

Unlike patterns detected for TSS, historical trends for nitrate do not appear to be driven by geography. Results of the decomposition show no increasing or decreasing trend patterns. Figure 7a,b shows trends detected for nitrate in the upper part of the basin, where patterns of reversal were displayed during the monitoring period. While Figure 8 reveals a strong correlation of nitrate levels to both discharge (WNP (r = 0.74, p < 0.01) and WST (r = 0.39, p < 0.01)) and TSS (WNP (r = 0.67, p < 0.01) and WST (r = 0.38, p < 0.01)), their historical trends following the removal of seasonal influence do not mirror those detected for TSS (Section 3.3.1). This evidences the complexity of instream nitrate transport processes in the LMR. Previous studies on the dynamics of instream nitrate processes have shown a dependence of instream concentration on factors such as LULC and their management, nitrogen input and output ratio, characteristics of local meteorology and geohydrology, and nitrification processes [61].
In the lower part of the basin, the average mean annual concentration of nitrate was 0.1 mg/L, but the concentrations were highly variable, ranging from non-detectable to over 1 mg/L. This section of the basin is dominated by paddy fields and urban areas (Figure 3), the two types of LULC that have been linked to significant levels of instream nitrate concentration in this study (Section 3.2.2) and other studies (Section 1). Across the lower part of the river, temporal trends vary from station to station (Figure 7c,d and Appendix D) and appear to be influenced by different LULC types and agricultural practices. The most notorious increasing trend occurred at Kraorm Samnor (WKS) (Appendix D), where approximately 90% of the sub-basin is dominated by paddy fields (Figure 3). The finding is consistent with other studies, where catchments dominated by agricultural land use and subjected to agricultural intensification are known to yield high instream nitrate concentration [47].
Seasonality appears to be one of the main factors influencing instream nitrate levels in the LMR. Similarly to TSS, the seasonal component shows equal intervals of cyclic behavior of the time series, with distinct annual increasing and decreasing patterns coinciding with the beginnings of the Wet and Dry seasons, respectively. The seasonality of the nitrate time series is also confirmed by its strong statistical correlation with those of discharge and TSS (Figure 8), the two main indicators of seasonality.

3.4. Seasonal Mann–Kendall Analysis of Historical Water Quality Time Series

With the confirmed seasonality of the TSS and nitrate time series (Section 3.3), temporal trend analyses were carried out by SMK at the 14 stations, where downward trends of TSS were detected at all but one station located in the upper part of the LMB, from 1985 to 2015 (Table 3). The only upward trend obtained in this section of the basin was at Savvanakhet (WSK) (z-value of 0.01), though not statistically significant (p = 0.88). For the other six stations where downward trends were detected, their p-values (<0.05) indicate that the changes observed were statistically significant. The results provided by the SMK further support the outcomes of the STL analysis in Section 3.3.1, and confirm that changes in TSS levels in the upper part of the basin were statistically significant and that dam operation in the basin has led to the reduction of TSS levels at these stations.
The results of the SMK analysis appear to confirm that the dams operating in the UMB have not affected TSS levels in the lower part of the basin. Of the seven stations included in this study, four displayed no change or upward historical trends. Significant upward trends were detected at WTC (p < 0.01), located in the MD. The patterns observed also suggest that suspended sediments generated in the UMB, while important to the instream sediment dynamics of the LMR, rarely reached the lower part of the basin, and had very little influence on instream TSS concentrations in the delta area. Rather, instream TSS levels in the lower part of the river are likely influenced by the interaction between LULC, rainfall–runoff factors, and human activities within the basin (discussed in Section 3.2 and Section 3.3). The results are consistent with prior research [62], which reported high TSS levels in the MD due to accumulated upstream sedimentation and localized erosion caused by agricultural activities.
Of the downward trends detected, two were not statistically significant. The historical trend at WKT was the only significant downward trend (p < 0.01). Despite being located in the lower section of the basin, the catchment area of this station exhibited environmental and physical characteristics similar to those of the upper part of the basin, including forest-dominated land cover, hilly topography with strong slopes, and exposure to high-intensity rainfall events during the Wet season. These features, along with human disturbance through LULC practices, have led to an increased sediment runoff, affecting instream TSS concentrations (Section 3.2).
While temporal trends for TSS differ between stations located in the upper and the lower parts of the river (Table 3), changes detected for nitrate levels vary from station to station. Between 1985 and 2015, nitrate levels increased at nine stations, with the biggest increasing trend detected at WLP. The trends observed at this station are likely due to the increase of intensive agricultural activities upstream of the station (See Figure 1a). This region has experienced a change in land use patterns, with areas previously used for subsistence agricultural activities, such as upland rice farming, being converted to intensive agriculture for cash crops, such as banana, maize, and sugar canes [15]. While there is no information on the use of fertilizer in the region, nitrogen-based fertilizers have been known as necessary input for these cash crops to optimize yield [63]. Of the nine stations showing increasing nitrate trends, changes at six stations were statistically significant (p < 0.05), including the one detected at WLP. Similar patterns of elevated nitrate levels were also revealed at stations located downstream of densely populated areas, including WVT and WTC [62], and can therefore be attributed to increased urbanization. Downward trends, though not statistically significant (p > 0.05), were observed at five stations.

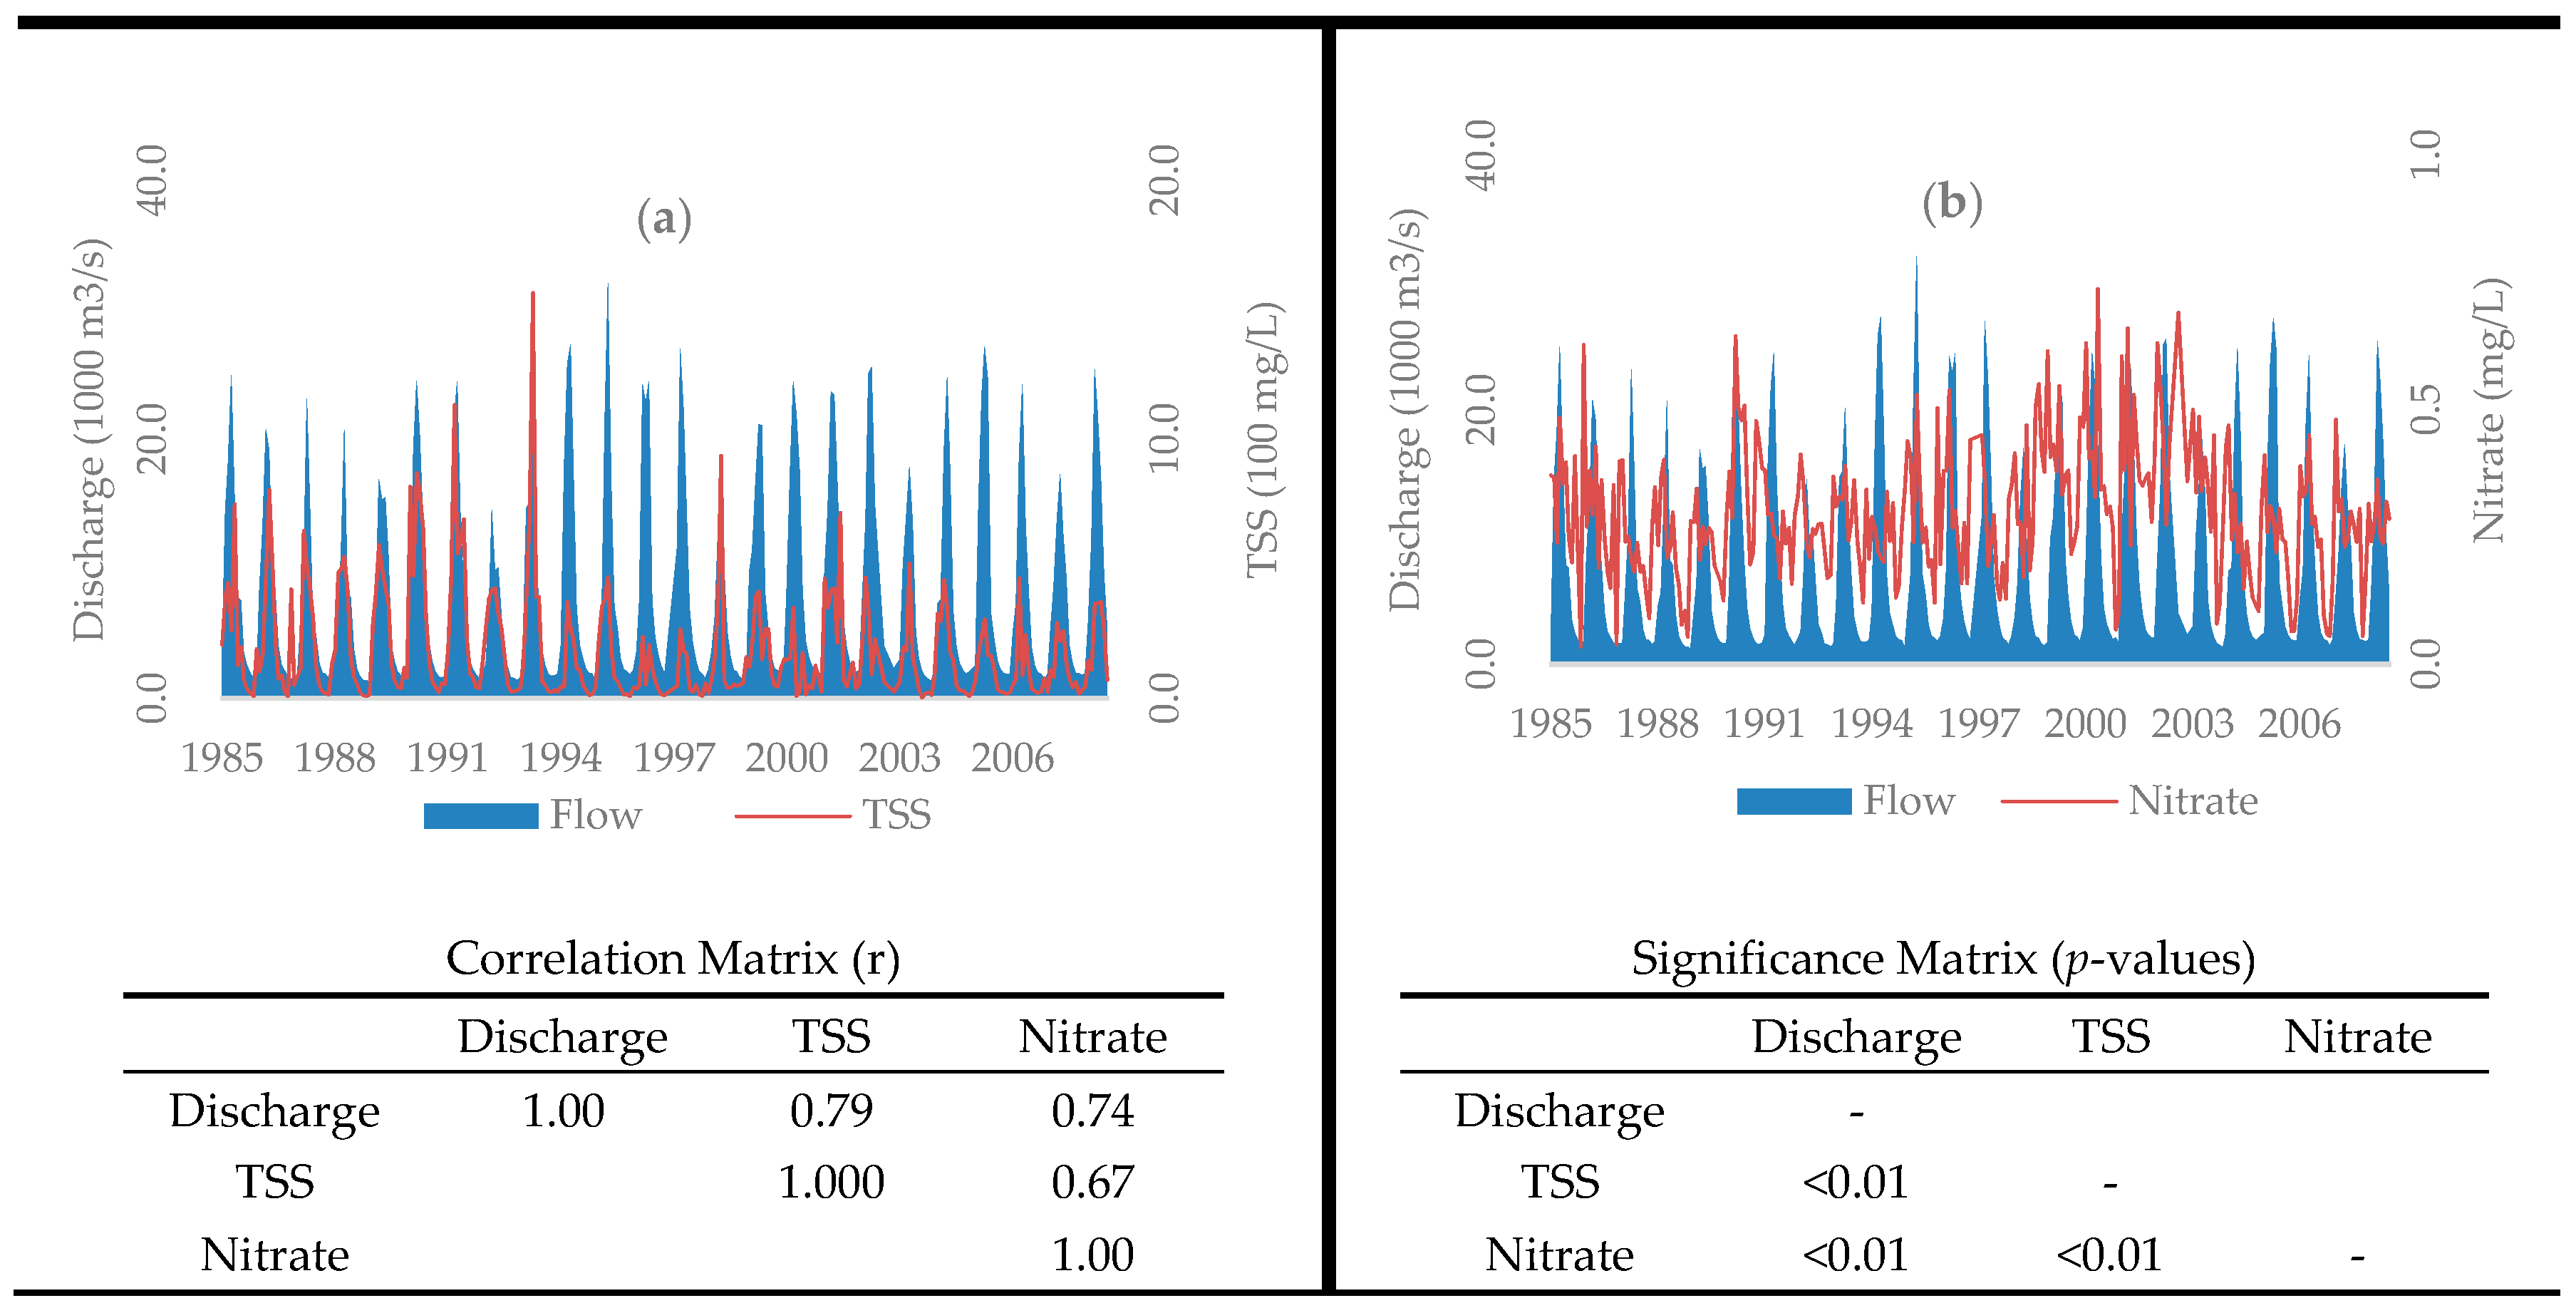
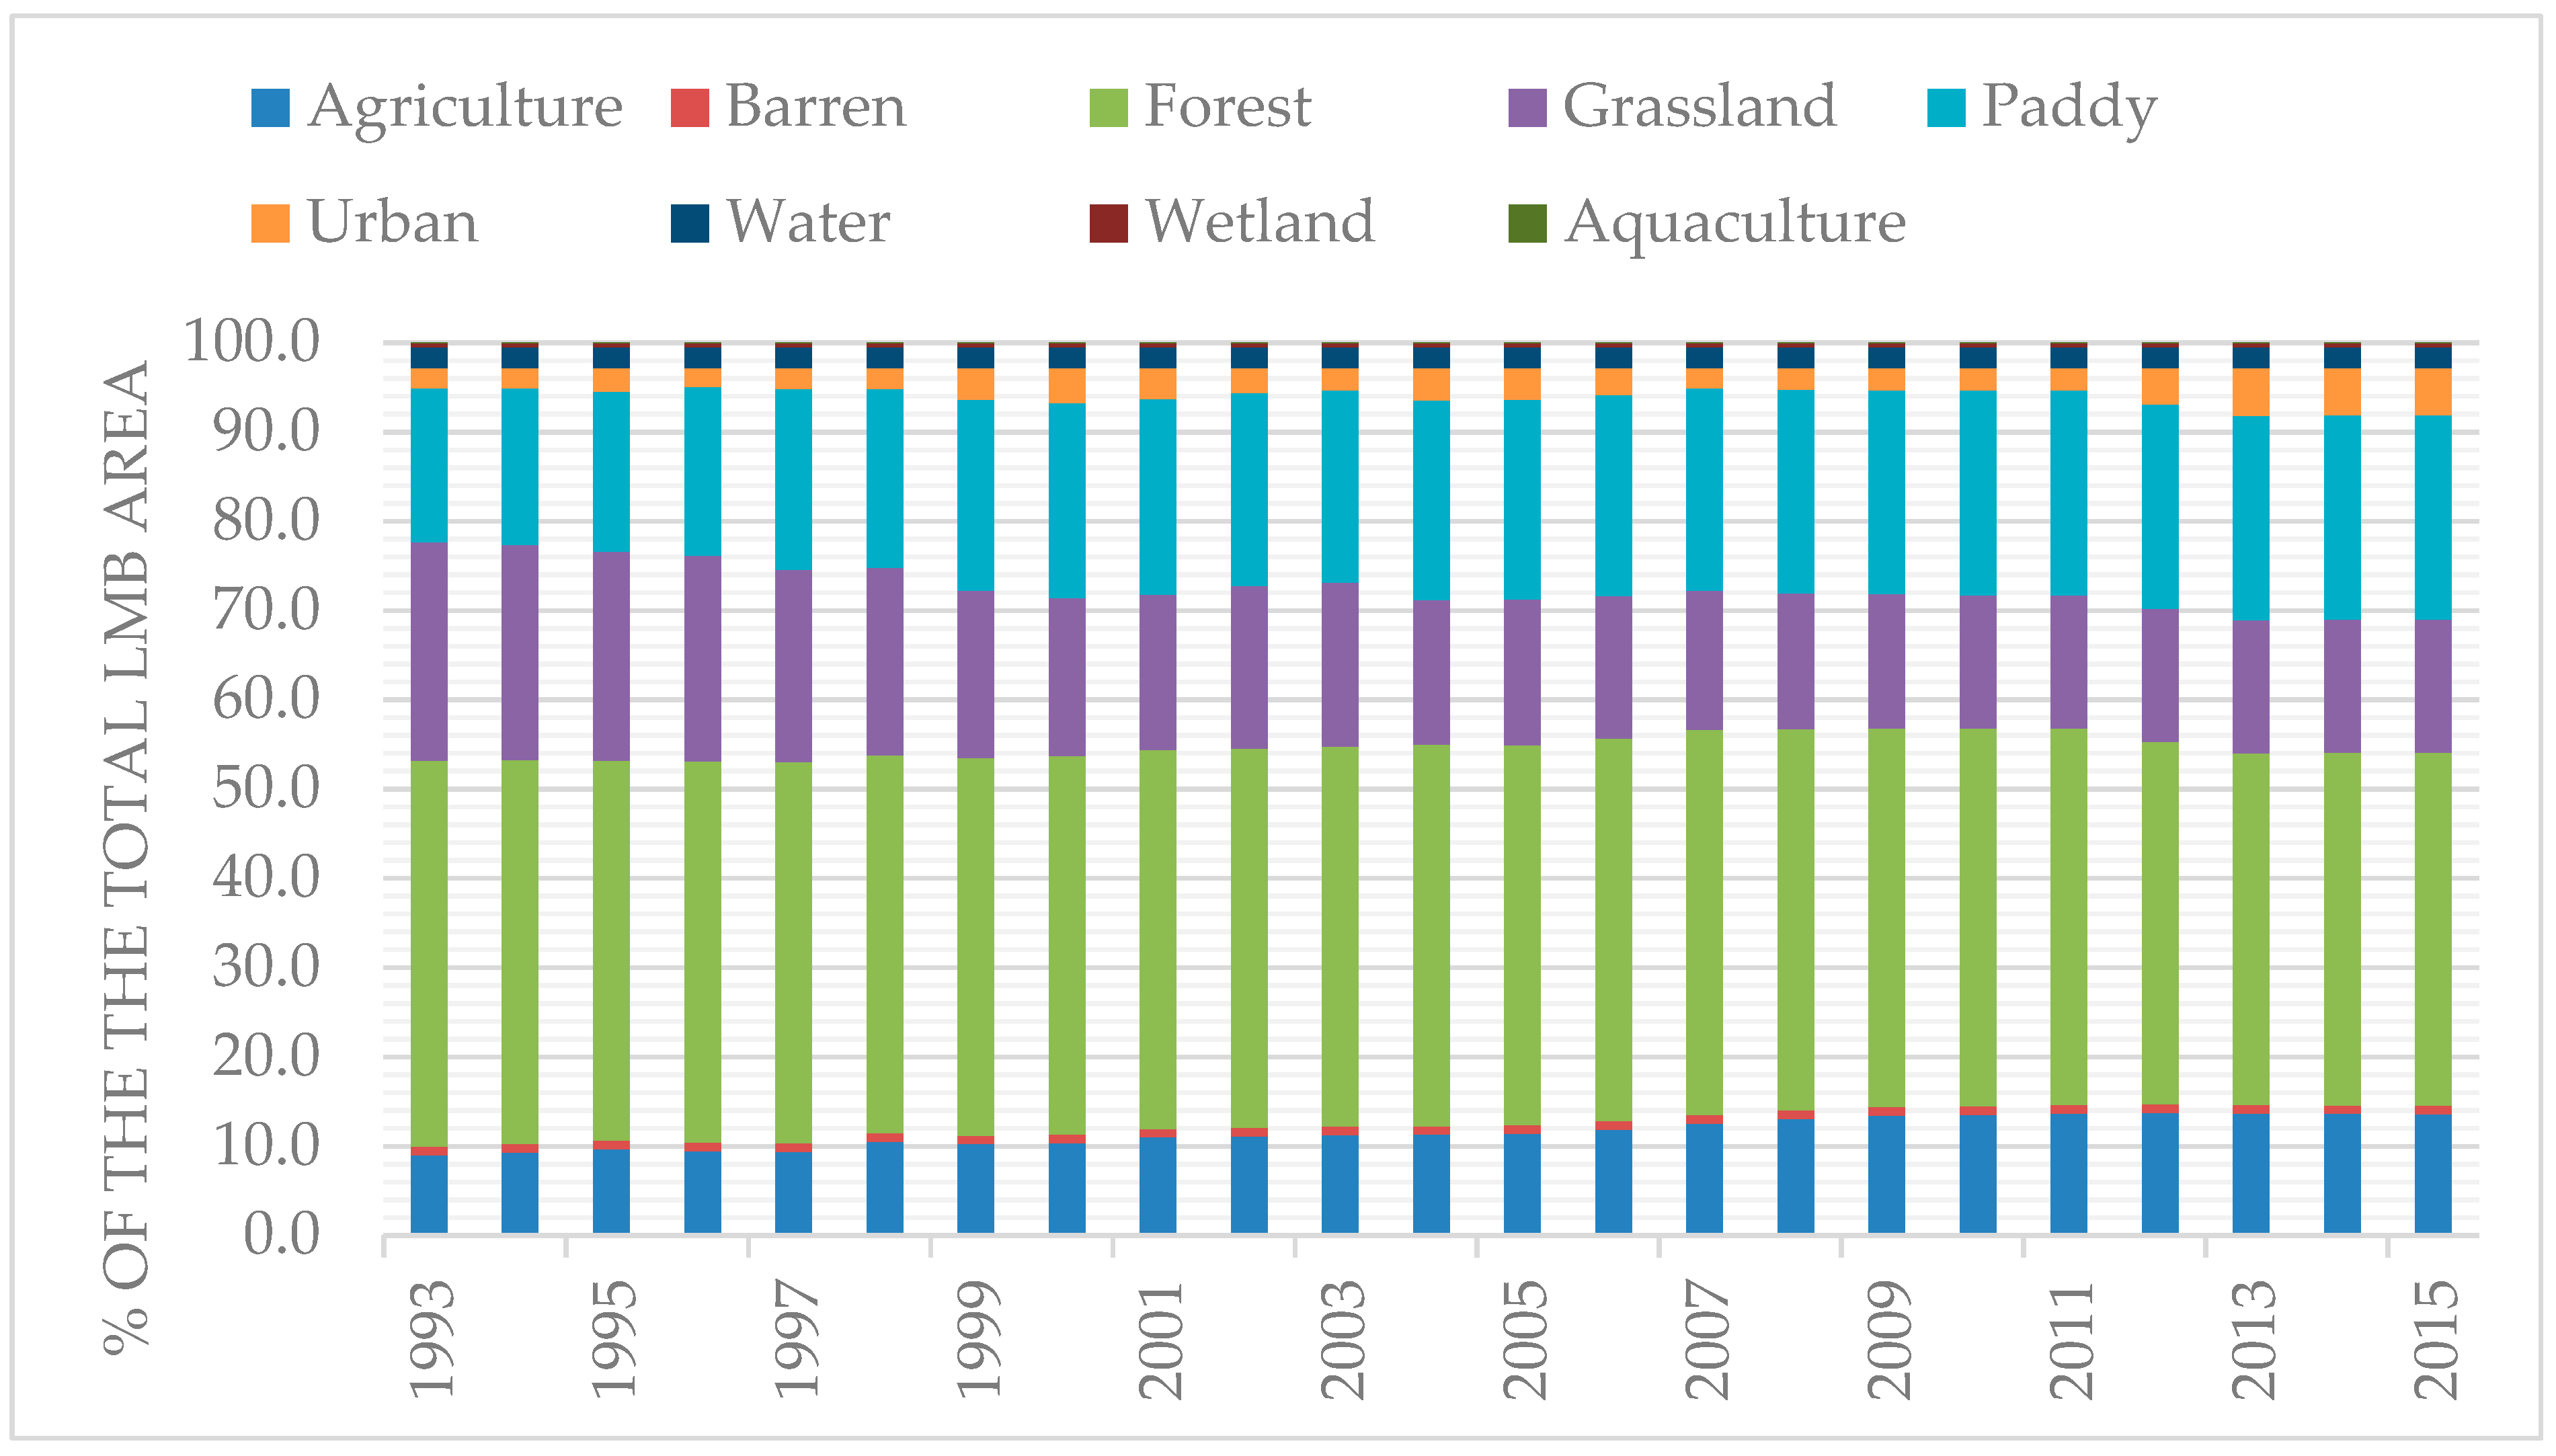
3.5. Temporal Relationships between Land Use Change and Proxies of Water Quality

To ascertain whether temporal changes in LULC influenced TSS and nitrate levels, Pearson’s correlation analyses were carried out at Vientiane Sub-basin (SVT) using available data from 1993 to 2015. SVT was selected as the representative of the LMB dynamics due to the rapid changes of LULC composition stemming from its increased economic growth, with an average annual GDP growth rate of 7.1% (highest among the four Lower Mekong Countries) during the time period analyzed [64]. Moreover, the main land cover types of the sub-basin were forest, grassland, and agricultural areas (Figure 9a), though their proportions changed from 1993 to 2015. Grasslands were reduced by 13.7% from 1993 to 2015, whereas areas of agriculture, paddy fields, forest, and urban expanded during the same period. Urban growth was the most significant, with a 600% increase with respect to the area recorded in 1993. This is consistent with prior research [65], that found an 11% annual growth rate (2005 to 2015) of Vientiane’s population was prompted by the change in the government anti-urban policy, and this instigated a new economic mechanism that promoted international trade and free market, resulting in an increase of industrialized activities and in-migration [65]. Despite the rapid growth of the urban population, the results of the Pearson’s correlation analysis show that urbanization was not detrimental to agricultural land, paddy fields, and forest areas. Urban expansion appears to mainly affect grasslands (p < 0.01 and r > −0.70) (Figure 9b), and it confirms the findings of a prior study, which cited rapid urbanization as the cause for the reduction of grassland areas in the SVT [66].
The Pearson’s analysis revealed positive correlations (r > 0.44) between instream nitrate concentrations and agriculture, paddy field, urban, and wetland land use types, while negatively associated with grassland (r = −0.61) (Figure 9b). With p < 0.01, these relationships were significant, suggesting these LULC types as the contributors to the nitrate levels observed at WVT (located in the Vientiane sub-basin, see Table 1). Specifically, the increase of urban (+ 615%) and agriculture areas (+17.5%) at the expense of grasslands (−13.7%) has led to increased instream nitrate levels. The association of nitrate levels with agriculture and urban land covers is consistent with findings from prior research [66,67,68,69]. Furthermore, rapid urbanization has been known to increase instream nutrient levels, particularly in areas with poor sewage treatment [70]. During the study period, mean annual concentrations of nitrate were 0.25 mg/L, with the minimum and maximum ranging from 0.06 to 0.39 mg/L, respectively. Factor analysis of the time series data revealed different clusters of concentrations (Appendix E). Specifically, from 1993 to 1998, nitrate levels were lower than average, and that coincided with a higher percentage of grassland cover, which can prevent nitrate runoff to the river [71]. As the areas of grassland decreased, instream concentrations of nitrate increased (Appendix E). From 2004 onwards, nitrate concentrations became positively correlated with agriculture, paddy fields, and urban areas (Appendix E). During this period, mean annual concentrations of nitrate increased, reaching the maximum value at 0.39 mg/L in 2012. In 2013, the government issued a Strategic Framework for the Development of the Urban Water Supply and Sanitation Sector 2013–2030 [72], which may explain the negative association between the extension of urban areas and nitrate levels between 2012 and 2015. Of note is that, in the 1990s, Vientiane had an annual population growth rate of 3.1%, yet this annual growth rate translated into an increase in areal extent of urban land cover of only 6% over the same time period [73]. This suggests densely populated areas as characteristic of urban development of Vientiane, which prior research [72] found had poor sewerage coverage. The latter may explain the temporal association observed between nitrate levels and urban land use during the 1990s (Appendix E).
The temporal relationships between LULC and TSS at WVT are shown in Figure 9b; from 1993 to 2015, TSS exhibited significant negative associations (p < 0.01) with forest (r = −0.72), agricultural (r = −54), and paddy field areas (r = −0.49), while a positive association was observed between TSS and grassland (r = 0.63 and p < 0.01). The results suggest that changes in forest, grassland, and agricultural areas were the driving forces of the changes observed in TSS levels during this period. The temporal relationship detected between forest and TSS aligns with results from previous studies, which argued that increases in vegetation cover can generally lead to a decrease in soil erosion [74,75,76]. While the relationship between urban land cover and TSS is very weak (p = 0.36), it nonetheless support findings of previous research [77] where urban land cover yielded less TSS than other land cover types. Urbanization tends to increase impervious surface area and, consequently, to reduce erosion and sediment runoff during rainfall events [78]. However, in the LMB, urbanization does not necessarily increase impervious surface, as unpaved roads and bare land continue to exist in many cities including Vientiane, as illustrated in Appendix F. This could be a factor weakening the relationship between urban land cover and TSS in SVT.

4. Conclusions

This research set out to explore the spatiotemporal relationships between LULC and water quality of the LMR using TSS and nitrate as proxies for water quality indicators. This information is vital to assess the impact of socioeconomic drivers and pressures on freshwater sources of the region.
Historical time series of TSS and nitrate at 14 water quality monitoring stations and their associations with multi-temporal information on LULC evidence that the water quality of the LMB is influenced differently by LULC types over time and space.
At the temporal scale, the analysis of 30 years of data revealed that instream TSS concentrations exhibited decreasing trends at nine of the 14 stations considered, while an increasing trend was detected at one station. For instream nitrate concentrations, temporal changes varied from station to station, with significant increasing trends detected at five stations of the upper section of the LMB. Instream concentrations of nitrate and TSS were highly correlated with the river discharge and exhibited clear seasonality patterns, and their historical trends appear to be related to the distinctive wet and dry seasons of the region. In contrast, the primary drivers of change appear to be human disturbance through land use practices and instream infrastructure development. Our results evidence, for example, that decreases in TSS levels at stations located in the upper section of the LMR coincided with the operation of the Manwan Hydropower. The operational influences of the mainstream dams located in the UMB on TSS appear to be less profound at stations located in the MD, as these stations exhibited increasing trends during the same time period.
Temporal analyses of the time series data for the Vientiane sub-catchment (SVT in Section 3.5) further confirmed the influence of land use practices. At the SVT, the proportion of forest, agriculture, and urban land cover types increased from 1993 to 2015, while the opposite trend occurred with grasslands. These dynamics of LULC change coincided with decreased instream TSS levels, and our analysis shows a positive relationship between instream TSS and grassland, but significant negative relationships with agriculture, forest, and urban land use types. Conversely, the historic trend of instream nitrate concentration increased, suggesting that the increased level was driven by the expansion of urban and agricultural areas at the expenses of grasslands. These changes appear to increase nitrate-laden runoff in the basin, while, at the same time, reducing the basin’s natural filtering capacity.
At a spatial level, the values of year 2010 for the proxies representing water quality were compared with the 2010 LULC surface areas. The results (Section 3.2.2) suggest that as the proportion of forest areas increased, instream concentrations for both TSS and nitrate also increased. For nitrate, its instream concentrations also increased as the proportion of grassland increased. These results contradict findings from other studies and suggest that water quality of the LMR is influenced by LULC and other factors, such as soil, topography, hydropower development, and land cultivation practices. TSS and nitrate levels were highest in sub-catchments dominated by forest land cover, steep slopes, and easily erodible soil types, as well as those exposed to intensive shifting cultivation practices involving vegetation clearance at the onset of the Wet season.
The strong relationships found between mean slope percentages of sub-catchments and instream concentration of TSS and nitrate suggest that the detachment and runoff of sediment-laden nutrients from forest-dominated areas led to increases of instream concentrations of these water quality indicators. These results confirmed that a combination of landform, topography, and human disturbances through land use practices influenced the instream levels of TSS and nitrate.
Identifying factors influencing changes in the condition of water quality is vital for sustaining development of land and water resources, particularly in the context of the LMB, where development is undertaken at an unprecedentedly rapid pace. This study has enhanced understanding of spatiotemporal dynamics and relationships between LULC and water quality in the LMB, and can advance knowledge on how water quality of the LMR may be protected through appropriate land use planning and development interventions.

Author Contributions

Conceptualization, K.L., G.M., and L.M.; methodology, K.L. and G.M.; validation and formal analysis, K.L. and L.M.; investigation, resources, and data curation, K.L.; writing—original and revised draft preparation, K.L.; review and editing, G.M. and L.M. All authors have read and agreed to the published version of the manuscript.

Funding

This research received no external funding.

Acknowledgments

This research is supported by an Australian Award Scholarship for Kongmeng Ly.

Conflicts of Interest

The authors declare no conflict of interest.

Appendix A

LULC categories as defined by the MRC and ESA, and their aggregation into nine LULC types for this study (LULC classified as others (category number 10) was not used in this study).
Table A1. Land use classifications.
Category No.LULC Types (Parameters)MRC 2010 LULC DataESA Global Land Cover Data
(1993–2015)
1AgricultureAnnual cropCropland (rainfed)
Industrial plantation
OrchardMosaic cropland/vegetation
Shifting cultivationMosaic vegetation/cropland
2Paddy fieldsPaddy riceCropland (irrigated)
3AquacultureAquaculture-
4Barren LandBare soilBare area
5ForestBamboo forestBroadleaved evergreen
Coniferous forestBroadleaved deciduous
Deciduous forestNeedle-leaved evergreen
Evergreen forestNeedle-leaved deciduous
Flooded forestMixed leaf type
Forest plantationMosaic tree, shrub/HC
-Mosaic HC/tree shrub
6GrasslandGrasslandShrubland
ShrublandGrassland
7UrbanUrban areaUrban area
8WaterWater bodyWater bodies
9WetlandMangroveTree flooded, fresh water
Marsh/Swamp areaTree flooded, saline water
-Shrub or herbaceous flooded
10 *Others *-Lichens and mosses
-Permanent snow and ice
-No data
*: LULC classified as others (category number 10) was not used in this study.

Appendix B

Figure A1. Proportion of annual land use/land cover of the entire LMB from 1993 to 2015.
Sustainability 12 02992 g0a1

Appendix C

The percentages of each soil type in the defined sub-basin are shown in Table A2.
Table A2. Soil characteristics of each sub-basin of the Lower Mekong Basin.
Sub-basinsAcrisolCambisolGleysolLeptosolLuvisolWaterOthersTotalCharacteristic of the Dominant Soil Type
SCS49%25%1%2%11%0%12%100%Low fertility; susceptible to significant erosion once vegetation cover is removed; very acidic, especially on the surface horizons
SLP66%16%-1%3%0%14%100%
SVT60%18%0%0%4%1%17%100%
SNP80%10%2%0%1%1%6%100%
SSK50%16%1%8%7%1%17%100%
SKC70%13%0%3%2%1%10%100%
SPS64%1%4%0%7%2%24%100%
SST49%31%3%2%4%3%9%100%
SKT68%8%4%4%1%1%14%100%
SKA29%-3%15%17%22%15%100%
SCC50%14%10%9%5%4%9%100%
SNL55%28%7%--8%3%100%
SKS65%14%5%--6%10%100%
STC47%16%17%6%-3%12%100%

Appendix D. TSS and Nitrate Time Series Decomposition

Appendix D.1. TSS Time Series Decomposition

The decompositions of TSS time series at the 14 water quality monitoring stations in the Lower Mekong River are shown in Figure A2, Figure A3, Figure A4, Figure A5, Figure A6, Figure A7, Figure A8, Figure A9, Figure A10, Figure A11, Figure A12, Figure A13, Figure A14 and Figure A15.
Figure A2. Decomposition of TSS time series at Chiang Sean Water Quality Monitoring Station (WCS).
Sustainability 12 02992 g0a2
Figure A3. Decomposition of TSS time series at Luang Prabang Water Quality Monitoring Station (WLP).
Sustainability 12 02992 g0a3
Figure A4. Decomposition of TSS time series at Vientiane Water Quality Monitoring Station (Station No. 4).
Sustainability 12 02992 g0a4
Figure A5. Decomposition of TSS time series at Nakhon Phanom Water Quality Monitoring Station (WNP).
Sustainability 12 02992 g0a5
Figure A6. Decomposition of TSS time series at Savannakhet Water Quality Monitoring Station (WSK).
Sustainability 12 02992 g0a6
Figure A7. Decomposition of TSS time series at Khong Chiam Water Quality Monitoring Station (WKC).
Sustainability 12 02992 g0a7
Figure A8. Decomposition of TSS time series at Pakse Water Quality Monitoring Station (WPS).
Sustainability 12 02992 g0a8
Figure A9. Decomposition of TSS time series at Khong Chiam Water Quality Monitoring Station (WST).
Sustainability 12 02992 g0a9
Figure A10. Decomposition of TSS time series at Kratie Water Quality Monitoring Station (WKT).
Sustainability 12 02992 g0a10
Figure A11. Decomposition of TSS time series at Kampong Cham Water Quality Monitoring Station (WKA).
Sustainability 12 02992 g0a11
Figure A12. Decomposition of TSS time series at Chrouy Changvar Water Quality Monitoring Station (WCC).
Sustainability 12 02992 g0a12
Figure A13. Decomposition of TSS time series at Krom Samnor Water Quality Monitoring Station (WKS).
Sustainability 12 02992 g0a13
Figure A14. Decomposition of TSS time series at Neak Loung Water Quality Monitoring Station (WNL).
Sustainability 12 02992 g0a14
Figure A15. Decomposition of TSS time series at Tan Chau Water Quality Monitoring Station (WTC).
Sustainability 12 02992 g0a15

Appendix D.2. Nitrate Time Series Decomposition

The decompositions of nitrate time series at the 14 water quality monitoring stations in the Lower Mekong are shown in Figure A16, Figure A17, Figure A18, Figure A19, Figure A20, Figure A21, Figure A22, Figure A23, Figure A24, Figure A25, Figure A26, Figure A27, Figure A28 and Figure A29.
Figure A16. Decomposition of nitrate time series at Chiang Sean Water Quality Monitoring Station (WCS).
Sustainability 12 02992 g0a16
Figure A17. Decomposition of nitrate time series at Luang Prabang Water Quality Monitoring Station (WLP).
Sustainability 12 02992 g0a17
Figure A18. Decomposition of nitrate time series at Vientiane Water Quality Monitoring Station (WVT).
Sustainability 12 02992 g0a18
Figure A19. Decomposition of nitrate time series at Nakhon Phanom Water Quality Monitoring Station (WNP).
Sustainability 12 02992 g0a19
Figure A20. Decomposition of nitrate time series at Savannakhet Water Quality Monitoring Station (WSK).
Sustainability 12 02992 g0a20
Figure A21. Decomposition of nitrate time series at Khong Chiam Water Quality Monitoring Station (WKC).
Sustainability 12 02992 g0a21
Figure A22. Decomposition of nitrate time series at Pakse Water Quality Monitoring Station (WPS).
Sustainability 12 02992 g0a22
Figure A23. Decomposition of nitrate time series at Stung Treng Water Quality Monitoring Station (WST).
Sustainability 12 02992 g0a23
Figure A24. Decomposition of nitrate time series at Kratie Water Quality Monitoring Station (WKT).
Sustainability 12 02992 g0a24
Figure A25. Decomposition of nitrate time series at Kampong Cham Water Quality Monitoring Station (WKA).
Sustainability 12 02992 g0a25
Figure A26. Decomposition of nitrate time series at Chrouy Changvar Water Quality Monitoring Station (WCC).
Sustainability 12 02992 g0a26
Figure A27. Decomposition of nitrate time series at Krom Samnor Water Quality Monitoring Station (WKS).
Sustainability 12 02992 g0a27
Figure A28. Decomposition of nitrate time series at Neak Loung Water Quality Monitoring Station (WNL).
Sustainability 12 02992 g0a28
Figure A29. Decomposition of nitrate time series at Tan Chau Water Quality Monitoring Station.
Sustainability 12 02992 g0a29

Appendix E

Figure A30. Analysis of mean annual instream nitrate and TSS concentration time series at Vientiane Water Quality Monitoring Station (1993–2005). Relationships between LULC parameters and water quality indicators at WVT showing (a) loading and (b) factor plots illustrating their overall correlations.
Sustainability 12 02992 g0a30

Appendix F

Figure A31. Unpaved road and bare land in Vientiane sub-basin. Unpaved roads and bare land can be commonly seen in the urban area of Vientiane sub-basin. Source: Kongmeng Ly.
Sustainability 12 02992 g0a31

References

  1. Tu, J. Spatial Variations in the Relationships between Land Use and Water Quality across an Urbanization Gradient in the Watersheds of Northern Georgia, USA. Environ. Manag. 2013, 51, 1–17. [Google Scholar] [CrossRef]
  2. Connolly, N.M.; Pearson, R.G.; Loong, D.; Maughan, M.; Brodie, J. Water quality variation along streams with similar agricultural development but contrasting riparian vegetation. Agric. Ecosyst. Environ. 2015, 213, 11–20. [Google Scholar] [CrossRef]
  3. Yu, D.; Shi, P.; Liu, Y.; Xun, B. Detecting land use-water quality relationships from the viewpoint of ecological restoration in an urban area. Ecol. Eng. 2013, 53, 205–216. [Google Scholar] [CrossRef]
  4. Lawniczak, A.E.; Zbierska, J.; Nowak, B.; Achtenberg, K.; Grześkowiak, A.; Kanas, K. Impact of agriculture and land use on nitrate contamination in groundwater and running waters in Central-West Poland. Environ. Monit. Assess. 2016, 188, 172. [Google Scholar] [CrossRef] [PubMed] [Green Version]
  5. Monaghan, R.M.; Wilcock, R.J.; Smith, L.C.; Tikkisetty, B.; Thorrold, B.S.; Costall, D. Linkages between land management activities and water quality in an intensively farmed catchment in Southern New Zealand. Agric. Ecosyst. Environ. 2007, 118, 211–222. [Google Scholar] [CrossRef]
  6. Adams, V.M.; Pressey, R.L.; Stoeckl, N. Navigating trade-offs in land-use planning: Integrating human well-being into objective setting. Ecol. Soc. 2014, 19, 53. [Google Scholar] [CrossRef] [Green Version]
  7. Vandeberg, G.; Dixon, C.; Vose, B.; Fisher, M. Spatial assessment of water quality in the vicinity of Lake Alice National Wildlife Refuge, Upper Devils Lake Basin, North Dakota. Environ. Monit. Assess. 2015, 187, 1–19. [Google Scholar] [CrossRef]
  8. Johnson, H.O.; Gupta, S.C.; Vecchia, A.V.; Zvomuya, F. Assessment of Water Quality Trends in the Minnesota River using Non-Parametric and Parametric Methods. J. Environ. Qual. 2009, 38, 1018–1030. [Google Scholar] [CrossRef]
  9. Barril, C.R.; Tumlos, E.T. Water quality trends and trophic state assessment of Laguna de Bay, Philippines. Aquat. Ecosyst. Health Manag. 2002, 5, 115–126. [Google Scholar] [CrossRef]
  10. Mouri, G.; Takizawa, S.; Oki, T. Spatial and temporal variation in nutrient parameters in stream water in a rural-urban catchment, Shikoku, Japan: Effects of land cover and human impact. J. Environ. Manag. 2011, 92, 1837–1848. [Google Scholar] [CrossRef]
  11. Allan, D.; Erickson, D.; Fay, J. The Influence of Catchment Land Use on Stream Integrity Across Multiple Spatial Scales. Freshw. Biol. 1997, 37, 149–161. [Google Scholar] [CrossRef] [Green Version]
  12. Valentin, C.; Agus, F.; Alamban, R.; Boosaner, A.; Bricquet, J.P.; Chaplot, V.; de Guzman, T.; de Rouw, A.; Janeau, J.L.; Orange, D.; et al. Runoff and sediment losses from 27 upland catchments in Southeast Asia: Impact of rapid land use changes and conservation practices. Agric. Ecosyst. Environ. 2008, 128, 225–238. [Google Scholar] [CrossRef]
  13. Kim, H.; Jeong, H.; Jeon, J.; Bae, S. The Impact of Impervious Surface on Water Quality and Its Threshold in Korea. Water 2016, 8, 111. [Google Scholar] [CrossRef] [Green Version]
  14. Chang, H. Spatial analysis of water quality trends in the Han River basin, South Korea. Water Res. 2008, 42, 3285–3304. [Google Scholar] [CrossRef]
  15. Sithong, T.; Yayoi, F. Recent Land Use and Livelihoods Transitions in Northern Laos. Mt. Res. Dev. 2006, 26, 237–244. [Google Scholar]
  16. Pham, H.T.; Miyagawa, S.; Kosaka, Y. Distribution patterns of trees in paddy field landscapes in relation to agro-ecological settings in northeast Thailand. Agric. Ecosyst. Environ. 2015, 202, 42–47. [Google Scholar] [CrossRef]
  17. Crews-Meyer, K.A. Agricultural landscape change and stability in northeast Thailand: Historical patch-level analysis. Agric. Ecosyst. Environ. 2004, 101, 155–169. [Google Scholar] [CrossRef]
  18. Takamatsu, M.; Kawasaki, A.; Rogers, P.; Malakie, J. Development of a land-use forecast tool for future water resources assessment: Case study for the Mekong River 3S Sub-basins. Sustain. Sci. 2014, 9, 157–172. [Google Scholar] [CrossRef]
  19. Rutten, M.; van Dijk, M.; van Rooij, W.; Hilderink, H. Land Use Dynamics, Climate Change, and Food Security in Vietnam: A Global-to-local Modeling Approach. World Dev. 2014, 59, 29–46. [Google Scholar] [CrossRef]
  20. Laungaramsri, P. Frontier capitalism and the expansion of rubber plantations in southern Laos. J. Southeast Asian Stud. 2012, 43, 463–477. [Google Scholar] [CrossRef]
  21. Manivong, V.; Cramb, R.A. Economics of smallholder rubber expansion in Northern Laos. Agrofor. Syst. 2008, 74, 113–125. [Google Scholar] [CrossRef]
  22. Arias, M.E.; Cochrane, T.A.; Kummu, M.; Lauri, H.; Holtgrieve, G.W.; Koponen, J.; Piman, T. Impacts of hydropower and climate change on drivers of ecological productivity of Southeast Asia’s most important wetland. Ecol. Model. 2014, 272, 252–263. [Google Scholar] [CrossRef]
  23. Manh, N.V.; Dung, N.V.; Hung, N.N.; Kummu, M.; Merz, B.; Apel, H. Future sediment dynamics in the Mekong Delta floodplains: Impacts of hydropower development, climate change and sea level rise. Glob. Planet. Chang. 2015, 127, 22–33. [Google Scholar] [CrossRef] [Green Version]
  24. Pokhrel, Y.; Burbano, M.; Roush, J.; Kang, H.; Sridhar, V.; Hyndman, D. A Review of the Integrated Effects of Changing Climate, Land Use, and Dams on Mekong River Hydrology. Water 2018, 10, 266. [Google Scholar] [CrossRef] [Green Version]
  25. Hecht, J.S.; Lacombe, G.; Arias, M.E.; Dang, T.D.; Piman, T. Hydropower dams of the Mekong River basin: A review of their hydrological impacts. J. Hydrol. 2019, 568, 285–300. [Google Scholar] [CrossRef]
  26. Mekong River Commission. Planning Atlas of the Lower Mekong River Basin; Mekong River Commission: Vientiane, Laos, 2011. [Google Scholar]
  27. Kummu, M.; Sarkkula, J. Impact of the Mekong River Flow Alteration on the Tonle Sap Flood Pulse. AMBIO J. Hum. Environ. 2008, 37, 185–192. [Google Scholar] [CrossRef]
  28. Lap Nguyen, V.; Ta, T.K.O.; Tateishi, M. Late Holocene depositional environments and coastal evolution of the Mekong River Delta, Southern Vietnam. J. Asian Earth Sci. 2000, 18, 427–439. [Google Scholar] [CrossRef]
  29. IUSS Working Group. WRB World Reference Base for Soil Resources 2014. Available online: http://www.fao.org/3/i3794en/I3794en.pdf (accessed on 18 January 2020).
  30. Leinenkugel, P.; Wolters, M.L.; Oppelt, N.; Kuenzer, C. Tree cover and forest cover dynamics in the Mekong Basin from 2001 to 2011. Remote Sens. Environ. 2015, 158, 376–392. [Google Scholar] [CrossRef]
  31. Lacombe, G.; Valentin, C.; Sounyafong, P.; de Rouw, A.; Soulileuth, B.; Silvera, N.; Pierret, A.; Sengtaheuanghoung, O.; Ribolzi, O. Linking crop structure, throughfall, soil surface conditions, runoff and soil detachment: 10 land uses analyzed in Northern Laos. Sci. Total Environ. 2018, 616–617, 1330–1338. [Google Scholar] [CrossRef]
  32. Suif, Z.; Fleifle, A.; Yoshimura, C.; Saavedra, O. Spatio-temporal patterns of soil erosion and suspended sediment dynamics in the Mekong River Basin. Sci. Total Environ. 2016, 568, 933–945. [Google Scholar] [CrossRef] [Green Version]
  33. European Space Agency. Land Cover Newsletter; European Space Agency: Paris, France, 2017; Volume 7. [Google Scholar]
  34. ESRI. ArcGIS Desktop; Environmental Systems Research Institute: Redlands, CA, USA, 2014. [Google Scholar]
  35. Jenson, S.K.; Domingue, J.O. Extracting Topographic Structure from Digital Elevation Data for Geographic Information-System Analysis. Photogramm. Eng. Remote Sens. 1988, 54, 1593–1600. [Google Scholar]
  36. American Public Health Association. Standard Methods for the Examination of Water and Wastewater; APHA-AWWA-WEF: Washington, DC, USA, 2005. [Google Scholar]
  37. MathWorks. MATLAB version 7.10. 0 (R2010a); The MathWorks: Natick, MA, USA, 2010. [Google Scholar]
  38. Cleveland, R.B.; Cleveland, W.S.; Terpenning, I. STL: A Seasonal-Trend Decomposition Procedure Based on Loess. J. Off. Stat. 1990, 6, 3. [Google Scholar]
  39. Wan, Y.; Wan, L.; Li, Y.; Doering, P. Decadal and seasonal trends of nutrient concentration and export from highly managed coastal catchments. Water Res. 2017, 115, 180–194. [Google Scholar] [CrossRef] [PubMed]
  40. Wan, L.; Li, Y.C. Time series trend analysis and prediction of water quality in a managed canal system, Florida (USA). In IOP Conference Series: Earth and Environmental Science, Proceedings of the The 4th International Conference on Water Resource and Environment (WRE 2018), Kaohsiung City, Taiwan, 17–21 July 2018; IOP Publishing: Bristol, UK, 2018; Volume 191, p. 012013. [Google Scholar]
  41. Hyndman, R.J.; Athanasopoulos, G. Forecasting: Principles and Practice; OTexts: Melbourne, Australia, 2018. [Google Scholar]
  42. R Development Core Team. R: A Language and Environment for Statistical Computing; R Foundation for Statistical Computing: Vienna, Austria, 2008. [Google Scholar]
  43. Cleveland, W.S.; Devlin, S.J. Locally Weighted Regression: An Approach to Regression Analysis by Local Fitting. J. Am. Stat. Assoc. 1988, 83, 596–610. [Google Scholar] [CrossRef]
  44. Fu, L.; Wang, Y.-G. Statistical Tools for Analyzing Water Quality Data. Available online: https://www.intechopen.com/books/water-quality-monitoring-and-assessment/statistical-tools-for-analyzing-water-quality-data (accessed on 11 November 2017).
  45. Hirsch, R.; Slack, J.R.; Smith, R. Techniques of Trend Analysis for Monthly Water Quality Data. Water Resour. Res. 1982, 18, 107–121. [Google Scholar] [CrossRef] [Green Version]
  46. Xu, G.; Li, P.; Lu, K.; Tantai, Z.; Zhang, J.; Ren, Z.; Wang, X.; Yu, K.; Shi, P.; Cheng, Y. Seasonal changes in water quality and its main influencing factors in the Dan River basin. CATENA 2019, 173, 131–140. [Google Scholar] [CrossRef]
  47. Aquilina, L.; Vergnaud-Ayraud, V.; Labasque, T.; Bour, O.; Molénat, J.; Ruiz, L.; de Montety, V.; De Ridder, J.; Roques, C.; Longuevergne, L. Nitrate dynamics in agricultural catchments deduced from groundwater dating and long-term nitrate monitoring in surface- and groundwaters. Sci. Total Environ. 2012, 435–436, 167–178. [Google Scholar] [CrossRef]
  48. Wang, C.; Zheng, S.-S.; Wang, P.-F.; Hou, J. Interactions between vegetation, water flow and sediment transport: A review. J. Hydrodyn. Ser. B 2015, 27, 24–37. [Google Scholar] [CrossRef]
  49. Chaplot, V.; Khampaseuth, X.; Valentin, C.; Bissonnais, Y.L. Interrill erosion in the sloping lands of Northern Laos subjected to shifting cultivation. Earth Surf. Process. Landf. 2007, 32, 415–428. [Google Scholar] [CrossRef]
  50. Sidle, R.C.; Ziegler, A.D.; Negishi, J.N.; Nik, A.R.; Siew, R.; Turkelboom, F. Erosion processes in steep terrain—Truths, myths, and uncertainties related to forest management in Southeast Asia. For. Ecol. Manag. 2006, 224, 199–225. [Google Scholar] [CrossRef]
  51. Wemple, B.C.; Browning, T.; Ziegler, A.D.; Celi, J.; Chun, K.P.; Jaramillo, F.; Leite, N.K.; Ramchunder, S.J.; Negishi, J.N.; Palomeque, X.; et al. Ecohydrological disturbances associated with roads: Current knowledge, research needs, and management concerns with reference to the tropics. Ecohydrology 2018, 11, e1881. [Google Scholar] [CrossRef]
  52. Rijsdijk, A.; Sampurno Bruijnzeel, L.A.; Sutoto, C.K. Runoff and sediment yield from rural roads, trails and settlements in the upper Konto catchment, East Java, Indonesia. Geomorphology 2007, 87, 28–37. [Google Scholar] [CrossRef]
  53. Chaplot, V.; Poesen, J. Sediment, soil organic carbon and runoff delivery at various spatial scales. CATENA 2012, 88, 46–56. [Google Scholar] [CrossRef]
  54. Inoue, Y.; Qi, J.; Olioso, A.; Kiyono, Y.; Horie, T.; Asai, H.; Saito, K.; Ochiai, Y.; Shiraiwa, T.; Douangsavanh, L. Reflectance characteristics of major land surfaces in slash-and-burn ecosystems in Laos. Int. J. Remote Sens. 2008, 29, 2011–2019. [Google Scholar] [CrossRef]
  55. Fujisaka, S. A diagnostic survey of shifting cultivation in Northern Laos: Targeting research to improve sustainability and productivity. Agrofor. Syst. 1991, 13, 95–109. [Google Scholar] [CrossRef]
  56. Fox, J.; Vogler, J.B.; Sen, O.L.; Giambelluca, T.W.; Ziegler, A.D. Simulating Land-Cover Change in Montane Mainland Southeast Asia. Environ. Manag. 2012, 49, 968–979. [Google Scholar] [CrossRef]
  57. Ribolzi, O.; Evrard, O.; Huon, S.; de Rouw, A.; Silvera, N.; Latsachack, K.O.; Soulileuth, B.; Lefèvre, I.; Pierret, A.; Lacombe, G.; et al. From shifting cultivation to teak plantation: Effect on overland flow and sediment yield in a montane tropical catchment. Sci. Rep. 2017, 7, 3987. [Google Scholar] [CrossRef]
  58. Fleifle, A.E. Suspended Sediment Load Monitoring Along the Mekong River from Satellite Images. J. Earth Sci. Clim. Chang. 2013, 4, 160. [Google Scholar]
  59. Dahlgren, R.A.; Macías, F.; Arbestain, M.C.; Chesworth, W.; Robarge, W.P.; Macías, F. Acrisols. In Encyclopedia of Soil Science; Chesworth, W., Ed.; Springer: Dordrecht, The Netherlands, 2008; pp. 22–24. [Google Scholar]
  60. Kummu, M.; Varis, O. Sediment-related impacts due to upstream reservoir trapping, the Lower Mekong River. Geomorphology 2007, 85, 275–293. [Google Scholar] [CrossRef]
  61. Schuetz, T.; Gascuel-Odoux, C.; Durand, P.; Weiler, M. Nitrate sinks and sources as controls of spatio-temporal water quality dynamics in an agricultural headwater catchment. Hydrol. Earth Syst. Sci. 2016, 20, 843–857. [Google Scholar] [CrossRef] [Green Version]
  62. Chea, R.; Grenouillet, G.; Lek, S. Evidence of Water Quality Degradation in Lower Mekong Basin Revealed by Self-Organizing Map. PLoS ONE 2016, 11, e0145527. [Google Scholar] [CrossRef] [PubMed] [Green Version]
  63. Poffenbarger, H.J.; Sawyer, J.E.; Barker, D.W.; Olk, D.C.; Six, J.; Castellano, M.J. Legacy effects of long-term nitrogen fertilizer application on the fate of nitrogen fertilizer inputs in continuous maize. Agric. Ecosyst. Environ. 2018, 265, 544–555. [Google Scholar] [CrossRef] [Green Version]
  64. World Bank Group (Ed.) GDP per capita growth (annual %)-Lao PDR. In Data Catolog; World Bank National Accounts Data, and OECD National Accounts Data Files; World Bank Group: Washington, DC, USA, 2019. [Google Scholar]
  65. Epprecht, M.; Bosoni, N.; Hayward, D. Urbanization Processes in the Lao PDR; Centre for Development and Environment: Vientiane, Laos, 2018. [Google Scholar]
  66. Okamoto, K.; Sharifi, A.; Chiba, Y. The Impact of Urbanization on Land Use and the Changing Role of Forests in Vientiane. In Integrated Studies of Social and Natural Environmental Transition in Laos; Yokoyama, S., Okamoto, K., Takenaka, C., Hirota, I., Eds.; Springer: Tokyo, Japan, 2014; pp. 29–38. [Google Scholar]
  67. Salvia-Castellví, M.; François Iffly, J.; Vander Borght, P.; Hoffmann, L. Dissolved and particulate nutrient export from rural catchments: A case study from Luxembourg. Sci. Total Environ. 2005, 344, 51–65. [Google Scholar] [CrossRef] [PubMed]
  68. Schilling, K.E. Chemical transport from paired agricultural and restored prairie watersheds. J. Environ. Qual. 2002, 31, 1184–1193. [Google Scholar] [CrossRef] [PubMed]
  69. Buck, O.; Niyogi, D.K.; Townsend, C.R. Scale-dependence of land use effects on water quality of streams in agricultural catchments. Environ. Pollut. 2004, 130, 287–299. [Google Scholar] [CrossRef] [PubMed]
  70. Tromboni, F.; Dodds, W. Relationships between Land Use and Stream Nutrient Concentrations in a Highly Urbanized Tropical Region of Brazil: Thresholds and Riparian Zones. Environ. Manag. 2017, 60, 30–40. [Google Scholar] [CrossRef] [PubMed]
  71. Arheimer, B.; Lidén, R. Nitrogen and phosphorus concentrations from agricultural catchments—Influence of spatial and temporal variables. J. Hydrol. 2000, 227, 140–159. [Google Scholar] [CrossRef]
  72. World Bank Group. Water Supply and Sanitation in Lao PDR: Turning Finance into Services for the Future; Water and Sanitation Program; World Bank Group: Washington, DC, USA, 2014. [Google Scholar]
  73. JICA. Vientiane Capital Urban Development Master Plan-Proposal. Available online: https://www.jica.go.jp/project/english/laos/009/materials/pdf/pamphlet_01.pdf (accessed on 20 January 2020).
  74. Morgan, R.P.C.; McIntyre, K.; Vickers, A.W.; Quinton, J.N.; Rickson, R.J. A rainfall simulation study of soil erosion on rangeland in Swaziland. Soil Technol. 1997, 11, 291–299. [Google Scholar] [CrossRef]
  75. Rey, F. Influence of vegetation distribution on sediment yield in forested marly gullies. CATENA 2003, 50, 549–562. [Google Scholar] [CrossRef]
  76. Snelder, D.J.; Bryan, R.B. The use of rainfall simulation tests to assess the influence of vegetation density on soil loss on degraded rangelands in the Baringo District, Kenya. CATENA 1995, 25, 105–116. [Google Scholar] [CrossRef]
  77. Mallin, M.A.; Johnson, V.L.; Ensign, S.H. Comparative impacts of stormwater runoff on water quality of an urban, a suburban, and a rural stream. Environ. Monit. Assess. 2009, 159, 475–491. [Google Scholar] [CrossRef] [PubMed]
  78. Shuster, W.D.; Bonta, J.; Thurston, H.; Warnemuende, E.; Smith, D.R. Impacts of impervious surface on watershed hydrology: A review. Urban Water J. 2005, 2, 263–275. [Google Scholar] [CrossRef]
Figure 1. The study area of the Lower Mekong Basin (LMB) displaying (a) water quality and flow monitoring stations as well as drivers and pressures of land use change [15,16,17,18,19,20,21], (b) variation of mean slopes (%), (c) a 2010 land use/land cover (LULC) map, and (d) delineated sub-basins (Table 1 provides a list of acronyms displayed in the figures and further discussions of the analysis results).
Sustainability 12 02992 g001aSustainability 12 02992 g001b
Figure 2. Methodological framework of this study.
Sustainability 12 02992 g002
Figure 3. The 2010 LULC compositions and their proportions within the sub-basins in the (a) LMB and (b) upper and lower sections of the basin.
Sustainability 12 02992 g003
Figure 4. Pearson’s correlation matrix (upper triangle) and statistical significance matrix (lower triangle) among different land use parameters and water quality indicators.
Sustainability 12 02992 g004
Figure 5. Relationships between mean slope of the sub-catchments and 2010 mean monthly TSS and nitrate concentrations (red dots and numbers represent stations). Data label: Red dots represent water quality monitoring stations where: 2—WCS; 3—WLP; 4—WVT; 5—WNP; 6—WSK; 7—WKC; 8—WPS; 9—WST; 10—WKT; 11—WKA; 1—WCC; 13—WNL; 14—WKS; 15—WTC.
Sustainability 12 02992 g005
Figure 6. Decomposition of TSS time series at (a) Chiang Sean (WCS), (b) Luang Prabang (WLP), (c) Kampong Cham (WKA), and (d) Tan Chau (WTC). The red vertical line represents the date the Manwan dam became operational.
Sustainability 12 02992 g006
Figure 7. Decomposition of nitrate time series at (a) Chiang Sean (WCS), (b) Luang Prabang (WLP), (c) Kampong Cham (WKA), and (d) Tan Chau (WTC).
Sustainability 12 02992 g007
Figure 8. Comparisons of temporal patterns and relationships of the Mekong River’s discharge and instream TSS and nitrate concentrations at WNP (a,b) and WST (c,d). These two stations representing the upper and lower sections of the LMR, respectively.
Sustainability 12 02992 g008aSustainability 12 02992 g008b
Figure 9. (a) Mean proportion of LULC in SVT from 1993 to 2015 [33] and (b) their relationships with one another and with water quality indicators (see Figure 4 for the legend).
Sustainability 12 02992 g009
Table 1. Acronyms of water quality and quality monitoring stations as well as the delineated sub-basins for this study.
River SectionsStation No.Station NamesAcronyms
Water Quality Monitoring StationCorresponding Sub-BasinsFlow Stations
Upper2Chiang SeanWCSSCS
3Luang PrabangWLPSLP
4VientianeWVTSVT
5Nakhon PhanomWNPSNPFNP
6SavannakhetWSKSSK
7Khong ChiamWKCSKC
8PakseWPSSPS
Lower9Stung TrengWSTSSTFST
10KratieWKTSKT
11Kampong ChamWKASKA
12Chrouy ChangvarWCCSCC
13Neak LoungWNLSNL
14Kraorm SamnorWKSSKS
15Tan ChauWTCSTC
Table 2. Descriptive statistics of total suspended solids (TSS) and nitrate data in the Lower Mekong River (LMR) stations (a 0.00 refers to non-detectable level).
SectionStations
(See Table 1)
TSS (mg/L)Nitrate (mg/L)
MaxMeanMinStd. DevMaxMeanMin aStd. Dev
UpperWCS2372.0294.41.6356.60.790.340.100.11
WLP3328.0254.62.0400.01.100.220.000.15
WVT5716.0314.91.0591.10.990.230.000.15
WNP1566.0169.72.0203.30.740.290.020.13
WSK649.0105.11.0109.50.650.250.000.14
WKC1675.0160.51.3204.70.930.260.000.13
WPS1526.0159.11.0215.00.770.160.000.12
LowerWST590.070.31.088.80.530.170.000.11
WKT680.080.62.090.71.170.160.000.13
WKA546.083.30.3100.80.900.160.000.12
WCC536.081.11.098.80.740.160.000.12
WNL596.080.40.493.40.540.160.000.11
WKS293.067.41.363.50.600.150.000.11
WTC551.2110.60.3123.01.020.180.000.16
Table 3. Results of the Seasonal Mann–Kendall (SMK) analysis on TSS and nitrate time series data (red box represents p < 0.01, orange represents p < 0.05).
Water Quality IndicatorsStatistical TestsUpper SectionLower Section
WCSWLPWVTWNPWSKWKCWPSWSTWKTWKAWCCWNLWKSWTC
TSSz-values−0.35−0.23−0.1−0.240.01−0.13−0.20.0−0.1−0.03−0.020.080.00.16
p-value0.00 0.000.020.000.880.000.001.00.000.550.660.290.920.00
Nitratez-values0.060.350.25−0.020.28−0.070.230.080.03−0.09−0.050.16−0.070.03
p-value0.130.000.000.560.000.070.000.270.550.040.280.000.150.42

