1. Introduction
Today, increasing amounts of investments are made in infrastructure and real estate due to economic expansion, rising population, and rising numbers of railing infrastructure [
1]. Yet, the expansion of such construction is also increasing the severity of the climate change issue. In fact, completion of infrastructure projects, such as mega-bridges, requires significant raw materials and machinery, which will, in turn, create considerable volumes of greenhouse gas (GHG) emissions. GHG emissions do not only happen during the manufacture stage, but also occur at other stages of the construction process including construction, operations, maintenance, and the final renovation or demolition stage [
2].
Presently, it is widely accepted that lifecycle assessment (LCA) is a useful method to evaluate the carbon footprint across the full lifecycle of a product, process or activity [
3]. Performing the lifecycle assessment of a building or an infrastructure requires the measurement of the carbon footprint and other environmental effects. Nonetheless, conducting LCA in the Architecture–Engineering Construction (AEC) industry is more complicated compared to the manufacturing industry [
4] because of the variety of materials and energy sources, different suppliers, the number of stakeholders, and different benchmarking protocols and standards [
5].
The traditional construction method (the 2D drafting method) is one of the most complex construction techniques without a standardised data exchange platform, which is one of the main causes of project delays, cost overruns, and onerous man-hours [
6]. Bridges are a typical example with a high rework rate due to their complexities. However, Building Information Modelling (BIM) offers the potential to decrease project costs, increase productivity, increase project quality, and reduce project delivery time [
7]. Also, in Section 2.29 of the comprehensive Construction Strategy published by the UK Government in 2011 [
8], BIM is mentioned as the way forward to achieving 20% efficiency savings in the industry. With increasing construction of mega-bridge projects around the world, a well-designed framework integrating the BIM technology and LCA needs to be applied to these projects to satisfy all stakeholders and ensure a sustainable outcome.
This paper primarily focuses on the adoption of BIM technology and lifecycle analysis for Donggou Bridge in Donggou, China to improve the sustainability of the bridge throughout its entire lifecycle. Although this study is limited to information from the adoption of 6D modelling in the context of Donggou Bridge, the methodology and the approach of the study will serve as a primary example of the potential of BIM for mega-bridge construction. To transfer the traditional 2D design files of the bridge to a 3D model containing the time schedule, cost schedule and GHG emissions, detailed information about each important element, component and activities throughout the bridge’s life span will be collected.
2. Background Information of the Bridge Infrastructure and Assumptions
The bridge infrastructure is located at Liangzi Lake District in Donggou town, Ezhou City, China. Donggou Bridge is a double-lane concrete box-girder structure bridge with a total length of 140 m, bridge deck width of 12 m and bridge height above the river of 8m. The bridge was designed to withstand a 60 km/h traffic flow and have a 2% bridge deck slope on the two side spans. According to the General Specifications for Design of Highway Bridges and Culverts (JTG D60-2015) [
9] in China, the design service life span of such a bridge is 100 years. However, the frequent high volume of traffic and overloading of vehicles generate the assumption that the bridge would have a shorter lifecycle of 30 years. It is also assumed that the bridge would undergo regular maintenance, such as bridge inspection, bridge cleaning, and clearing of drainage areas, every five years at the cost of 10,000 Chinese Yuan (CNY); and, maintenance, as well as rehabilitation, such as bridge repair and repainting every fifteen years at the cost of 200,000 CNY. Lastly, since the bridge project was completed seven years ago and information on the specific time schedule was unavailable, the authors generated an estimated construction timeline based on previous experience on a similar length bridge project.
3. Literature Review
3.1. Building Information Modelling (BIM)
BIM is an approach for creating an intelligent 3D model and managing digital information during the entire lifecycle of a project [
10].
In recent years, many studies have identified that using BIM technology could provide huge benefits for budget-saving and risk identification. Applying BIM can help to directly extract the take-offs and management from the model [
11]. In 2010, Sacks et al. presented a matrix framework showing the interaction between lean construction and BIM and also its benefits [
12]. Marzouk and Hisham [
13] mentioned the tremendous benefits of BIM for all project parties, regarding easing the creation of different design alternatives within shorter periods and work required; reducing site errors; and producing a final building information management model at the operation and maintenance stage. Azhar [
7] found that the average return on investment of the BIM projects examined reached 634%, and also significant time saving and cost avoidance. Azhar et al. [
14] presented an overview of BIM technology within the project lifecycle. They advanced several benefits of using BIM, including identification of potential hazards and the creation of a safety plan, the development of a detailed operation sequence plan, continuous information updates which can later be used during operation and maintenance, and the generation of a more efficient operation and maintenance plan to avoid the loss of the lifecycle cost. In a nutshell, the future of BIM is promising for sharing detailed and structured information and for the continuous information updates of projects. Doumbouya et al. [
15] maintained that the lifecycle stages of AEC projects encompass inception, briefing, design, production, maintenance, and decomposition. BIM is central to the asset lifecycle [
16]. It is an information platform to generate and equally distribute required information among all stakeholders.
3.2. BIM Adoption for Bridge Projects
Chen and Shirolé [
17] specified the benefits of using 3D bridge information modelling compared to traditional 2D drafting. These benefits include the fact that tedious time-consuming error-prone manual data re-entry can be avoided, and all product information is located within the same file for easier information sharing during the whole lifecycle of the project. Marzouk and Hisham [
18] presented the application of BIM for the cost and time management of bridge infrastructure, with a five-dimensional approach (3D plus time and cost) using the BIM software. Zou et al. [
19] demonstrated the benefits of using BIM in the risk management of bridge projects. They emphasised that 3D visualisation and 4D construction scheduling facilitate risk identification, risk analysis and communication between different parties at an early stage. Further, they claimed that integrating an Risk Breakdown Structure (RBS) and BIM can provide crucial information for risk management and decision making. Combining BIM technology with the traditional bridge design method will improve the efficiency of bridge projects to ensure that changes are easily affected in the case of construction conflicts. Also, the 5D information generated from the BIM model will improve the accuracy of budget estimation at the design stage.
3.3. Lifecycle Assessment Application
According to the ISO 14040 [
20] framework, four steps are required to generate a lifecycle assessment, including goal and scope definition, Lifecycle Inventory (LCI), Lifecycle Impact Assessment (LCIA) and interpretation. Hammervold et al. [
21] presented a detailed environmental lifecycle assessment comparison case study of three constructed bridges with three different structures. The LCA results showed that the materials of the bridge structure constituted its main environmental impact throughout the bridge’s lifecycle, whereas for a residential building, the operation stage comprised the primary share [
5]. However, simply applying low-energy materials will not reduce its overall environmental impact. Blengini and Di Carlo [
22] evaluated a low-energy building in Italy and found that energy consumption during the operation stage was ten times lower than the standard, while the total environmental impact only reduced by 2.1 to 1 (2.1: 1), which was not relatively high when compared to the reduced energy consumption. They suggested that although the materials chosen can reduce the energy requirement, they may increase the embodied energy. Means and Guggemos [
4] indicated that an LCA benchmark is needed for each building type to determine the building’s environmental impact prior to construction and establish a standard value for comparison. Hence, the current LCA tools can only offer limited functions in the AEC industry compared to full functionality in the manufacturing industry.
3.4. BIM Adoption and Implementation with Lifecycle Assessment
It is difficult to perform the lifecycle assessment of a building because of the complex dataset and data process. Blengini and Di Carlo [
22] advanced that it is challenging to develop LCA for buildings because of different materials and processes, the unique design or the purpose of users. However, BIM technology can meet the need for varied information input at different lifecycle stages within a single model. Presenting an LCA case study, Wang et al. [
23] used BIM to construct the basic model of a university office building and extracted necessary information, such as material quantities. This information was then imported into the Autodesk Ecotect to generate the LCA result and use it to compare a lifecycle performance. Antón and Díaz [
24] also introduced two approaches for integrating LCA and BIM; the first involves extracting information from the BIM model created to calculate the LCA performance, and the second requires inputting the environmental properties of the materials into the BIM. The first approach is more accurate but more complex, whereas the second approach can only have an effect in the early stages of a building’s lifecycle. Kaewunruen and Xu [
25] conducted a BIM-based sustainability evaluation of King’s Cross Station. The final 6D Model of King’s Cross Station includes a 3D model of the railway station. Cost estimates and carbon footprint are analyzed. The study provides reasonable guidance flor BIM adoption with LCA implementation.
4. Methodology
This section introduces the process of developing the Donggou Bridge information modelling. A 3D model containing the digital information database was developed. All the data generated from various sources can be used within the bridge’s entire lifecycle. For example, the design of the bridge can be included in the model from the pre-construction stage, construction stage, and operation stage. The methodology adopted in this study is based on the approaches proposed by Kaewunruen and Xu [
25] and Yang et al. [
5]. However, they applied the approaches on residential buildings and railway station buildings, which was fully supported by traditional software in the market, while the software is not designed for bridge construction. Therefore, this study will adjust some parts of the software.
4.1. BIM Modelling
Based on 2D drawings of the Donggou Bridge, a lean 3D model simulation was created using the Revit 2016 software. As Revit is often used for commercial buildings, this study established specific families with the exact data of the 2D drafting obtained and organised all the components into a project model. Then, the families were assembled and installed together; and the rebars of the main components, the box girders, and the substructure were added to the main structure. Finally, the coordinated information on the materials was added to the family model.
The fourth dimension was then included based on the 3D model developed using Revit 2016 and Navisworks 2016. The time schedule was generated by extracting the model information from the Revit software and inputting this information into the Navisworks 2016 software. A construction schedule was then added to the 3D based model using the procedure and guidance online.
Further, a fifth dimension comprised the 4D model and the cost data. The cost data was mainly divided into two categories—the raw materials cost data based on the market price of the raw material types and other cost data describing, mainly, the cost of the machinery. The sum of these two categories generates the rough budget estimation of the bridge project.
4.2. BIM-Based Data Extraction for the LCA
In this section, a method is presented to extract the data needed for the LCA, illustrated by the project scope order. Also, the method to evaluate the greenhouse gas (GHG) emissions were based on the UK Government GHG Conversion Factors (See
Table 1) [
26]. The carbon footprint was estimated using a general carbon emissions equation proposed in the Department for Business Energy & Industrial Strategy (BEIS) [
26]:
4.2.1. Planning and Design Stage
In this stage, the main environmental factor was fossil fuel consumption during the early field investigation trips. The GHG emissions will be calculated based on the investigation trip counts and fuel consumption per trip.
4.2.2. Pre-Construction Stage
In this stage, the GHG emissions were mainly from the embodied energy of the raw materials during the production and manufacture stage of the materials. The embodied emissions factors (see
Table 2) were obtained from Hammond and Jones [
27].
4.2.3. Material Transportation Stage
The GHG emissions in this stage were mainly from transportation, including trucks used for delivering the rebars before the construction stage, concrete delivery during the construction stage and waste evacuation after the construction stage. Since the material factory, construction site, concrete plant, and the disposal site are all located in Ezhou City, the distances from the material factory, concrete plant, and disposal site to the construction site were assumed to be 50, 10, and 40km, respectively.
4.2.4. Construction Stage
The GHG emissions were mainly from the machinery used at the construction stage, including the drilling machine, welder, bar straightening and cutting machine, and crane trucks.
4.2.5. Operation and Maintenance Stage
Unlike commercial or other operational infrastructures such as railway stations, the cost of bridge infrastructure during operation can be neglected, as there is no significant cost involved at the operation stage. For periodic maintenance, the cost was estimated based on the types of activities.
4.2.6. Demolition Stage
Li and Liu claimed that 80% of the demolition materials from the construction site are treated as disposable materials, and 20% are treated as recyclable materials [
28]. Based on their study, the GHG emission was calculated using the following equation:
5. Results
A 6D BIM model comprising the 3D model of the Donggou Bridge, the time schedule, cost schedule, and carbon footprint evaluation was generated. With all the information collected and generated by the Revit and Navisworks, the results are presented below.
5.1. Bridge 3D Model
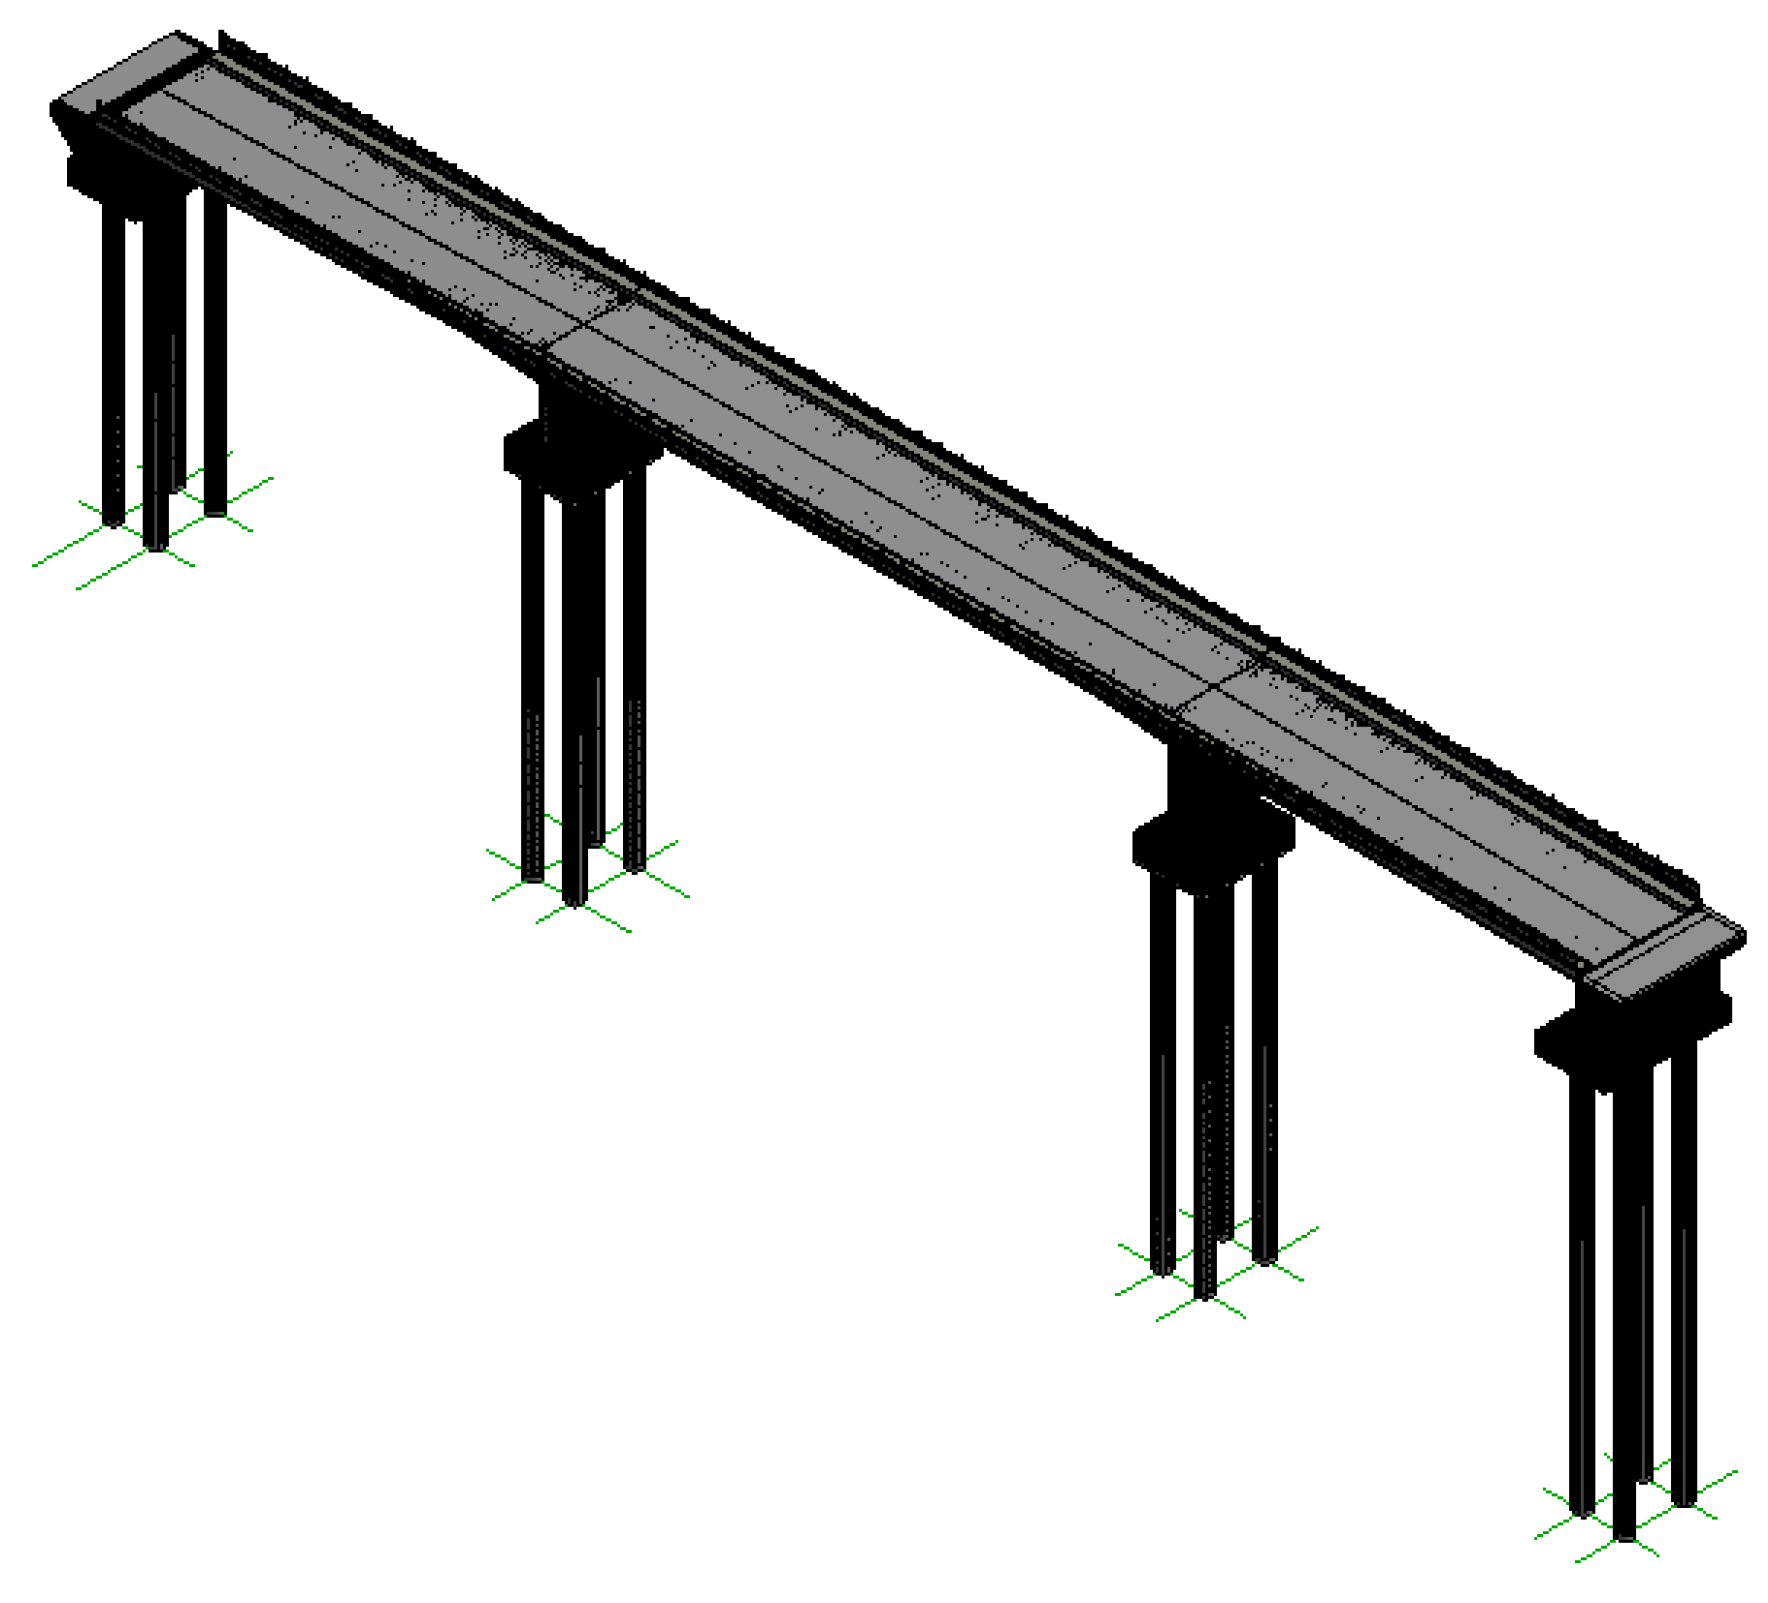
Based on 2D drafting of the bridge infrastructure, a 3D simulation model containing the 2D information in Level of Development (LOD) 300 [
29] can be created.
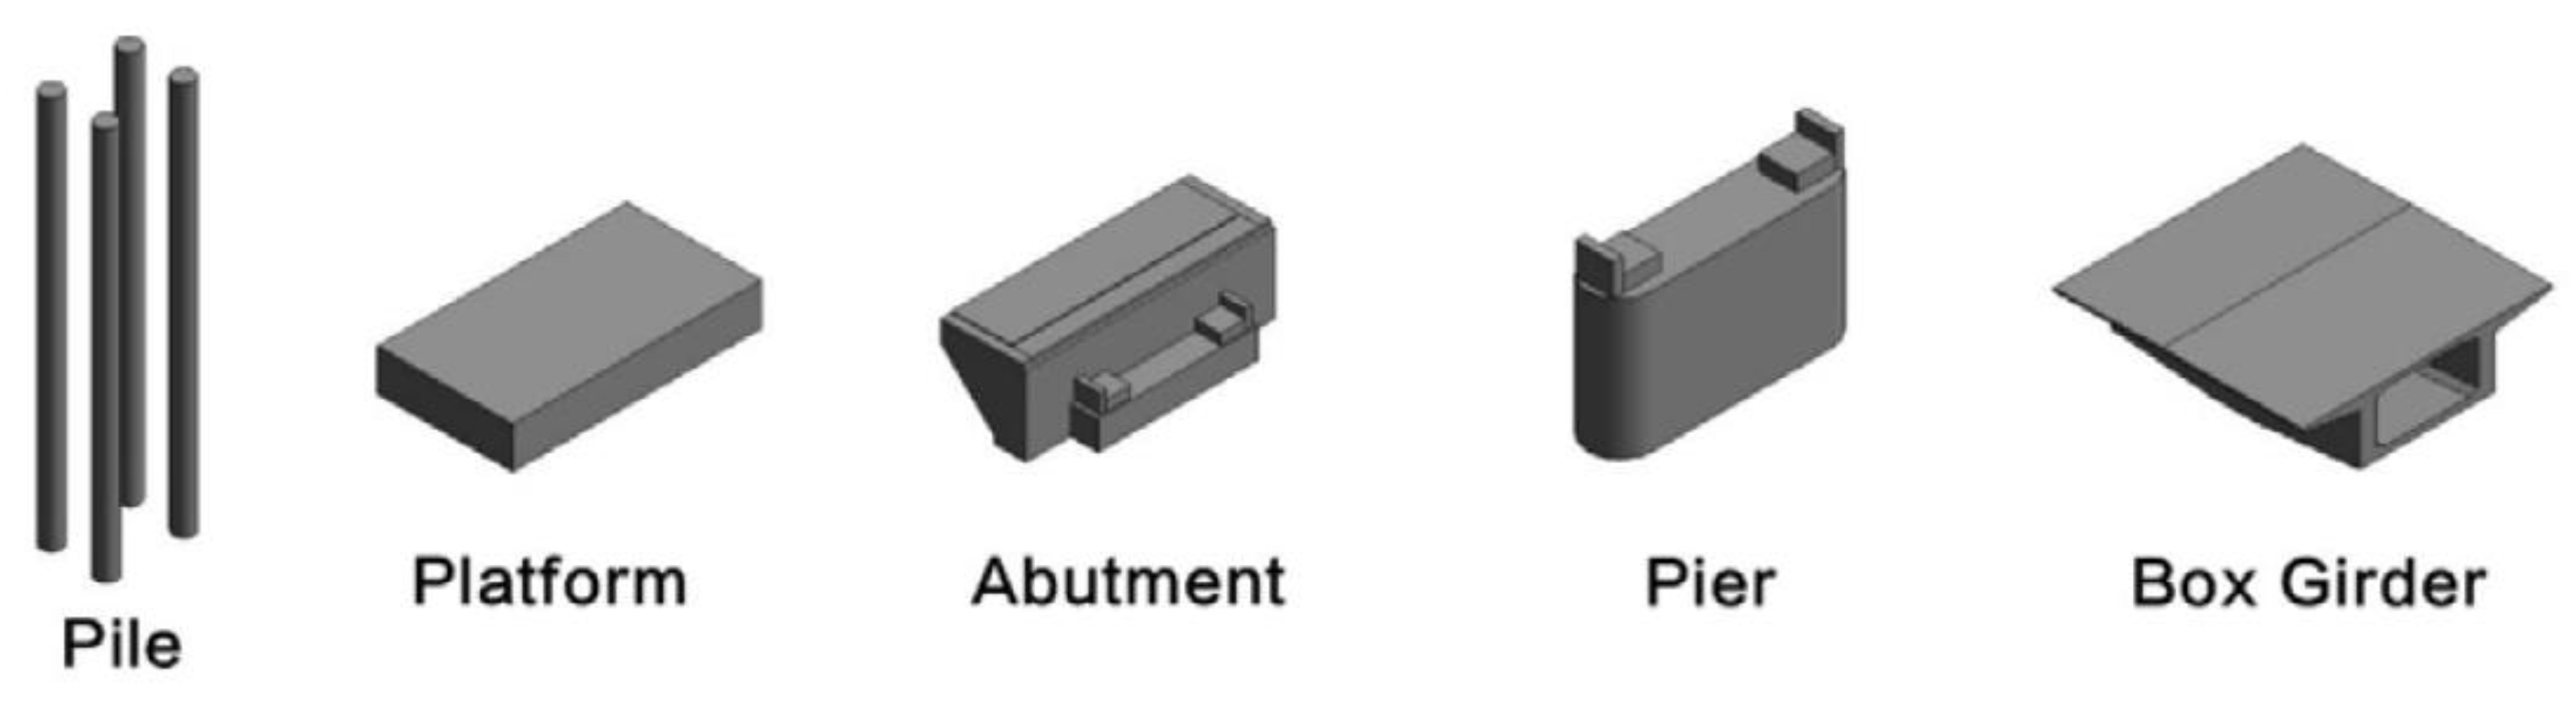
Figure 1 shows the LOD 300 3D BIM model simulation. Each component with its unique information was generated using Revit, and this software can also help designers or constructors to visualise the complex structure by examining individual components separated from the whole structure (see
Figure 2).
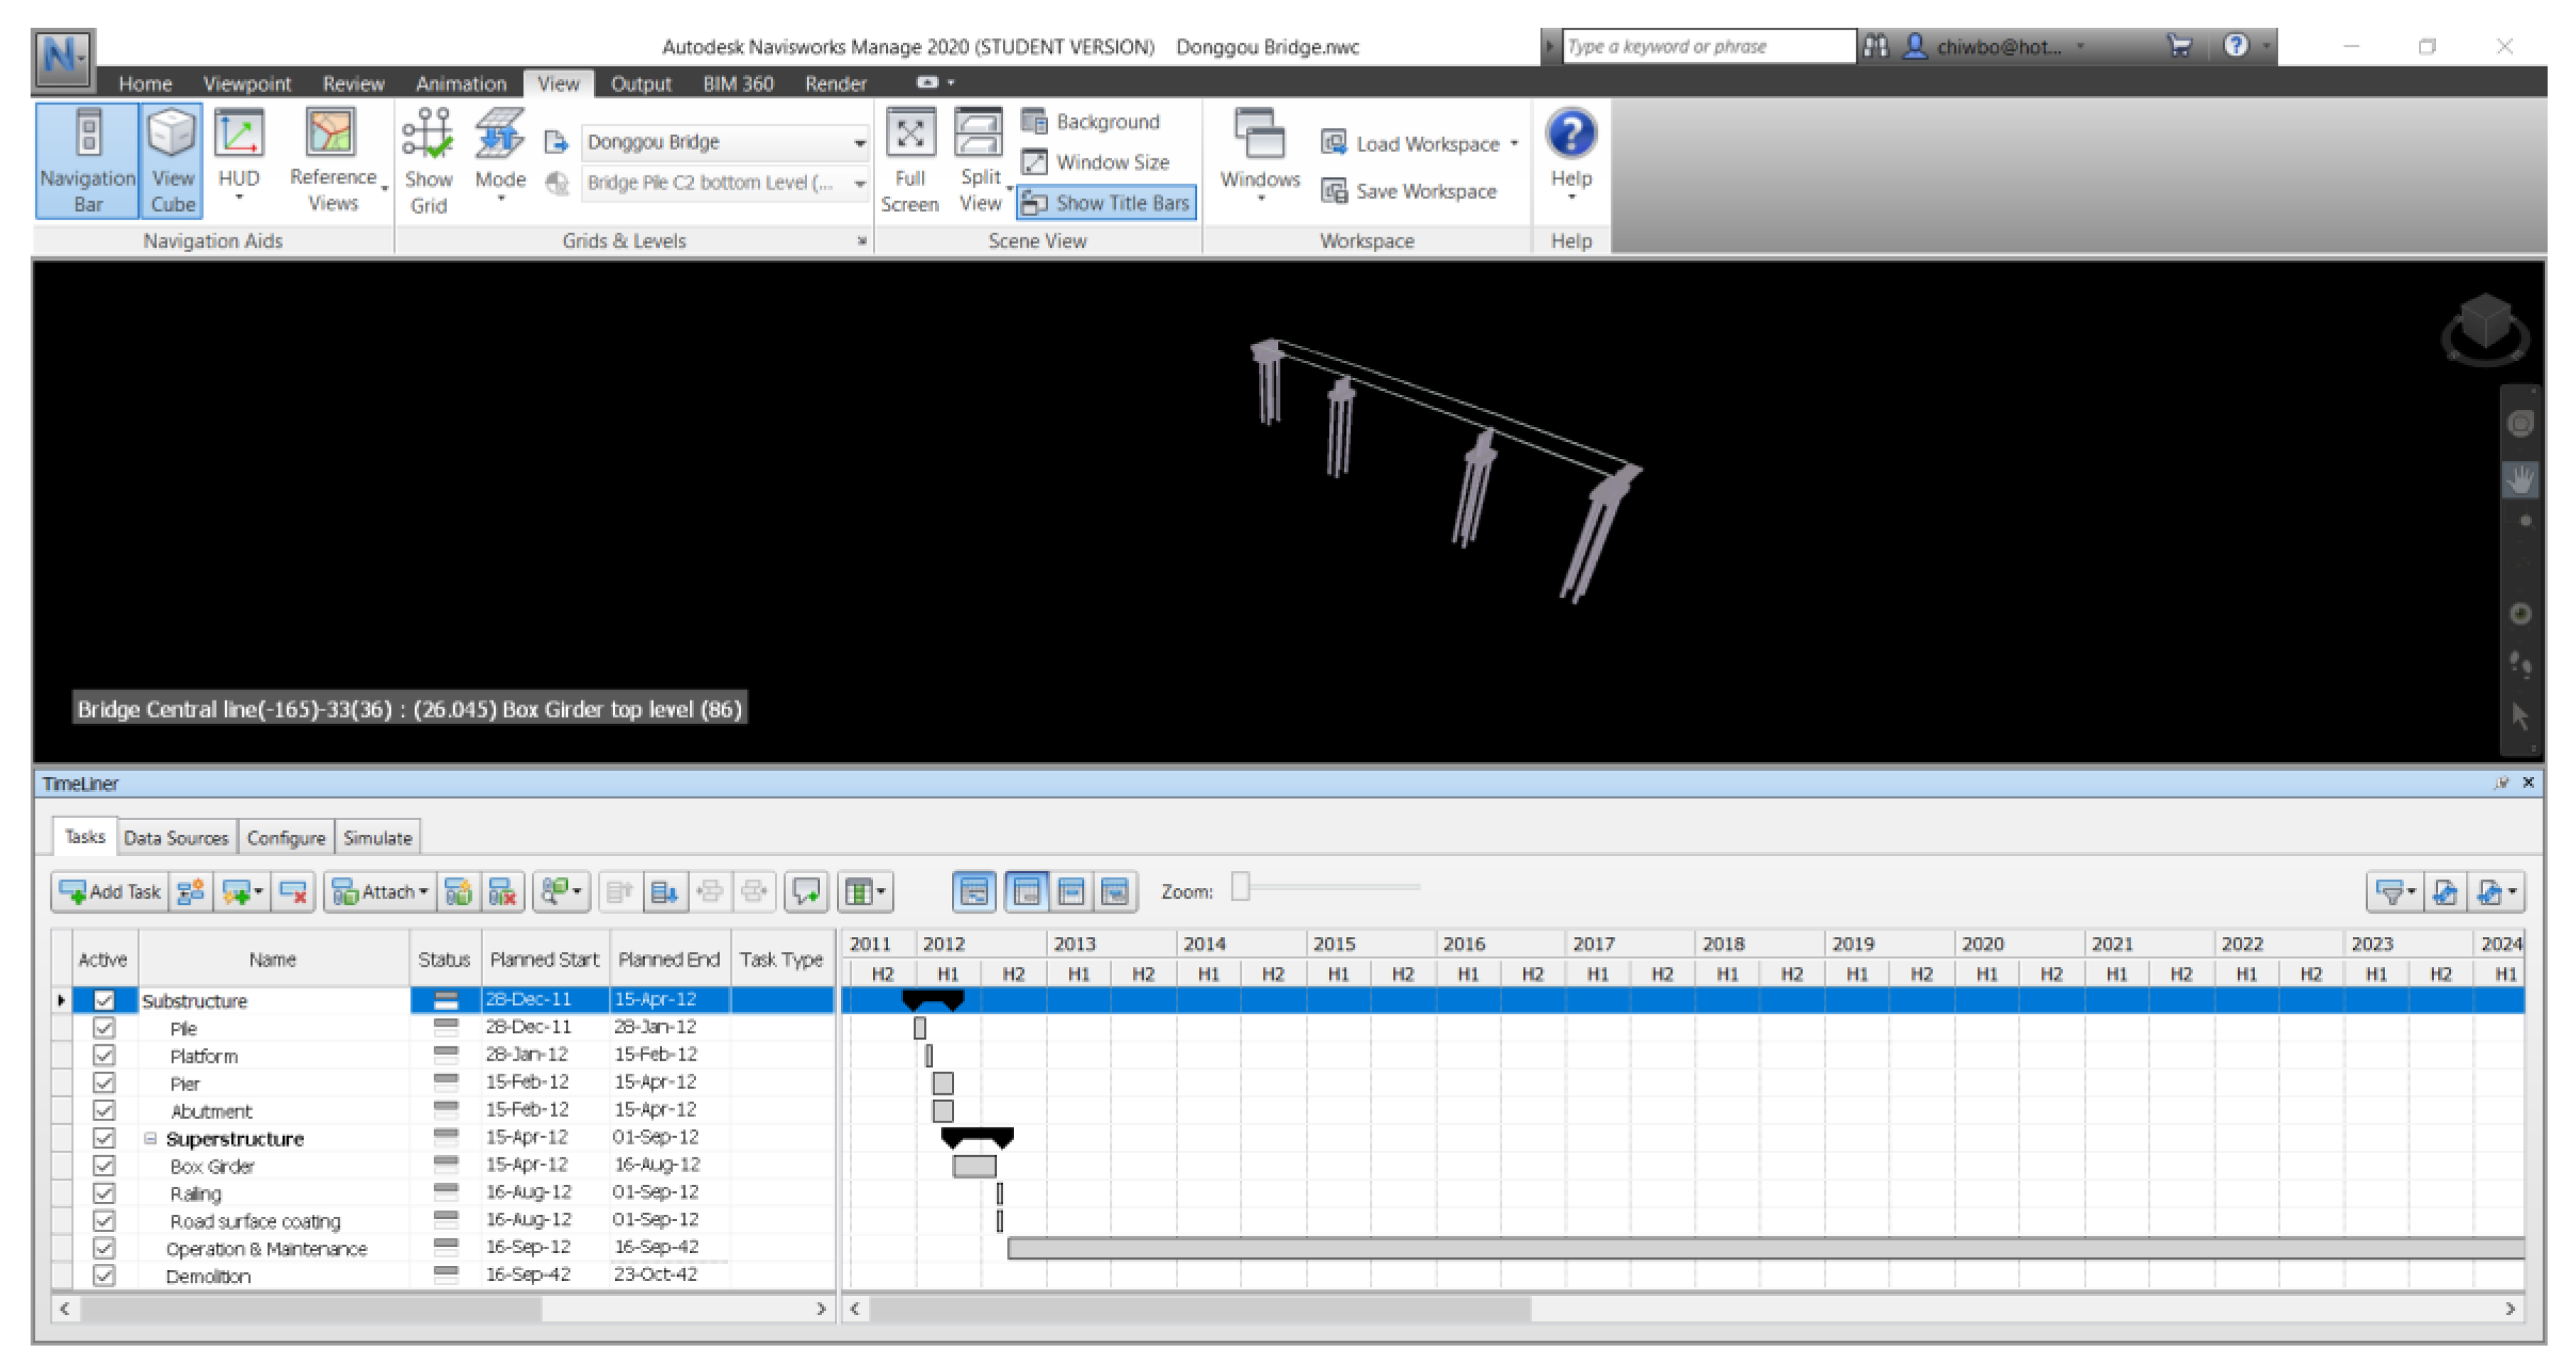
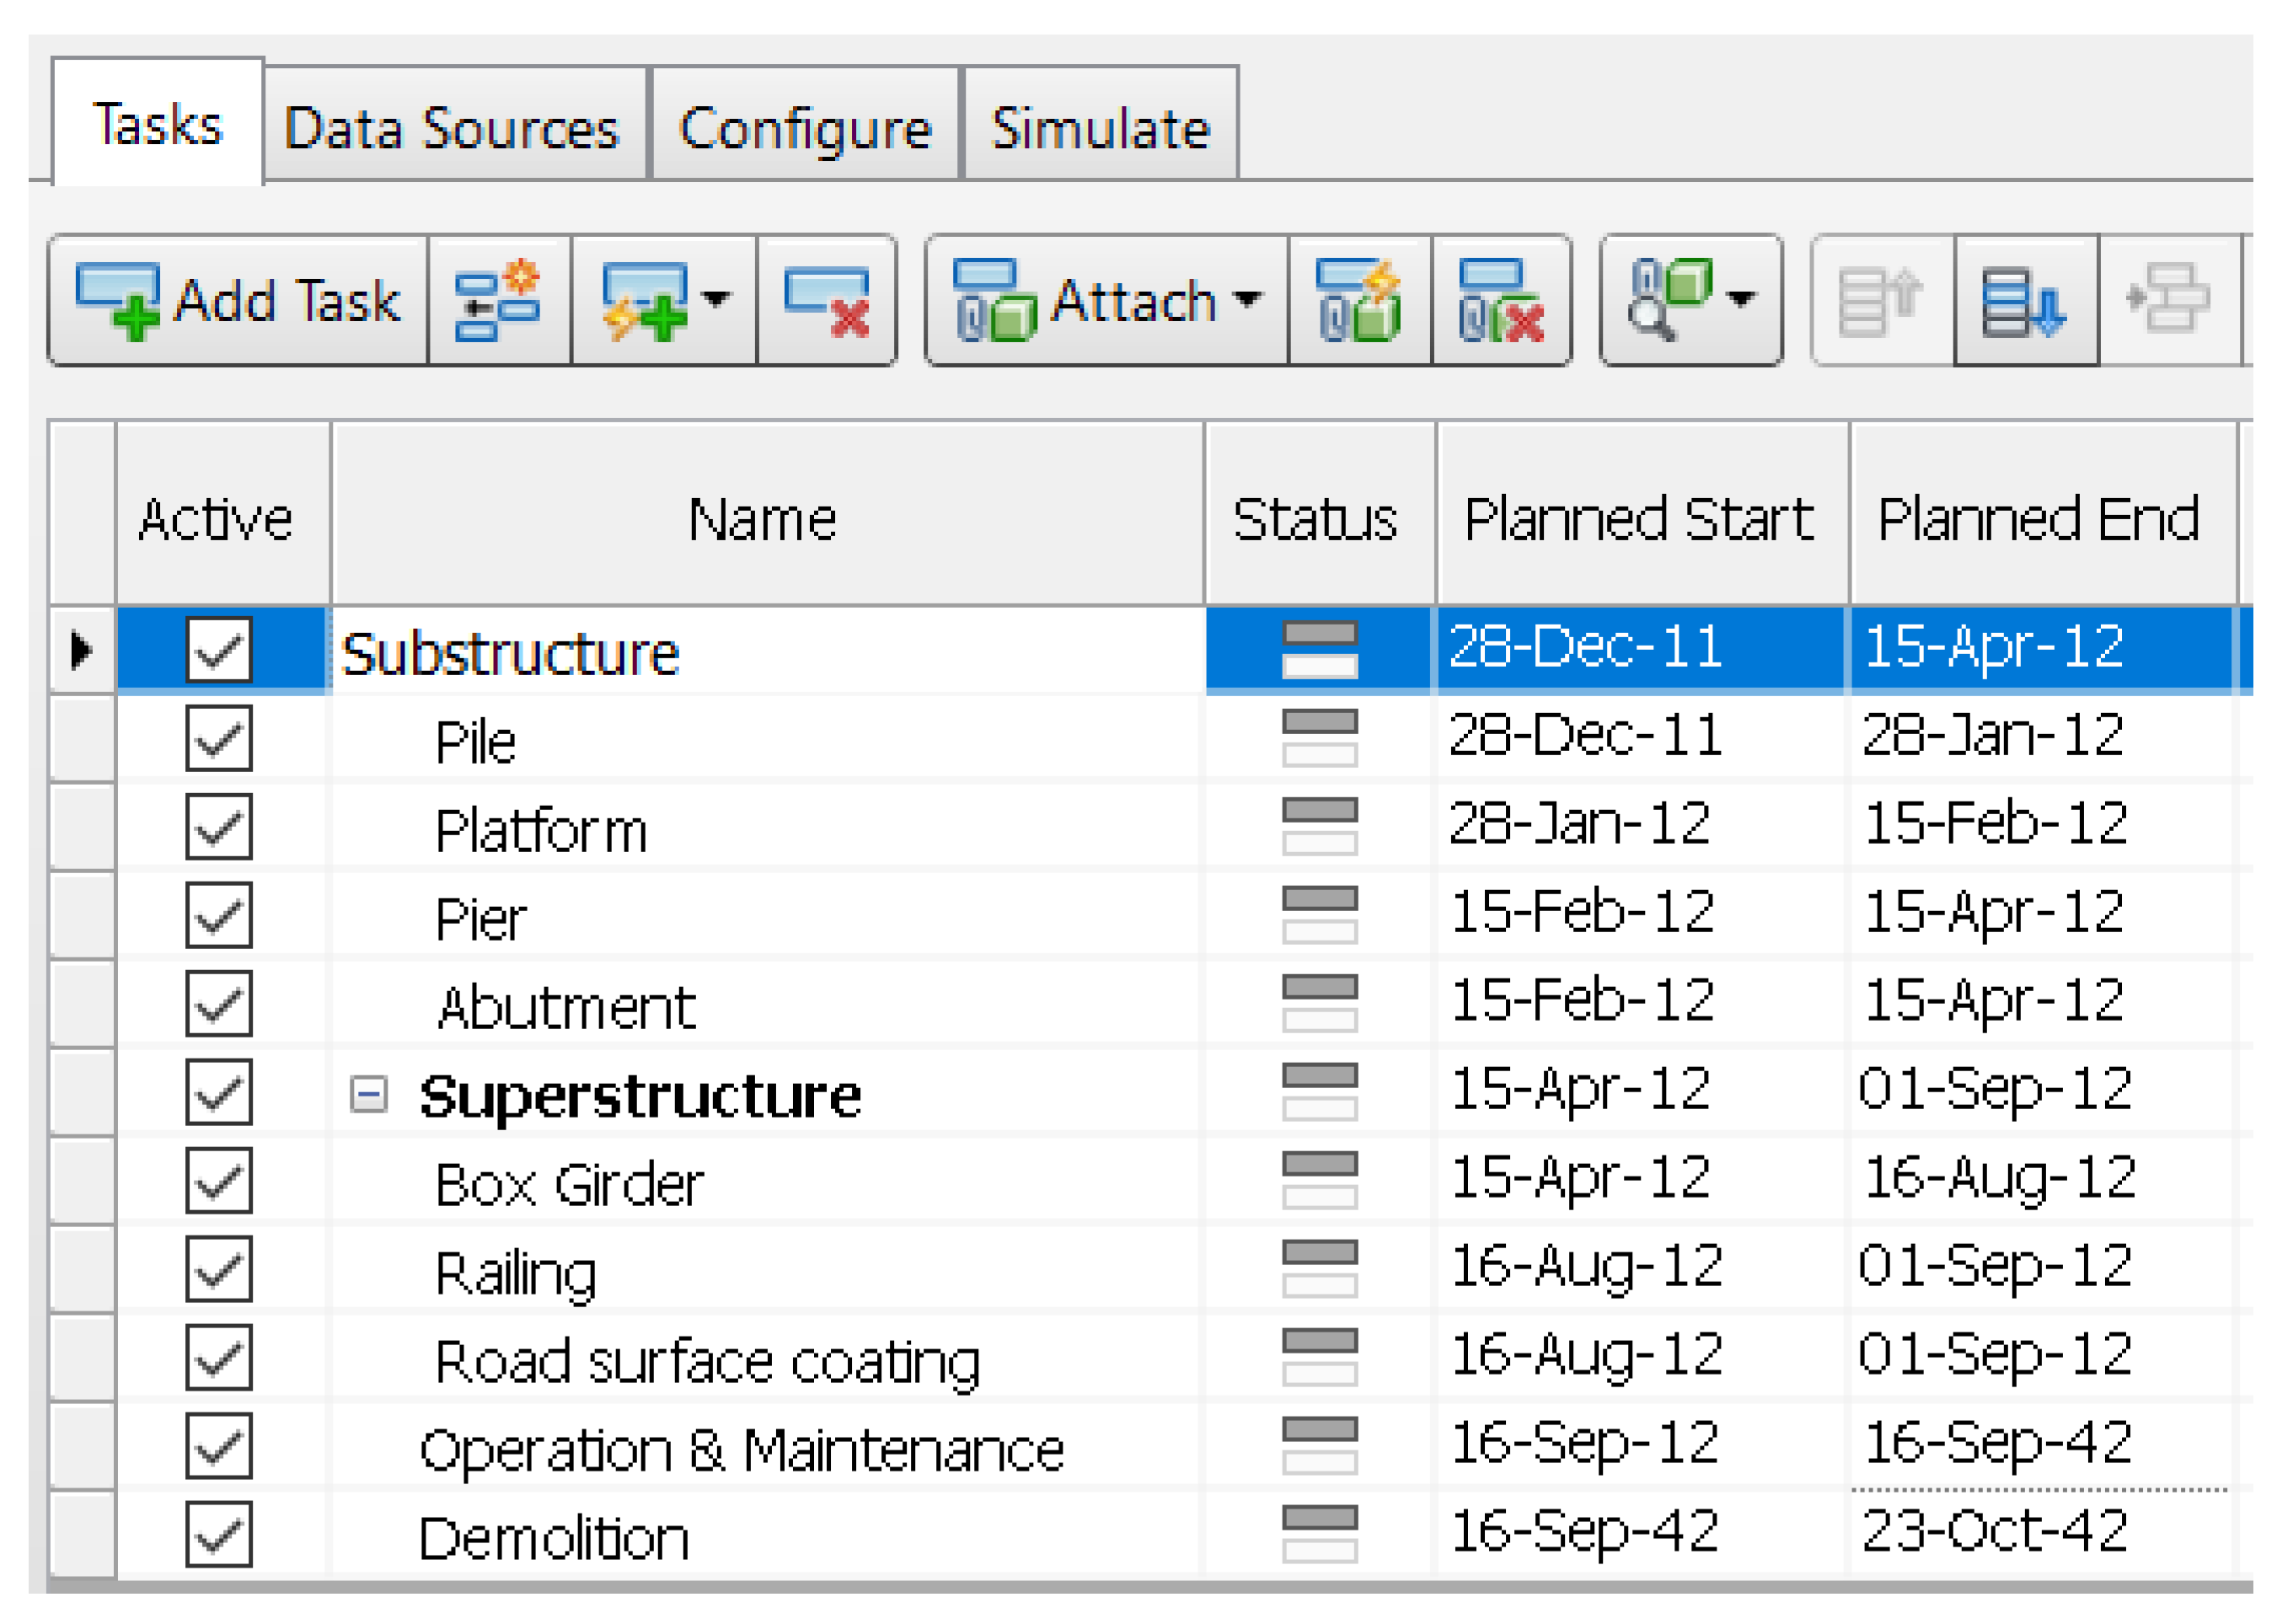
5.2. Donggou Bridge Construction Schedule and the 4D Model
After the model of Donggou Bridge was generated, a new dimension was added to the 3D model. The time factor, as the fourth dimension, is suggested to generate and evaluate the overall constructability [
30]. Adding the information on time as the fourth dimension to the 3D BIM model can help to identify possible mistakes or conflicts in the early stages of the project’s lifecycle and help associated stakeholders to optimise the construction as much as possible [
31]. After extraction of the 3D model information from Revit 2016, the 4D simulation was completed using the Navisworks software. The construction status was visualised in Navisworks following the preparation of the construction schedule in the early stages, and by editing the actual start and end data in Navisworks during the construction stage, the constructor can adjust the construction progress to delay or proceed with the proposed construction schedule.
Figure 3 and
Figure 4 show the estimated construction schedule.
5.3. Generating the Cost Schedule of Donggou Bridge and the 5D Model
For a bridge infrastructure design, most of the cost was from the raw materials and rented machinery involved in the pre-construction and construction stages. Since the cost was mostly unassociated with the operation of the bridge, the cost from the operation and maintenance stages was mainly the maintenance cost.
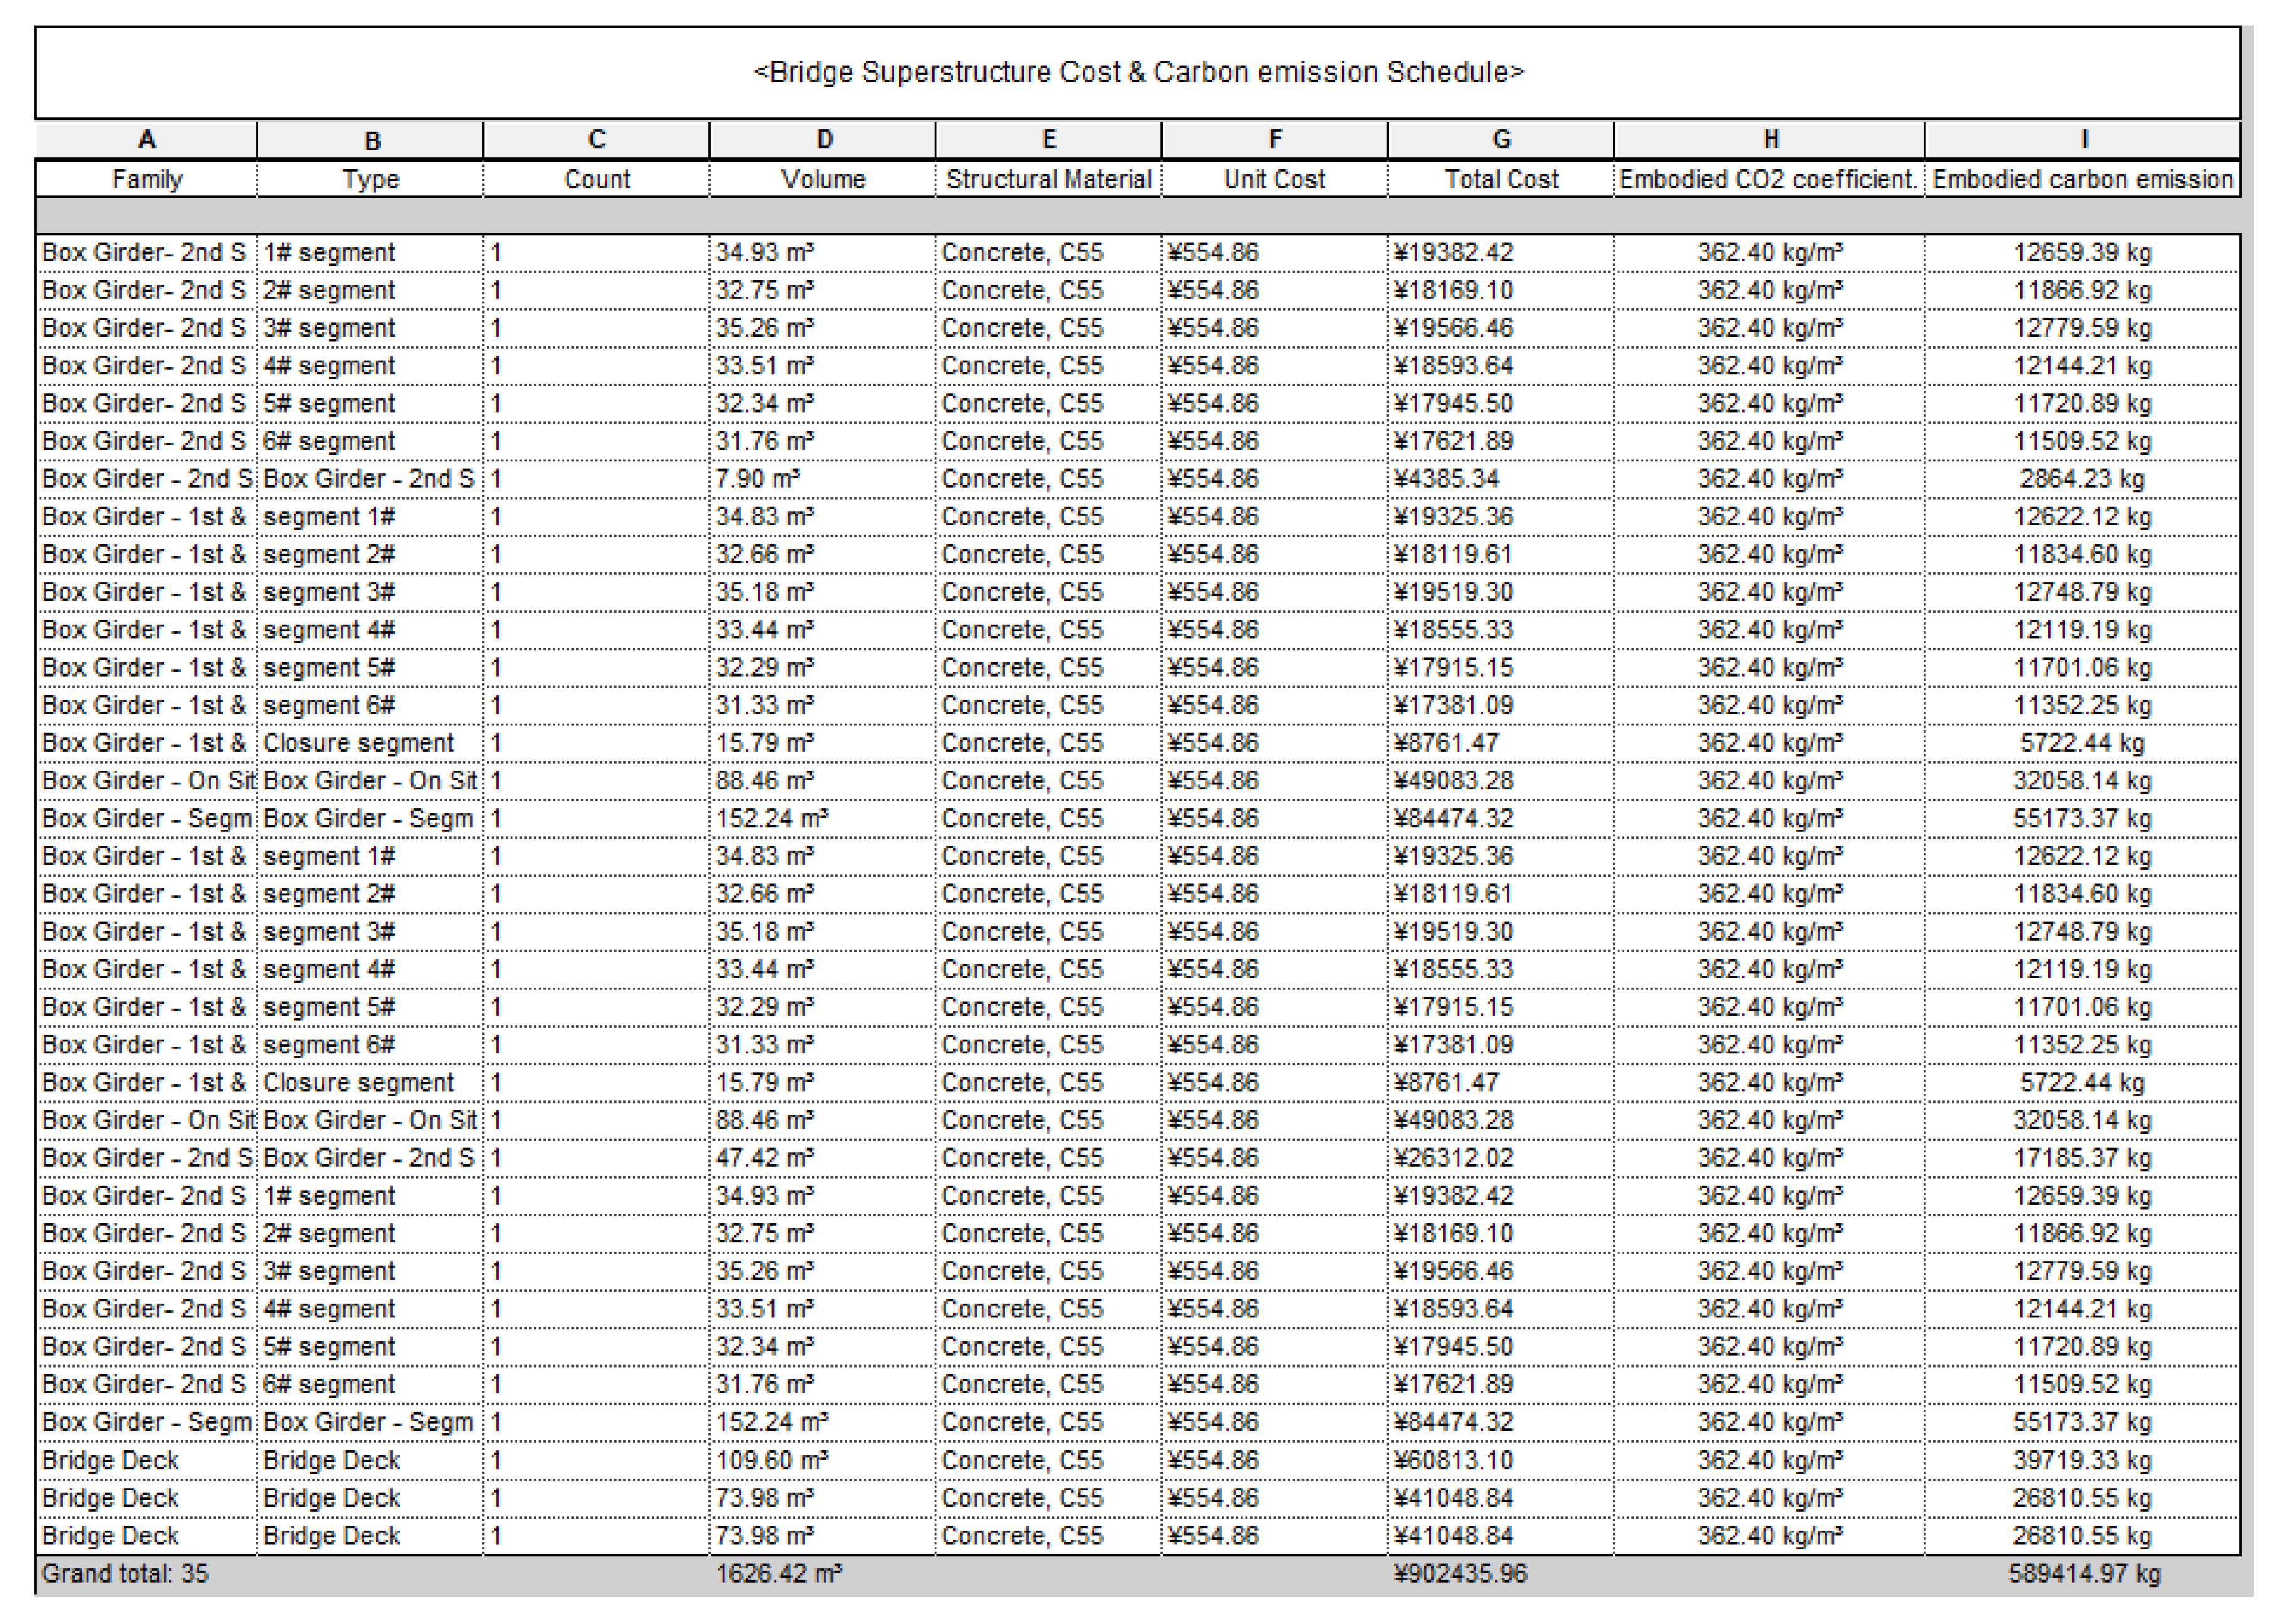
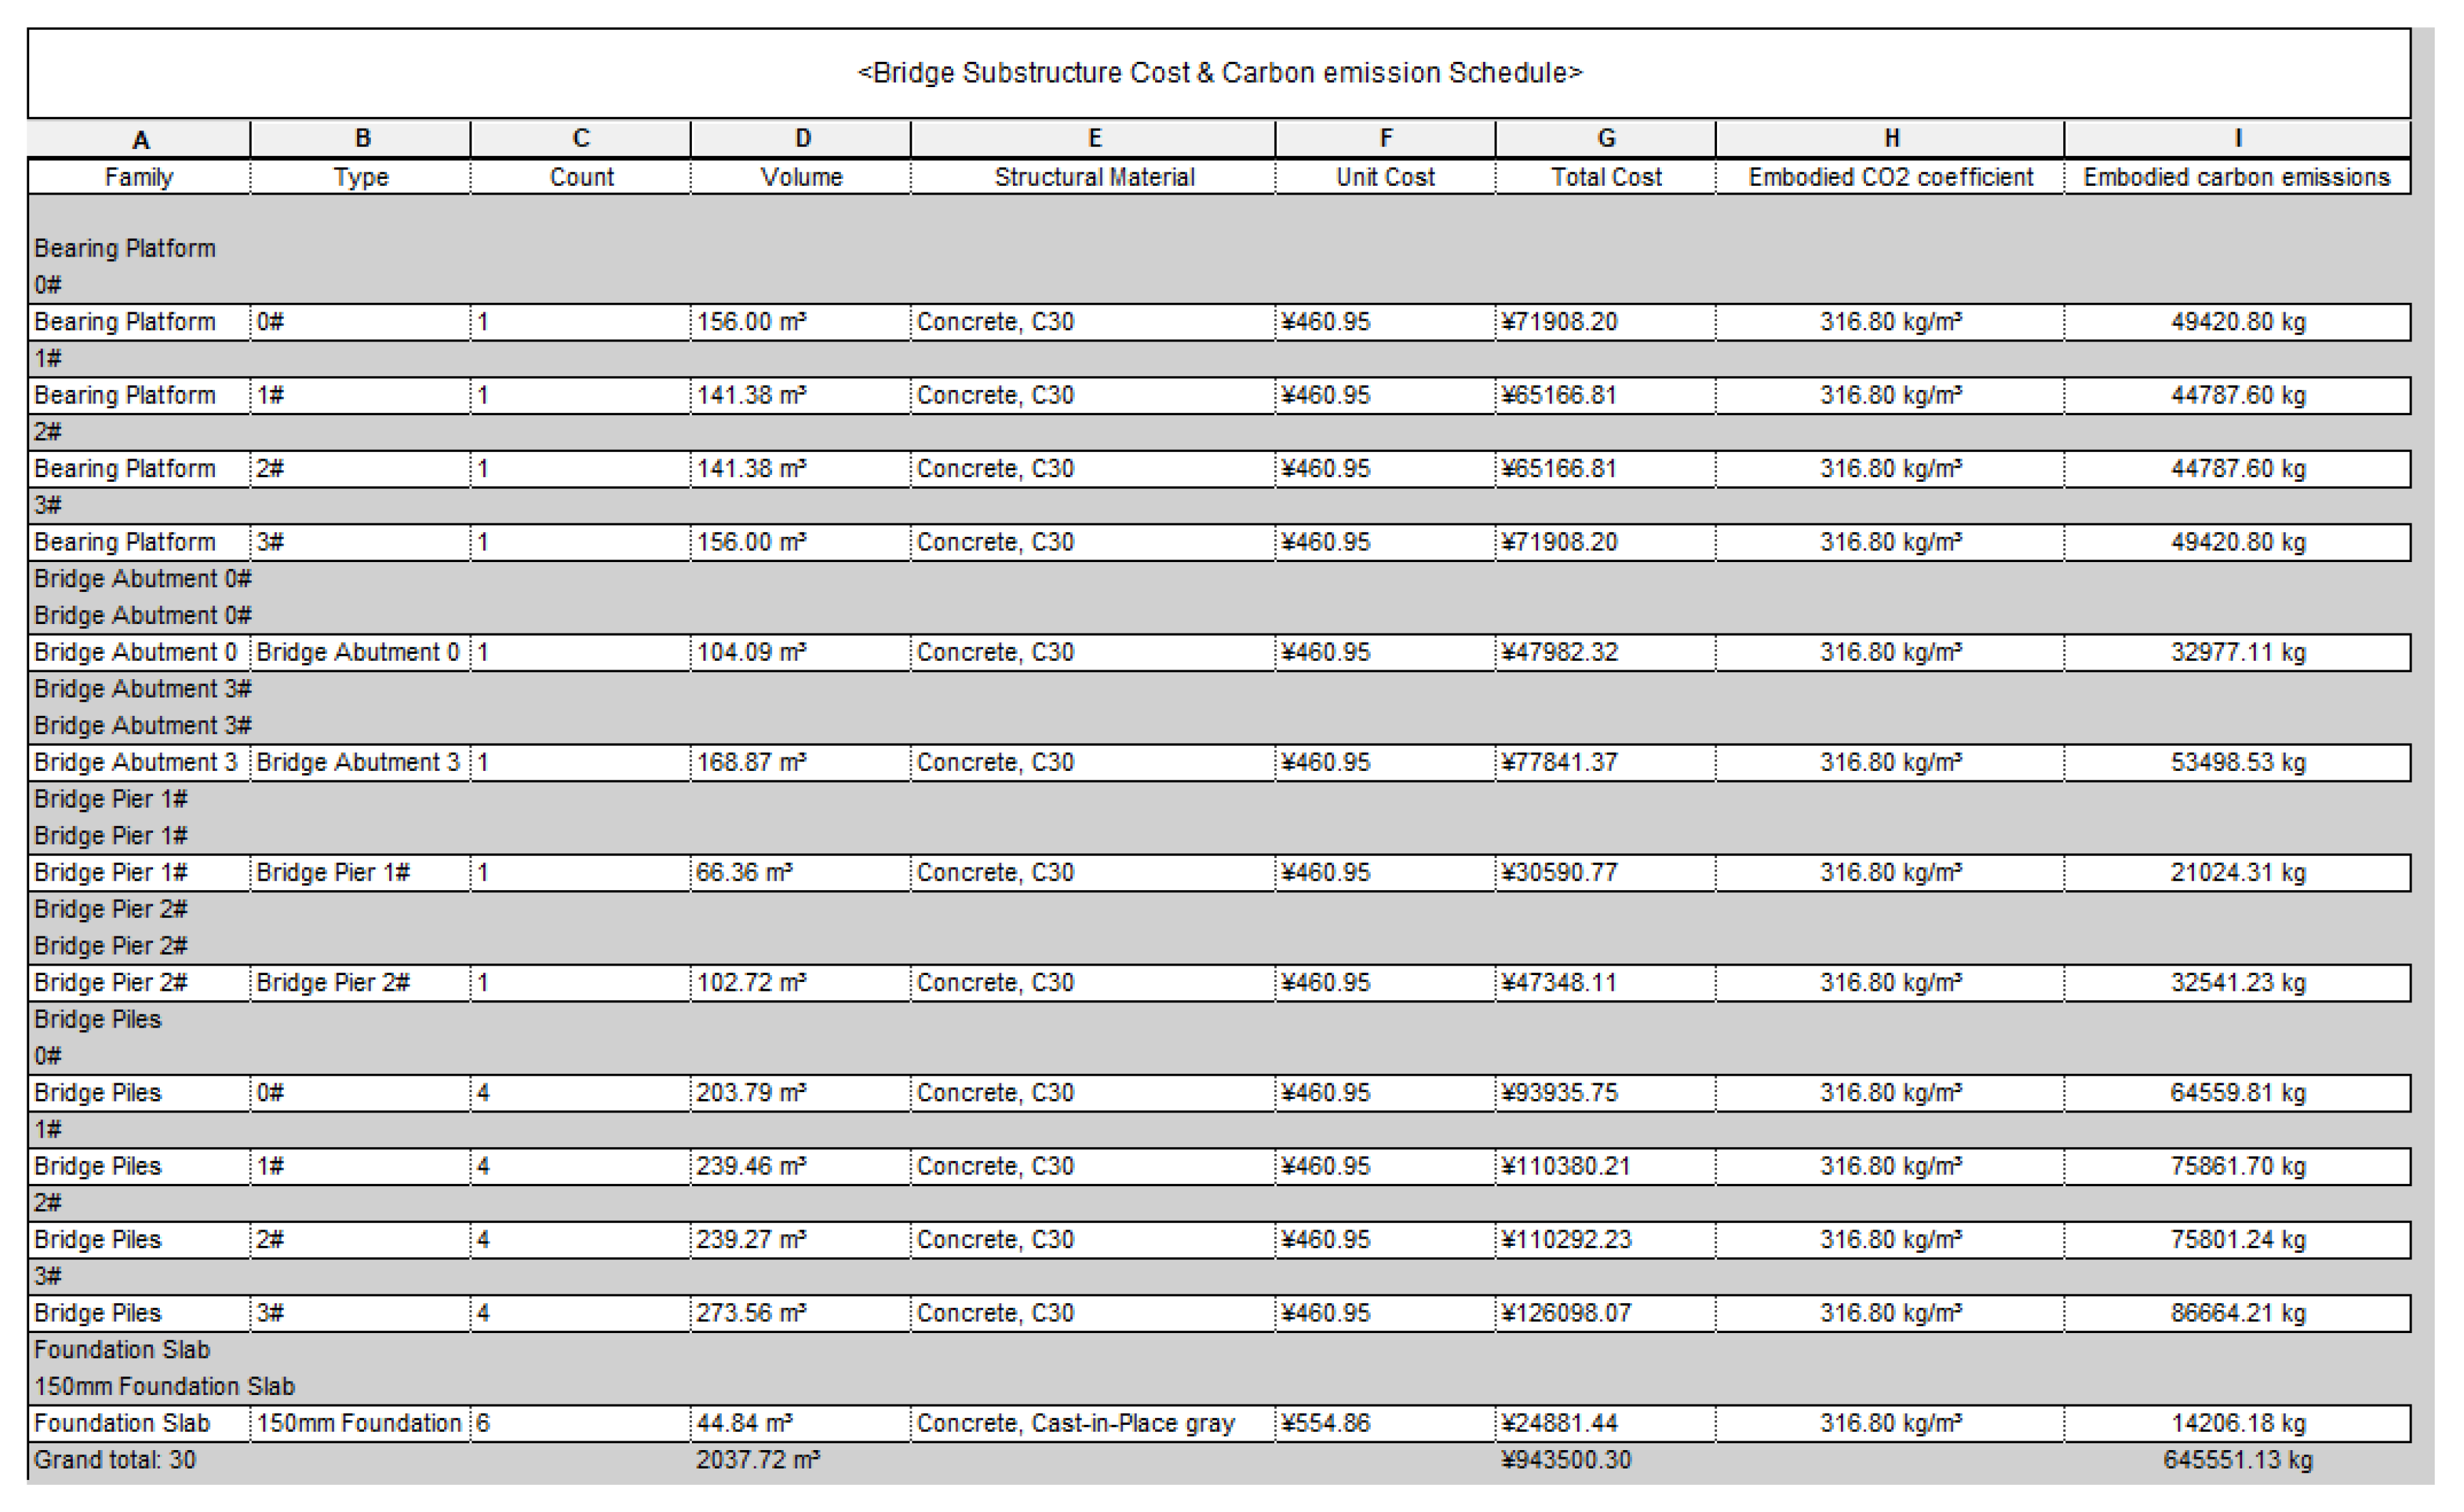
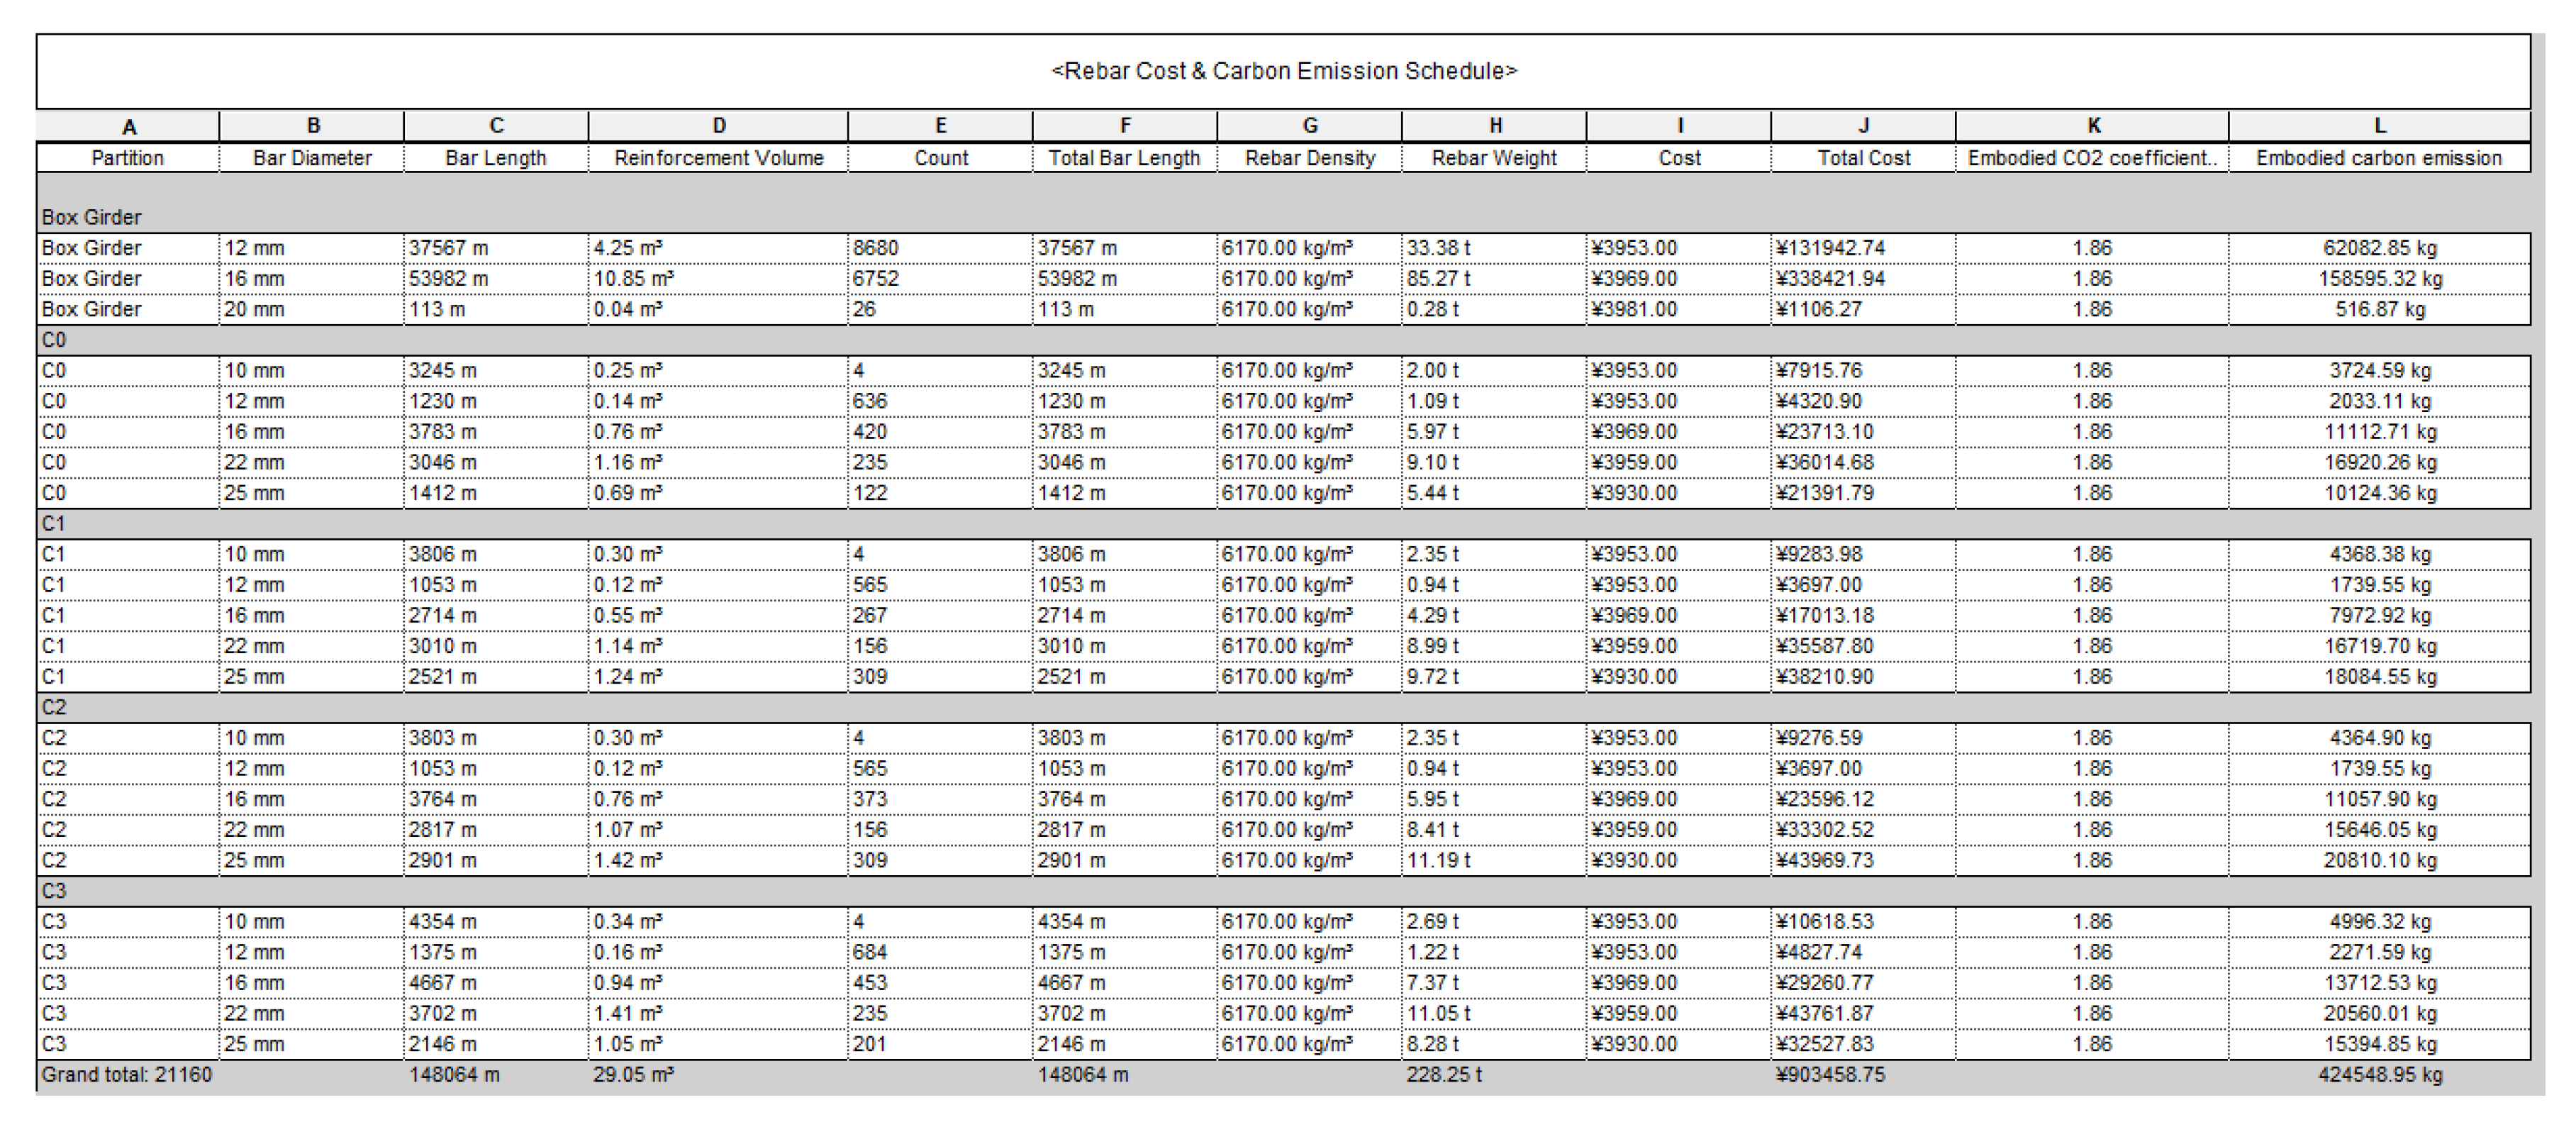
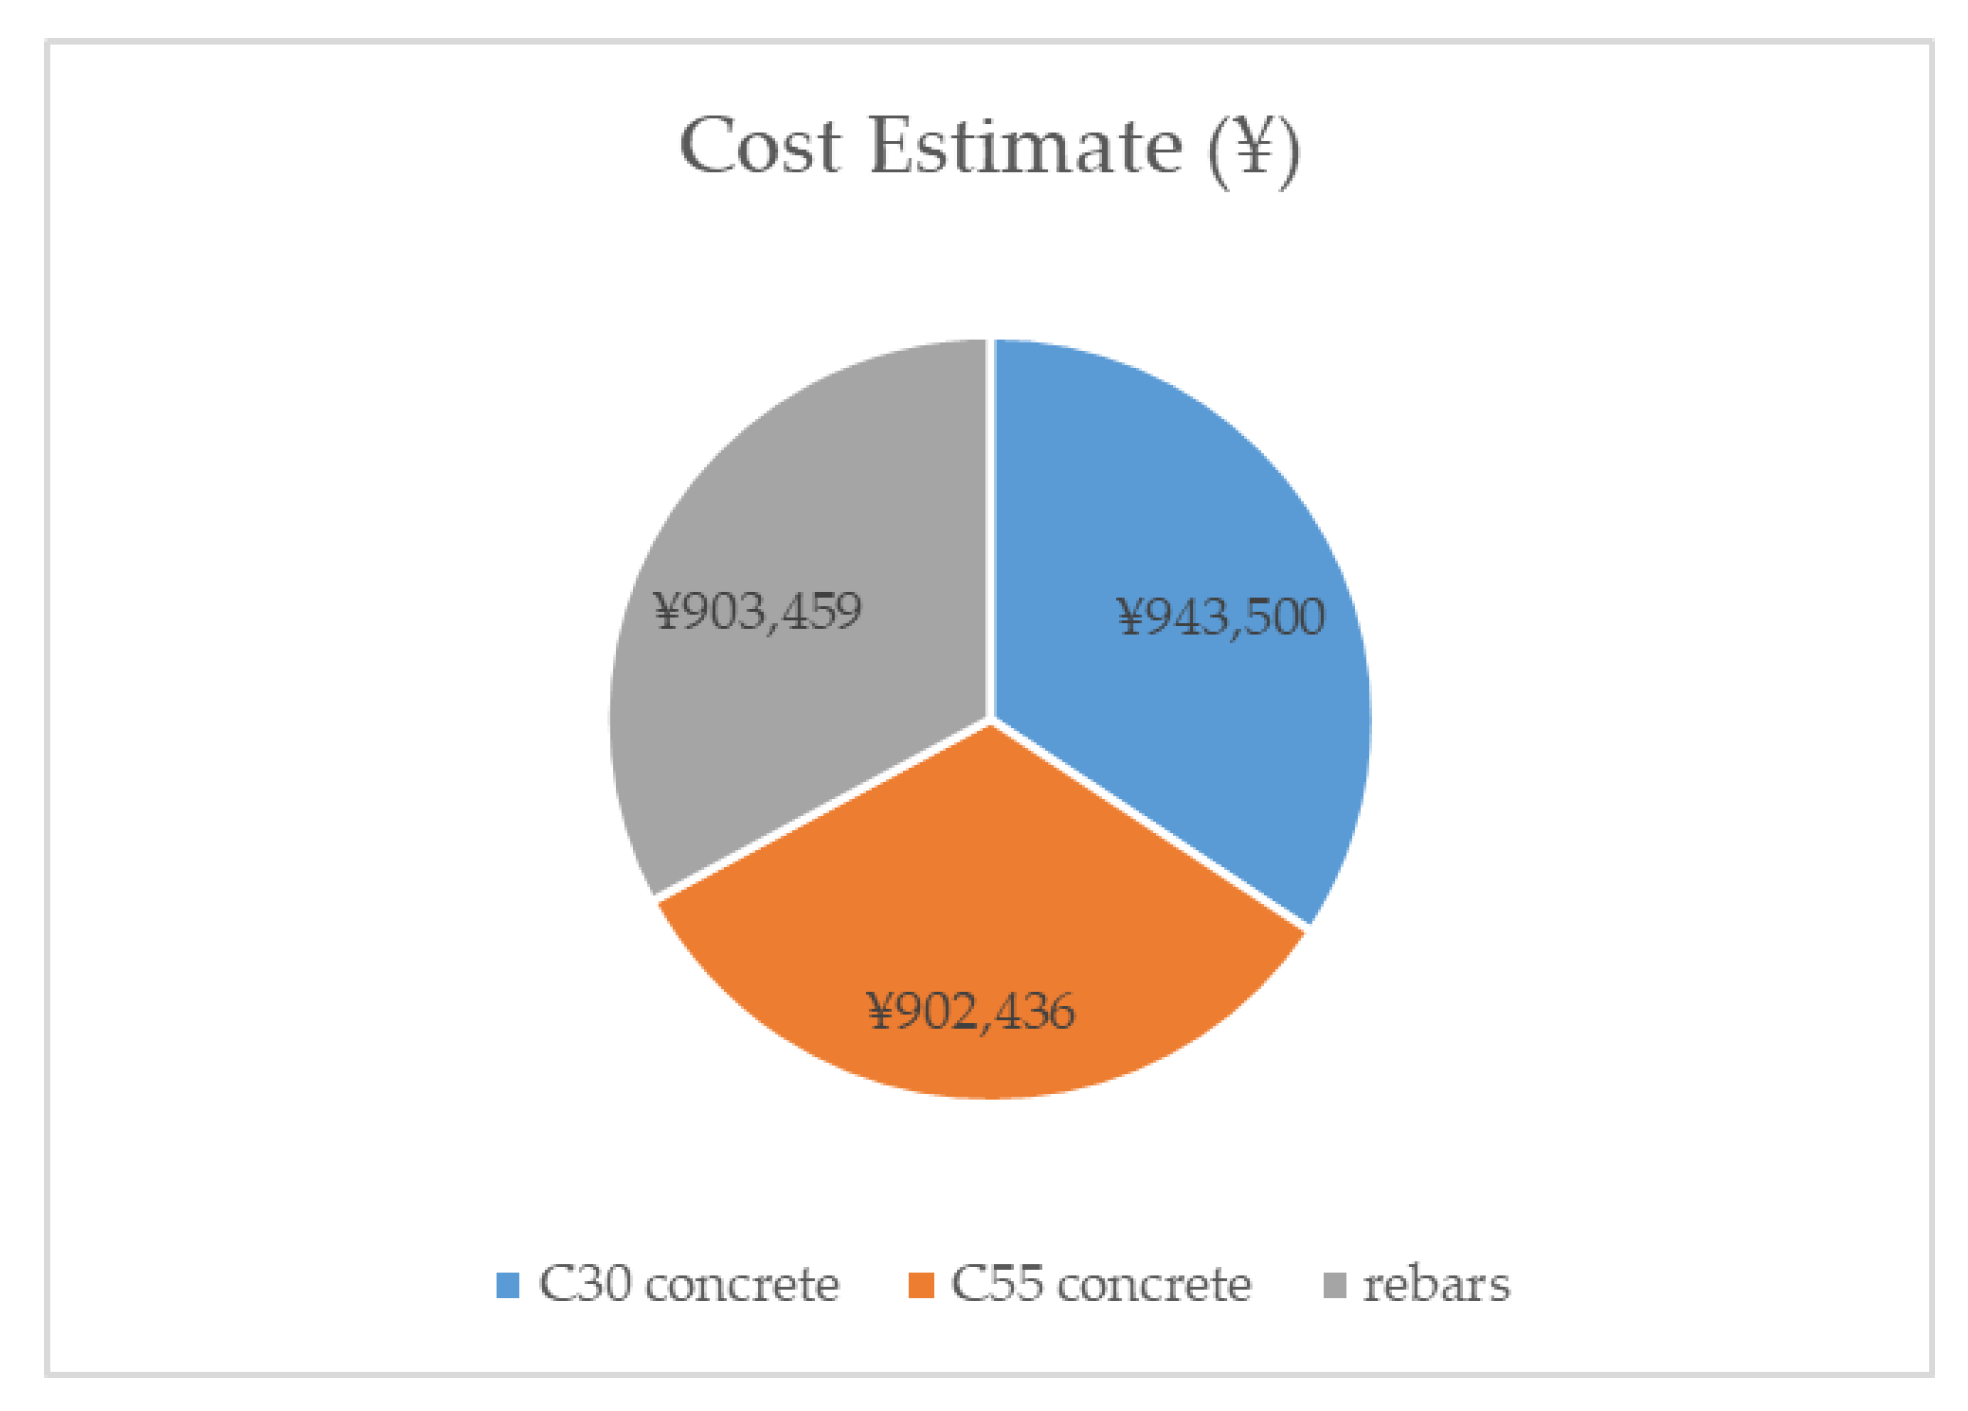
Figure 5,
Figure 6 and
Figure 7 illustrate the cost schedule based on the raw materials generated from the BIM 5D model. Using 5D modelling in the Revit software to generate the cost schedule, the cost estimation for each raw material is ¥943,500 for C30 concrete, ¥902,436 for C55 concrete and ¥903,459 for rebar materials. The concrete constituted 67.1% of raw material costs (see
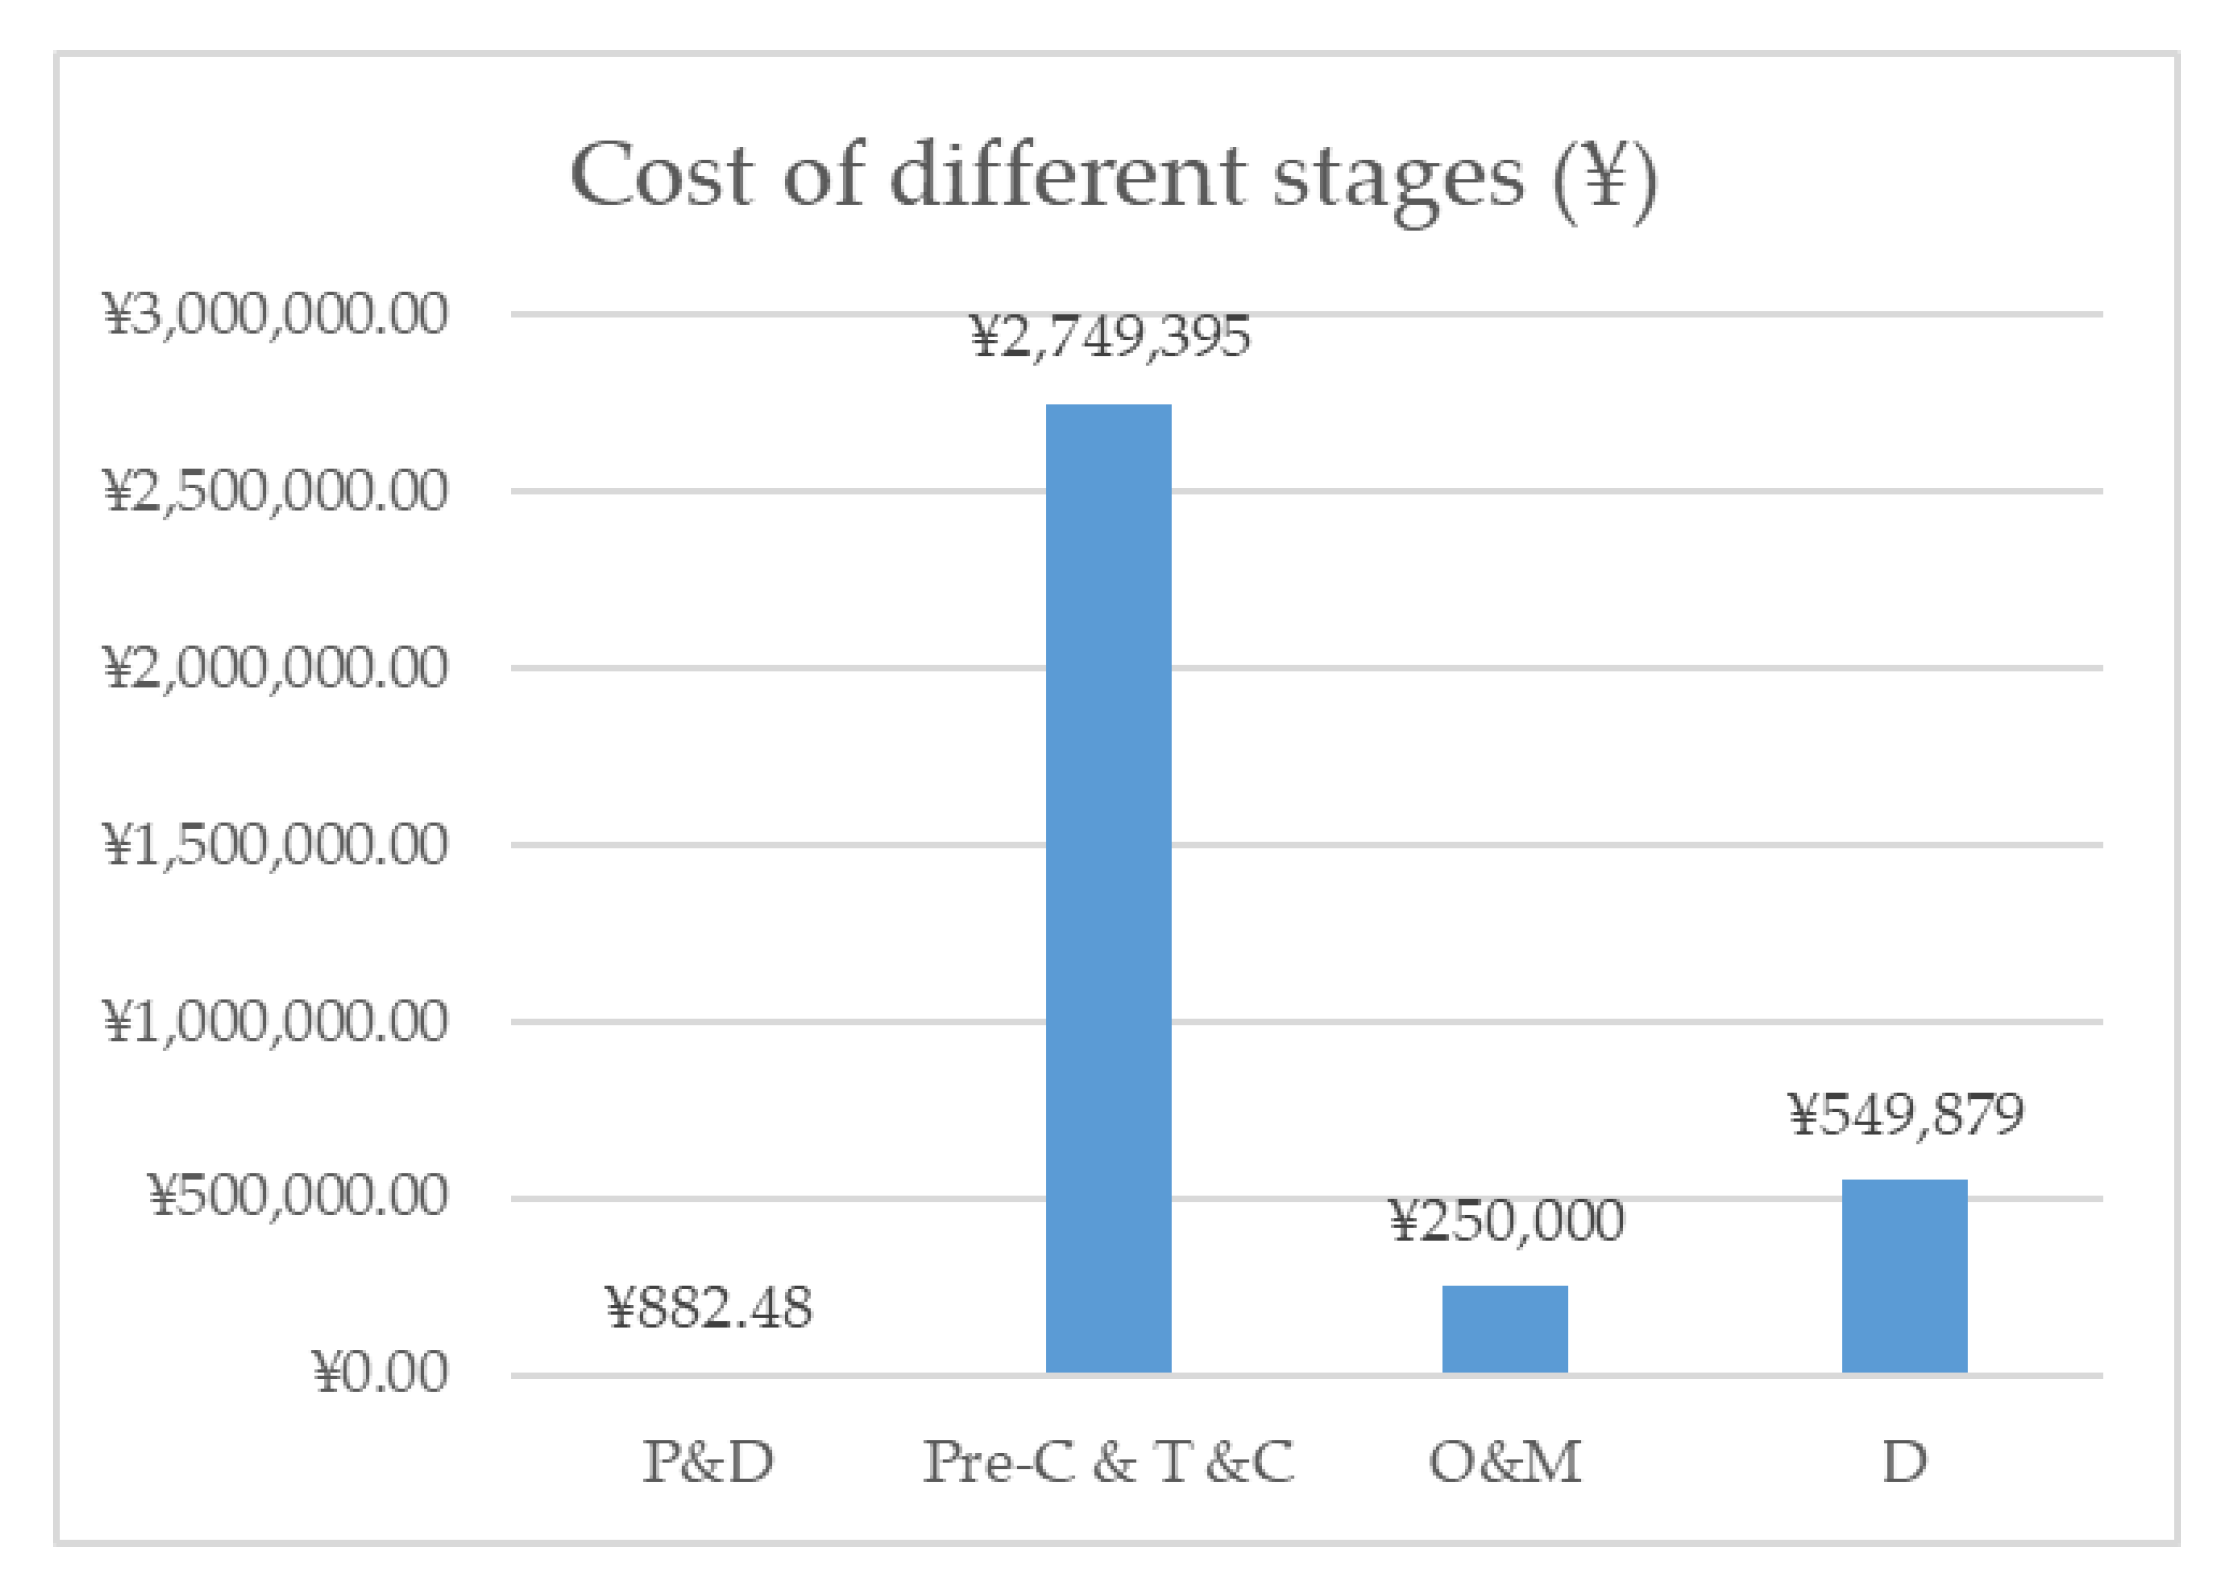
Figure 8). As there is no budgeted amount for demolition cost, it is assumed to be 20% of the construction cost. Lastly, adding other costs, such as the maintenance fees, transportation costs in other stages, and the cost at different stages of the bridge infrastructure, is shown in
Figure 9. The Figure shows that most of the total cost/budget at 77% for the bridge infrastructure design was expended at the construction stage.
5.4. Generating the Carbon Emission with the 6D BIM Model
The sixth-dimensional information is the carbon emission throughout the lifecycle of the bridge infrastructure. The carbon emission in the bridge project will mainly be divided into two categories: the embodied carbon emission of the raw materials and the carbon emission generated from the machinery.
5.4.1. Assessment of Embodied Carbon Emissions from the Raw Materials
The embodied equivalent CO2 emission from the raw materials was calculated based on the CO2e factors from Hammond and Jones [
27]. The CO2 emission results obtained from the BIM 6D Model were 645.55t embodied carbon emission from C30 concrete, 589.41t embodied carbon emission from C50 concrete, and 424.55t embodied carbon emission from rebar materials (see
Figure 5,
Figure 6 and
Figure 7).
5.4.2. Assessment of Embodied Carbon Emission from the Machinery
Based on the researchers’ previous experience on a similar bridge project,
Table 3 shows the types and numbers of machines used during the entire lifecycle of the bridge project. The energy consumption of each machine was generated by reviewing the specifications of common machine models, and the detailed energy consumptions include 29 litres diesel/hour from the drilling machine, 3.823 kW/h from the welder, 7.5 kW/h from the bar straightening and cutting machine, 76 litres diesel/hour from a 25t crane truck, 105 litres diesel/h from a 200t crane truck, 0.37 litres diesel/km from one concrete mixer truck of 12 m3 capacity and 0.071 litres fuel/km from the staff vehicle.
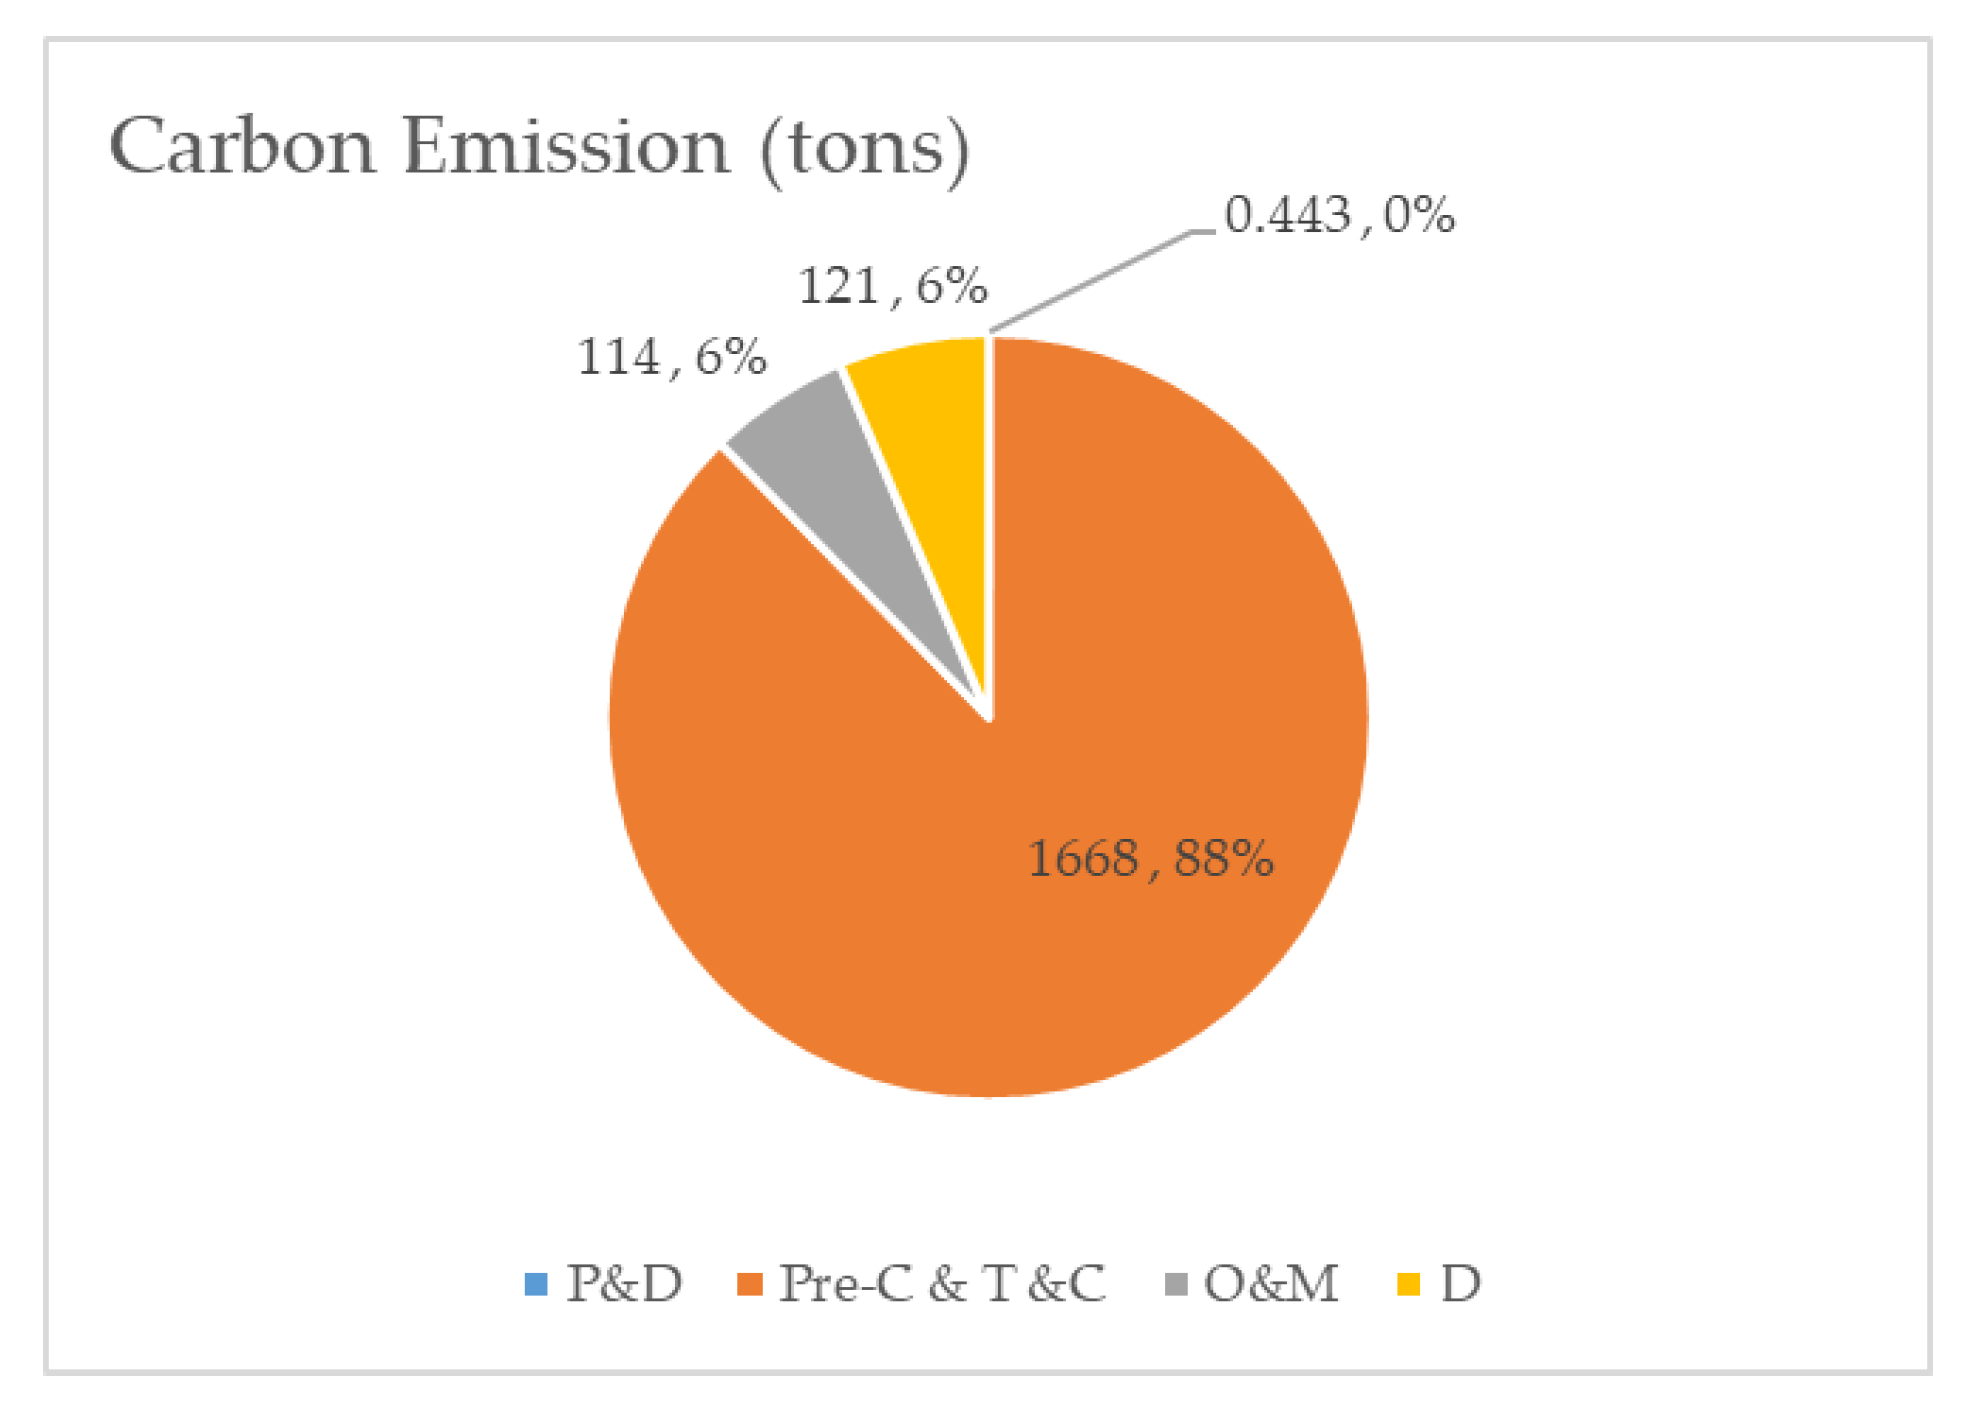
By using the generated coefficient factor [
26,
28,
29,
30], carbon emission figures from 6D BIM modelling throughout the lifecycle of the bridge project are shown below (
Figure 10). The figure shows that the pre-construction, material transportation, and construction stage had the most carbon emissions. With the 6D BIM modelling created in the early stages, the designer and owners can easily develop a more sustainable plan without time-consuming work in the late stages, considering both the cost and carbon emissions.
6. Discussion
Although BIM originated in the 1970s, projects began to implement the approach from the mid-2000s [
14]. Concerning bridge infrastructure, BIM can be used to develop an information platform for further analysis like the 4D, 5D and 6D models and even to nD, as shown above, and in several studies. From the results of this study, most of the costs and carbon emissions take place during the construction and operation stages. To improve cost efficiency, BIM can be used to manage the cost of the project during construction. At the same time, BIM can help to reduce the rework amount, which plays an important role in cost management. However, it should be noted that BIM application also has the cost of complexity and implementation, because BIM can add to the complexity of the work and staff in various projects need to learn about BIM [
32,
33,
34,
35,
36,
37]. This is consistent with the study by Fanning et al. [
38] and Liu et al. [
39]. To reduce carbon emission, low-carbon material can be used to construct the project [
40]. Using clean energy or renewable energy instead of fossil fuel will help to reduce carbon emissions, such as the use of machines with fuel cells or electric machines. BIM can also serve as an information platform to create a beneficial environment for different stakeholders to exchange information and collaborate to fix a potential risk or develop a better plan for the project in the early stages. Adopting BIM technology with LCA can help to achieve a satisfying outcome for all stakeholders. Nevertheless, research on bridge infrastructure with BIM adoption and LCA remains limited. This study only proposed a primary approach to generating the LCA of a bridge project using 6D BIM methods.
In a nutshell, the 6D BIM approach can be beneficial for avoiding the errors of manual re-entry, reducing the time spent on complex designs, identifying the risk in advance, reducing the cost of capital and carbon emissions, and generating a better information exchange platform.
7. Conclusions
This research developed the first 6D BIM approach for bridge infrastructure. Although investigations were limited to the Donggou Bridge, the study indicated a path to adopting BIM technology on constructed or proposed bridge infrastructures. Evidently, the 6D BIM approach can potentially release the bridge designer from tedious and time-consuming work, such as extracting information from countless 2D drafts and preventing data errors in the early stages of the bridge’s lifecycle. Adopting the BIM technique on bridge projects will also help stakeholders, particularly designers and owners, to visualise the bridge structure before construction. Regarding bridge project modelling, however, BIM is limited, as the software is more compatible with a standard building environment. BIM software needs further development to improve its compatibility with complex bridge modelling, such the ability to automatically detect the complex beam family and create a faster approach for connecting rebars to the bridge structure, instead of attaching them individually. Nonetheless, BIM modelling is a new technique which requires further investigation to discover its real potential for all stakeholders, and it is expected that it will start a revolution in digital design for the AEC industry.
Author Contributions
Conceptualization, S.K. and Z.Z.; methodology, Z.Z.; software, Z.Z.; validation, Z.Z.; formal analysis, Z.Z.; investigation, Z.Z.; resources, S.K.; data curation, Z.Z. and J.S.; writing—original draft preparation, Z.Z.; writing—review and editing, J.S.; visualization, Z.Z.; supervision, S.K.; project administration, S.K. All authors have read and agreed to the published version of the manuscript.
Funding
This research was funded by the European Commission for the financial sponsorship of the H2020-MSCA-RISE Project No. 691135 “Rail Infrastructure Systems Engineering Network (RISEN)”, which enables a global research network that tackles the grand challenge in railway infrastructure resilience and advanced sensing. The APC is sponsored by the University of Birmingham’s Open Access Fund.
Acknowledgments
The first author is grateful to the Australian Academy of Science (AAS) and Japan Society for the Promotion of Sciences (JSPS) for his JSPS Invitation Fellowship for Research (Long-term), Grant No. JSPS-L15701, at the Railway Technical Research Institute (RTRI) and the University of Tokyo, Japan. The second author gratefully appreciates the Royal Thai Government for his PhD scholarship. The authors are sincerely grateful to the European Commission for the financial sponsorship of the H2020-MSCA-RISE Project No. 691135 “RISEN: Rail Infrastructure Systems Engineering Network”, which enables a global research network that tackles the grand challenge in railway infrastructure resilience and advanced sensing [
41].
Conflicts of Interest
The authors declare no conflict of interest.
References
- Woetzel, J.; Garemo, N.; Mischke, J.; Kamra, P.; Palter, R. Bridging Infrastructure Gaps: Has the World Made Progress? McKinsey Co. 2017. Available online: https://www.mckinsey.com/industries/capital-projects-and-infrastructure/our-insights/bridging-infrastructure-gaps-has-the-world-made-progress (accessed on 19 March 2020).
- Fumo, N.; Mago, P.; Luck, R. Methodology to estimate building energy consumption using EnergyPlus Benchmark Models. Energy Build. 2010, 42, 2331–2337. [Google Scholar] [CrossRef]
- Scientific Applications International Corporation; Curran, M.A. Life-Cycle Assessment: Principles and Practice; National Risk Management Research Laboratory, Office of Research and Development, US Environmental Protection Agency: Cincinnati, OH, USA, 2006.
- Means, P.; Guggemos, A. Framework for life cycle assessment (LCA) based environmental decision making during the conceptual design phase for commercial buildings. Procedia Eng. 2015, 118, 802–812. [Google Scholar] [CrossRef]
- Yang, X.; Hu, M.; Wu, J.; Zhao, B. Building-information-modeling enabled life cycle assessment, a case study on carbon footprint accounting for a residential building in China. J. Clean. Prod. 2018, 183, 729–743. [Google Scholar] [CrossRef]
- Davidson, I.N.; Skibniewski, M.J. Simulation of automated data collection in buildings. J. Comput. Civ. Eng. 1995, 9, 9–20. [Google Scholar] [CrossRef]
- Azhar, S. Building information modeling (BIM): Trends, benefits, risks, and challenges for the AEC industry. Leadersh. Manag. Eng. 2011, 11, 241–252. [Google Scholar] [CrossRef]
- Cabinet Office, U.K. Government Construction Strategy; Cabinet Office London: London, UK, 2011.
- China Industry Standard. General Specifications for Design of Highway Bridges and Culverts (JTG D60-2015); China Communications Press: Beijing, China, 2015. [Google Scholar]
- Autodesk Inc. WHAT ARE THE BENEFITS OF BIM? 2019. Available online: https://www.autodesk.com/solutions/bim/benefits-of-bim (accessed on 1 August 2019).
- Thompson, D.B.; Miner, R.G. Miner, Building information modeling-BIM: Contractual risks are changing with technology. Available online: https://aepronet.org/documents/building-information-modeling-bim-contractual-risks-are-changing-with-technology/ (accessed on 19 March 2020).
- Sacks, R.; Koskela, L.; Dave, B.A.; Owen, R. Interaction of lean and building information modeling in construction. J. Constr. Eng. Manag. 2010, 136, 968–980. [Google Scholar] [CrossRef]
- Marzouk, M.; Hisham, M. Applications of building information modeling in cost estimation of infrastructure bridges. IJ3DIM 2012, 1, 17–29. [Google Scholar] [CrossRef]
- Azhar, S.; Khalfan, M.; Maqsood, T. Building information modelling (BIM): Now and beyond. Constr. Econ. Build. 2012, 12, 15–28. [Google Scholar] [CrossRef]
- Doumbouya, L.; Gao, G.; Guan, C. Adoption of the Building Information Modeling (BIM) for construction project effectiveness: The review of BIM benefits. Am. J. Civ. Eng. Archit. 2016, 4, 74–79. [Google Scholar]
- Kaewunruen, S.; Lian, Q. Digital twin aided sustainability-based lifecycle management for railway turnout systems. J. Clean. Prod. 2019, 228, 1537–1551. [Google Scholar] [CrossRef]
- Chen, S.S.; Shirolé, A.M. Integration of information and automation technologies in bridge engineering and management: Extending the state of the art. Transp. Res. Rec. 2006, 1976, 2–12. [Google Scholar] [CrossRef]
- Marzouk, M.; Hisham, M. Implementing earned value management using bridge information modeling. KSCE J. Civ. Eng. 2014, 18, 1302–1313. [Google Scholar] [CrossRef]
- Zou, Y.; Kiviniemi, A.; Jones, S.W. Developing a tailored RBS linking to BIM for risk management of bridge projects. Eng. Constr. Archit. Manag. 2016, 23, 727–750. [Google Scholar] [CrossRef]
- Arvanitoyannis, I.S. ISO 14040: Life cycle assessment (LCA)–principles and guidelines. Waste Manag. Food Ind. 2008, 97–132. [Google Scholar] [CrossRef]
- Hammervold, J.; Reenaas, M.; Brattebø, H. Environmental life cycle assessment of bridges. J. Bridge Eng. 2011, 18, 153–161. [Google Scholar] [CrossRef]
- Blengini, G.A.; Di Carlo, T. The changing role of life cycle phases, subsystems and materials in the LCA of low energy buildings. Energy Build. 2010, 42, 869–880. [Google Scholar] [CrossRef]
- Wang, E.; Shen, Z.; Barryman, C. A building LCA case study using Autodesk Ecotect and BIM model. In Construction Management; University of Nebraska—Lincoln: Lincoln, NE, USA, 2011; p. 6. [Google Scholar]
- Antόna, L.Á.; Díazak, J. Integration of life cycle assessment in a BIM environment. Procedia Eng. 2014, 85, 26–32. [Google Scholar] [CrossRef]
- Kaewunruen, S.; Xu, N. Digital Twin for Sustainability Evaluation of Railway Station Buildings. Front. Built Environ. 2018, 4, 77. [Google Scholar] [CrossRef]
- Department for Business Energy & Industrial Strategy. 2019 Government Greenhouse Gas Conversion Factors for Company Reporting; British Government: London, UK, 2019.
- Hammond, G.P.; Jones, C.I. Embodied energy and carbon in construction materials. Proc. Inst. Civ. Eng. Energy 2008, 161, 87–98. [Google Scholar] [CrossRef]
- LI, J.; LIU, Y. The carbon emission accounting model based on building lifecycle. JEM 2015, 4. [Google Scholar] [CrossRef]
- Alderton, M. How Level of Development Brings a New Standard of Excellence to AEC. 2017. Available online: https://www.autodesk.com/redshift/level-of-development/ (accessed on 1 August 2019).
- Hijazi, W.; Alkass, S.; Zayed, T. Constructability assessment using BIM/4D CAD simulation model. AACE Int. Trans. 2009, 4, 1–14. [Google Scholar]
- Zhang, C.; Zayed, T.; Hijazi, W.; Alkass, S. Quantitative assessment of building constructability using BIM and 4D simulation. Open J. Civ. Eng. 2016, 6, 442. [Google Scholar] [CrossRef]
- Setsobhonkul, S.; Kaewunruen, S.; Sussman, J.M. Lifecycle Assessments of Railway Bridge Transitions Exposed to Extreme Climate Events. Front. Built Environ. 2017, 3. [Google Scholar] [CrossRef]
- Kaewunruen, S.; Remennikov, A.M.; Murray, M.H. Introducing a new limit states design concept to railway concrete sleepers: An Australian experience. Front. Mater. 2014, 1. [Google Scholar] [CrossRef]
- Kaewunruen, S.; Sussman, J.M.; Einstein, H.H. Strategic framework to achieve carbon-efficient construction and maintenance of railway infrastructure systems. Front. Environ. Sci. 2015, 3. [Google Scholar] [CrossRef]
- Kaewunruen, S.; Remennikov, A.M. Current state of practice in railway track vibration isolation: An Australian overview. Aust. J. Civ. Eng. 2016, 14, 63–71. [Google Scholar] [CrossRef]
- Kaewunruen, S.; Rungskunroch, P.; Welsh, J. A Digital-Twin Evaluation of Net Zero Energy Building for Existing Buildings. Sustainability 2019, 11, 159. [Google Scholar] [CrossRef]
- Kaewunruen, S.; Sresakoolchai, J.; Kerinnonta, L. Potential Reconstruction Design of an Existing Townhouse in Washington DC for Approaching Net Zero Energy Building Goal. Sustainability 2019, 11, 6631. [Google Scholar] [CrossRef]
- Fanning, B.; Clevenger, C.M.; Ozbek, M.E.; Mahmoud, H. Implementing BIM on infrastructure: Comparison of two bridge construction projects. Pract. Period. Struct. Des. Constr. 2015, 20, 04014044. [Google Scholar] [CrossRef]
- Liu, W.; Guo, H.; Li, H.; Li, Y. Retracted: Using BIM to Improve the Design and Construction of Bridge Projects: A Case Study of a Long-Span Steel-Box Arch Bridge Project; SAGE Publications Sage UK: London, UK, 2014. [Google Scholar]
- Kaewunruen, S.; Sresakoolchai, J.; Peng, J. Life Cycle Cost, Energy and Carbon Assessments of Beijing-Shanghai High-Speed Railway. Sustainability 2020, 12, 206. [Google Scholar] [CrossRef]
- Kaewunruen, S.; Sussman, J.M.; Matsumoto, A. Grand Challenges in Transportation and Transit Systems. Front. Built Environ. 2016, 2. [Google Scholar] [CrossRef]
© 2020 by the authors. Licensee MDPI, Basel, Switzerland. This article is an open access article distributed under the terms and conditions of the Creative Commons Attribution (CC BY) license (http://creativecommons.org/licenses/by/4.0/).


