Abstract
Osteoporosis is considered a major public health problem worldwide. In order to develop effective physical exercise protocols for the prevention of osteoporosis and ensure skeletal integrity, the intensity of the exercise must be quantified objectively and accurately. This study aimed to assess the validity of a wearable accelerometer-based activity monitor for use in osteoporosis prevention programs. Eighteen premenopausal women completed an exercise protocol consisting of five countermovement jumps followed by four treadmill bouts at different speeds. Participants carried two pairs of accelerometers (Muvone® and ActiGraph GT3X+) located on the wrist and hip. Three types of analysis were performed: (1) association between measurements from both devices; (2) level of similarity in group estimates; and (3) evaluation of measurement bias. High to almost perfect correlations between the peak acceleration measured by both devices were found in all protocol tests (r = 0.607–0.975, p < 0.001). Differences in group estimates were non-significant and measurement bias between devices was below 6%. In conclusion, the validity of Muvone® to quantify acceleration has been tested at both the wrist and hip and could be used to assess mechanical loading during physical activities for the implementation of population-wide osteoporosis prevention programs.
1. Introduction
Osteoporosis is a skeletal disease characterized by reduced bone mass and disruption of bone architecture, leading to increased bone fragility and fracture risk [1]. This condition is highly prevalent worldwide. It is estimated that osteoporosis affects 27.5 million adults in the European Union [2] and 10.2 million people in the United States [3]. Further, it is expected that one in three women and one in five men over the age of 50 years will suffer a fracture due to osteoporosis [4]. These figures exhibit an important economic burden. In Europe, the costs associated with osteoporotic fractures hospitalization and aftercare are estimated at €37 billion annually [2]. In Spain the number of individuals with osteoporosis is estimated at 2.5 million, generating a cost for the health care system of €3.5 billion per year [5]. Moreover, these costs are expected to increase twofold by 2050 based on the expected demographic changes [6]. This large burden on health systems demonstrates that osteoporosis is a major public health concern worldwide. It is therefore clearly of interest that effective osteoporosis prevention programs are developed.
Among the strategies that may help in preventing osteoporosis, regular exercise is recommended for a variety of health and fitness reasons. Evidence shows that different types of activities (e.g., aerobic exercise and strength training) have an effect on the bone mineral density (maintenance and stimulation) in both pre- and post-menopausal women [7]. Bones are living tissues and have the capacity to adapt to physical activity by increasing their size, shape or density in order to better resist biomechanical demands [8]. Specifically, exercise increases bone mineral density (BMD), bone mass and bone strength by stimulating osteogenic pathways and the activities of osteoblasts and osteocytes, as well as by inhibiting osteoclastogenesis and bone resorption [9]. For bone mass to increase, bone tissue must be stimulated with loads exceeding a certain threshold, as the osteogenic response depends on the magnitude of mechanical forces applied [10]. In this regard, previous research [11] has highlighted the importance of reaching accelerations above 3.9 g during physical activity to elicit positive bone adaptations. Therefore, it is suggested that in order to develop effective protocols for osteoporosis prevention and to ensure skeletal integrity, exercise intensity must be objectively quantified and monitored (i.e., bone-loading forces).
To that end, new technologies such as accelerometry are increasingly being used to monitor exercise and assess mechanical loading in physical activities [10]. An accelerometer is an electromechanical device that converts mechanical motion into an electrical signal [12]. Therefore, these devices can provide objective measurements of movement (i.e., physical activity) and could assist in implementing effective osteoporosis prevention programs. Advances in commercially available accelerometry-based activity monitors represent an opportunity for a wider population to assess the intensity of different types of activities. Nevertheless, the cost of reliable accelerometers is still high and interpretation of the resulting data by the user remains a challenge [13]. Moreover, there is a paucity of data regarding the validity of wearable accelerometer-based activity monitors aimed at preventing osteoporosis [10]. Consequently, the aim of this study was to determine the validity of a wearable accelerometer-based activity monitor in order to assess its suitability for the implementation of population-wide osteoporosis prevention programs.
2. Materials and Methods
2.1. Participants
Eighteen healthy premenopausal women (mean (SD) age 44 (5) years; mass 63 (9) kg; stature 165 (7) cm) from Seville (Spain) and surrounding areas volunteered to participate in this study. Participants were provided with detailed information about the study and confirmed their ability to participate in the exercise protocol. This study was approved by the Andalusian Biomedical Research Ethics Committee and all participants provided written informed consent.
2.2. Procedures
This study aimed at assessing the validity of a wearable accelerometer-based activity monitor (Muvone®, Secmotic, Seville, Spain) that integrates the BMX055 chip (Bosch Sensortec, Germany), which is a triaxial 12-bit acceleration sensor designed for modern mobile consumer electronic devices. The Muvone® was compared with an ActiGraph GT3X+ (ActiGraph LLC, Pensacola, FL) during different exercise protocols described below. ActiGraph activity monitors were used as reference monitors, as they are widely used in physical activity research [14] and their reliability to measure acceleration accurately has been previously reported [15].
The GT3X+ and the Muvone® are portable lightweight devices (GT3X+: 27 g, 3.8 cm × 3.7 cm × 1.8 cm; Muvone®: 9 g, 3.2 cm × 3.2 cm × 1.1 cm). Participants wore a securely adjusted belt containing a GT3X+ and a Muvone® positioned over the non-dominant hip (iliac crest). A securely adjusted wristband containing a GT3X+ and a Muvone® was attached at the non-dominant wrist (upper wrist crease). Thus, two pairs of GT3X+ and Muvone® units were used and taped together to ensure axis alignment. Figure 1 depicts the placement of the accelerometers. At the end of each exercise bout, researchers ensured that both belt and wristband continued to be adequately fitted.
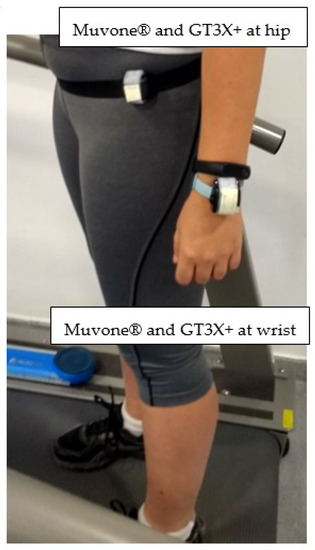
Figure 1.
Muvone® and GT3X+ accelerometers adjacent and taped together, positioned over the non-dominant hip and wrist.
Prior to engaging in the exercise protocol, participants were instructed on how to safely use the treadmill and were familiarized with the study tests. Upon placement of the accelerometers, participants completed a standardized exercise protocol during a laboratory-based activity session. The exercise protocol was comprised of five countermovement jumps (CMJ) with a 30 s rest between each jump. Jump height was measured with a light barrier system (OptoGait, Microgate, Bolzano, Italy). Participants then performed four treadmill activities (HP-Cosmos®, Traunstein, Germany), walking/running at 4.8, 6.4, 9.7 and 12 km·h−1, replicating the protocol previously described by Sasaki, John and Freedson [14]. The duration of each treadmill bout was 2 min with a 1 min rest between each condition. Participants stood still during rest intervals and completed every exercise protocol in a randomized order. To assess the spatiotemporal gait parameters during the protocol, a floor-based photocell system (OptoGait, Microgate, Bolzano, Italy) was used.
2.3. Data Analysis
In order to test the validity of Muvone® in comparison to the GT3X+, both devices were initialized to collect raw acceleration in three individual orthogonal planes (vertical (VT), antero-posterior (AP) and medio-lateral (ML)), at a sample rate of 40 Hz. The resultant analog signals were digitized by a 12-bit analog-to-digital converter. The validity of Muvone® has been tested using raw acceleration data as it may capture the sporadic nature of daily life physical activity more accurately than epoch data [15]. The GT3X+ monitors were updated with firmware version 3.2.1. Participants having data from both activity monitors at each location (hip and wrist) were included in the inter-monitor statistical analyses. From the raw acceleration data recorded by each device (in g units), the tri-axial vector magnitude (VM) was computed as VM = sqrt(VT2 + AP2 + ML2) [14]. Then, the peak acceleration value registered at each second in the VM was extracted to build the peak acceleration vector [16].
Three types of analyses were performed to test the validity of the Muvone®, following the recommendations provided by Welk et al. [17]. Analysis 1: Association between peak acceleration measurements from both devices, evidenced by Pearson correlation coefficients (r) with the following qualitative interpretation: negligible (< 0.1), small (0.1–0.29), moderate (0.3–0.49), high (0.5–0.69), very high (0.7–0.89) or almost perfect (≥ 0.9) [18]. Analysis 2: Level of similarity in group estimates, evidenced by non-significant differences in the peak acceleration means assessed by a dependent t-test. Analysis 3: Absence of measurement bias (level of agreement between devices) evidenced by Bland–Altman plots, including the 95% confidence interval for upper and lower limits.
The level of alpha for all analyses was set at p < 0.05 with analyses performed for each exercise test (CMJ and treadmill bouts) and for each measured location (hip and wrist). Statistical analysis was performed using the Jamovi software (version 1.0.7.0 The Jamovi Project 2019, retrieved from https://www.jamovi.org).
3. Results
The demographic and clinical characteristics of the eighteen female participants are presented in Table 1.

Table 1.
Participants’ descriptive statistics.
3.1. Analysis 1: Association between Measurements from Both Devices
Firstly, to ascertain if the output from Muvone® was associated with that of the GT3X+, Pearson correlation coefficients were calculated. Peak accelerations measured by Muvone® and GT3X+ were positively and significantly correlated for all exercise tests (CMJ and treadmill bouts at all velocities). For the CMJ a very high correlation at the wrist (r = 0.894, p < 0.001) and an almost perfect correlation at the hip (r = 0.935, p < 0.001) were found (Table 2). For the treadmill bouts, high to almost perfect correlations at the hip (r = 0.607–0.902, p < 0.001) and almost perfect correlations at the wrist (r > 0.9, p < 0.001) were obtained (Table 2).
Table 2.
Correlation analyses between the Muvone® and GT3X+.
Pearson correlation coefficients were also calculated selecting only measurements above 3.9 g. This acceleration value has been previously described as a threshold for osteogenic physical activity [11]. For the CMJ a very high correlation at the wrist (r = 0.777, p < 0.001) and an almost perfect correlation at the hip (r = 0.905, p < 0.001) were found (Table 2). For the treadmill bouts, moderate correlations were obtained at the hip (r = 0.330–0.446, p < 0.001) and very high correlations at the wrist (r > 0.7, p < 0.001) (Table 2).
3.2. Analysis 2: Level of Similarity in Group Estimates
The descriptive statistics of peak acceleration measured at each exercise test, device and accelerometer location are presented in Table 3.
Table 3.
The mean, median, standard deviation and standard error for peak accelerations.
To assess if the outputs from the devices yielded similar group estimates, the differences between peak acceleration means measured by Muvone® and GT3X+ for each participant were assessed using dependent t-tests. Non-significant differences were found for all tests and accelerometer locations (Table 4).
Table 4.
T-tests results.
The comparison between peak acceleration means measured by GT3X+ and Muvone® at hip and wrist during the CMJ test can be observed in Figure 2. Non-significant differences were found between the two activity monitors as evidenced by dependent t-tests.
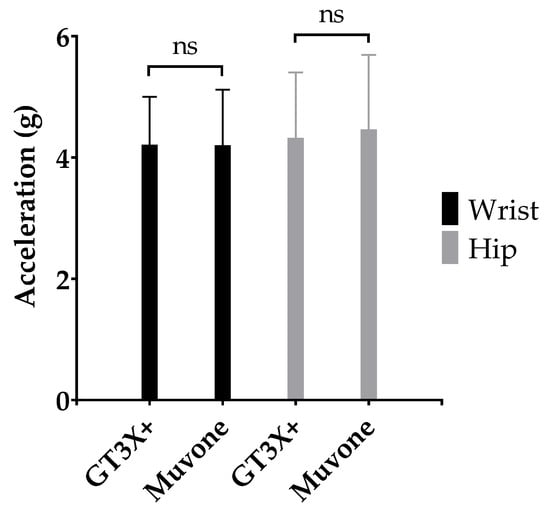
Figure 2.
Mean (SD) peak acceleration measured by GT3X+ and Muvone® at the hip and wrist during CMJ tests.
The comparison between peak acceleration means measured by GT3X+ and Muvone® at the hip and wrist during treadmill bouts (4.8, 6.4, 9.7 and 12 km·h−1) can be observed in Figure 3. Non-significant differences were found between the two activity monitors as evidenced by dependent t-tests.
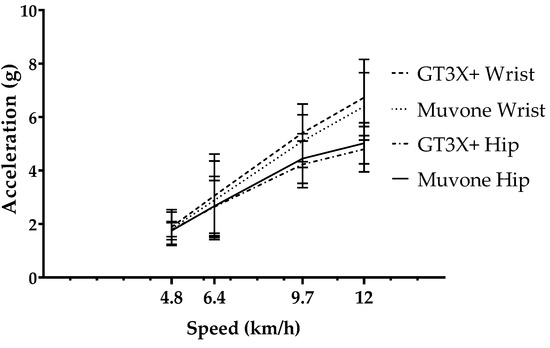
Figure 3.
Mean (SD) peak acceleration measured by GT3X+ and Muvone® at the hip and wrist during treadmill bouts (4.8, 6.4, 9.7 and 12 km·h−1).
3.3. Analysis 3: Level of Agreement between Devices
Finally, the level of agreement between devices was assessed using Bland–Altman analysis. The mean bias for every test and location, as well as the upper and lower limits of agreement (95% limits) can be found in Table 5.
Table 5.
Bland–Altman analysis.
In all tests and locations the absolute mean bias was below 0.35 g and relative mean bias was below 6%. Therefore, Bland–Altman plots showed high agreement between the peak accelerations measured by GT3X+ and Muvone® at the hip and wrist for both CMJ and treadmill bouts (4.8, 6.4, 9.7 and 12 km·h−1) (Figure 4).
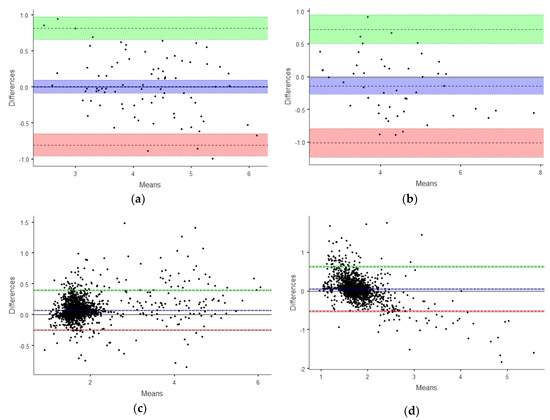
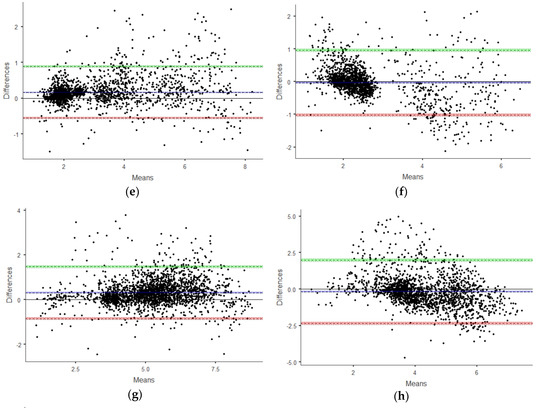
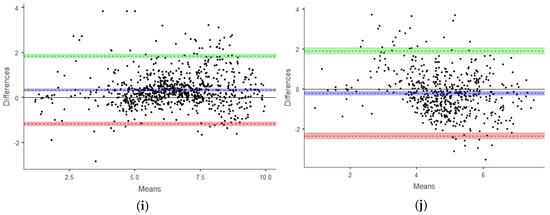
Figure 4.
Bland–Altman plots. High agreement between the devices was shown for every test and location: (a) Test: CMJ. Accelerometers location: Wrist. (b) Test: CMJ. Accelerometers location: Hip. (c) Test: Treadmill 4.8 km·h−1. Accelerometers location: Wrist. (d) Test: Treadmill 4.8 km·h−1. Accelerometers location: Hip. (e) Test: Treadmill 6.4 km·h−1. Accelerometers location: Wrist. (f) Test: Treadmill 6.4 km·h−1. Accelerometers location: Hip. (g) Test: Treadmill 9.7 km·h−1. Accelerometers location: Wrist. (h) Test: Treadmill 9.7 km·h−1. Accelerometers location: Hip. (i) Test: Treadmill 12 km·h−1. Accelerometers location: Wrist. (j) Test: Treadmill 12 km·h−1. Accelerometers location: Hip. The green band depicts the 95% confidence interval for the upper limit of agreement, the blue band depicts the 95% confidence interval for the mean bias, and the red band depicts the 95% confidence interval for the lower limit of agreement.
4. Discussion
The aim of this study was to determine the validity of Muvone®, a wearable accelerometer-based activity monitor, in order to assess its suitability for the implementation of population-wide osteoporosis prevention programs. Its validity has been tested against ActiGraph GT3X+, as ActiGraph activity monitors are widely used in physical activity research [14] and their reliability to measure acceleration accurately has been previously reported [15]. Measurements from both devices were positively and significantly correlated for all exercise tests (CMJ and treadmill bouts at all velocities), showing a very high to almost perfect correlation. Pearson correlation coefficients were also calculated selecting only measurements above 3.9 g, as this acceleration value has been previously described as a threshold for osteogenic physical activity [11]. Bone adaptations display a dose- and intensity-dependent relationship with mechanical loading, and these authors found positive BMD changes at the proximal femur with an exercise dose of at least of 60 impacts per day exceeding the acceleration level of 3.9 g. Therefore, accelerometer-based activity monitors should provide accurate measurements above this level in order to be considered for the implementation of osteoporosis prevention programs. In the current study, for measurements over 3.9 g moderate to very high correlations between Muvone® and GT3X+ were found for all tests (CMJ and treadmill bouts) and both accelerometer locations (hip and wrist) (Table 2).
To assess the level of similarity in group estimates from both devices, the differences between outputs were assessed using t-tests (p < 0.05), and non-significant differences were found for all tests and locations (Table 4).
Finally, absence of measurement bias (level of agreement between devices) was evidenced by Bland–Altman plots (Table 5). Relative mean bias was below 6%, which translates into an absolute bias below 0.35 g for all exercise tests and accelerometer locations, an error value reasonably acceptable in an osteoporosis prevention exercise program.
In people affected by osteoporosis, the threshold between an effective stimulus for positive bone adaptations and a harmful stimulus for bone integrity could be reduced. Therefore, in order to ensure the effectiveness and safety of an osteoporosis prevention exercise program, accurate monitoring of mechanical loading is necessary. Traditionally, the effect of physical activity on bone health is studied by employing force platforms to measure ground reaction force. These devices are mostly limited to laboratory environments [10]. Wearable accelerometer-based activity monitors provide the opportunity for a wider population to participate in osteoporosis prevention programs.
A limitation in this study was the array of physical activities tested. The exercise protocol included CMJ and treadmill bouts at different speeds. During normal daily life, many other activities take place that imply accelerations that would need further analysis. Besides, many activities involve arm movement that is dissociated from lower body movement (e.g., sweeping, carrying bags, etc.). Therefore, when assessing physical activity that may be beneficial for bone health, the relevant accelerometer location must be considered. Moreover, because this was a non-experimental study, causal associations cannot be made and thus we are not able to determine if an accurate quantification of the mechanical loading during physical activities can incur bone mineral density changes in premenopausal women. Finally, and although our sample was relatively homogeneous in age, it was small and thus our results might not be generalizable to other age groups. Despite these limitations, our data support the validity of both wrist-worn and hip-worn Muvone® accelerometers in premenopausal women.
5. Conclusions
In conclusion, the validity of Muvone® to quantify acceleration has been tested at both the wrist and hip, and also with measurements above 3.9 g, an acceleration value previously described as a threshold for osteogenic physical activity [11]. Therefore, Muvone® could be used to assess mechanical loading in physical activities for the implementation of population-wide osteoporosis prevention programs.
Author Contributions
Conceptualization, H.S.-T. and B.S.; methodology, G.A.; software, G.A.; validation, H.S.-T.; formal analysis, H.S.-T. and B.S.; investigation, H.S.-T.; B.S. and A.J.S.-O.; resources, H.S.-T. and G.A.; data curation, H.S.-T; writing—original draft preparation, H.S.-T, B.S. and A.J.S.-O.; writing—review and editing, H.S.-T., B.S., G.A. and A.J.S.-O.; supervision, H.S.-T., B.S.; project administration, B.S.; funding acquisition, B.S. All authors have read and agreed to the published version of the manuscript.
Funding
This research was funded by the 2nd INNOLABS Open Call Innovative Health Solutions (European Commission), grant number 691556.
Conflicts of Interest
The authors declare no conflict of interest.
References
- NIH Consensus Development Panel on Osteoporosis Prevention, Diagnosis, and Therapy. Osteoporosis Prevention, Diagnosis, and Therapy. JAMA 2001, 285, 785–795. [Google Scholar] [CrossRef] [PubMed]
- Hernlund, E.; Svedbom, A.; Ivergard, M.; Compston, J.; Cooper, C.; Stenmark, J.; McCloskey, E.V.; Jonsson, B.; Kanis, J.A. Osteoporosis in the European Union: Medical management, epidemiology and economic burden. A report prepared in collaboration with the International Osteoporosis Foundation (IOF) and the European Federation of Pharmaceutical Industry Associations (EFPIA). Arch. Osteoporos. 2013, 8, 136. [Google Scholar] [CrossRef] [PubMed]
- Wright, N.C.; Looker, A.C.; Saag, K.G.; Curtis, J.R.; Delzell, E.S.; Randall, S.; Dawson-Hughes, B. The recent prevalence of osteoporosis and low bone mass in the United States based on bone mineral density at the femoral neck or lumbar spine. J. Bone Miner. Res. Off. J. Am. Soc. Bone Miner. Res. 2014, 29, 2520–2526. [Google Scholar] [CrossRef] [PubMed]
- Sozen, T.; Ozisik, L.; Basaran, N.C. An overview and management of osteoporosis. Eur. J. Rheumatol. 2017, 4, 46–56. [Google Scholar] [CrossRef] [PubMed]
- Svedbom, A.; Hernlund, E.; Ivergard, M.; Compston, J.; Cooper, C.; Stenmark, J.; McCloskey, E.V.; Jonsson, B.; Kanis, J.A.; IOF, E.U.R.P.O. Osteoporosis in the European Union: A compendium of country-specific reports. Arch. Osteoporos. 2013, 8, 137. [Google Scholar] [CrossRef] [PubMed]
- Compston, J. Osteoporosis: Social and economic impact. Radiol. Clin. N Am. 2010, 48, 477–482. [Google Scholar] [CrossRef]
- Pedersen, B.K.; Saltin, B. Exercise as medicine-evidence for prescribing exercise as therapy in 26 different chronic diseases. Scand. J. Med. Sci. Sports 2015, 25 (Suppl. 3), 1–72. [Google Scholar] [CrossRef] [PubMed]
- Borer, K.T. Physical activity in the prevention and amelioration of osteoporosis in women: Interaction of mechanical, hormonal and dietary factors. Sports Med. 2005, 35, 779–830. [Google Scholar] [CrossRef] [PubMed]
- Yuan, Y.; Chen, X.; Zhang, L.; Wu, J.; Guo, J.; Zou, D.; Chen, B.; Sun, Z.; Shen, C.; Zou, J. The roles of exercise in bone remodeling and in prevention and treatment of osteoporosis. Prog. Biophys. Mol. Biol. 2016, 122, 122–130. [Google Scholar] [CrossRef] [PubMed]
- Sanudo, B.; de Hoyo, M.; Del Pozo-Cruz, J.; Carrasco, L.; Del Pozo-Cruz, B.; Tejero, S.; Firth, E. A systematic review of the exercise effect on bone health: The importance of assessing mechanical loading in perimenopausal and postmenopausal women. Menopause 2017, 24, 1208–1216. [Google Scholar] [CrossRef] [PubMed]
- Vainionpaa, A.; Korpelainen, R.; Vihriala, E.; Rinta-Paavola, A.; Leppaluoto, J.; Jamsa, T. Intensity of exercise is associated with bone density change in premenopausal women. Osteoporos. Int. 2006, 17, 455–463. [Google Scholar] [CrossRef] [PubMed]
- Suh, M. 12-Wearable sensors for athletes. In Electronic Textiles; Dias, T., Ed.; Woodhead Publishing: Oxford, UK, 2015; pp. 257–273. [Google Scholar]
- Sievänen, H.; Kujala, U.M. Accelerometry-Simple, but challenging. Scand. J. Med. Sci. Sports 2017, 27, 574–578. [Google Scholar] [CrossRef] [PubMed]
- Sasaki, J.E.; John, D.; Freedson, P.S. Validation and comparison of ActiGraph activity monitors. J. Sci. Med. Sport 2011, 14, 411–416. [Google Scholar] [CrossRef] [PubMed]
- Rowlands, A.V.; Stiles, V.H. Accelerometer counts and raw acceleration output in relation to mechanical loading. J. Biomech. 2012, 45, 448–454. [Google Scholar] [CrossRef] [PubMed]
- Stiles, V.H.; Griew, P.J.; Rowlands, A.V. Use of accelerometry to classify activity beneficial to bone in premenopausal women. Med. Sci. Sports Exerc. 2013, 45, 2353–2361. [Google Scholar] [CrossRef] [PubMed]
- Welk, G.J.; McClain, J.; Ainsworth, B.E. Protocols for evaluating equivalency of accelerometry-based activity monitors. Med. Sci. Sports Exerc. 2012, 44, S39–S49. [Google Scholar] [CrossRef] [PubMed]
- Hopkins, W.G.; Marshall, S.W.; Batterham, A.M.; Hanin, J. Progressive statistics for studies in sports medicine and exercise science. Med. Sci. Sports Exerc. 2009, 41, 3–13. [Google Scholar] [CrossRef] [PubMed]
© 2020 by the authors. Licensee MDPI, Basel, Switzerland. This article is an open access article distributed under the terms and conditions of the Creative Commons Attribution (CC BY) license (http://creativecommons.org/licenses/by/4.0/).