Article

Future Impact of Land Use/Land Cover Changes on Ecosystem Services in the Lower Meghna River Estuary, Bangladesh

1
Key Laboratory of Urban Environment and Health, Institute of Urban Environment, Chinese Academy of Sciences, Xiamen 361021, China
2
International School, University of Chinese Academy of Sciences, Beijing 100049, China
3
Xiamen Key Lab of Urban Metabolism, Institute of Urban Environment, Chinese Academy of Sciences, Xiamen 361021, China
4
Department of Agricultural Extension and Rural Development, Bangabandhu Sheikh Mujibur Rahman Agricultural University, Gazipur 1706, Bangladesh
*
Authors to whom correspondence should be addressed.
Sustainability 2020, 12(5), 2112; https://doi.org/10.3390/su12052112
Submission received: 4 February 2020 / Revised: 19 February 2020 / Accepted: 21 February 2020 / Published: 9 March 2020

Abstract

:
Assessing the effects of different land use scenarios on subsequent changes in ecosystem service has great implications for sustainable land management. Here, we designed four land use/land cover (LULC) scenarios, such as business-as-usual development (BAUD), economic development priority (EDP), ecological protection priority (EPP), and afforestation development priority (ADP), through a Cellular Automata-Markov (CA-Markov) model, and their effects on ecosystem service values (ESVs) were predicted, using historical LULC maps and ESV coefficients of the Lower Meghna River Estuary, Bangladesh. Findings revealed that agricultural and mangrove forest lands experienced the greatest decreases, while rural and urban settlement land had the greatest increases, leading to a total ESV decrease of US$105.34 million during 1988-2018. The scenario analysis indicated that ESV in 2038 would also decrease by US$41.37 million and US$16.38 million under the BAUD and EDP scenarios, respectively, while ESV will increase by US$60.61 million and US$130.95 million under the EPP and ADP scenarios, respectively. However, all the future land use scenarios will lead to 1.65%, 10.21%, 7.58%, and 6.75% gaps in total food requirements, respectively. Hence, from the perspective of maximizing ESVs and minimizing the trade-offs in food gaps, the ADP scenario could be the optimal land management policy for the studied landscape.

Graphical Abstract

1. Introduction

In the field of global environmental change and sustainable development, the issue of land use change has become a fundamental concern [1]. The rapid growth of the global population along with economic activities instigating urbanization and the expansion of subsequent settlement land in both rural and urban areas has directed rapid land use/land cover (LULC) transformations [2,3]. Throughout the urban expansion activities, unplanned LULC transformations have triggered many environmental consequences, specifically in the highly populous, small, developing countries [1]. For instance, the conversion of LULC to various settlements and agricultural purposes causes threats to several ecosystem services (ESs), for example, recreational opportunities [2], biodiversity and habitat quality [2], soil formation and nutrient cycling [4], climate regulation [2,5], erosion control [4,6], and water regulation [2,4]. The effect of these LULC alterations has resulted in the debasement of ESs, which are defined as the cumulative form of ecosystem goods and services, that benefit human life, from various ecosystem functions (e.g., provision, regulation, support, and culture) [7]. These impacts have stimulated the researches for evaluating the ecosystem service values (ESVs), in order to improve the level of awareness and decision making capacity for allocating the scarce natural resources among the various incompatible demands and formulate policies to encourage the restoration of ecosystems that provide the most precious services for the sustenance of human welfare [1,6].
A significant challenge in quantifying ESVs is that ecosystems provide many services in the form of public goods, and it is difficult to quantify their economic value as marketable goods [8]. To this end, Costanza et al. [9] roughly calculated global ESVs through developing value coefficients for various land biomes, a pioneering approach that has received widespread attention from global research scholars. Since then, attention towards the evaluation of ESs of different landscapes has increased rapidly among both researchers and policymakers, to support adaptation and mitigation strategies against degradation and global-change problems [10]. In particular, assessing the dynamics of LULC change and the associated change in ESVs has been broadly considered in several scholarly areas [1]. For instance, in southwestern Bangladesh [11], LULC change was primarily driven by the increase of shrimp aquaculture practices, at the cost of wetlands, which has significantly affected ESVs by causing land and environmental degradation. The study of Estoque and Murayama [3] quantified a substantial decrease in ESVs as a result of built-up land expansion, at the cost of agricultural and forest land in the Baguio city of the Philippines over a twenty-year time period. In another study, Sun et al. [2] also reported an alteration of ESVs in Atlanta, USA, due to the changes in LULC patterns, such as rapid urban development, and by increasing in the amounts of open water and barren land, at the cost of forests, wetlands, and agricultural land. In order to comprehend and assess the impacts of these LULC changes on the future land sustainability, the accessibility to reliable and sufficient information on the dynamics of LULC transformation over different time horizons is getting to be progressively fundamental [4,6].
Sustainable development requires determining future demands on land resources in order to ensure the adequacy of future supplies. To this end, the modeling approach has become a useful tool to predict in what way land use could transform in the future under different land management scenarios [1]. Meanwhile, a large number of working models are available to simulate possible LULC change [5]. Among these models, CA-Markov (Cellular Automata -Markov), FLUS, CLUE-S (Conversion of Land Use and its Effects at Small regional extent), and LUSD (Land Use Scenario Dynamics) are most widely used for the simulation of LULC change [5,6]. However, it is important to note that linking among the various modeling techniques and developing a multidisciplinary model can produce a better output while simulating the LULC change dynamics [1].
In this research, we focused on monitoring the existing land use management and forecasting future LULC changes under different land management scenarios, to assess the effects of future LULC transformation on ESVs—an evaluation for which a CA–Markov model is indeed applicable [1,5]. It has been extensively mentioned in the ongoing research discussions that the CA–Markov model, along with a GIS (geographic information system) tool, performs best for demonstrating the likelihood of spatiotemporal conversion in LULC [5]. This model is considered as a hybrid model that has interlinked two sub-models: (i) Markov chain, and (ii) Cellular Automata (CA). While Markov Chain predicts the amount of LULC transformation [12], the CA model produces the spatial distribution of the landscapes using the transition rule [13]. Therefore, the CA-Markov model is considered as a suitable tool for simulating the spatiotemporal variation of LULC change. In addition, it has an outstanding capability to quantify policy proposals as a constraint, and socio-environmental and climatic factors as a factor, producing suitability maps [5].
Bangladesh is a deltaic and agro-economy based developing country with a very high population density and one of the most vulnerable to disaster risks [14,15,16,17]. However, over the last decade, the economic growth of Bangladesh has skyrocketed. In fact, Bangladesh is now one of the fastest economic growth countries in the Asian region [18]. Hence, as a result of rapid economic activity along with high population pressure and environmental degradation, LULC in Bangladesh has changed very rapidly [15,16]. Empirical investigations [8,14,15,19,20,21,22,23] have shown that along with factors like rapid population growth and economic development, land degradation, and sea-level rise are some of the other driving forces in the coastal region of Bangladesh that have led to rapid LULC transformations over different periods, and that these have been arguably more widespread and intense than in any other areas of the globe, and that these conditions continue to worsen, leading to ongoing degradation and damages in the ecological value of these vulnerable environments [8,20,23].
Since the central coastal region is one of the most significant coastal zones of Bangladesh, the features of LULC change in this region are typical to that occurring from both anthropogenic and natural processes. Over the decades, rapid LULC alterations have threatened the land management sustainability and imbalances the socio-environmental systems of this region [19,20,23]. However, insufficient work has been done in detecting future LULC changes in this vulnerable zone [8,14,15,19,21,22,24,25] and evaluating their impacts on the ESs [23]. Therefore, it is imperative to examine the dynamics of LULC transformation for various future land management scenarios and their effects on ESs in order for ecological restoration of the landscape [23]. Taking into account of the aforementioned factors in consideration, this study was conducted to (i) predict future LULC distribution under different land management scenarios through the CA-Markov model; and (2) estimate the effects of LULC change dynamics on subsequent variations in the ESVs of the Lower Meghna River Estuary (LMRE) for a future date, 2038.
This study established an ecological engineering framework to predict future LULC changes under different land management scenarios by linking various constraints (policies) and factors (climatic and socio-environmental). The proposed methodology simplifies and permits scenario-based and investigative examinations, which may be worthwhile in formulating a comprehensive plan in order to restore the ecological sustainability of the studied landscape.

2. Materials and Methods
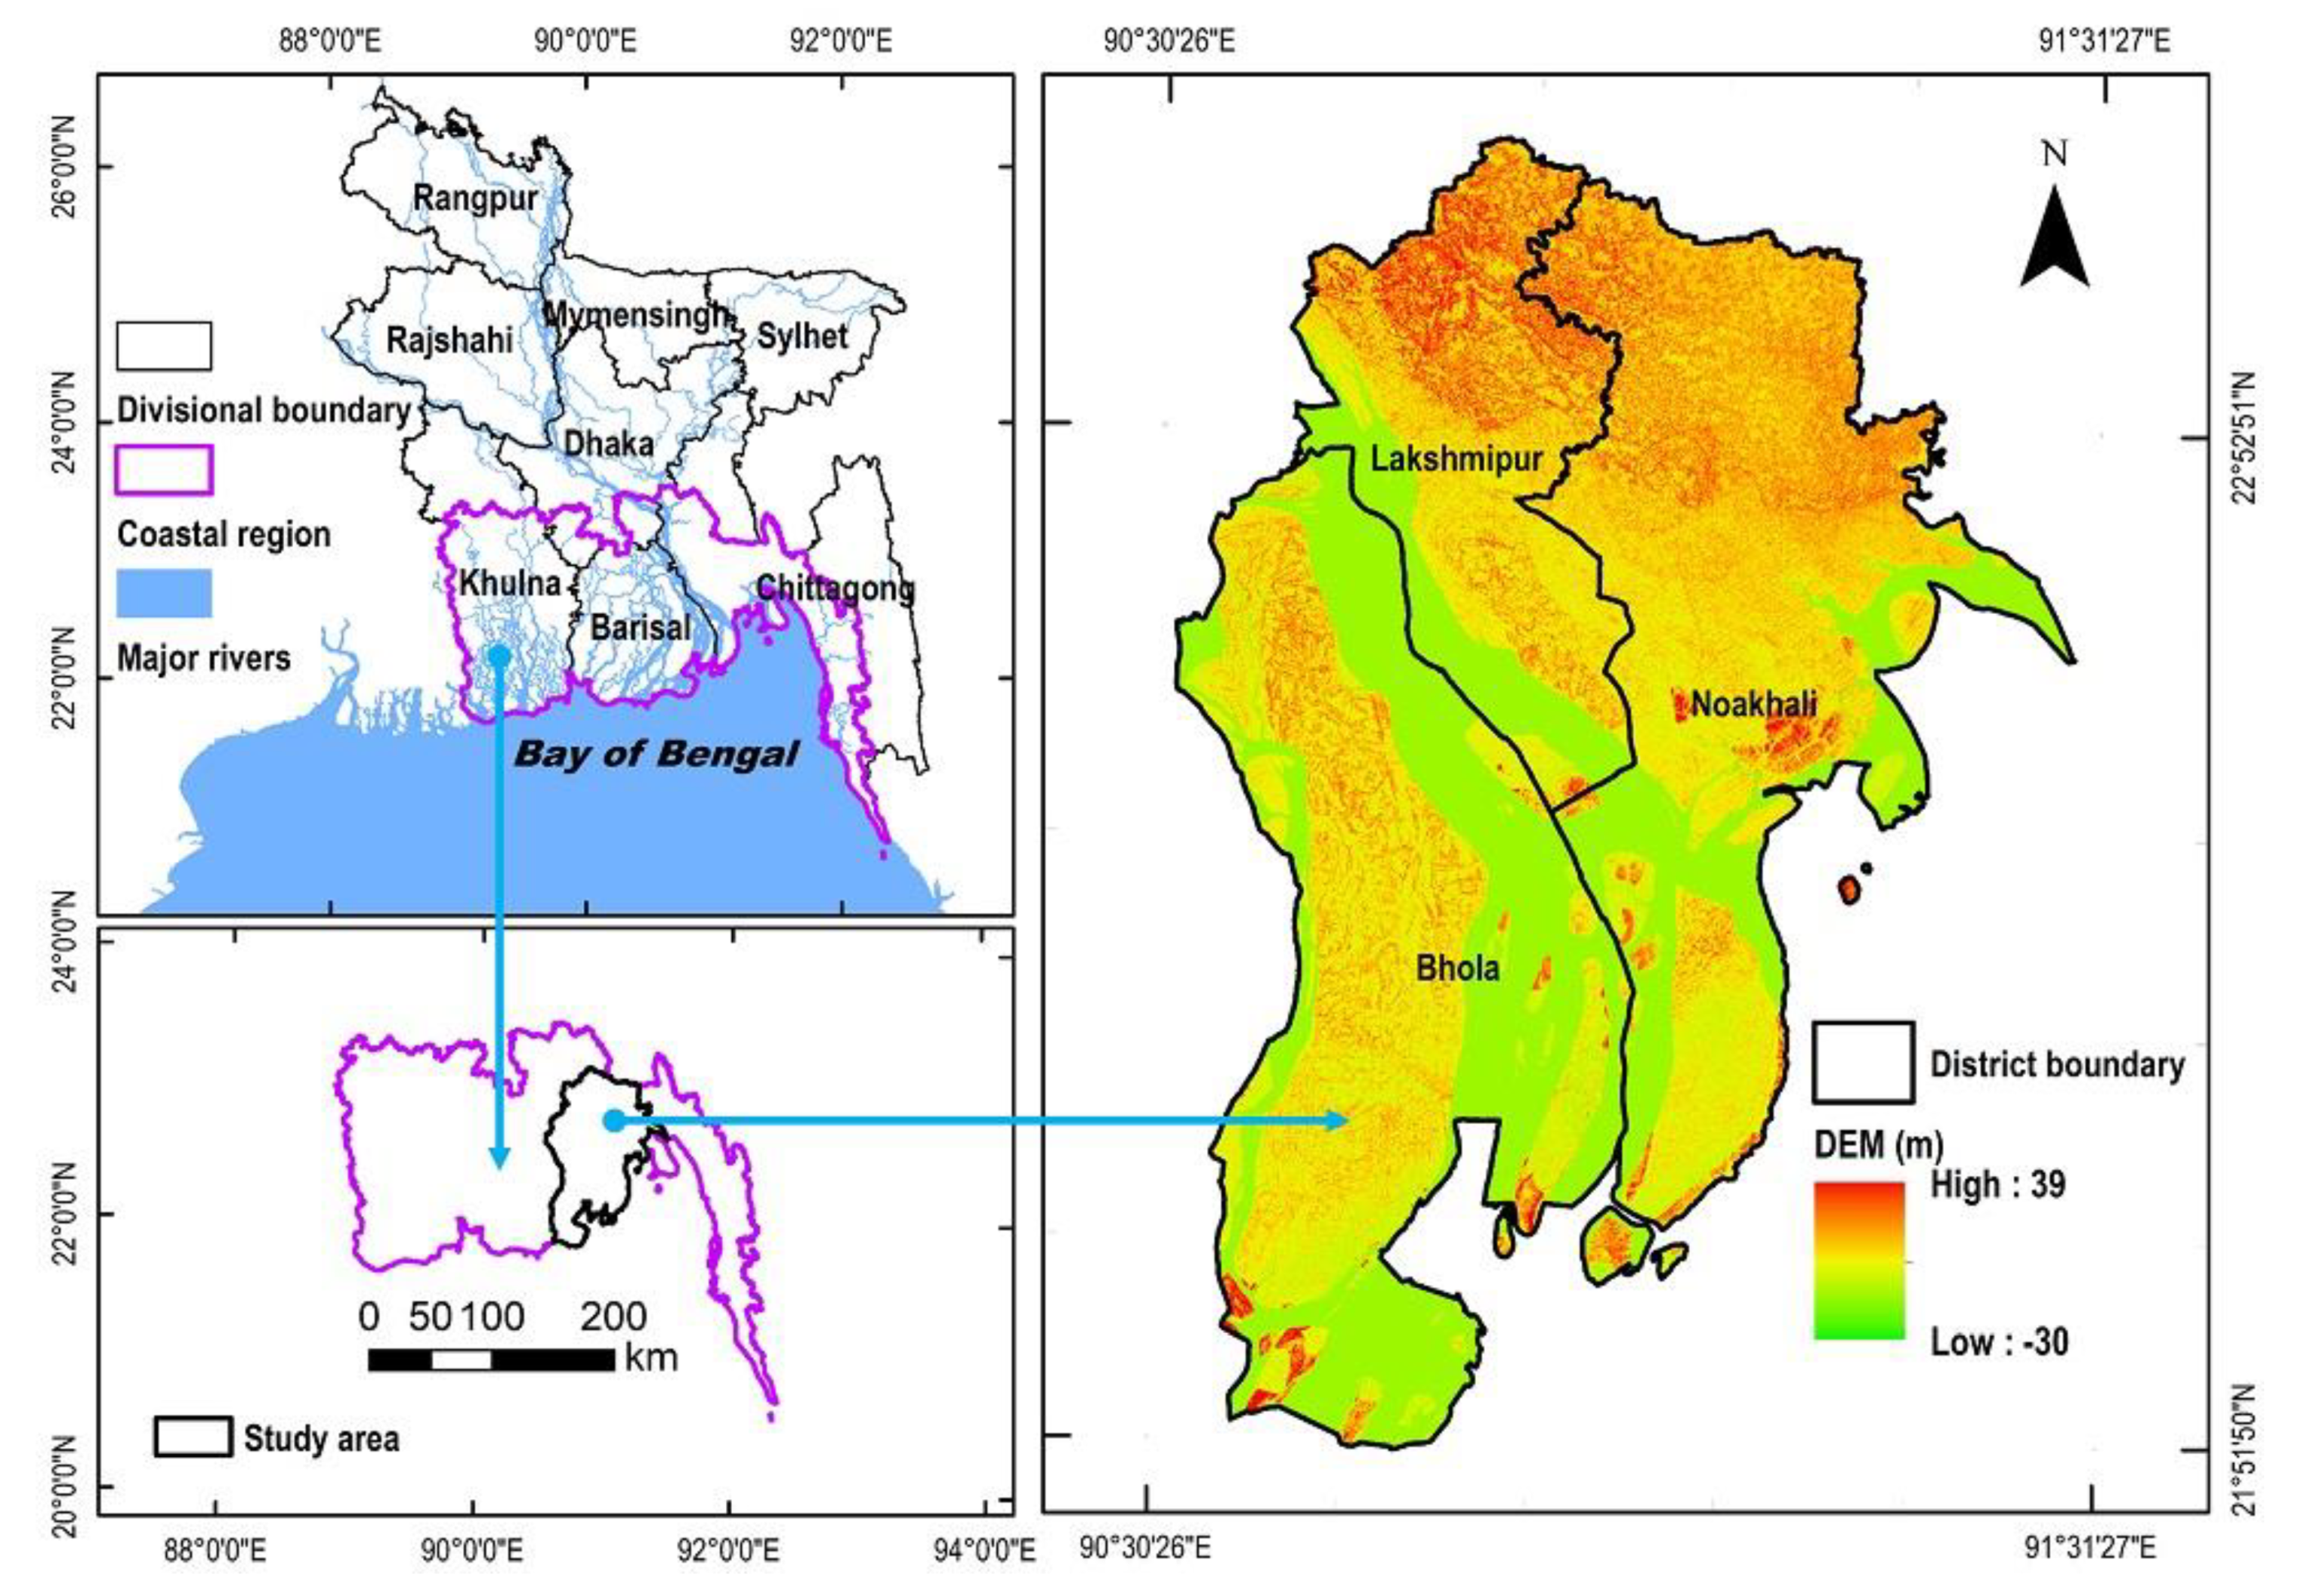
2.1. Study Area

The study area covers the Lower Meghna River Estuary (LMRE) situated in the central coastal zone of Bangladesh between 21°54′ N–23°10′ N latitudes and 90°01′ E–91°27′ E longitudes with a total area of approximately 7880 km2 (Figure 1). Administratively, the study area has three districts: Noakhali, Lakshmipur, and Bhola; 21 sub-districts, 14 municipalities, and 203 communities, with a total population of 7.42 million [26]. It shares a border with Comilla and Chandpur in the north, Barisal and Patuakhali in the west, the Bay of Bengal in the south, and Feni and Chittagong in the east. The Meghna River estuary is one of the widest (2.5–22.4 km) estuarine rivers in the world. The LMRE has 22,156 km2 of the coastal land surface where semidiurnal tide directly controls streams and estuarine flows [27]. The region has a yearly average temperature of 26.2 °C, and the yearly average precipitation is 2100-3500 mm [26]. The lower Meghna River carries a combined flow of water, typically at 120,000 m3/s, which causes a high level of hydro-dynamic activity and leads to a high rate of erosion and sediment deposition [27]. The average elevation of the study area is approximately 5 m above sea level (Figure 1).

2.2. Data Acquisition and Processing

Four Landsat TM and OLI-TIRS scenes (path/row: 136/44, 136/45, 137/44, 137/45) with a 30 × 30m spatial resolution covering the study area were collected from the database (https://glovis.usgs.gov/) of the United States Geological Survey (USGS). Consequently, a total of 16 scenes were used for the years 1988, 1998, 2008, and 2018. Only dry-season images with 0% cloud cover were obtained, to minimize atmospheric disturbance in the datasets. The collected Landsat images were pre-processed through ArcGIS 10.3 and semi-automatic classification plugin (SCP) in QGIS 2.18.15 for image restoration, atmospheric correction, image enhancement, stacking raster bands, mosaic raster datasets, and clipping multiband raster images [28].
The ancillary data, including shapefiles of the study area, administrative boundaries of Bangladesh, major river basins, DEMs (digital elevation models), and road shapefiles, were collected from the ESRI database. The slope map was created from the DEM. The land surface temperature of the study area was calculated from Landsat images from the year 2018. Annual mean temperature and precipitation data (1988–2016) for respective meteorological stations along with the soil data was collected from Bangladesh Agricultural Research Council (BARC), Farmgate, Dhaka. Population density data were collected from the Bangladesh Bureau of Statistics (BBS). After that, grid-level (30 m) value of precipitation, distances to roads, and population density were obtained from the spatial analysis tool of ArcGIS environments. The rate of erosion and accretion data were obtained from the land cover change detection function in the SCP of QGIS [28].

2.3. LULC Classification

The land cover classification in this study followed four steps: (i) identification of potential land cover types based on a critical literature review of previous studies and reports of governmental departments [8,11,15,17,19,29]; (ii) creating a training file by SCP; (iii) administration-maximum likelihood classification algorithm with the training file; and (iv) post-processing of the classified images to avoid misclassification of land cover types, with the support of personal knowledge and review of previous LULC analysis on the study area, historical records from Google Earth, and application of sieve and edit classification functions in SCP of QGIS [28]. In this study, all the initial (micro) land categories were further reclassified into six broad (macro) categories (Table 1). Accuracy of the LULC classification was measured by the post-processing function of SCP [28] and resulted in overall accuracies of 99%, 98%, 99%, and 98% for the images for 1988, 1998, 2008, and 2018, respectively (Table S1).

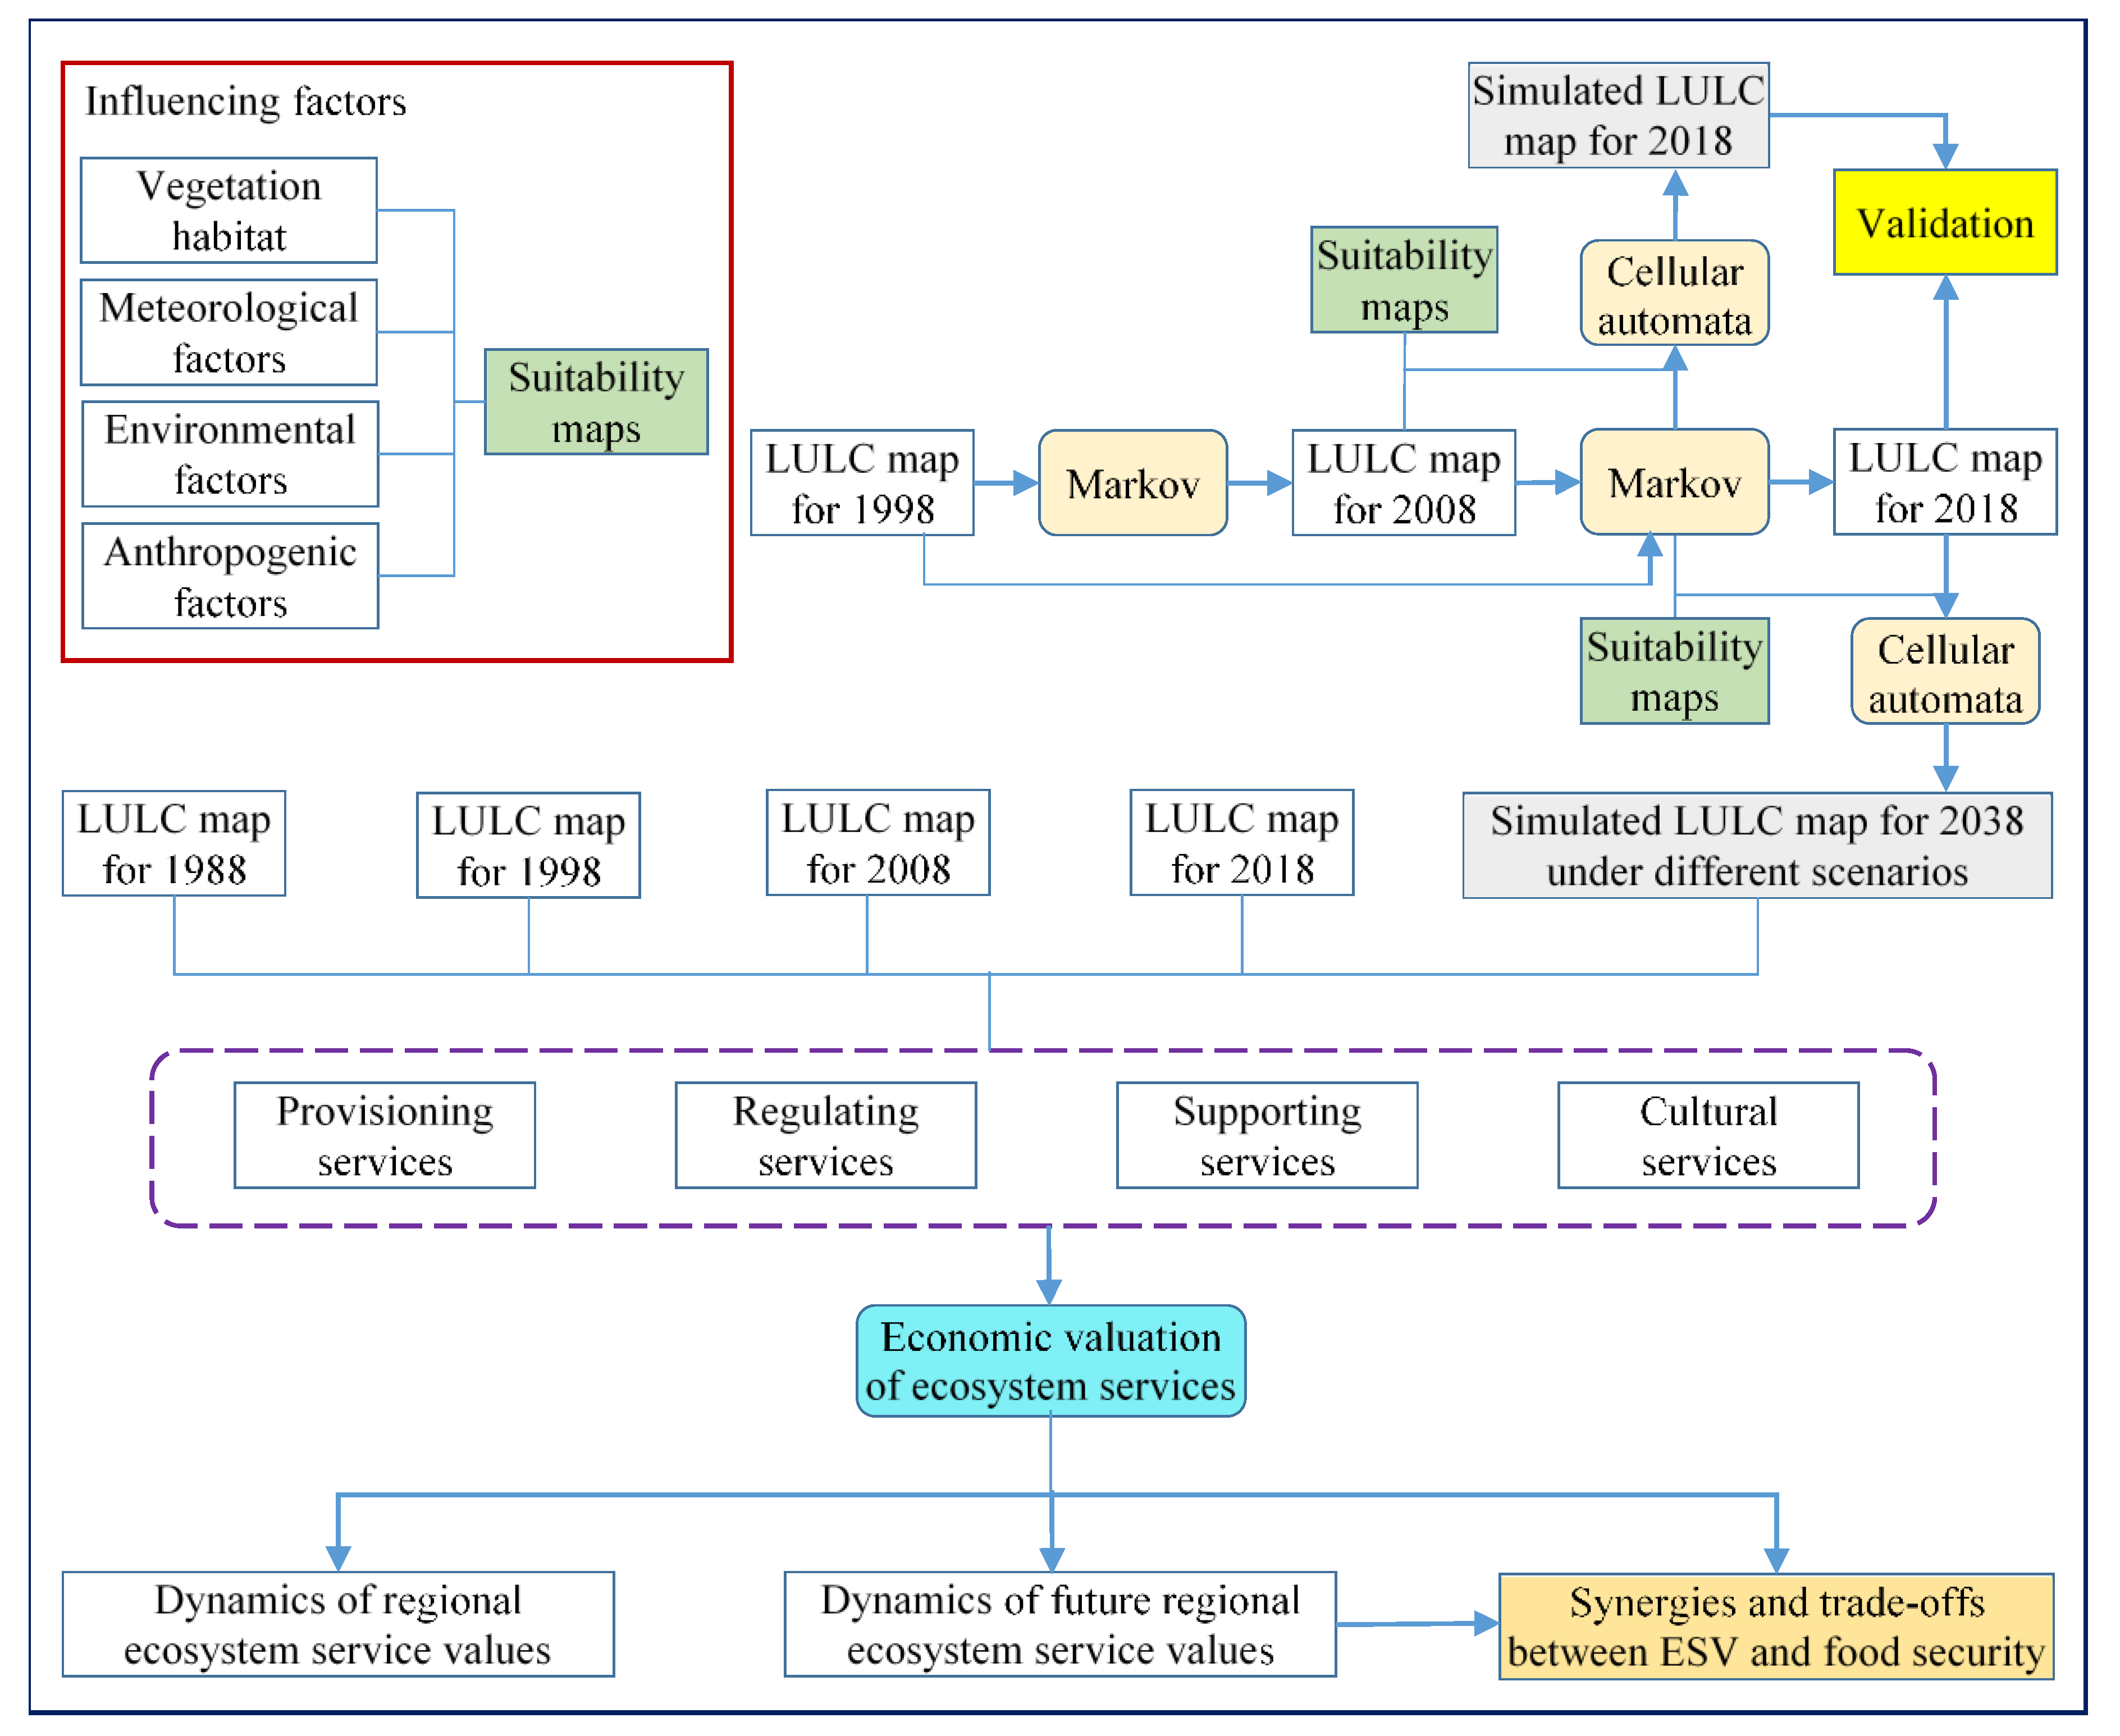
2.4. LULC Prediction

2.4.1. Development of Suitability Maps

By incorporating various driving factors of LULC change, suitability maps were created in IDRISI 17.2 software [5,30]. Habitat simulations were taken into account in creating the suitability maps. The entire process of suitability map creation involved four steps:
Step 1 (factor determination): The potential factors of LULC change were first determined via a critical review of the literature. In the LMRE, historical land development has been affected by a combination of socio-economic, environmental, and geographic factors. Thus, based on the data availability, temperature (land surface), precipitation (annual averages), elevation, slope, population density, soil type, and road network were eventually selected as the influencing factors for LULC changes of the lower Meghna River delta.
Step 2 (standardization of factors): Since the dimensions of various factors varied, we have standardized the relevant factors by the FUZZY module depending on the habitats of different LULC categories [5] (Table S2).
Step 3 (weight estimation): Weights of relevant influencing factors for each LULC type were estimated through the Analytical Hierarchy Process (AHP) [31], following a judgment matrix [20]. Moreover, an Excel-based software [32], was employed to estimate the consistency ratio (CR) for all the judgment matrix (in our case, 6 judgments) where CR of <0.10 was considered as positive evidence for an informed judgment (Table S2).
Step 4 (suitability map output): Using a Multi-Criteria Evaluation (MCE) module in decision support tools of IDRISI 17.2 software, the suitability maps for each of the LULC types was obtained by combining the relevant factors and their relative weights [5]. The values of different LULC suitability maps were further standardized to a range of 0–255 (Figure S1), where a higher value indicates greater suitability than a lower value [33].

2.4.2. LULC Map Simulation and Validation

CA-Markov model was used to predict future LULC patterns of LMRE for the year 2038. At first, LULC maps of the years 1998 and 2008 were used to simulate the LULC map of the year 2018 by linking the suitability maps. Then, the simulation accuracy was estimated with the kappa index [5] and was found to be 76% when matched with the actual LULC map of 2018 (Figure S2): above the required standard (at least 70%) [34,35]. Consequently, LULC maps in 2038 were simulated using the LULC maps of 1998, 2008, and 2018 depending on the various land development initiatives and suitability of the landscapes for different LULC types (Figure 2).
To assess the potential land use pattern of the LMRE in 2038, four land management scenarios were established, taking into account historical trends, economic growth, the government’s 100-year delta plan, and REDD+ activity [29]. The future LULC change rates and their comparable assumptions are described below:
Scenario 1: Business-as-usual development (BAUD) scenario. The LULC change follows the identical evolution trends of 1998 to 2018, and the suitability map was linked with the CA-Markov model.
Scenario 2: Economic development priority (EDP) scenario. The LULC change follows the fastest growth of various settlement lands (2008-2018); the extent of change in various other LULC types continue to fluctuate. The suitability map was linked with the CA-Markov model.
Scenario 3: Ecological protection priority (EPP) scenario. Taking into account the BAUD scenario, but restricted the artificial land conversion from mangrove forests and mudflats, the extent of change in various other LULC types continue to fluctuate. This scenario needs to intensify agricultural activity through the use of improved inputs, such as seeds, fertilizer, and proper irrigation, superior residue management, and increased cropping intensity through the adoption of new technology. Moreover, this scenario requires more compact and vertical settlements to accommodate the increased population.
Scenario 4: Afforestation development priority (ADP) scenario. On the basis of the EPP scenario, the protected and suitable mudflats are converted to mangrove plantations, and the extent of change in various other LULC types continue to fluctuate.

2.5. Assignment of Ecosystem Service Values

The benefit transfer method (BTM) is one of the most frequently used secondary valuation techniques that adjusts previously recognized estimates from a novel (primary) valuation scholarship in one geographical area to other locations having related socio-ecological attributes [36,37]. The study of Costanza et al. [9] is a pioneering work in the BTM that undertakes a per-hectare monetary valuation of different LULC types that possess 16 biomes and provide 17 different ESs. Globally, a considerable number of research scholarships have evaluated the impacts of LULC dynamics on ESs; many of them used the valuation coefficient proposed by the author [9] cited in [38]. In Bangladesh, few case studies are available on the valuation of ecosystem services based on benefits derived by stakeholders on different landscapes. Specifically, the author of [8] modified the value coefficient based on the “expert-driven matrix” and conducted a case study on freshwater ecosystem services in the southwestern coastal region. In addition, the authors of [39,40] conducted case studies on mangrove plantations in the south-central and southeastern coastal regions of Bangladesh. In this study, we have used a per-unit economic value coefficient (US$ ha−1 yr−1 in a 2014 exchange rate) calculated in earlier studies [8,39,40] for relevant proxy LULC types (Table 2).

2.6. Calculation of ESV

ESV of the LMRE was calculated using the following equations [1,3,10,35]:
E S V a =   A a   × V C a
where ESVa is the ESV of land use type ‘a’; Aa is the area of land use type ‘a’ as ha, and VCa is the value coefficient of land use type ‘a’ as US$ ha−1yr−1.
E S V b = a = 1 n A a   × V C a b
where ESVb is the ESV of ecosystem service function ‘b’; VCab is the value coefficient of land use type ‘a’ as US$ ha−1yr−1 with ecosystem service function type ‘b’.
E S V c = a = 1 n A a   × V C a
where ESVc is the total ESV in US$.

3. Results and Analysis

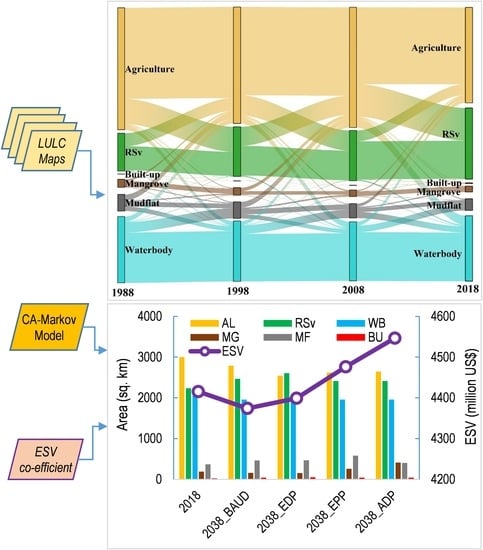
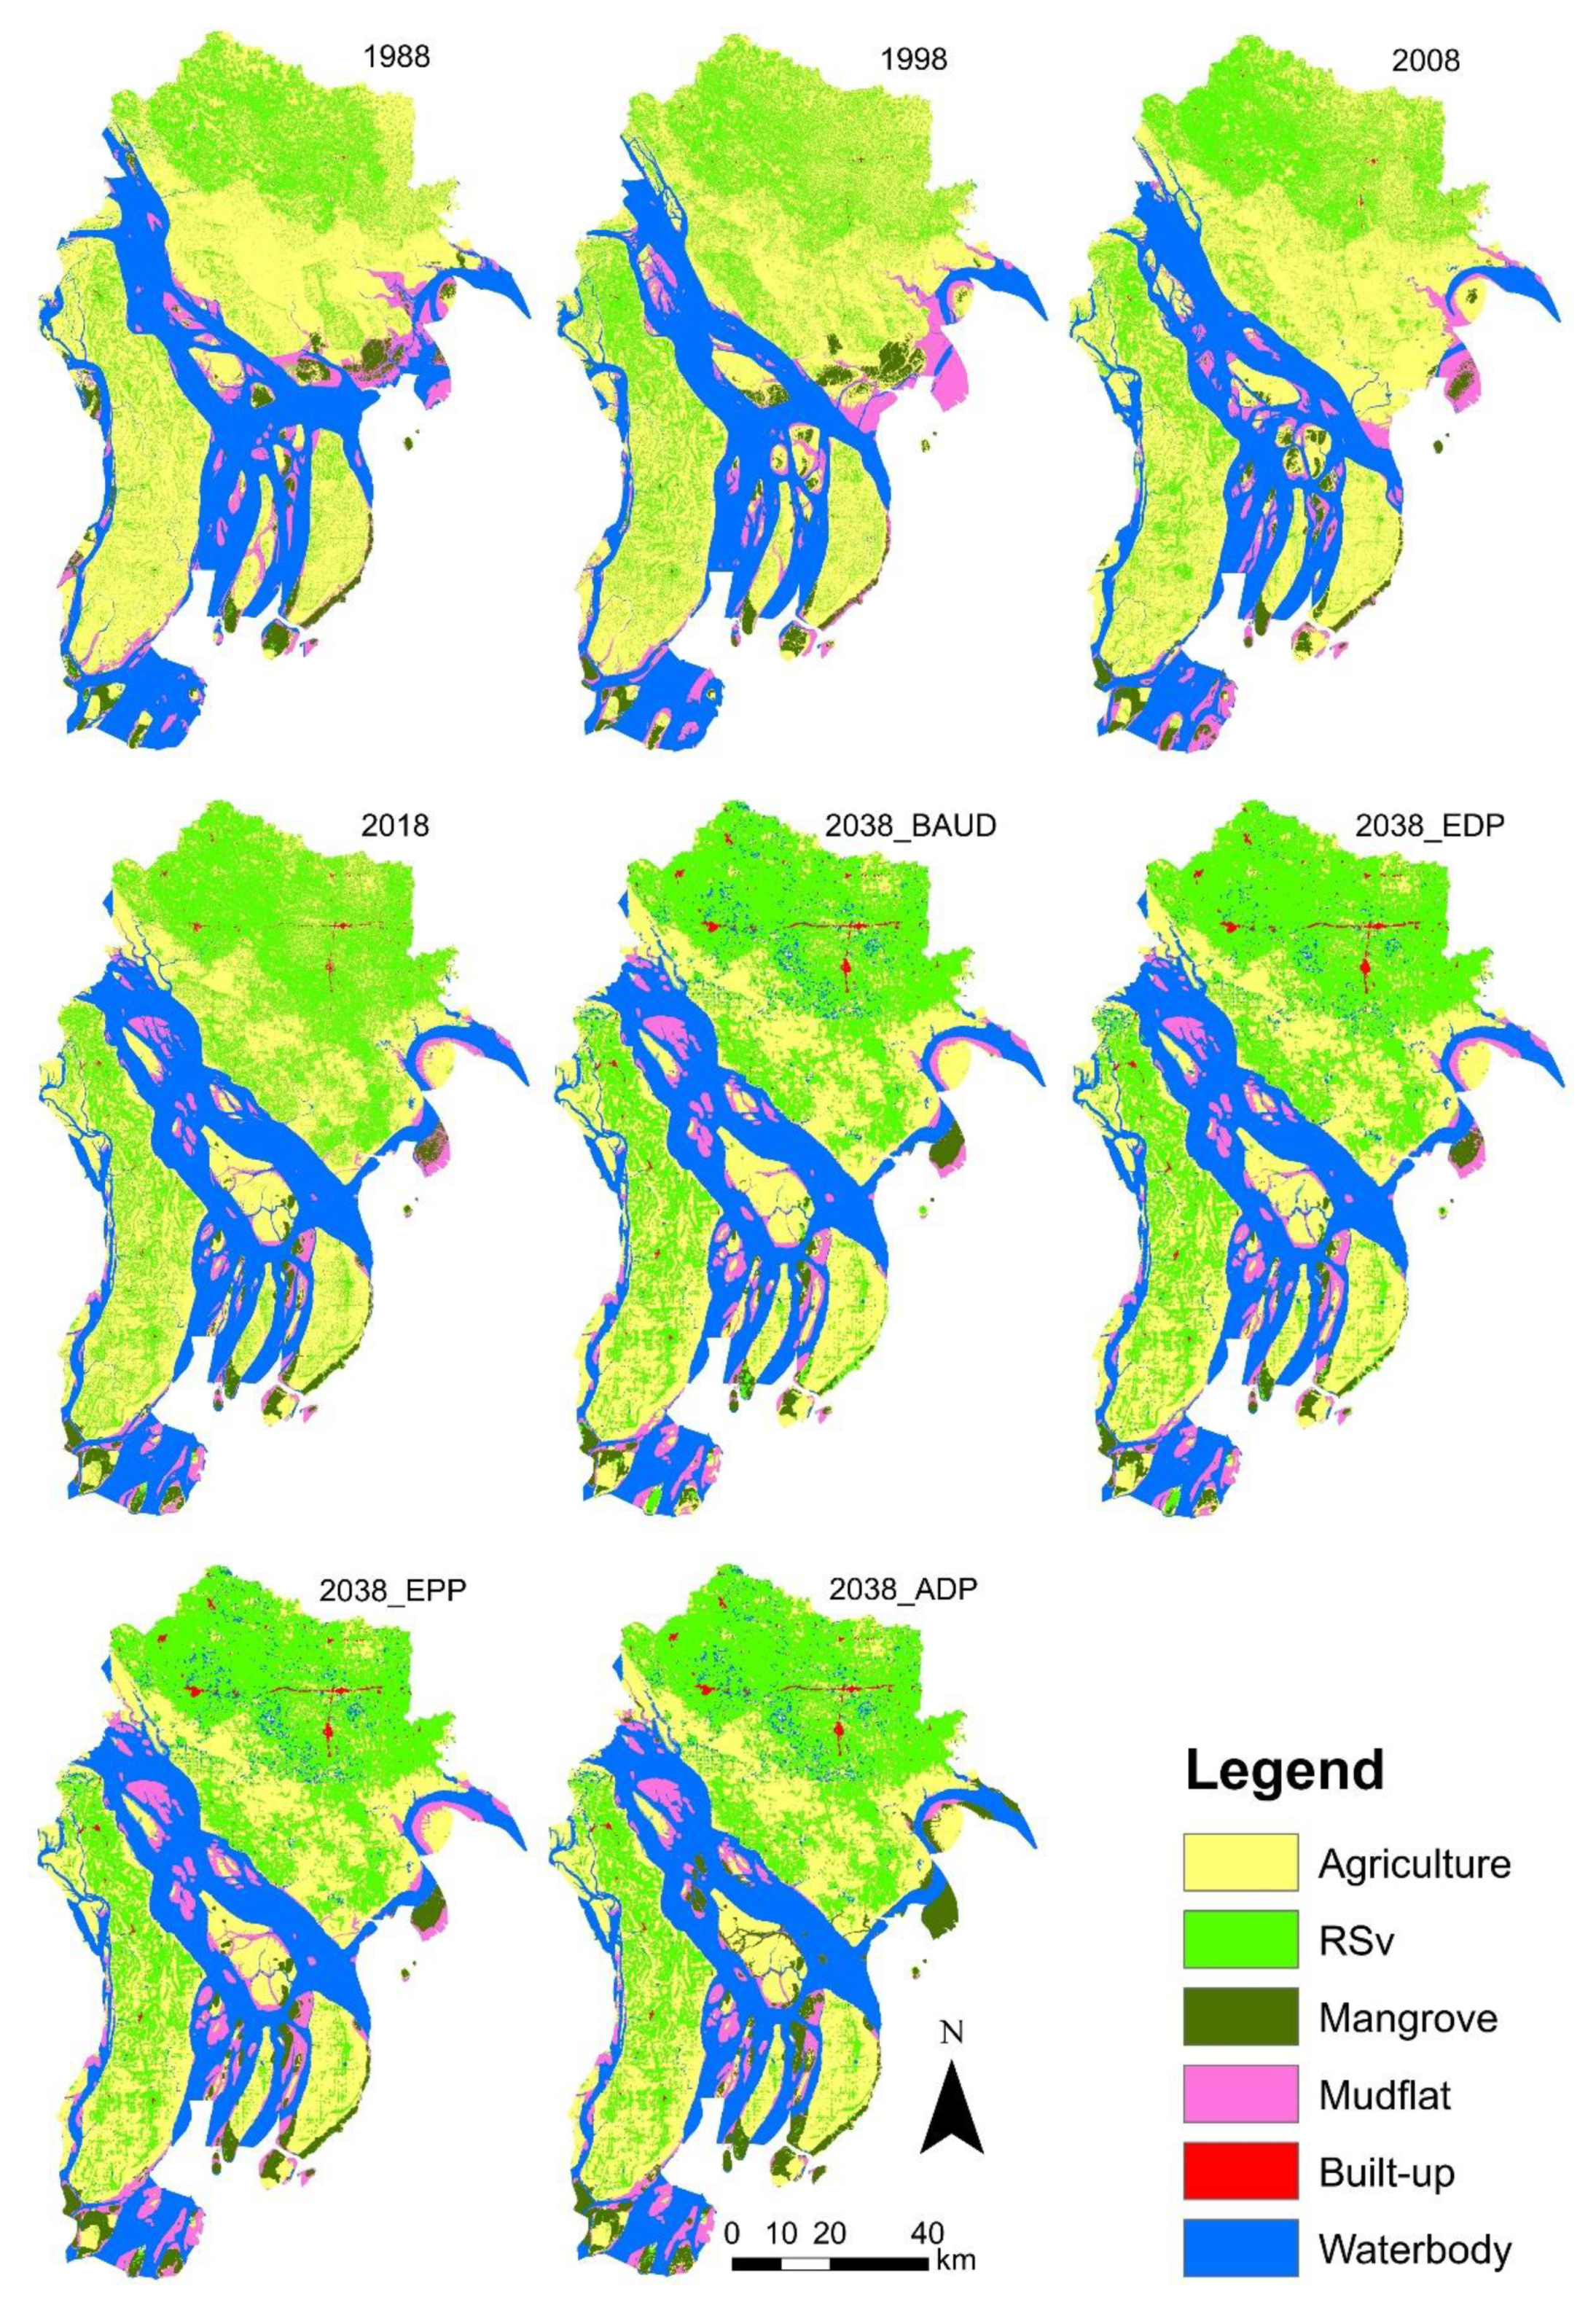
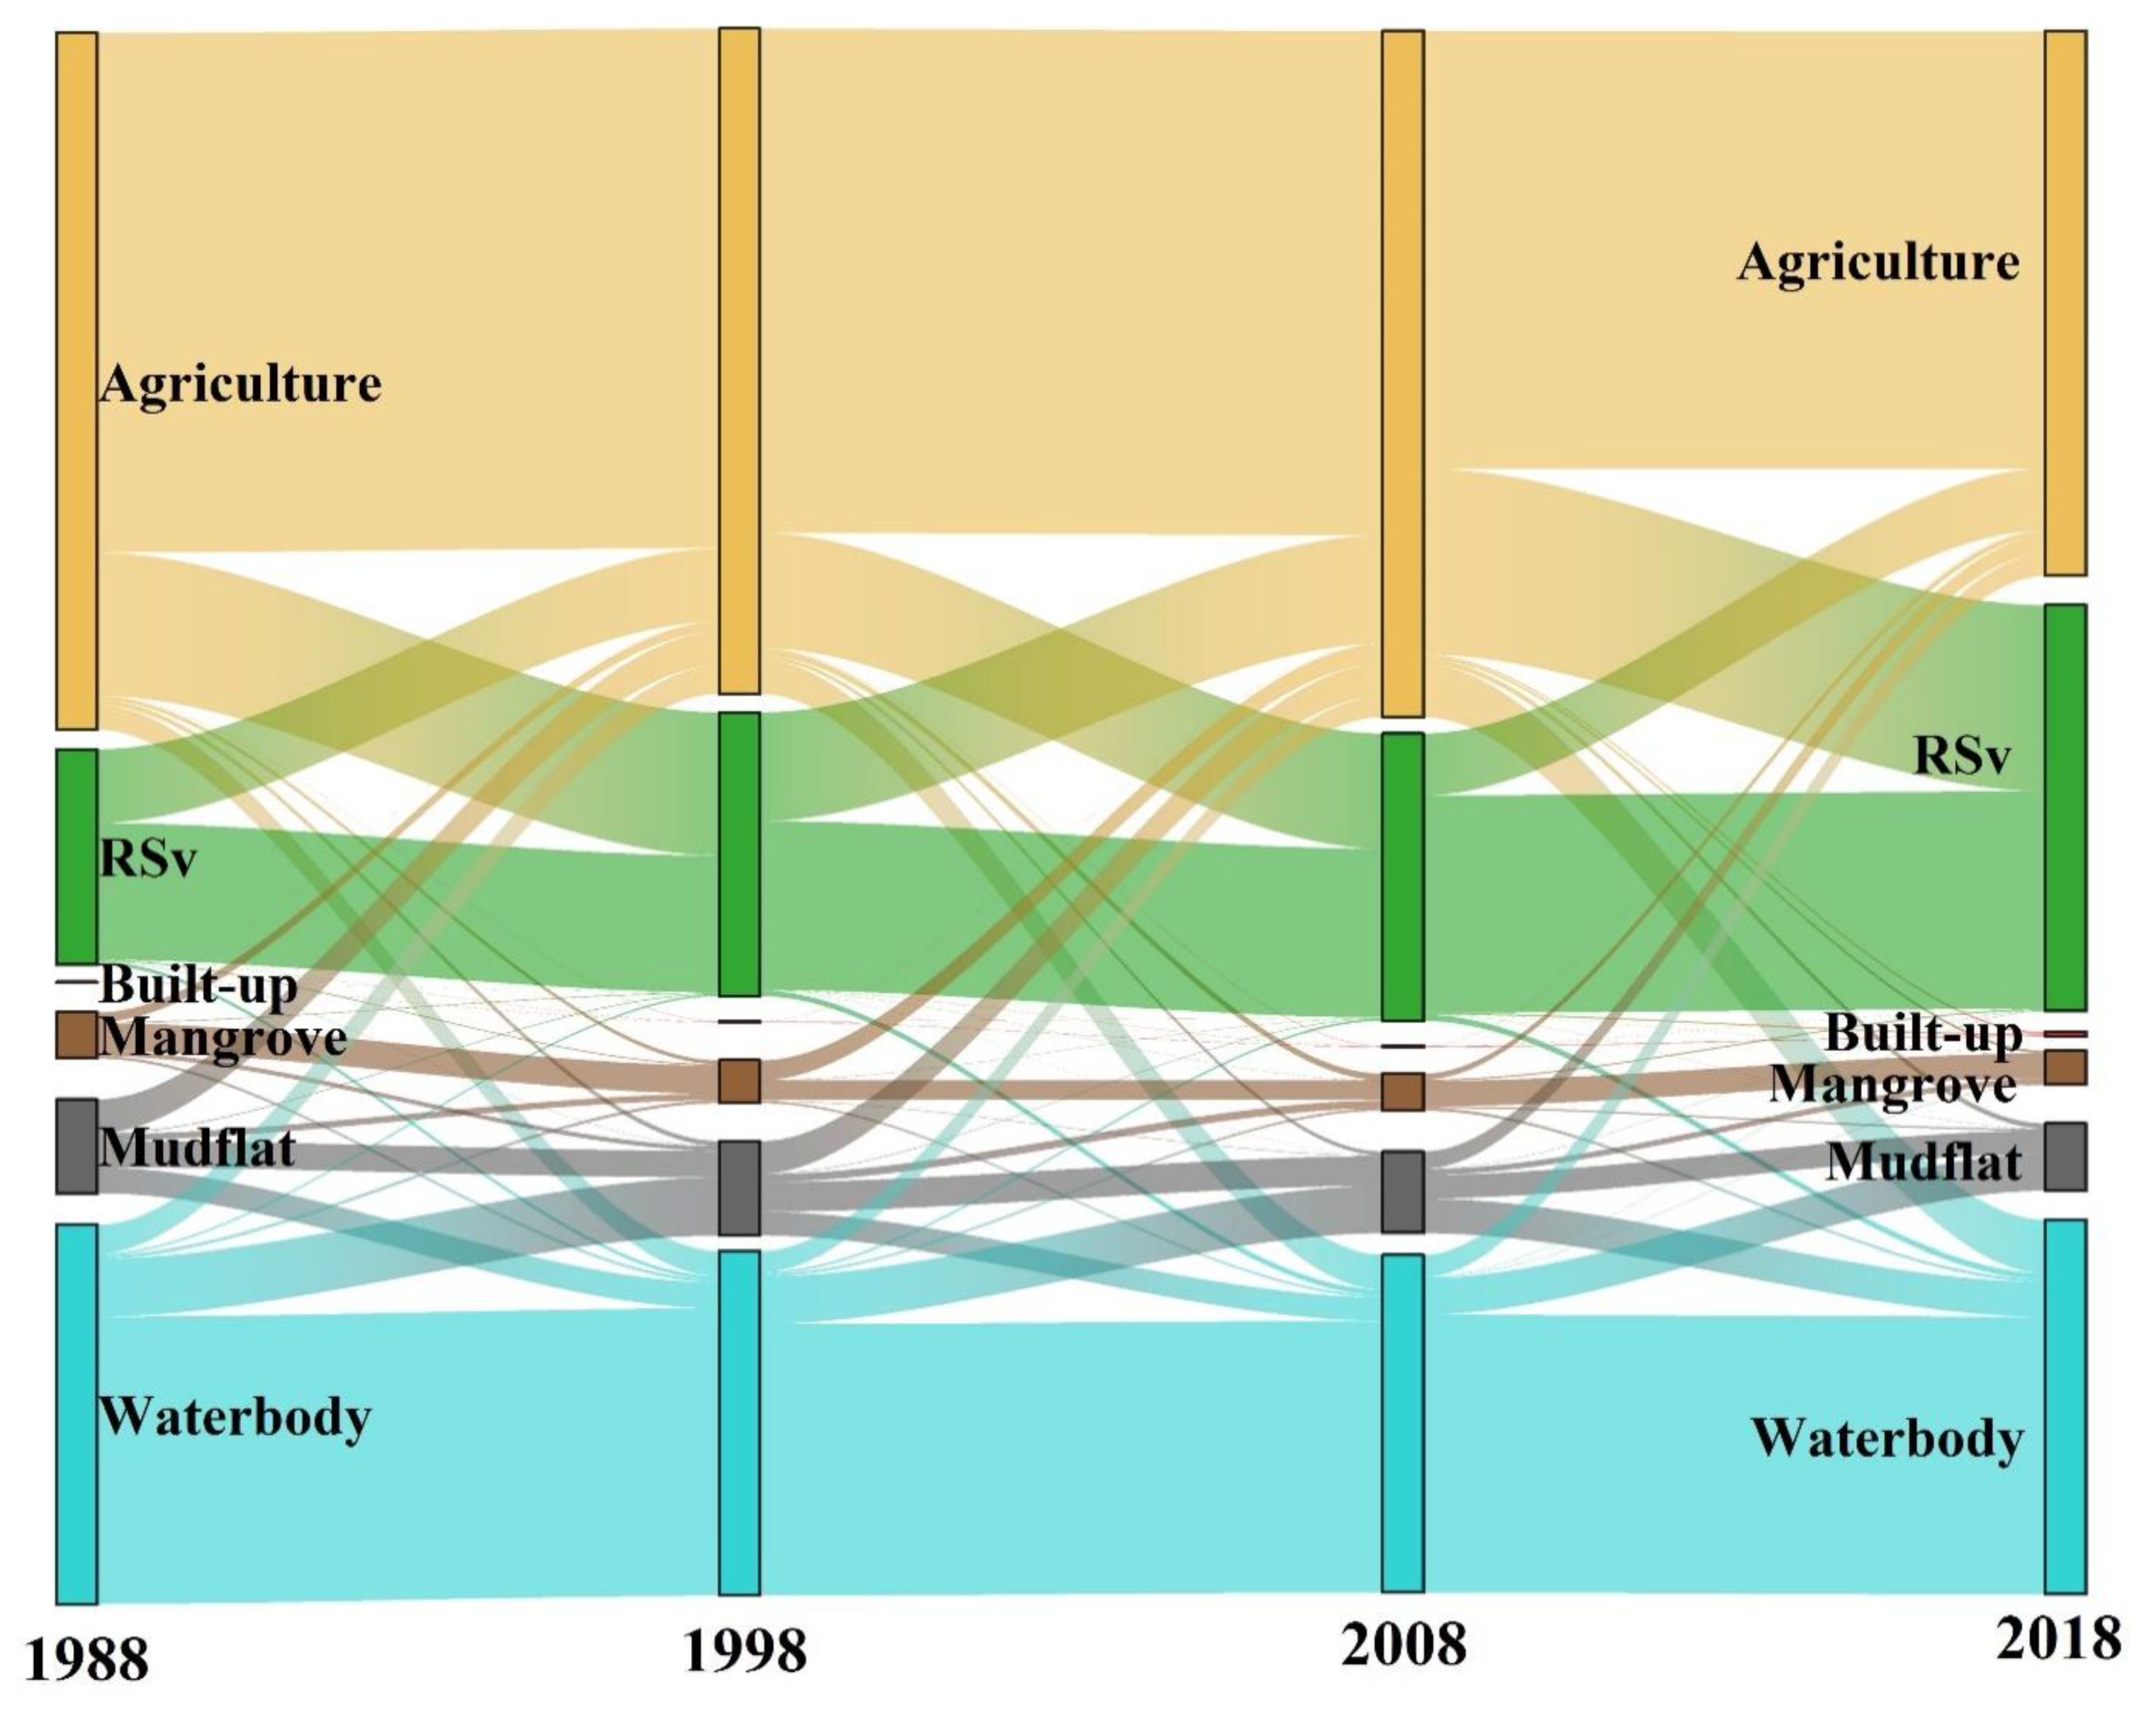
3.1. LULC Changes during 1988–2018

LULC dynamics of LMRE during 1988-2018 revealed that agricultural land constituted the largest proportion (38.07% to 48.68%) of LULC types (Figure 3 and Figure 4, Table S3), followed by water bodies and RSv, representing 26.44%–26.15% and 15.06%–28.38% of the study area, respectively. Consequently, the remaining three LULC types—mangrove, mudflat, and built-up—constituted about 7.40%–9.82% of the total landscape.
Among the different LULC types, the RSv and built-up areas exhibited rising trends from 1988 to 2018. Precisely, the largest increase of a single LULC was evident for RSv (1050 km2), while the growth of RSv from 2008 to 2018 was higher than that of the previous two-time intervals, such as 1988 to 1998, and 1998 to 2008. Although the proportion of the built-up area is very small, it has increased tremendously (almost ten times) during 1988 (2.247 km2) to 2018 (23.73 km2). However, the proportions of the remaining four LULC types declined with fluctuations. Unlike the RSv, the area of agricultural land has decreased by 777 km2 from 2008 to 2018, significantly more faster than that (61 km2) from 1988 to 2008. Both the mangrove forest and mudflat land have declined by 65 km2 and 147 km2, respectively, during 1988-2018, with a significant decrease between 1998 and 2008 (32 km2 and 70 km2, respectively). The area of water body decreased by 21 km2 during 1988 to 2018, with a preliminary rapid decline accompanied by a slightly less decline in the middle and a sharp increase at the end (Figure 3 and Figure 4).

3.2. LULC Changes during 2018–2038 under Different Scenarios

Under the various land development scenarios (Table 3), the LMRE will continue to be dominated by agricultural, RSv, and water body uses, in 2038. The areas of these three major land cover types will always be greater than 2.5 × 10³ km2 (32.31%), 2.4 × 10³ (30.65%), and 2.4 × 10³ km2 (24.87%), respectively, and the total area of these three land cover types will still account for more than 87% of the study area.
Considering the BAUD scenario, land cover pattern in 2038 revealed that agricultural land, mangrove plantations, and water bodies will be reduced by 211, 31, and 99 km2, respectively, while the RSv, mudflat, and built-up areas will be increased by 229, 93, and 19 km2, respectively, in 2038. The spatial distribution (Figure S3) of LULC change revealed that agricultural, RSv, and built-up areas will be more frequent near urban areas, roadsides, and riverbank areas with no specific clusters in the study area. However, the removal of mangrove forests will be more apparent on the Hatiya and Manpura islands, while other wetland ecosystems, such as mudflats and water bodies, will be unevenly distributed along the riverbank areas. Overall, the rate of deforestation, reclamation, and urbanization processes will continue in the LMRE under this land management scenario, leading to increased settlement areas, and decreased agricultural land, mangrove forests, and waterbody areas.
Moving towards the EDP scenario, the LULC patterns in 2038 (Table 3) indicated a decrease in 454 and 33 km2 of agricultural and mangrove forest lands, respectively, while an increase of 368, 26, 100, and 8 km2 of RSv, mudflats, built-up, and waterbody areas, respectively. Essentially, under this land management scenario, the LMRE will accommodate regional settlement constructions and other economic development activities keeping pace with national agenda of becoming a developed country by the year 2041, which in turn will exert tremendous pressure on agricultural land, mudflats, mangrove forests, and water bodies. A critical analysis of the 2018-2038EDP LULC transfer matrix revealed that the conversion of agricultural land to the various settlements would be 663.8 km2, while agricultural land reclamation from mangrove forests would be 30.9 km2. Therefore, it is evident that that conversion of the settlement area does not visibly occupy the mangrove forests directly but mostly occupies the agricultural land nearby the urban and rural road network; afterward, the loss of these agricultural land will be compensated, leading to further reclamation from the mangrove forests.
The LULC change patterns from 2018-2038EPP (Table 3) revealed that agricultural land and water bodies will be reduced by 379 and 99 km2, respectively, while RSv, mangrove forests, mudflats, and built-up areas will be increased by 179, 71, 210, and 19 km2, respectively. The spatial distribution (Figure S3) of LULC change revealed a more apparent change in the Hatiya and Subornochar sub-districts of the Noakhali and Manpura sub-districts of Bhola. Under this land management scenario, the LMRE is supposed to protect its wetland ecosystems and allow a subsequent conversion of agricultural lands to mangrove forests, leading to a decrease of 12.64% agricultural land. Consequently, mangrove forestland and mudflats will be increased by 37.44% and 56.52%, respectively.
Taking into account of ADP scenario, the LULC patterns in 2038 (Table 3) indicate that agricultural land and water bodies will be reduced by 356 and 99 km2, respectively, while RSv, mangrove forests, mudflats, and built-up areas will be increased by 180, 224, 32, and 19 km2 respectively. Under the ADP scenario, the LMRE will convert previously restored mudflats to mangrove plantations, under the government’s afforestation program, and will allow transforming previously reclaimed agricultural land to mangrove forests regeneration, leading to a 13.36% decrease in agricultural land and 54.14% and 7.93% increases in mangrove forestland and mudflats, respectively. From the spatial perspective (Figure S3), the expansion of mangrove plantation land could be distributed in the Charland areas of Ramgati, Daulatkhan, Tajumuddin, Manpura, Hatiya, Subarnachar, and Companiganj sub-districts. A critical analysis of the 2018-2038ADP LULC transfer matrix (Table 3) revealed that 71.71% of the mangrove forest area expansion will occur on the mudflats, and another 23.47% on the water bodies.

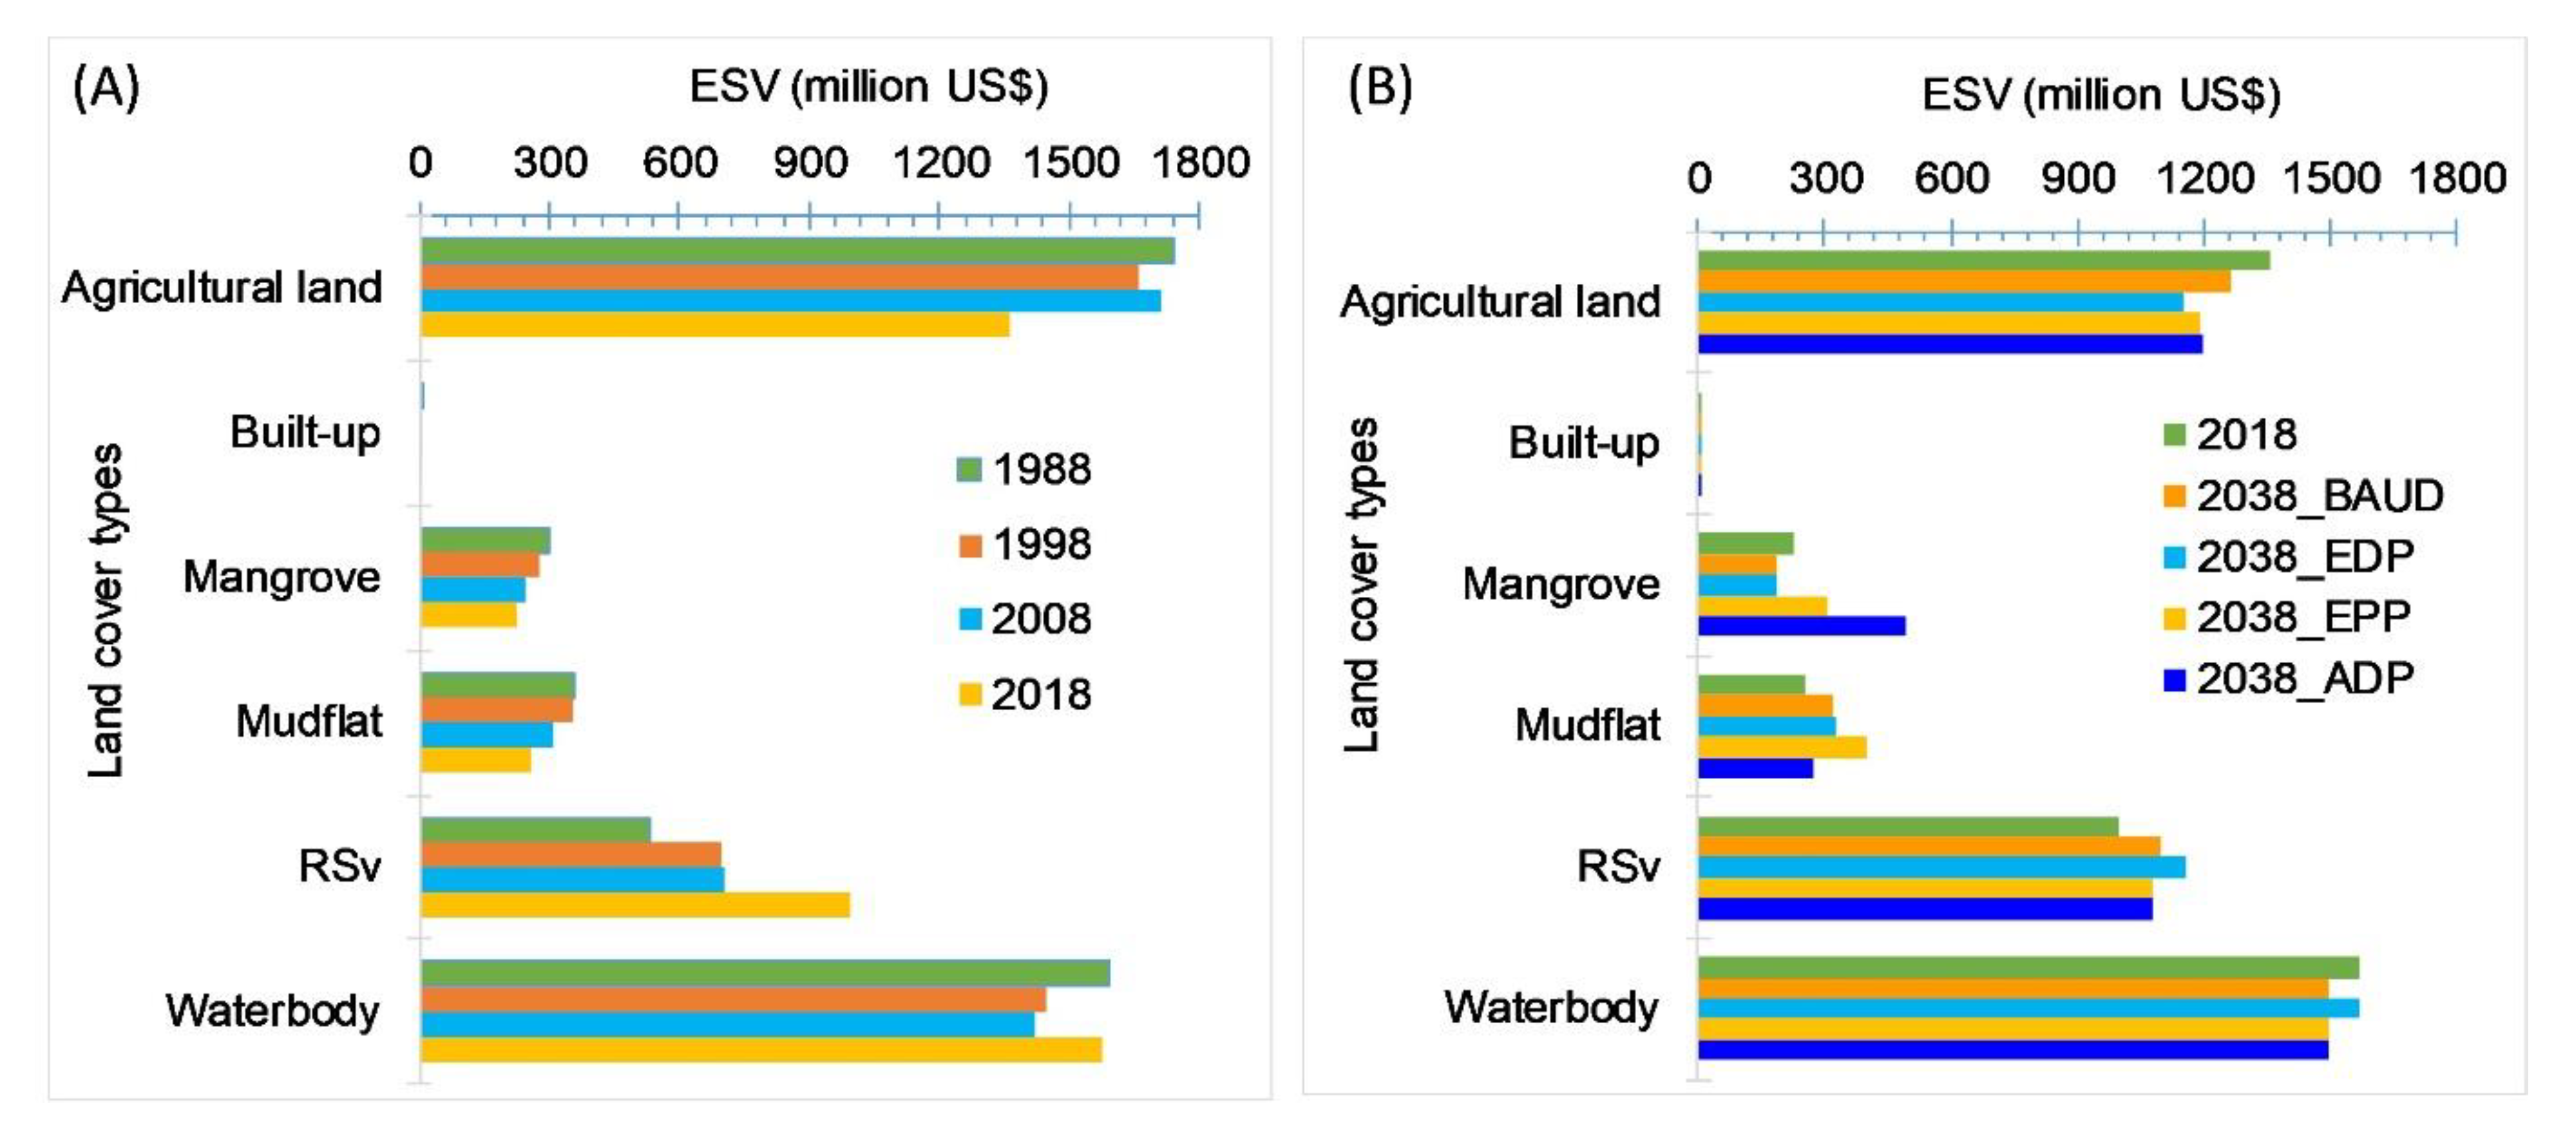
3.3. Changes in ESV during 1988–2018

The findings (Figure 5, Table S4) reveal that over the past 30 years, total ESV of LMRE decreased by US$105.34 million, with an annual average of US$3.51 million and a mean decreasing rate of 0.05%, the majority of which ensued from decreasing agricultural land, and a significant proportion from decreasing wetland ecosystem services, such as mangrove forests and mudflats. Specifically, ESV in agricultural land decreased by US$380.86 million compared with 1988, a shift mainly attributable to the conversion of agricultural land to settlement area (both rural and urban) to accommodate rapid population growth and economic development of the region. The second-largest decrease of ESV was found in mudflats (US$100.83 million), followed by mangrove forests (US$77.28 million) and water bodies (US$15.72 million). By 2018, two-thirds (66.52%) of total ESV is estimated to be converted from agricultural land (30.85%) and water bodies (35.67%), mostly because these two land cover types comprised 64.20% of the study area and partly due to comparatively higher ESV in per unit area of water bodies than built-up areas and rural settlements. Although mangrove forests comprised only 2.41% of the study area in 2018, they contributed 5.09% of total ESV. Correspondingly, ESV in RSv and built-up areas increased by US$468.34 million and US$1.01 million, respectively.
Among the different ecosystem functions, except for water regulation, ESVs of all other functions decreased during 1988–2018. In particular, food production, extreme event management, and soil formation decreased by 8.36%, 11.48%, and 7.28%, respectively (Table S5).

3.4. Effects of Future Land Management Scenarios on Subsequent Changes in ESVs

The total ESVs of the LMRE in 2038 is anticipated to alter both positively and negatively, depending on the various land management scenarios. Specifically, the ESVs under the BAUD and EDP scenarios will be decreased by US$41.37 million and US$16.38 million, respectively, while ESVs under the EPP and ADP scenarios will be increased by US$60.61 million and US$130.95 million, respectively (Figure 5, Table 4). Under the BAUD scenario, 46.05%, 3.62%, and 36.56% of the total ESV loss will be attributable to decreases in agricultural land, mangrove forests, and water bodies, respectively, while under the EDP scenario, the contributions of agricultural land and mangrove forests to the total ESV loss will be 82.15% and 15.51%, respectively (Table S6). By contrast, under the EPP scenario, the increases in mangrove forests and mudflat land will contribute 27.25% and 46.65% of the total increase in ESV in 2038, while under the ADP scenario, an increase in mangrove forest land alone will contribute 72% of the total ESV increase in 2038.
The prediction of ESV changes to individual ecosystem functions revealed that (Table S7) food and raw material provision will be decreased (3%–6%) under all LULC change scenarios. However, by implementing the EPP and ADP scenarios, some important ecosystem functions can be improved, such as extreme event management (13%–36%), climate regulation (3%–4%), biodiversity and habitat (8%-22%), and soil formation and retention (8%–24%).

4. Discussion

4.1. Trade-offs between ESVs and Regional Food Security

The findings from simulations of LULC under different land management scenarios in 2038 (Table 4) revealed that ESV will decline by US$41.37 and US$16.38 million if the LULC change pattern continues following the BAU and EDP scenarios, respectively. However, it is possible to increase the total ESV by US$60.61 million and US$130.95 million by following the EPP and ADP scenarios, respectively.
A critical analysis of LULC change between 2018 and 2038 under different scenarios (Table 4) revealed that the area of agricultural land under EDP, EPP, and ADP scenarios will be decreased to varying degrees compared to the BAUD scenario. In this connection, the maximum decrease of agricultural land is predictable under the EDP (454 km2) scenario, which was followed by EPP (379.22 km2), ADP (355.67 km2), and BAUD (211.17 km2) scenarios, respectively (Table 4). Since agricultural lands are a prime source of food grain supply, preservation of agricultural farmlands could ensure sustenance of regional food and livelihood security [20,23]. Therefore, it is imperative to undertake systematic policy analysis and discussions before targeting agricultural land as a source of reclamation for any developmental activities.
Analysis of food grain production and consumption habits in LMRE revealed that certain cereals (rice, wheat, and maize) and pulse grains (lentil, mung bean, black gram, and cowpea) are major consumed staple food grains and total production of food grains in the LMRE was recorded 1.98 million tons in the year 2018 with an average yield rate of 6587 kg ha−1 yr−1 [16,41]. Hence, if agricultural production practices of LMRE until 2038 remain unchanged, i.e., no progresses to plant varieties, cropping pattern, and crop yield, it is predictable that by 2038, there will be the highest decrease (0.30 million ton) of major food grain harvest under the EDP scenario followed by EPP (0.25 million ton), ADP (0.23 million ton), and BAUD (0.14 million ton) scenarios, respectively (Table 4).
In order to estimate the total food grain requirements of LMRE in 2038, we first considered the population growth rate between 2018 and 2038 as similar to that from 2001 to 2016 [16,23]. Consequently, the estimated total population of LMRE is expected to be 9.48 million in 2038. Considering the usual per capita food grain consumptions (197 kg/per capita) in Bangladesh [41], the demand for total annual food grain will be approximately 1.87 million tons by 2038 to feed the local population of LMRE. Therefore, under each of the four land management scenarios, there will be varying degrees of shortage in the required food supply for the local population of LMRE in 2038. The maximum shortage of food grain supply is predicted under the EDP scenario (10.21%) followed by EPP (7.58%), ADP (6.75%), and BAUD (1.65%) scenarios, respectively (Table 4).
It is very common for ecological protection to cause a risk of food security [6]. Hence, before implementing future land development plans, the local government should carefully consider a cost-benefit analysis considering all aspects of the project, paying special consideration to the food security problem [6]. Therefore, with the limited land resources and high population pressure, Bangladesh will face a significant challenge in attaining a balanced target of restoring ecological values and ensuring food security in the coming decades [23]. Nonetheless, a specific area may be given food subsidies to support ecological and environmental protection, since it will provide various invaluable regulatory and supporting services to create a buffer zone protecting the interior coastal ecosystem from climatic disasters [20,23]. Another region far from the exposed coast may be targeted for producing a surplus amount of food grains to balance the shortage in areas that require to strictly restore its ecological value by restricting agricultural expansion. Consequently, the exchange of foods between the different locality of a country can instantaneously secure the human well-being and ecological protection, and develop resilience to climate change at the national scale [6]. These issues must be given priority as Bangladesh is becoming one of the fastest economic growth countries in the Asian region, and the coastal zone will be targeted for reclamation to establish new infrastructure and settlements, which will require LULC change projects and programs [23].

4.2. Implications for Future Land Management in the LMRE

The BAUD and EDP scenarios in this study show that ecologically high-value land cover (mangroves and water bodies) will be decreased, leading to a decrease in the ESVs. On the other hand, by controlling the artificial land cover expansion to the natural ecosystem and initiating a mangrove afforestation program, the ESs of the LMRE could be increased under the EPP and ADP scenarios, mainly by the expansion of mangrove forest land.
The pattern and changes of LULC under the BAUD scenario have several potential threatening factors. Under this scenario, the coastal communities might endure their traditional form of subsistence agricultural farming by manipulating the scarce natural ecosystem to compensate for the farmland losses brought about by rural and urban settlement. Moreover, climate change could cause more land erosion and accretion (Figure S4), which may damage the well-being of coastal communities and lessen their food and livelihood security because of their dependence on land-based income generation activities [20]. The decline of biodiversity in mangrove forests as a result of the reclamation of agricultural land is another very serious limiting factor of the BAUD scenario. Furthermore, the reduction of socio-ecological systems having a high capacity of carbon storage and sequestration could lead to higher emissions of CO2 [4].
The EDP scenario also has some significant limiting factors. The greatest loss will be in agricultural land and mangrove forests, under this scenario. Hence, on the one hand, the EDP scenario will decrease food supply by 10.21%, while on the other hand, it will decrease the ecological value by US$16.38 million. It is a matter of concern that the vision of the Bangladesh government to transform the country to a developed nation by 2041 could lead to more threats to farmland and natural ecosystems, to accommodate tremendous new settlement establishments in the LMRE, potentially damaging the river channels that connect the entire country.
The EPP and ADP scenarios, by contrast, offer large enhancements to the ESVs, as a result of strategies planned by the Bangladesh government in its latest delta development plan, 2100 and commitment for reduction of GHG emissions through REDD+ activity [29]. Intensification of agriculture through improved inputs, adoption of new technologies, and management efficiency, along with compact settlement expansion in the EPP and ADP scenarios, could moderate the extensive burden from the natural ecosystem and enhance their ecosystem services and minimize the food supply gaps to ensure food security. Specifically, these two land management scenarios have the immense potentiality to safeguard the land and water-related resources by creating a resistant mechanism to control the water discharge and, consequently, the accretion and erosion processes, which could help to preserve habitat biodiversity and improve soil fertility. As a result, in the EPP and ADP scenarios, extreme event management, climate regulation, biodiversity and habitat preservation, and soil formation and retention capacity are enhanced, compared to the BAUD and EDP scenarios (Table S7). However, the key challenges for the implementation of the EPP scenario could be financial issues as it requires a large amount of investment capital [23]. Specifically, the cost of improved agricultural practices would require to offer some subsidies by the government to afford the agricultural inputs such as seeds, fertilizer, pesticide, irrigation, post-harvesting management tools, and obviously to arrange training programs for developing the skills of those actively being involved with farming practices [20,42,43]. Moreover, the installation of fuel-efficient stoves or alternatives to reduce the harvest of fuelwood from forest vegetation, increasing competency in value chain management would require a large amount of capital [24,25]. In addition to the challenges of the EPP scenario, the ADP scenario presents other challenges, such as the costs of creating mangrove plantations, including their management and the enforcement of regulations restricting the use of mangrove resources and reclamation on newly developed wetlands for the purpose of settlement or agriculture.

4.3. Limitations of the Study and Potential Uncertainties

This study faced some limiting factors that need to be highlighted. Firstly, the land cover map was created using maximum likelihood classification systems, but the land use pattern in Bangladesh is very complex and diversified, and this disparity may have led to substantial error or misclassification of the Landsat images [19]. To overcome this limitation to the maximum level possible, we administered the post-processing function of SCP plug-ins in QGIS software [28] with the help of historical changes of landscape in high-resolution Google Earth maps and knowledge gathered from the field visit. Secondly, the CA-Markov model administered in simulating LULC prediction might not have considered all potential driving factors during the creation of a suitability map or simulations of land use patterns [5]. Although the geomorphology of the study area is very dynamic because of continuous erosion and accretion processes [21,22,27], appropriate indicators to control these factors were not considered. Future studies should consider these driving factors while creating suitability maps and simulations of land use. Moreover, the CA-Markov itself is not an error-free model and, hence, substantial errors may have occurred in its use [5]. Finally, the ecosystem service valuation technique we used might have underestimated the contributions of corresponding land biomes [44]. The ecosystem services for identical LULC types could differ when the landscape structure is complex, just as the LMRE could affect the ecosystem functions, such as availability and quality of groundwater, and habitat biodiversity [45]. Hence, the landscape structure of an ecosystem should be taken into consideration for any future studies focusing on the evaluation of ESVs. Nonetheless, the valuation coefficient proposed by the author [9] and the modifications made by other authors [8,38,39] and applied in our study should provide sufficient information to the relevant stakeholders to consider policy changes. Despite the aforementioned limitations, the results of this study are feasible for planning the sustainable development of the Meghna River estuary and can help in incorporating the ecosystem service approach to land management decisions.

5. Conclusions

This study examined the future dynamics of LULC change scenarios and forecasted the subsequent variations in ESVs. The validation of our ecological engineering model with actual LULC data from 2018 demonstrates satisfactory results, indicating that the CA–Markov model used in this study is suitable for generating future LULC scenarios by linking suitability maps of different LULC types, based on various constraints and influencing factors.
The projected LULC change analysis indicated increases in rural and urban settlement areas but decreases in agricultural land, mangrove forests, mudflats, and water bodies. The results of LULC prediction revealed that under all of the four land management scenarios, agricultural land and water bodies will be decreased while rural and urban settlements, along with mudflats, will be increased. Mangrove forest land will be decreased under the BAUD and EDP scenarios but increased under the EPP and ADP scenarios.
The total ESV of the LMRE decreased by as much as US$105.34 million during 1988-2018, of which 66% is attributable to agricultural land loss while 13%, 17%, and 3% are from the losses of mangrove forests, mudflats, and water bodies, respectively. The predicted ESV results indicated that if the LULC change pattern in 2038 continues following the BAUD and EDP scenarios, the total ESV will decline by US$41.37 and US$16.38 million, respectively, while under the EPP and ADP scenarios, total ESV will increase by US$60.61 and US$130.95 million, respectively.
The predicted food security results revealed that the losses of food grain supply would be highest under the EDP scenario (10.21%), followed by EPP (7.58%), ADP (6.75%), and BAUD (1.65%) scenarios. Hence, considering the trade-offs between ESVs and regional food supply gaps, the ADP scenario could be a better option for future land management, but it requires further consideration by policymakers and governmental bodies.
The ecological engineering methods and land use management scenarios proposed in this study will afford essential guidance for further enhancement of ecosystem services of the studied landscape, and the methodology can be implemented in other low-elevation developing countries.

Supplementary Materials

The following are available online at https://www.mdpi.com/2071-1050/12/5/2112/s1. Table S1. Estimation of accuracy in LULC classification; Table S2. Parameters and weights used in the simulation of suitability maps; Table S3. LULC transition matrix during 1988-2018 (km2); Table S4. Total ESVs and their change rates, 1988-2018; Table S5. ESV across the different ecosystem functions and their changes between 1988 and 2018; Table S6. ESVs under different scenarios in 2038 and their change rates; Table S7. ESV changes across ecosystem functions under the different scenarios in 2038; Figure S1. Suitability maps of different LULC types: (a) Agricultural land, (b) RSv, (c) Mangrove, (d) Mud-flat, (e) Built-up, (f) Waterbody; Figure S2. Validation of simulated LULC in 2018: (a) actual LULC map for 2018, (b) simulated LULC map for 2018; Figure S3. Change detection of LULC during 2018–2038 under the different land management scenarios; Figure S4. Changes of climatic factors in the LMRE during 1988–2018.

Author Contributions

Conceptualization, M.Z.H. and S.C.; methodology, M.Z.H., S.C. and L.X.; software, M.Z.H. and I.I.; validation, M.Z.H. and S.C.; formal analysis, M.Z.H. and I.I.; investigation, M.Z.H. and I.I.; resources, M.Z.H. and S.C.; data curation, M.Z.H. and I.I.; writing—original draft, M.Z.H.; writing—review and editing, M.Z.H., S.C., I.I., L.X. and J.T.; visualization, M.Z.H.; supervision, S.C. and L.X.; project administration, S.C. and L.X.; funding acquisition, S.C. and L.X. All authors have read and agreed to the published version of the manuscript.

Funding

This research was jointly funded by the National Natural Science Foundation of China (41661144032), The National Key Research and Development Program of China (2017YFC0506600), and Chinese Academy of Sciences—The World Academy of Sciences (CAS−TWAS) President’s Fellowship Program for international Ph.D. students at University of Chinese Academy of Sciences (UCAS), China.

Acknowledgments

Authors extend their sincere gratitude to the experts and employees of different organizations in Bangladesh who spared us their valuable time during the data collection. USGS is acknowledged for making the Landsat data available online. We also extend earnest gratitude to the editor and anonymous reviewers for their productive comments and valued suggestions.

Conflicts of Interest

The authors declare no conflict of interest.

References

  1. Yirsaw, E.; Wu, W.; Shi, X.; Temesgen, H.; Bekele, B. Land Use/Land Cover Change Modeling and the Prediction of Subsequent Changes in Ecosystem Service Values in a Coastal Area of China, the Su-Xi-Chang Region. Sustainability 2017, 9, 1204. [Google Scholar] [CrossRef] [Green Version]
  2. Sun, X.; Crittenden, J.; Li, F.; Lu, Z.; Dou, X. Urban expansion simulation and the spatio-temporal changes of ecosystem services, a case study in Atlanta Metropolitan area, USA. Sci. Total. Environ. 2018, 622, 974–987. [Google Scholar] [CrossRef] [PubMed]
  3. Estoque, R.C.; Murayama, Y. Examining the potential impact of land use/cover changes on the ecosystem services of Baguio city, the Philippines: A scenario-based analysis. Appl. Geogr. 2012, 35, 316–326. [Google Scholar] [CrossRef]
  4. Sahle, M.; Saito, O.; Fürst, C.; Demissew, S.; Yeshitela, K. Future land use management effects on ecosystem services under different scenarios in the Wabe River catchment of Gurage Mountain chain landscape, Ethiopia. Sustain. Sci. 2018, 14, 175–190. [Google Scholar] [CrossRef]
  5. Zhao, M.; He, Z.; Du, J.; Chen, L.; Lin, P.; Fang, S. Assessing the effects of ecological engineering on carbon storage by linking the CA-Markov and InVEST models. Ecol. Indic. 2019, 98, 29–38. [Google Scholar] [CrossRef]
  6. Hu, Y.; Gao, M. Batunacun Evaluations of water yield and soil erosion in the Shaanxi-Gansu Loess Plateau under different land use and climate change scenarios. Environ. Dev. 2019, 100488. [Google Scholar] [CrossRef]
  7. Millennium Ecosystem Assessment, M.E.A. Ecosystems and human well-being. Synthesis 2005, 5, 563. [Google Scholar]
  8. Huq, N.; Bruns, A.; Ribbe, L. Interactions between freshwater ecosystem services and land cover changes in southern Bangladesh: A perspective from short-term (seasonal) and long-term (1973–2014) scale. Sci. Total. Environ. 2019, 650, 132–143. [Google Scholar] [CrossRef]
  9. Costanza, R.; d’Arge, R.; De Groot, R.; Farber, S.; Grasso, M.; Hannon, B.; Limburg, K.; Naeem, S.; O’neill, R.V.; Paruelo, J.; et al. The value of the world’s ecosystem services and natural capital. Nature 1997, 387, 253–260. [Google Scholar] [CrossRef]
  10. Arowolo, A.O.; Deng, X.; Olatunji, O.A.; Obayelu, A.E. Assessing changes in the value of ecosystem services in response to land-use/land-cover dynamics in Nigeria. Sci. Total. Environ. 2018, 636, 597–609. [Google Scholar] [CrossRef]
  11. Akber, A.; Khan, W.R.; Islam, A.; Rahman, M.; Rahman, M.R. Impact of land use change on ecosystem services of southwest coastal Bangladesh. J. Land Use Sci. 2018, 13, 1–13. [Google Scholar] [CrossRef]
  12. Nor, A.N.M.; Corstanje, R.; Harris, J.; Brewer, T. Impact of rapid urban expansion on green space structure. Ecol. Indic. 2017, 81, 274–284. [Google Scholar] [CrossRef]
  13. Basse, R.M.; Omrani, H.; Charif, O.; Gerber, P.; Bodis, K. Land use changes modelling using advanced methods: Cellular automata and artificial neural networks. The spatial and explicit representation of land cover dynamics at the cross-border region scale. Appl. Geogr. 2014, 53, 160–171. [Google Scholar] [CrossRef]
  14. Hoque, M.Z.; Cui, S.; Xu, L.; Islam, I.; Ali, G.; Tang, J. Resilience of coastal communities to climate change in Bangladesh: Research gaps and future directions. Watershed Ecol. Environ. 2019, 1, 42–56. [Google Scholar] [CrossRef]
  15. Abdullah, A.Y.M.; Masrur, A.; Adnan, M.S.G.; Al Baky, A.; Hassan, Q.K.; Dewan, A. Spatio-temporal Patterns of Land Use/Land Cover Change in the Heterogeneous Coastal Region of Bangladesh between 1990 and 2017. Remote. Sens. 2019, 11, 790. [Google Scholar] [CrossRef] [Green Version]
  16. BBS. Statistical Yearbook of Bangladesh: Bangladesh Bureau of Statistics (BBS); Ministry of Planning: Dhaka, Bangladesh, 2018.
  17. Hasan, S.S.; Deng, X.; Li, Z.; Chen, D. Projections of Future Land Use in Bangladesh under the Background of Baseline, Ecological Protection and Economic Development. Sustainability 2017, 9, 505. [Google Scholar] [CrossRef] [Green Version]
  18. World Economic Forum. Here’s what you need to know about Bangladesh’s rocketing economy. Available online: https://www.weforum.org/agenda/2019/11/bangladesh-gdp-economy-asia/ (accessed on 24 February 2020).
  19. Islam, M.R.; Miah, M.G.; Inoue, Y. Analysis of Land use and Land Cover Changes in the Coastal Area of Bangladesh using Landsat Imagery. Land Degrad. Dev. 2015, 27, 899–909. [Google Scholar] [CrossRef]
  20. Hoque, M.Z.; Cui, S.; Xu, L.; Islam, I.; Tang, J.; Ding, S. Assessing Agricultural Livelihood Vulnerability to Climate Change in Coastal Bangladesh. Int. J. Environ. Res. Public Heal. 2019, 16, 4552. [Google Scholar] [CrossRef] [Green Version]
  21. Ahmed, A.; Drake, F.; Nawaz, R.; Woulds, C. Where is the coast? Monitoring coastal land dynamics in Bangladesh: An integrated management approach using GIS and remote sensing techniques. Ocean Coast. Manag. 2018, 151, 10–24. [Google Scholar] [CrossRef]
  22. Ahmed, A.; Nawaz, R.; Drake, F.; Woulds, C. Modelling land susceptibility to erosion in the coastal area of Bangladesh: A geospatial approach. Geomorphol. 2018, 320, 82–97. [Google Scholar] [CrossRef]
  23. Nicholls, R.J.; Hutton, C.W.; Adger, W.N.; Hanson, S.E.; Rahman, M.M.; Salehin, M. (Eds.) Ecosystem Services for Well-Being in Deltas: Integrated Assessment for Policy Analysis; Palgrave Macmillan: Basingstoke, UK, 2018. [Google Scholar]
  24. Iftekhar, M.S.; Takama, T. Perceptions of biodiversity, environmental services, and conservation of planted mangroves: a case study on Nijhum Dwip Island, Bangladesh. Wetl. Ecol. Manag. 2007, 16, 119–137. [Google Scholar] [CrossRef]
  25. Chow, J. Determinants of household fuelwood collection from mangrove plantations in coastal Bangladesh. For. Policy Econ. 2018, 96, 83–92. [Google Scholar] [CrossRef]
  26. BBS. Statistical yearbook of Bangladesh: Bangladesh Bureau of Statistics (BBS); Ministry of Planning: Dhaka, Bangladesh, 2011.
  27. Syed, Z.H.; Choi, G.; Byeon, S. A Numerical Approach to Predict Water Levels in Ungauged Regions—Case Study of the Meghna River Estuary, Bangladesh. Water 2018, 10, 110. [Google Scholar] [CrossRef] [Green Version]
  28. Congedo, L. Semi-Automatic Classification Plugin Documentation. 2013. Available online: https://www.researchgate.net/publication/265020952_Semi-Automatic_Classification_Plugin_for_QGIS (accessed on 24 February 2020).
  29. MoEFCC. The submission of Bangladesh’s forest reference level for REDD+ under the UNFCCC; Ministry of Environment, Forest and Climate Change (MoEFCC), Government of Bangladesh: Dhaka, Bangladesh, 2018. Available online: https://redd.unfccc.int/files/2019_submission_frel_bangladesh.pdf (accessed on 24 February 2020).
  30. Gong, W.; Yuan, L.; Fan, W.; Stott, P.G. Analysis and simulation of land use spatial pattern in Harbin prefecture based on trajectories and cellular automata—Markov modelling. Int. J. Appl. Earth Obs. Geoinformation 2015, 34, 207–216. [Google Scholar] [CrossRef]
  31. Saaty, T.L. Decision making with the analytic hierarchy process. Int. J. Serv. Sci. 2008, 1, 83–98. [Google Scholar] [CrossRef] [Green Version]
  32. Goepel, K.D. Implementing the Analytic Hierarchy Process as a Standard Method for Multi-Criteria Decision Making in Corporate Enterprises—a New AHP Excel Template with Multiple Inputs. In Proceedings of the international symposium on the analytic hierarchy process 2013, Kualalampur, Malaysia, 23–26 June 2013. [Google Scholar]
  33. Poska, A.; Sepp, E.; Veski, S.; Koppel, K. Using quantitative pollen-based land-cover estimations and a spatial CA_Markov model to reconstruct the development of cultural landscape at R õuge, South Estonia. Veg. Hist. Archaeobotany 2007, 17, 527–541. [Google Scholar] [CrossRef]
  34. Gashaw, T.; Tulu, T.; Argaw, M.; Worqlul, A.W.; Tolessa, T.; Kindu, M. Estimating the impacts of land use/land cover changes on Ecosystem Service Values: The case of the Andassa watershed in the Upper Blue Nile basin of Ethiopia. Ecosyst. Serv. 2018, 31, 219–228. [Google Scholar] [CrossRef]
  35. Zhang, F.; Yushanjiang, A.; Jing, Y. Assessing and predicting changes of the ecosystem service values based on land use/cover change in Ebinur Lake Wetland National Nature Reserve, Xinjiang, China. Sci. Total. Environ. 2019, 656, 1133–1144. [Google Scholar] [CrossRef]
  36. Plummer, M.L. Assessing benefit transfer for the valuation of ecosystem services. Front. Ecol. Environ. 2009, 7, 38–45. [Google Scholar] [CrossRef] [Green Version]
  37. Yi, H.; Güneralp, B.; Filippi, A.M.; Kreuter, U.P.; Guneralp, I. Impacts of Land Change on Ecosystem Services in the San Antonio River Basin, Texas, from 1984 to 2010. Ecol. Econ. 2017, 135, 125–135. [Google Scholar] [CrossRef]
  38. De Groot, R.; Brander, L.; Van Der Ploeg, S.; Costanza, R.; Bernard, F.; Braat, L.; Christie, M.; Crossman, N.; Ghermandi, A.; Hein, L.; et al. Global estimates of the value of ecosystems and their services in monetary units. Ecosyst. Serv. 2012, 1, 50–61. [Google Scholar] [CrossRef]
  39. Ullah, M.; Mondal, M.; Atiqul, I.; Uddin, M.; Ferdous, M. Implications of Mangrove Wetland in Socio-environmental Sector: Experiences from Southeast Coast of Chittagong, Bangladesh. JFES 2010, 26, 103–111. [Google Scholar]
  40. Chow, J. Spatially Explicit Evaluation of Local Extractive Benefits from Mangrove Plantations in Bangladesh. J. Sustain. For. 2015, 34, 651–681. [Google Scholar] [CrossRef]
  41. Chen, Y.; Lyu, C. A Comparative Analysis on Food Security in Bangladesh, India and Myanmar. Sustainability 2018, 10, 405. [Google Scholar] [CrossRef] [Green Version]
  42. Chowdhury, A.; Haque, M.; Hoque, M.; Rokonuzzam, M. Adoption of BRRI Dhan47 in the Coastal Saline areas of Bangladesh. Agric. J. 2012, 7, 286–291. [Google Scholar] [CrossRef]
  43. Khalil, I.; Haque, E.; Hoque, M.Z. Adoption of recommended potato (Solanum tuberosum) production technologies by the potato growers of some selected areas of Bangladesh. Bangladesh J. Agric. Res. 2014, 39, 79–92. [Google Scholar] [CrossRef] [Green Version]
  44. Kindu, M.; Schneider, T.; Teketay, D.; Knoke, T. Changes of ecosystem service values in response to land use/land cover dynamics in Munessa–Shashemene landscape of the Ethiopian highlands. Sci. Total. Environ. 2016, 547, 137–147. [Google Scholar] [CrossRef]
  45. Junior, R.F.V.; Varandas, S.G.; Pacheco, F.A.L.; Pereira, V.; Santos, C.; Cortes, R.M.; Fernandes, L.F.S. Impacts of land use conflicts on riverine ecosystems. Land Use Policy 2015, 43, 48–62. [Google Scholar] [CrossRef] [Green Version]
Figure 1. Study area map, along with elevations.
Sustainability 12 02112 g001
Figure 2. Framework of the study.
Sustainability 12 02112 g002
Figure 3. Simulated (1988–2018) and predicted (2038) LULC maps of the lower Meghna River estuary.
Sustainability 12 02112 g003
Figure 4. Patterns of transformations among various LULC types in LMRE, 1988-2018.
Sustainability 12 02112 g004
Figure 5. Changes of ecosystem service values (ESVS) (A) 1988–2018, and (B) 2018–2038.
Sustainability 12 02112 g005
Table 1. Land use/land cover (LULC) classification system applied in this study.
LULC TypeDescription
Agricultural landCultivated and uncultivated farmlands
Rural settlement with vegetation (RSv)Homestead vegetation, tree canopy on and around rural settlements, orchard, tree plantation or woodlands
Mangrove forestWetland area covered with dense forests both natural and planted
MudflatCoastal flat, coastal marsh, newly accreted land
Built-up landResidential, commercial, and industrial sites, exposed roads (highways), and other urban forms
Water bodyRivers, canals, and other active hydrological features
Table 2. Monetary valuation (US$ ha−1yr−1) of ecosystem services of different LULC types in the Lower Meghna River Estuary (LMRE).
Function Services ESV/(US$ ha−1yr−1)
AL aRSv bMG cMF dBU eWB f
ProvisioningFood production 9223572501350603
Raw material 31721127270423
RegulatingExtreme event management7878250027278233
Climate regulation 42653311408530533
Water regulation 9581277579.3255502555
SupportingBiodiversity protection33349944004990499
Soil formation and retention14114116502120141
Waste treatment 11031103760193002206
CulturalRecreation, culture and tourism261261550392392457
Total4539446111,85668744707649
a Agricultural land, b Rural settlement with vegetation, c Mangrove forest, d Mudflat, e Built-up, f Water body.
Table 3. Transfer matrix of LULC between 2018-2038 under different scenarios (km2).
Scenarios LULC Type2038
AL aRSv bMG cMF dBU eWB f
BAUD2018AL2353.5279.033.178.51.445.7
RSv572.01848.940.61.91.21.1
MG1.50.3115.427.80.014.1
MF5.20.10.1261.30.0196.8
BU8.314.00.00.020.80.1
WB59.994.50.51.30.21803.2
EDP2018AL2211.4245.730.937.60.921.9
RSv663.81910.917.19.21.42.4
MG1.10.7136.115.00.03.8
MF11.50.11.6305.10.0153.0
BU11.915.90.10.221.30.2
WB100.763.43.73.80.11879.7
EPP2018AL2309.2279.50.00.01.433.0
RSv569.91843.60.00.01.20.7
MG24.82.9189.429.70.013.9
MF29.83.00.1340.90.0206.7
BU8.314.00.00.020.80.1
WB58.593.80.20.30.21806.6
ADP2018AL2331.9280.20.00.01.433.2
RSv569.91844.90.00.01.20.7
MG9.91.2189.3160.50.052.5
MF21.82.70.0210.00.0168.3
BU8.314.00.00.020.80.1
WB58.793.80.30.30.21806.3
a Agricultural land, b Rural settlement with vegetation, c Mangrove forest, d Mudflat, e Built-up, f Water body.
Table 4. Changes of LULC, associated ESVs, food grain output, and potential food gaps in 2038.
LULC Scenarios LULC Type Changes during 2018–2038 (km2)ESVs Change (106 US$)Food Grain Production Reduced (million ton)Food Gap (%)
AL aRSv bMG cMF dBU eWB f
BAUD−211.17229.03−30.5192.6619.48−99.49−41.37−0.14−1.65
EDP−453.88368.06−32.82100.4025.88−7.62−16.38−0.30−10.21
EPP−379.22178.6570.98209.6219.45−99.4960.61−0.25−7.58
ADP−355.67179.95223.8231.9419.45−99.49130.95−0.23−6.75
a Agricultural land, b Rural settlement with vegetation, c Mangrove forest, d Mudflat, e Built-up, f Water body.

