Article

Tillage Intensity Effects on Soil Structure Indicators—A US Meta-Analysis

USDA-Agricultural Research Service, National Laboratory for Agriculture and the Environment, 1015 N. University Boulevard., Ames, IA 50011-3611, USA
*
Author to whom correspondence should be addressed.
Sustainability 2020, 12(5), 2071; https://doi.org/10.3390/su12052071
Submission received: 22 February 2020 / Revised: 3 March 2020 / Accepted: 3 March 2020 / Published: 8 March 2020
(This article belongs to the Section Sustainable Agriculture)

Abstract

:
Tillage intensity affects soil structure in many ways but the magnitude and type (+/−) of change depends on site-specific (e.g., soil type) and experimental details (crop rotation, study length, sampling depth, etc.). This meta-analysis examines published effects of chisel plowing (CP), no-tillage (NT) and perennial cropping systems (PER) relative to moldboard plowing (MP) on three soil structure indicators: wet aggregate stability (AS), bulk density (BD) and soil penetration resistance (PR). The data represents four depth increments (from 0 to >40-cm) in 295 studies from throughout the continental U.S. Overall, converting from MP to CP did not affect those soil structure indicators but reducing tillage intensity from MP to NT increased AS in the surface (<15-cm) and slightly decreased BD and PR below 25-cm. The largest positive effect of NT on AS was observed within Inceptisols and Entisols after a minimum of three years. Compared to MP, NT had a minimal effect on soil compaction indicators (BD and PR) but as expected, converting from MP to PER systems improved soil structure at all soil depths (0 to >40-cm). Among those three soil structure indicators, AS was the most sensitive to management practices; thus, it should be used as a physical indicator for overall soil health assessment. In addition, based on this national meta-analysis, we conclude that reducing tillage intensity improves soil structure, thus offering producers assurance those practices are feasible for crop production and that they will also help sustain soil resources.

1. Introduction

A healthy soil must be physically, nutritionally and biologically balanced. Soil physical health is intricately linked to soil structure which influences gaseous exchange, water retention and infiltration, root penetration and nutrient cycling. Soil structure also affects the susceptibility to erosion and microbial activity which influences soil biochemical processes including decomposition organic residues, C sequestration, N cycling and mitigation of anthropogenic pollutants [1,2,3].
Soil structure is defined by the arrangement of primary soil particles into secondary units (peds) that are characterized based on size, shape and grade. It also reflects the spatial arrangement of solids and voids which are the complementary aspects of the soil structure [4]. Several methods (i.e., indicators) can be used to assess soil structure. One of the most prominent is soil bulk density (BD), which does not require expertise or expensive equipment. It is used to estimate soil compaction and is negatively correlated with soil water and solute movement, aeration status and root growth [5,6]. Soil aggregate size and stability are also used to characterize soil structure because those indicators are correlated with several soil functions, including gas exchange and C sequestration through physical protection of soil organic matter (SOM) [4]. Aggregate stability (AS) provides a good indicator of soil erosion potential since reduced AS increases susceptibility to crusting and runoff while also reducing soil permeability to air, water and roots [7,8]. A third key indicator of soil structure is penetration resistance (PR) which is directly correlated with root growth [9].
The AS, BD and PR were endorsed by the “Soil Health Institute” (www.soilhealthinstitute.org) as effective Tier 1 indicators of soil health because they are responsive to soil and crop management strategies reflecting how well a soil is functioning for productivity or other societal needs. The endorsement reflected several years of scientific collaboration and is based on many studies showing that these indicators are sensitive to conservation practices including reduced tillage, use of cover crops and/or inclusion of perennials in crop rotations [10,11,12]. Perennial cropping systems have positive effects on soil structure and these indicators because they result in longer periods between tillage operations. Perennials also have stronger and deeper-growing roots than the annual crops which can alleviate soil compaction and improve AS [13,14]. The improvements reflect greater, stable supplies of root exudates and dying tissue that stimulate micro- and macro-biological activities [15], as well as better aeration and nutrient cycling. This was documented by a 4-year grass/clover or alfalfa study that increased soil C and N content, the number of biopores, AS and yield as compared to an annual cropping system [16]. Those authors also argued that perennial cropping has effects on soil structure that may substantially reduce yield losses in agricultural headlands. Another United States (U.S.) study showed that among 15 different annual cropping and perennial systems, soil quality, including physical indicators [17] was best beneath perennials.
Tillage, especially in temperate climates, is used to accelerate soil warming and water evaporation, incorporate surface materials, destroy weeds and temporarily improve soil physical conditions for plant establishment. However, excessive long-term tillage often degrades soil structure by decreasing AS, size and porosity, increasing subsoil compaction (i.e., formation of plow pans) and surface crusting which decreases infiltration and increases the potential for soil erosion [18]. This was demonstrated dramatically during the Dust Bowl (1930s) and ultimately led to the development of reduced- and no-tillage (NT) practices [19].
Reducing tillage intensity can help mitigate soil erosion and generally improves biological and physical soil health. If coupled with cropping system diversification NT can increase SOM, AS, biological activity, connectivity of soil pores and permeability [3,12,15,20,21,22]. However, those responses are not consistent as reflected in other studies that have reported soil structure degradation under NT. This includes finding higher BD and PR as well as lower permeability to air and water [8,23,24] which can restrict root development to the topsoil layer or create compacted subsurface (~7- to 20-cm) layers. Blanco-Canqui et al. [25] found that the water infiltration was greater in the soil under more intensive tillage (after moldboard plowing) as compared to NT, disk and chisel plow (CP). Furthermore, if NT results in subsurface soil compaction it may lead to reduced crop yield [26].
Systematic reviews followed by meta-analyses were used before to assess the response of soil health indicators (including soil structure indicators) to tillage intensity. However, most of those studies have used traditional pairwise meta-analysis (comparison of two tillage at the same time) and evaluated tillage effect within the topsoil layer. This study examines four tillage intensities (moldboard plowing (MP), chisel plowing (CP), no-tillage (NT) and perennial cropping (PER) systems) simultaneously on three soil structure indicators (AS, BD and PR) within four soil depth increments across the continental U.S. Our goals are to resolve conflicting conclusions regarding reduced tillage benefits on soil structure by evaluating a wide range of agronomic (e.g., cropping system), inherent (e.g., soil type, climate) and experimental (e.g., duration, sampling depth) factors.

2. Methods

2.1. Literature Search and Dataset Development

The Web of Science (WOS) developed by the Institute for Scientific Information (Thomas Reuters, New York) was used to search for agricultural field studies published between 1980 and 2018. The terms “soil health” or “soil quality” were combined with “cropping system” or “soil tillage” or “residue management” or “cover crop” or “crop rotation” or “soil fertility” or “fertilizer” and used as keywords. Full texts of the WOS selected literature were reviewed and selected references cited within those articles were searched by hand. The dataset development was part of the “Soil Management Assessment Framework meta-analysis for indicator interpretation and tool development for use by NRCS Conservation Planners” project conducted cooperatively between the USDA-Natural Resources Conservation Service (NRCS) and USDA-Agricultural Research Service (ARS). The dataset was compiled to assess the response of soil health indicators to agricultural management practices. Biological and chemical soil health indicators were considered within other studies and this study focuses on the analysis of structural soil health indicators.

2.2. Inclusion and Exclusion Criteria

To be included in the database, publications had to: 1) present soil health indicators from studies comparing multiple treatments such as tillage intensity, cropping system diversification (including perennial ecosystems); 2) be written in English; 3) be conducted in the U.S.; 4) be controlled (replicated) studies comparing different agricultural practices. We excluded: 1) duplications; 2) unpublished studies; 3) non-peer reviewed papers; and 4) studies presenting results only in graphs rather than in tables.

2.3. Treatments and Indicators Evaluated for This Study

A total of 456 articles covering most the U.S. (Figure 1) were identified. For this assessment, we restricted the database to studies quantifying MP (the most intensive tillage), CP (intermediate tillage intensity), NT (minimal soil disturbance) and PER (zero tillage intensity) systems and three indicators (AS, BD and PR) of soil structure (295 studies). Several tillage practices can be considered as having intermediate tillage intensity (e.g., CP, disk-harrow, strip-till) and these practices can vary mainly in terms of crop residue left on the soil surface and the depth of soil disturbance which may affect those soil structure indicators. Therefore, in this study, we considered only CP in order to keep the intermediate tillage intensity treatment more uniform. In contrast due to the limited number of studies, the PER group included perennial cropping systems and a few non-agricultural systems (e.g., native prairie and Conservation Reserve Program—CRP) that had various tillage intensities.
The indicators reflected wet aggregate stability (AS) measured using methods based on Kemper and Rosenau [27] and expressed in percent (%); core measurements (BD) expressed as (g cm−3); and the PR (MPa). The data were sorted and grouped based on factors known to moderate tillage intensity effects on soil structure indicators. This included: (1) the presence of a cover crop (yes or no), (2) soil order (Soil Taxonomy, USDA) (3) soil texture (i = sand, loamy sandy and sandy loam with < 8% clay; ii = sandy loam with > 8% clay, sandy clay loam and loam; iii = silt loam and silt; iv = sandy clay, clay loam, silty clay loam, silty clay and clay with < 60% clay; and v = clay with > 60% clay as defined by Quisenberry et al. [28]; (4) length of study (0 to 2-, 3 to 5-, 6 to 10- and > 10 years) and [5] sampling depth (top ≤ 15-cm; second > 15 to ≤ 25-cm; third >25 to ≤ 40-cm; and fourth > 40-cm).

2.4. Statistical Analyses

A descriptive statistical analysis followed by network and pairwise meta-analysis was conducted using the R statistical software [29]. Response ratio (RR) was used to determine effect sizes and standard deviation (SD) was the measure of variability. Effect size is commonly used in meta-analyses to standardize results by providing a summary of the magnitude and direction of treatment effects [30]. A RR was calculated for each tillage intensity (e.g., CP, NT, PER) and soil health indicator relative to MP. Several studies did not report the SD or the parameters needed to calculate it (e.g., standard error). Meta-analyses studies have handled missing variances in many ways with the predominant techniques being either algebraic manipulation of available information, imputation or study exclusion [31,32]. The latter technique is a very consistent approach but can result in fewer studies, thus decreasing analytical power of the analysis and/or leading to biased estimates. Herein, the missing SD was imputed for each study as 1/10 of the mean, as proposed by Luo et al. [33] and used by others e.g., Reference [34]. Furukawa et al. [35] also showed the utility of imputation to recover missing information and increase the precision of the overall effect. Similarly, Thiessen Philbrook et al. [36] found that the methods of imputing variance did not materially affect the conclusions. This was in agreement with Meurer et al. [34] who found using either the maximum value or 1/10 of the average value had no impact on conclusions regarding tillage practice effects on SOC stocks.
For each outcome in our study, a frequentist network meta-analysis (NMA) was conducted [37] using the R-package “netmeta” [38]. A separate NMA was conducted for each soil depth. All tillage intensity classes (CP, NT and PER) were compared against MP, which was considered the reference condition (most intensive tillage). A random effects model was used to compute the pooled relative effect of each tillage intensity because of the heterogeneity among studies. To test network heterogeneity, Cochran’s Q and Higgins’s I2 were calculated. Cochran’s Q is computed as a weighted sum of squared differences between single study effects and pooled effect across studies. Tillage ranking was determined using P-scores, which are based on the point estimates and standard errors of the frequentist NMA estimates under the normality assumption and can easily be calculated as the means of one-sided p-values [39]. In other words, P-scores reflect the mean extent of certainty that a treatment is better than the competing treatments.
Pairwise meta-analysis was also performed separately for the following pairs: CP vs MP, NT vs MP and PER vs MP, using the R package “metafor” [40]. Analyses were made with and without moderators using the rma and rma.mv functions within the “metafor” package. First, the data were plotted without moderators (a random model) and tested for heterogeneity. When significant heterogeneity existed (p < 0.05) various moderators (i.e., cover crop, experiment duration, texture, soil order and latitude) were added before testing again for residual heterogeneity. A unique code for each independent study was declared as a random factor. All models used maximum likelihood (ML) which has been shown to be appropriate for comparing like models [41]. When categorical moderators were significant, subgroup analyses were computed using coefficients from full moderated models. Heterogeneity was tested again with the moderators by calculating I2 and performing Cochran’s Q tests. To investigate the presence of publication bias in the data, we used funnel plots of effects size (RR) against the inverse of standard error and they were examined for asymmetry. Because such plots indicate how effect size and study precision are related, symmetric funnel shape in the scattering of individual observations is expected, with increasing scatter for less precise studies [42]. Where categorical moderators were significant (p < 0.05), a forest plot for these subgroup analyses was produced using coefficients from full moderated models. Where latitude (a continuous moderator) was significant, scatterplots for this meta-regression were produced using coefficients from full moderated models.
Pearson correlation tests were performed between all soil physical indicators RR, considering the results from all soil depths and separately only for the topsoil layer. For these analyses, we included the soil organic C response ratio even though it was not included in the meta-analysis because it is being considered in an analysis of soil biological health indicators.

3. Results

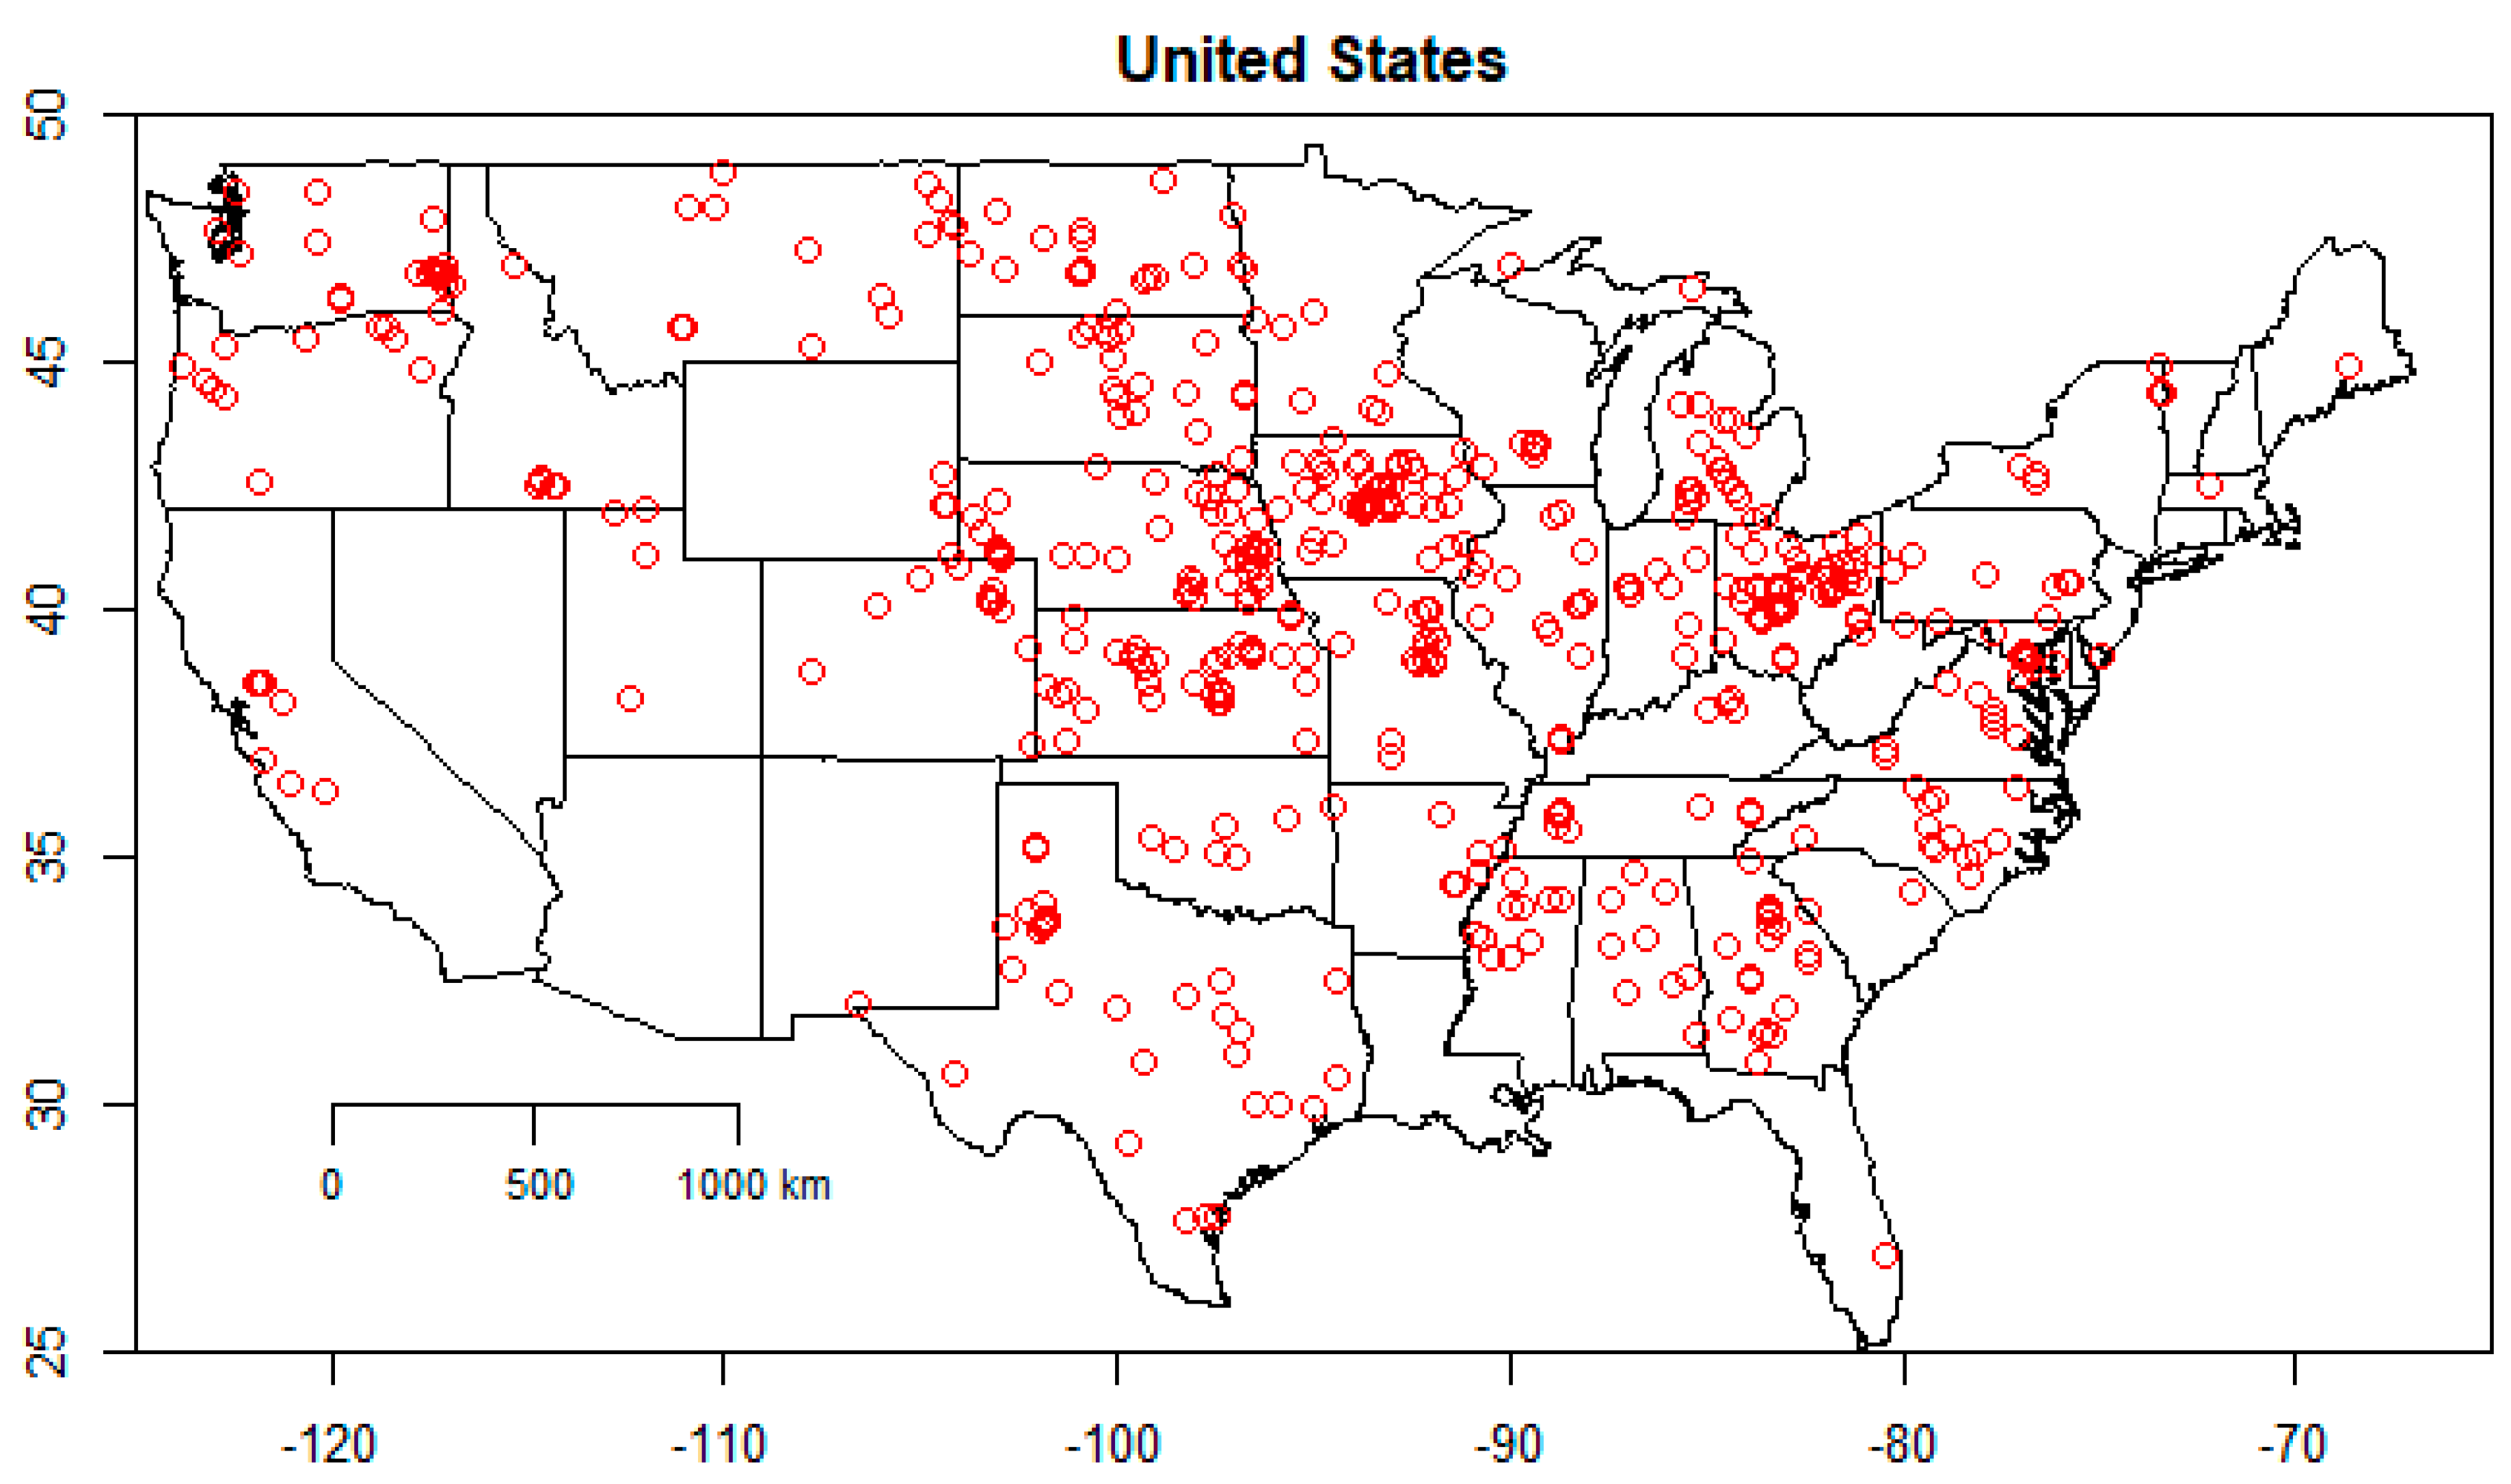
3.1. Descriptive Analysis

Table 1 summarizes the dataset used to quantify tillage intensity effects on three soil structure indicators. Summed over all depth increments, NT had the highest number of entries (n = 910), followed by MP (n = 749), CP (n = 382) and PER systems (n = 289). The indicator measured most often was BD (n = 1713), followed by AS (n = 457) and PR (n = 160). Among depth increments, topsoil (<15 cm) was sampled most often (n = 1227), followed by 15- to <25-cm (n = 625), 25- to <40-cm (n = 326) and ≥40-cm (n = 152). The descriptive analysis showed that mean values for soils under PER were highest for AS and lowest for BD. Mean values under NT were second highest for AS and highest for BD and PR. Meanwhile, MP tended to have the lowest AS means and the second lowest BD and PR means (Table 1).

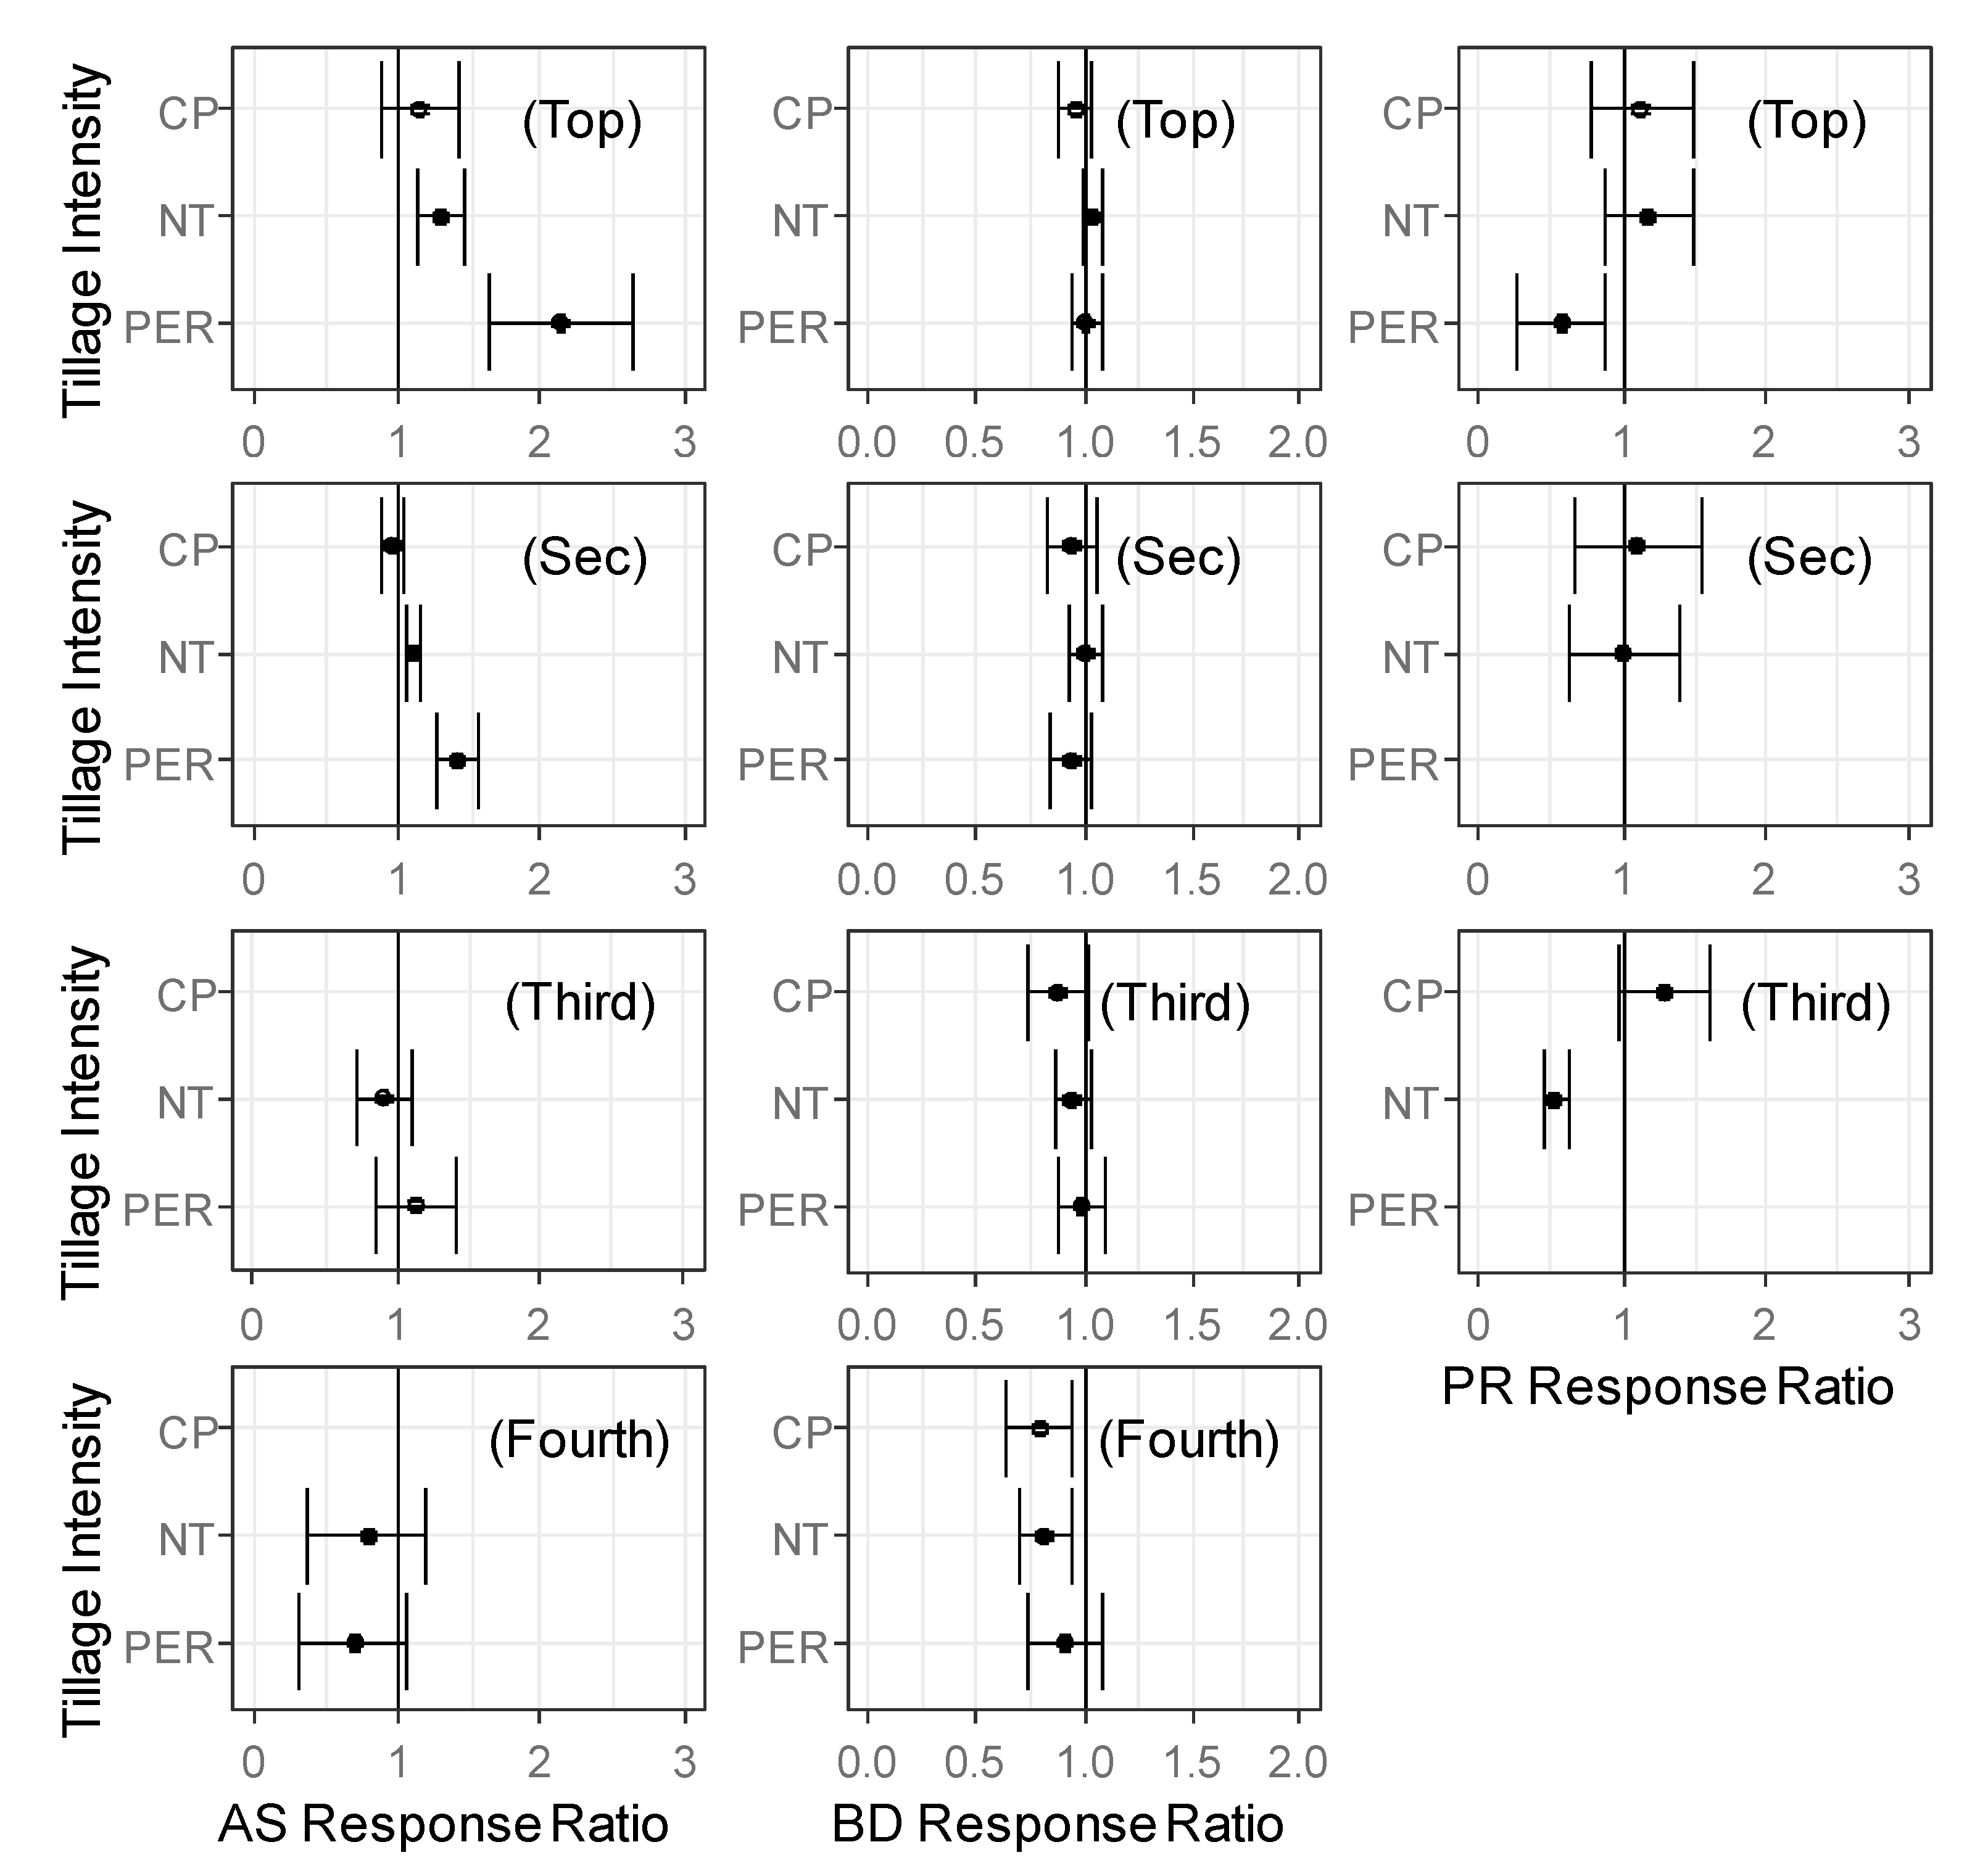
3.2. Network Meta-Analysis (NMA)

The NMA results suggest that reducing tillage intensity from MP to CP had minimal effect on soil structure since only BD within the fourth soil depth was increased (Figure 2). Compared to MP, NT soils had AS means that were 1.3 and 1.1 times higher in the surface (<15-cm) and second (15- to 25-cm) depth increments, respectively. PR below 25-cm and BD below 40-cm deep were significantly lower for NT compared to MP (Figure 2). Relative to MP, AS was 2.13 times higher and PR was 0.6 times lower in the topsoil under PER systems, while AS was 1.42 times greater from 15- to 25-cm. Due to insufficient data, AS within the third and fourth depths under CP and MP were not compared and NMA for PR within the fourth depth was not performed (Table 1). Ranking of P-scores confirmed that PER systems improved AS the most, followed by NT, CP and MP (Table 2). This analysis also showed that NT was most likely to increase BD within the top and the second depths and to increase PR within the topsoil. Additional NMA documentation for the three soil physical indicators are presented in Supplemental Figures S1, S3 and S5. Also, the net “hot spots” indicated no inconsistencies in the network, independent of soil depth (Supplemental Figures S2, S4 and S6).

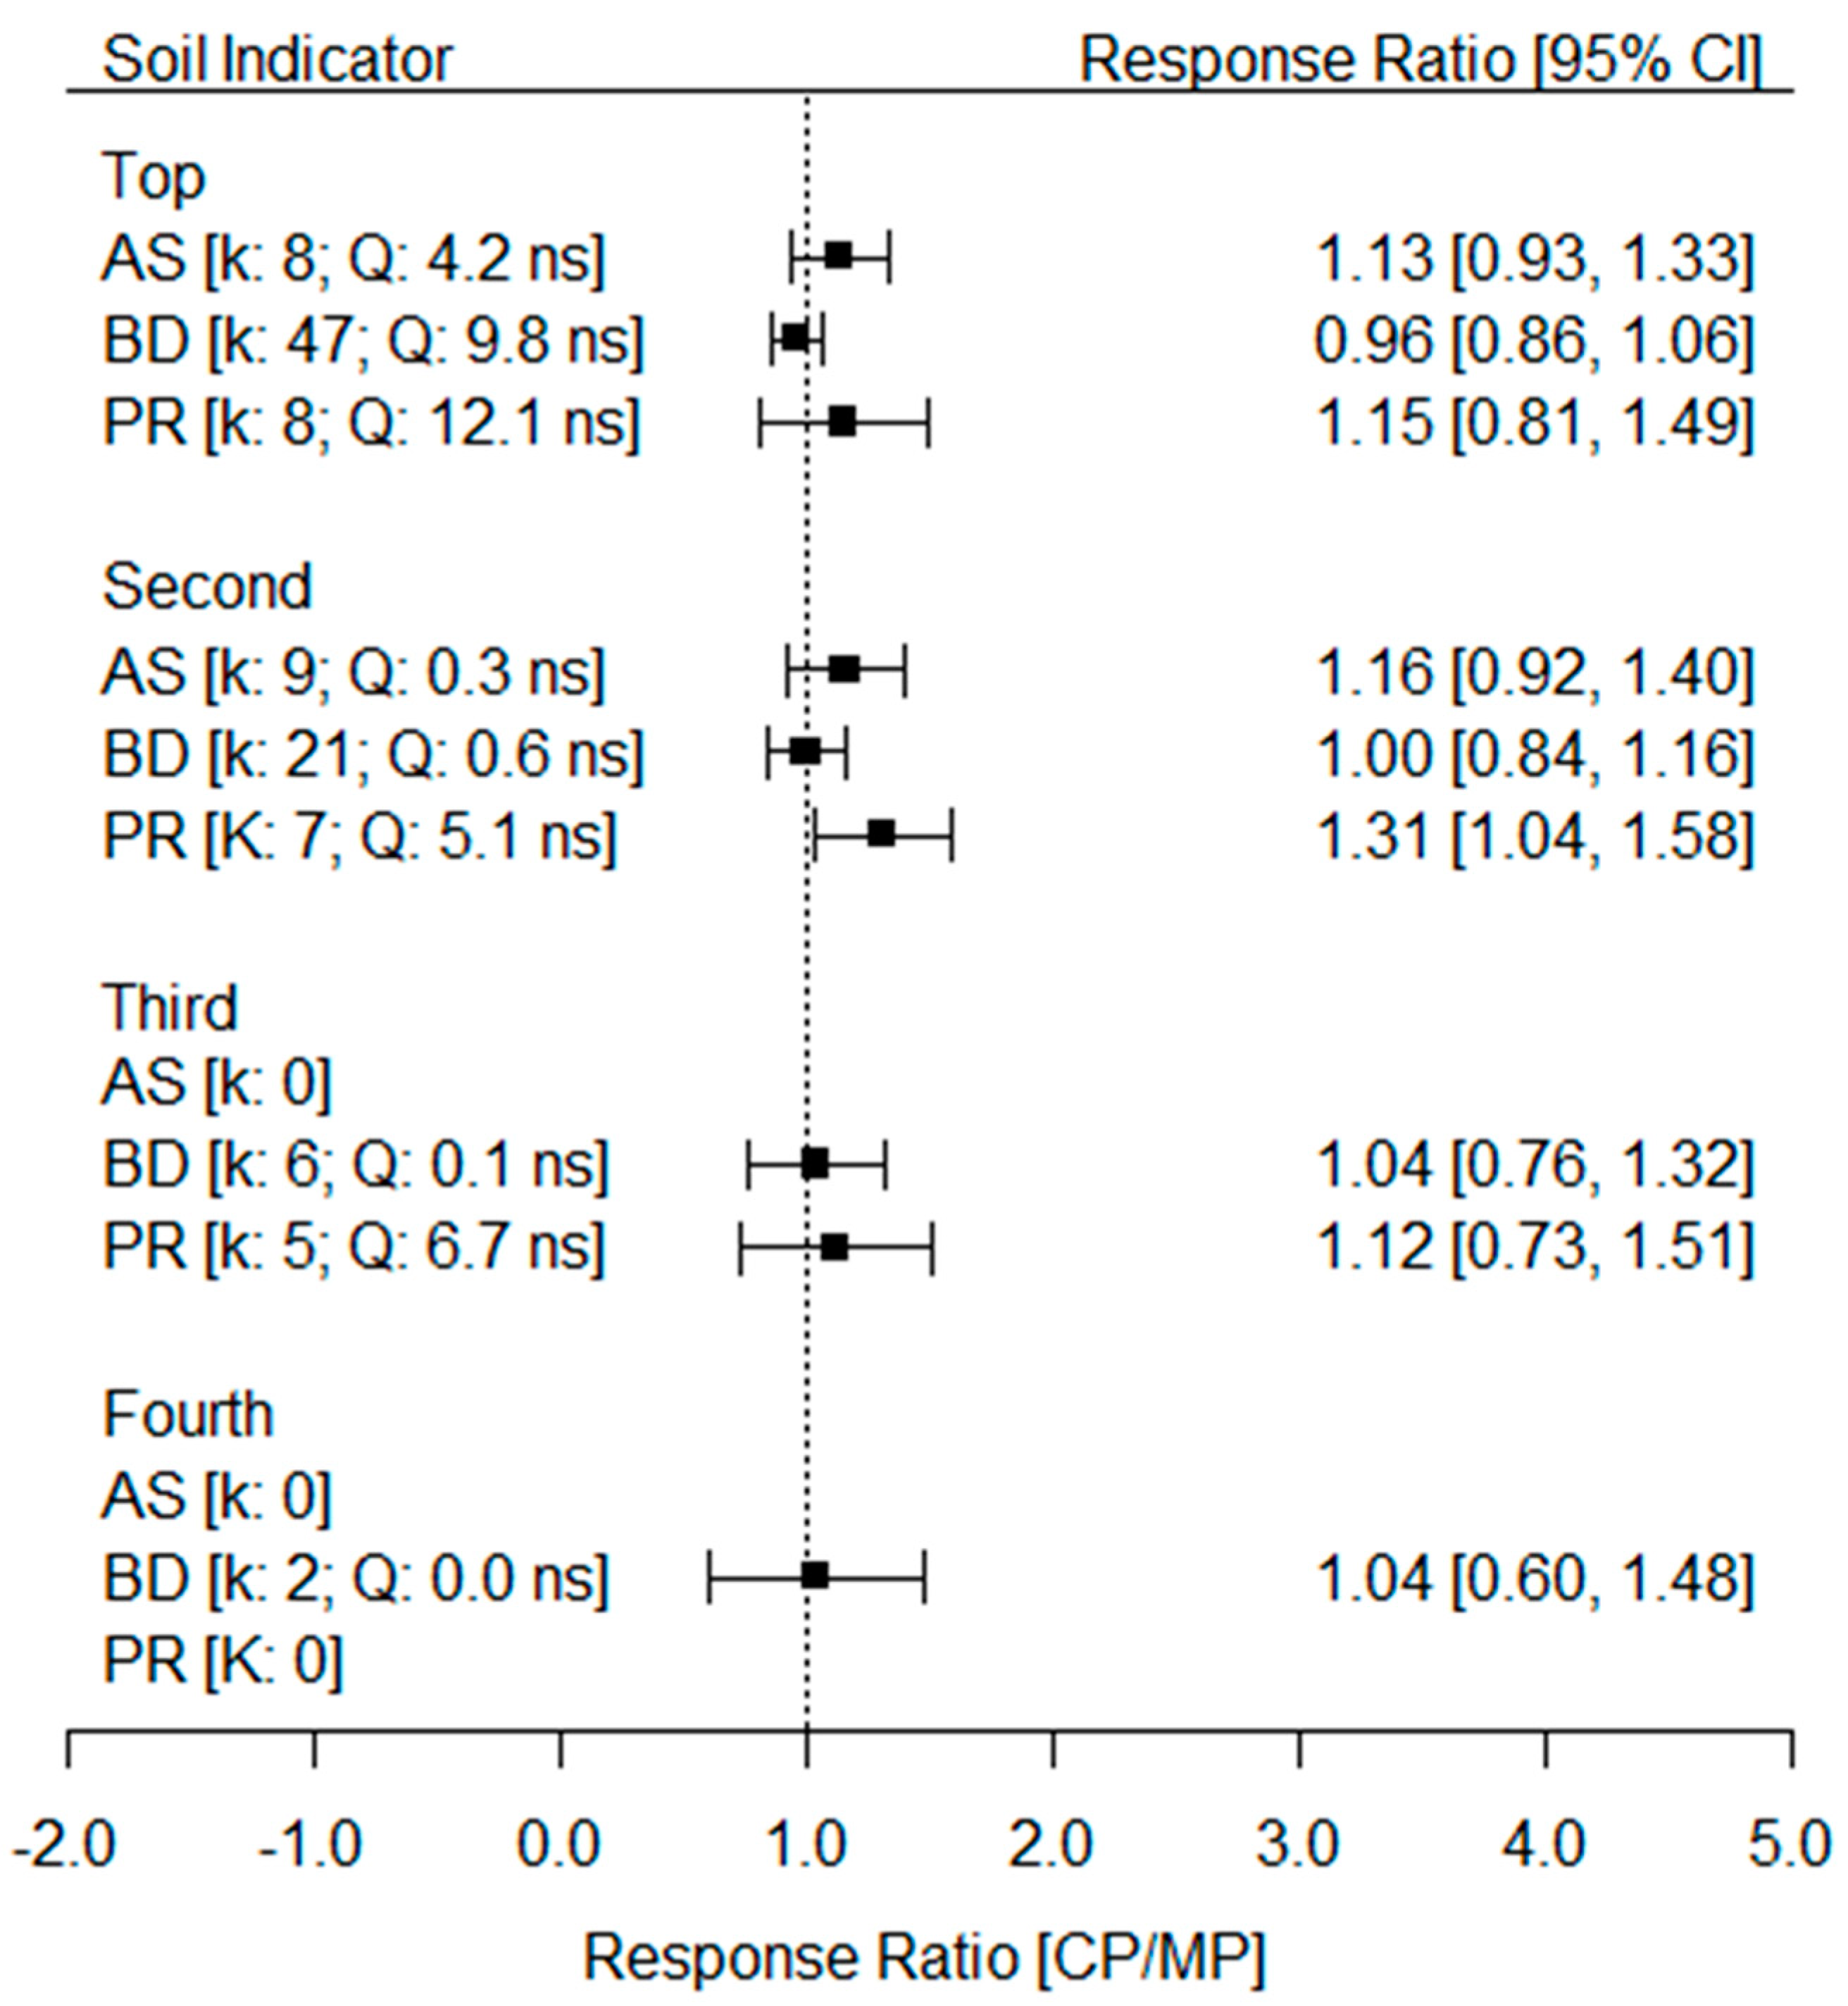
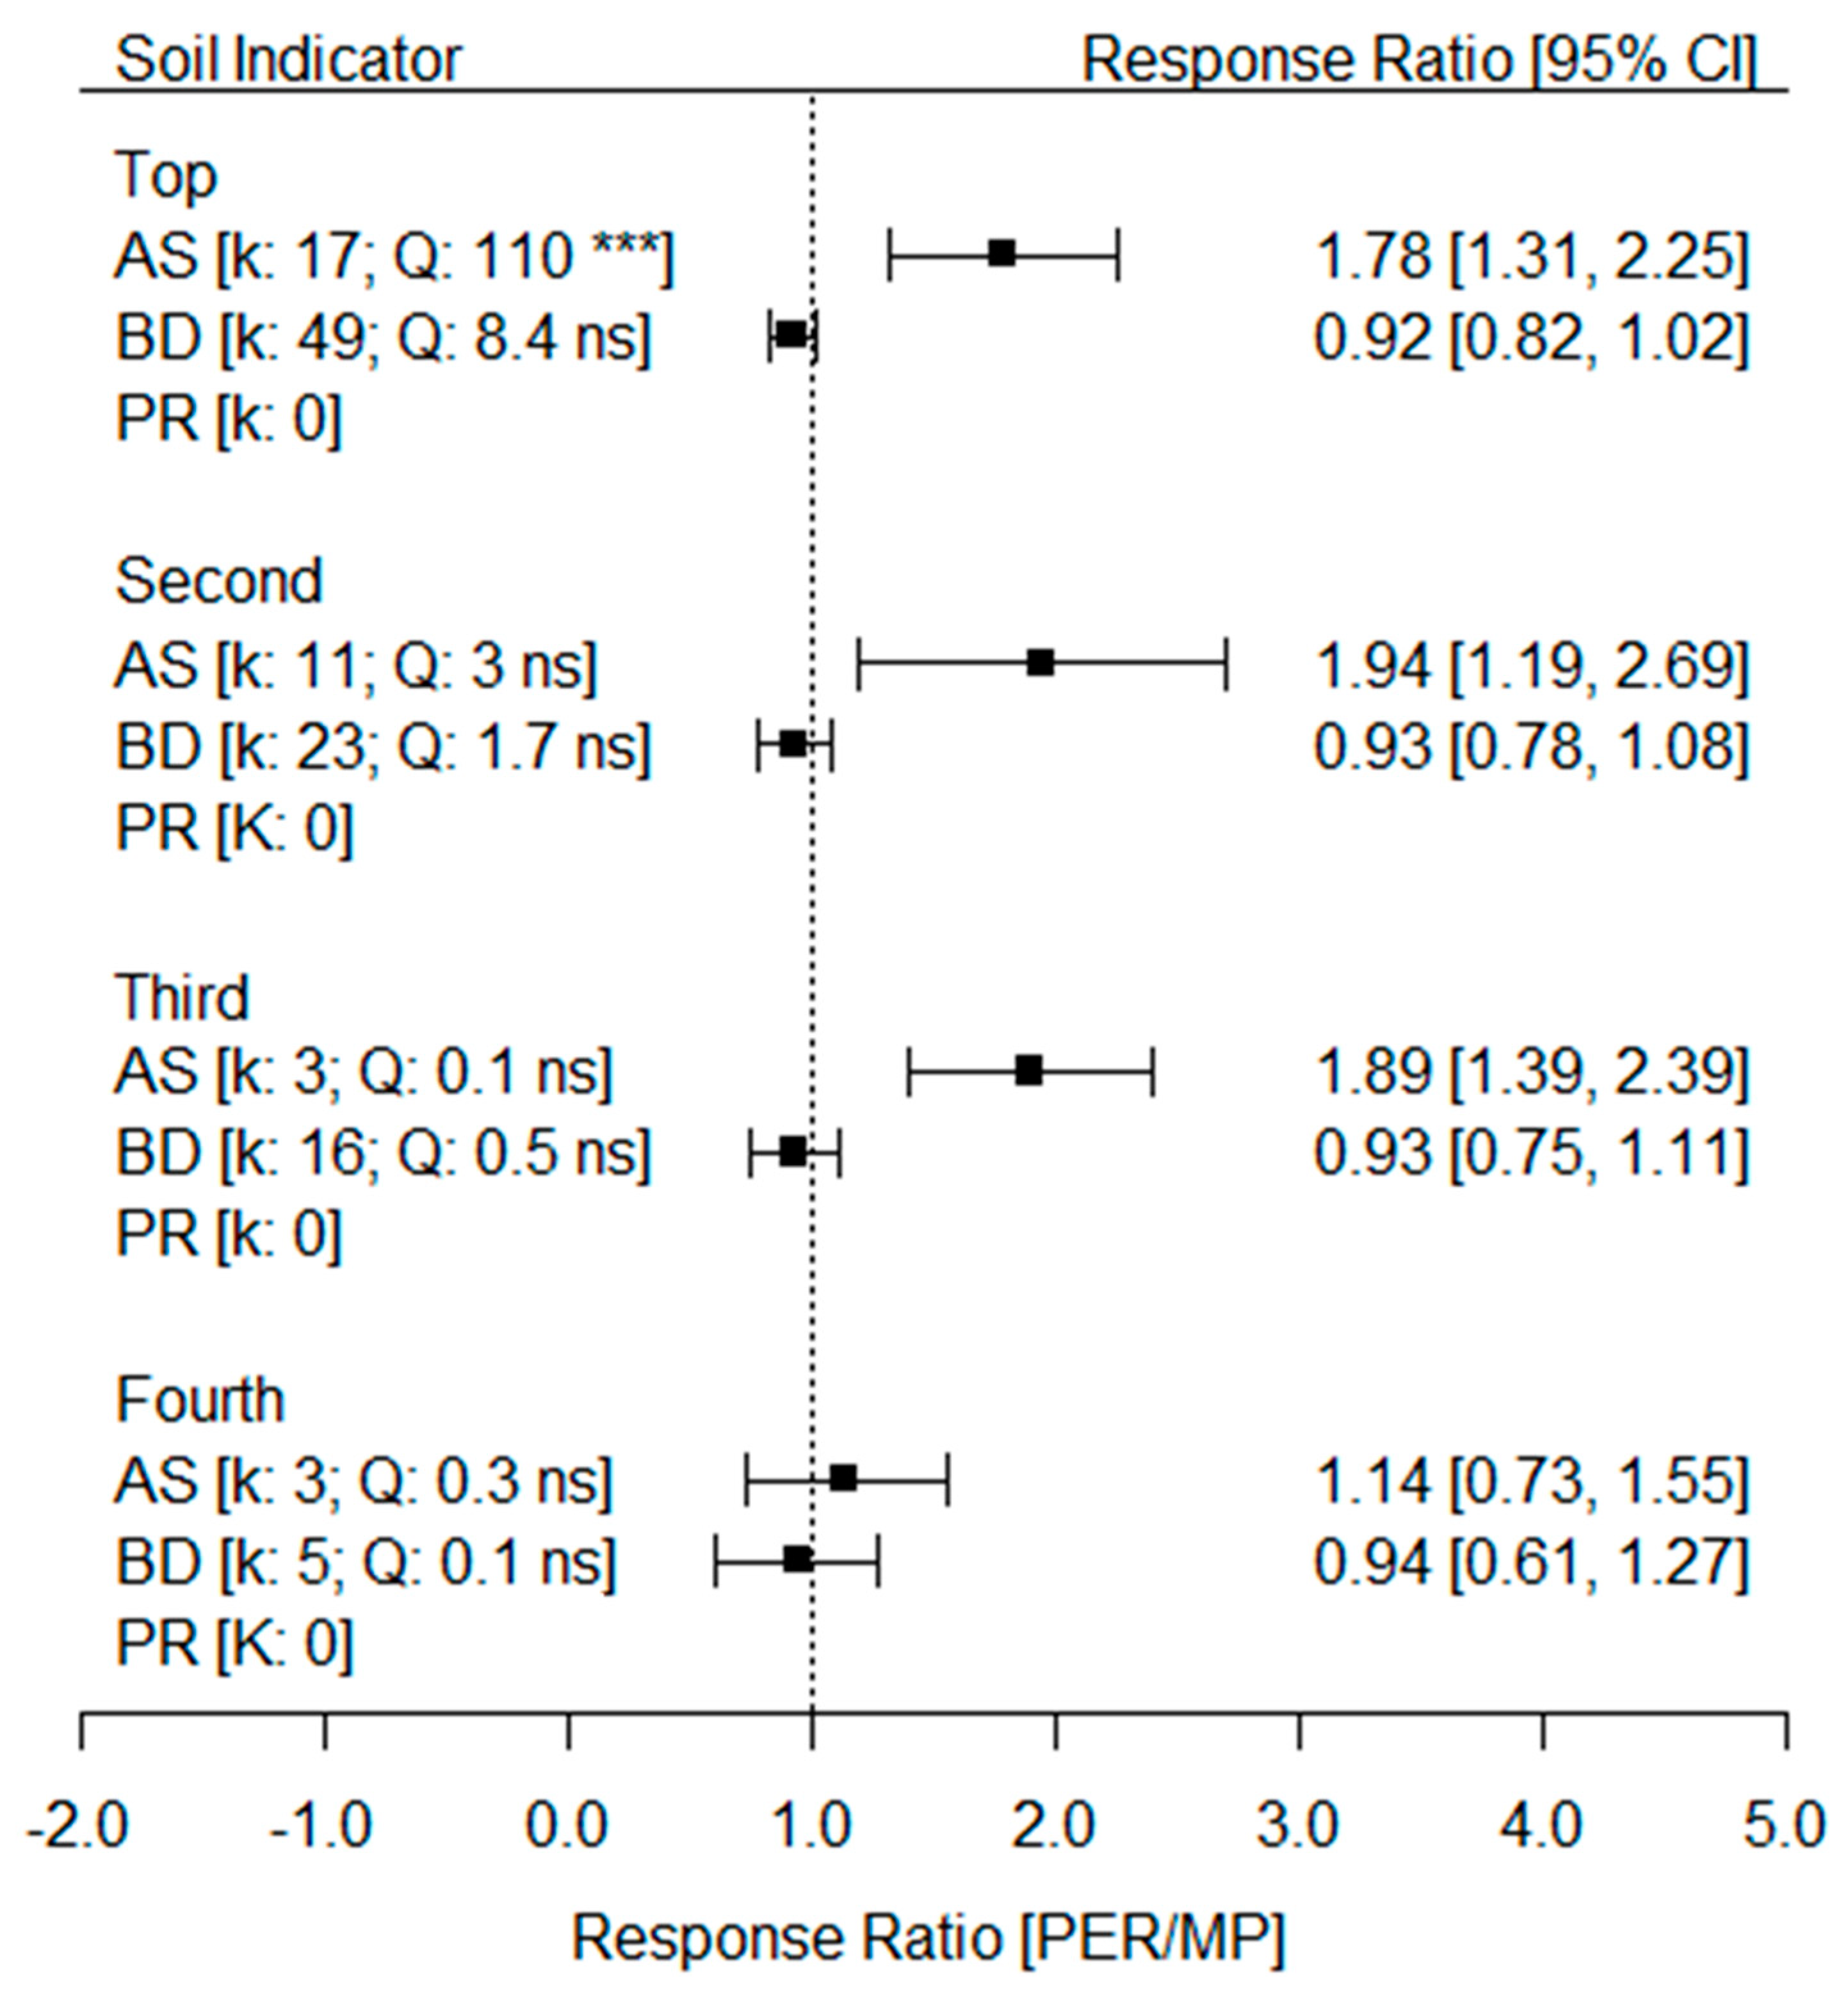
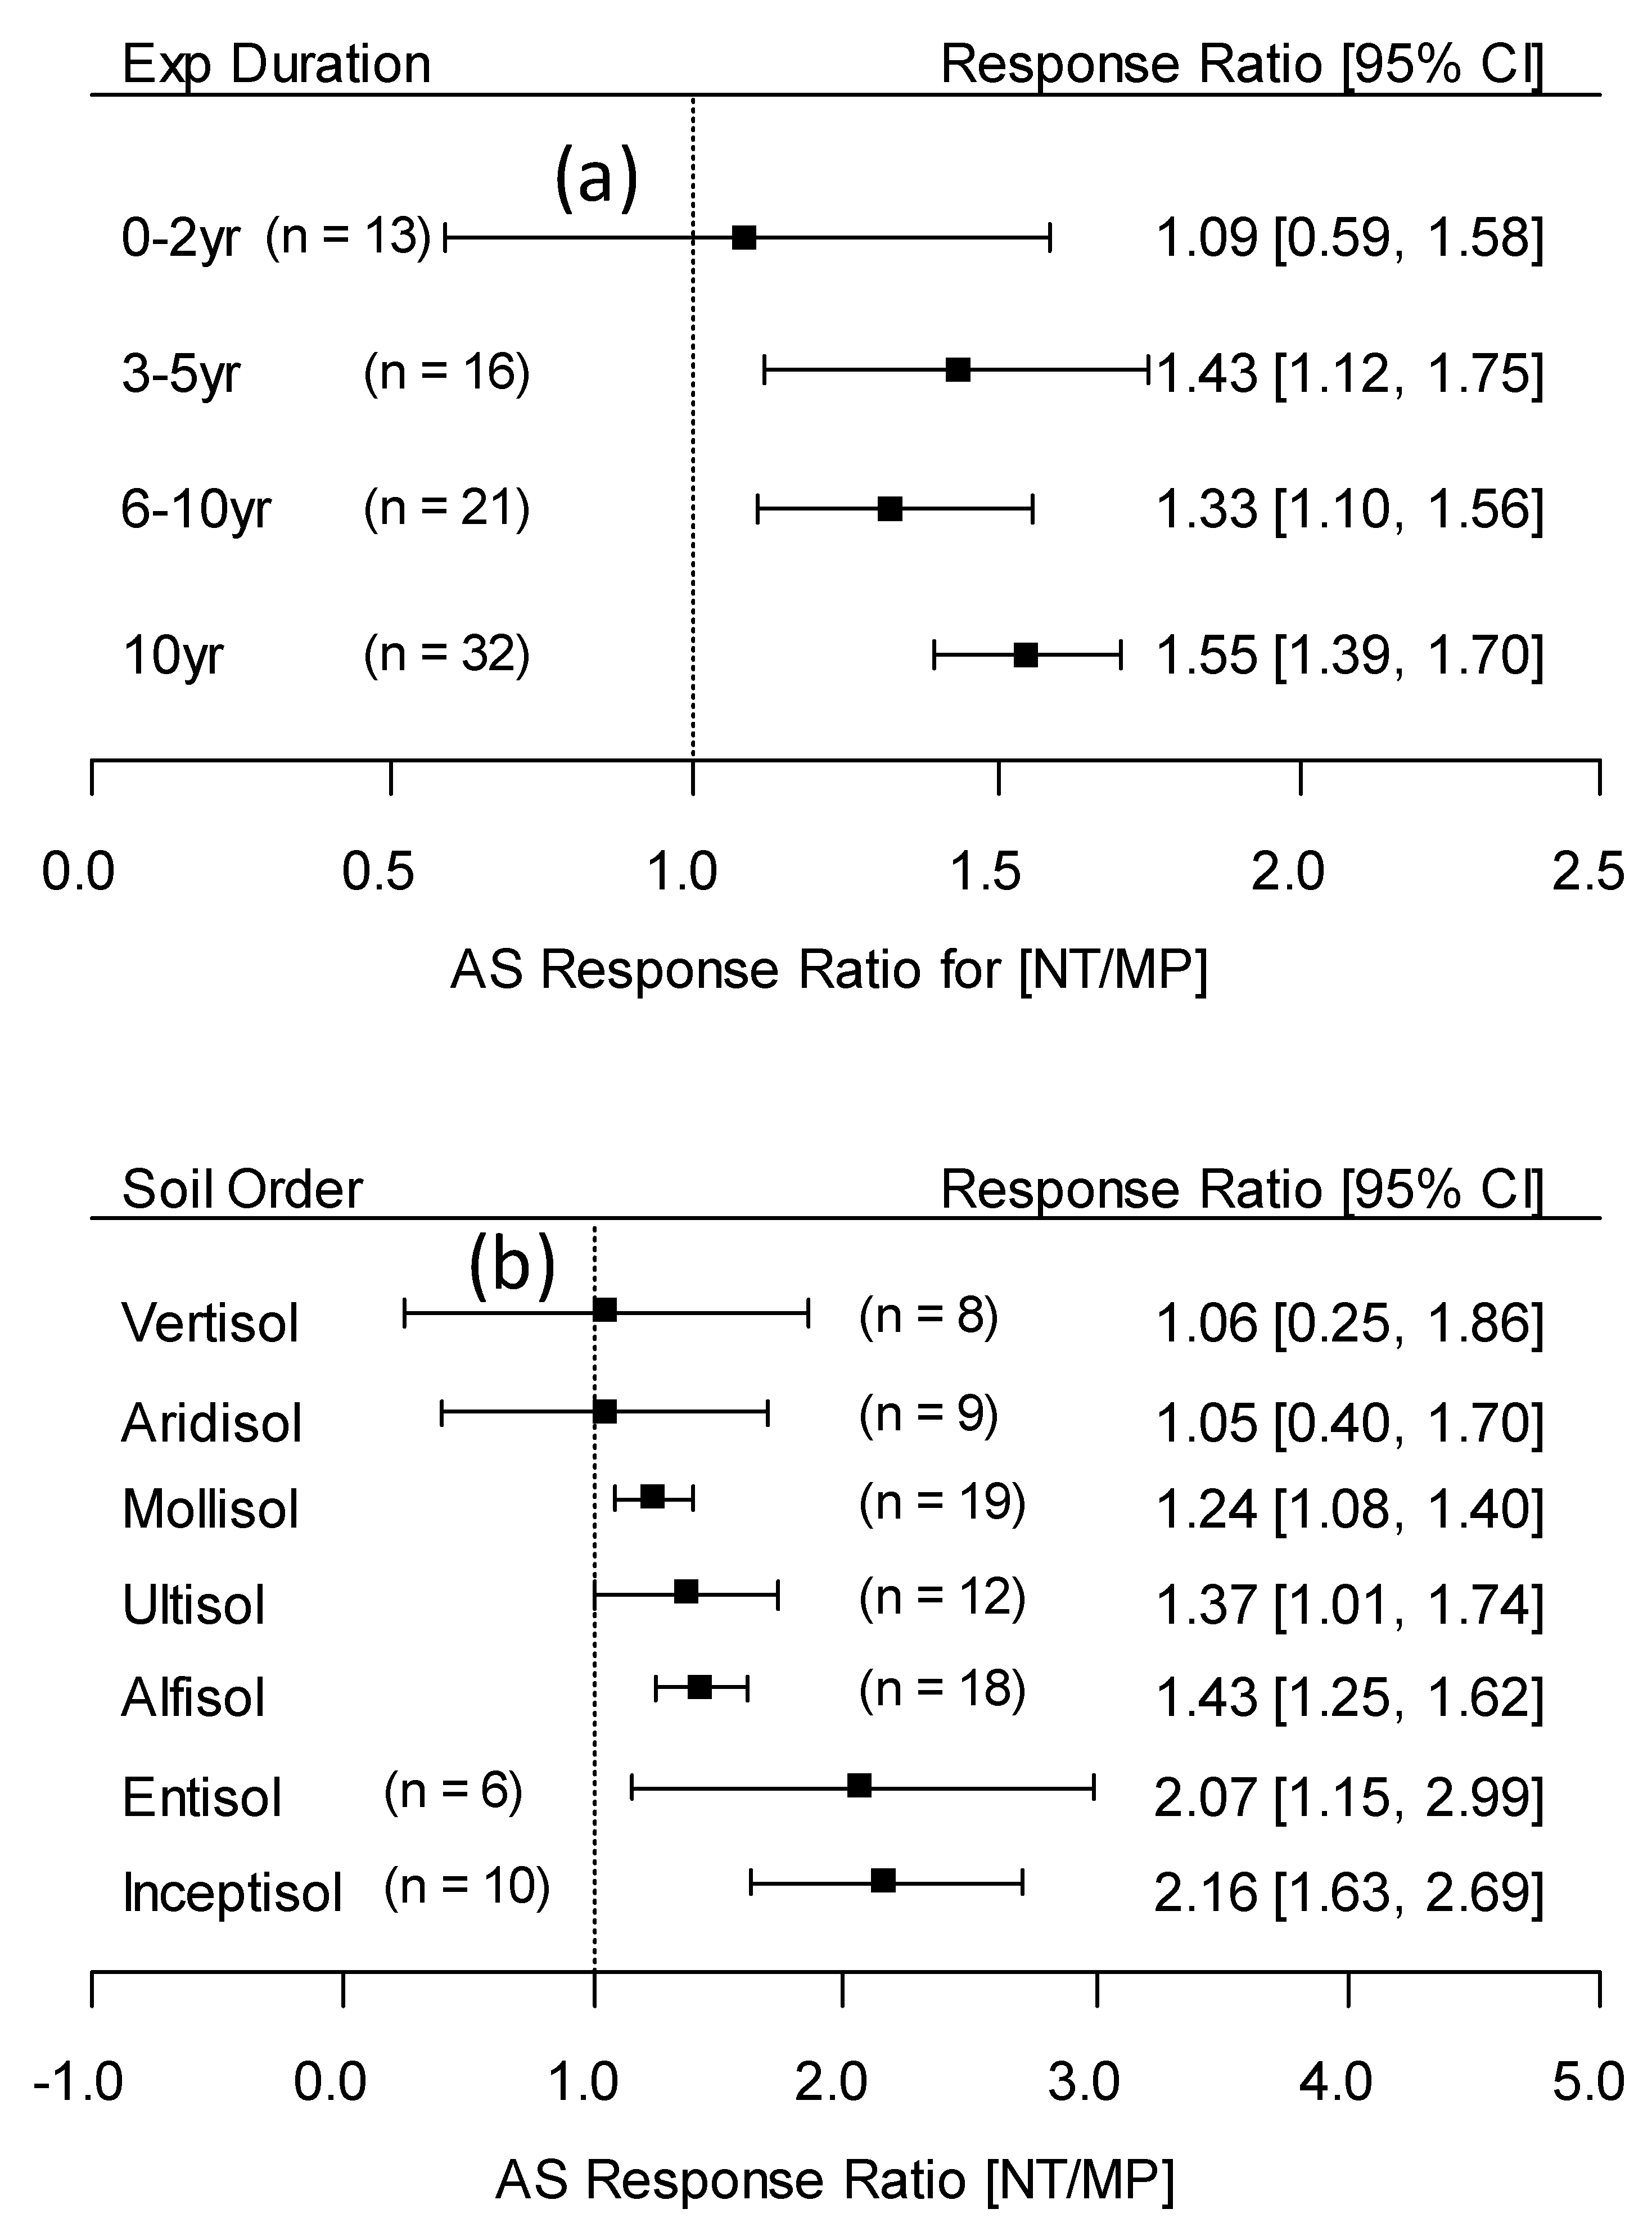
3.3. Pairwise Meta-Analysis (PMA)

PMA generally confirmed the NMA results showing that overall differences between CP and MP were non-significant. The only exception was a higher PR (RR = 1.31) within the 15- to 25-cm depth increment of CP (Figure 3). Compared to MP, NT soils had significantly higher AS within the top (RR = 1.19) and second (RR = 1.21) depth increments but not below 25 cm (Figure 4). Independent of soil depth, there was no significant BD difference between NT and MP practices. For PR, the only significant difference between NT and MP was within the topsoil, where NT had higher values (RR = 1.44) than MP. As expected, the PER system had significantly higher AS within the top (RR = 1.78), second (RR = 1.94) and third (RR = 1.14) depth increments when compared to MP (Figure 5). There were no differences below 40 cm. Also, independent of soil depth, BD showed no significant difference between PER and MP treatments.
Between NT and MP, there was significant heterogeneity in the model without moderators for topsoil AS and for PR within the third soil depth. Factors that moderated topsoil AS response to NT in relation to MP were study duration and soil order. Figure 6a shows the duration effect and suggests that more than two years are necessary for NT to increase AS relative to MP. Figure 6b shows soil order effects on topsoil AS response ratio for NT relative to MP. Generally, Inceptisols, Entisols, Alfisols, Ultisols and Mollisols showed the greatest NT effects. Heterogeneity decreased from 176 (without moderators) to 98 with the inclusion of the significant moderators in the model but this value was still significant (p-value = 0.035) indicating topsoil AS response to NT when compared to MP can be affected by other factors not considered in this study. Significant heterogeneity was also observed for PR within the third soil depth for NT vs. MP comparisons and for topsoil AS for PER vs. MP comparisons. We did not test for moderator’s significance due to the low number of observations, although (we have considered at least 10 observations for each moderator).

3.4. Publication Bias

Publication bias was not detected through funnel plots of RR against a measurement of study variability (i.e., inverse of standard error). Individual RRs were symmetrically distributed around the mean effect size.

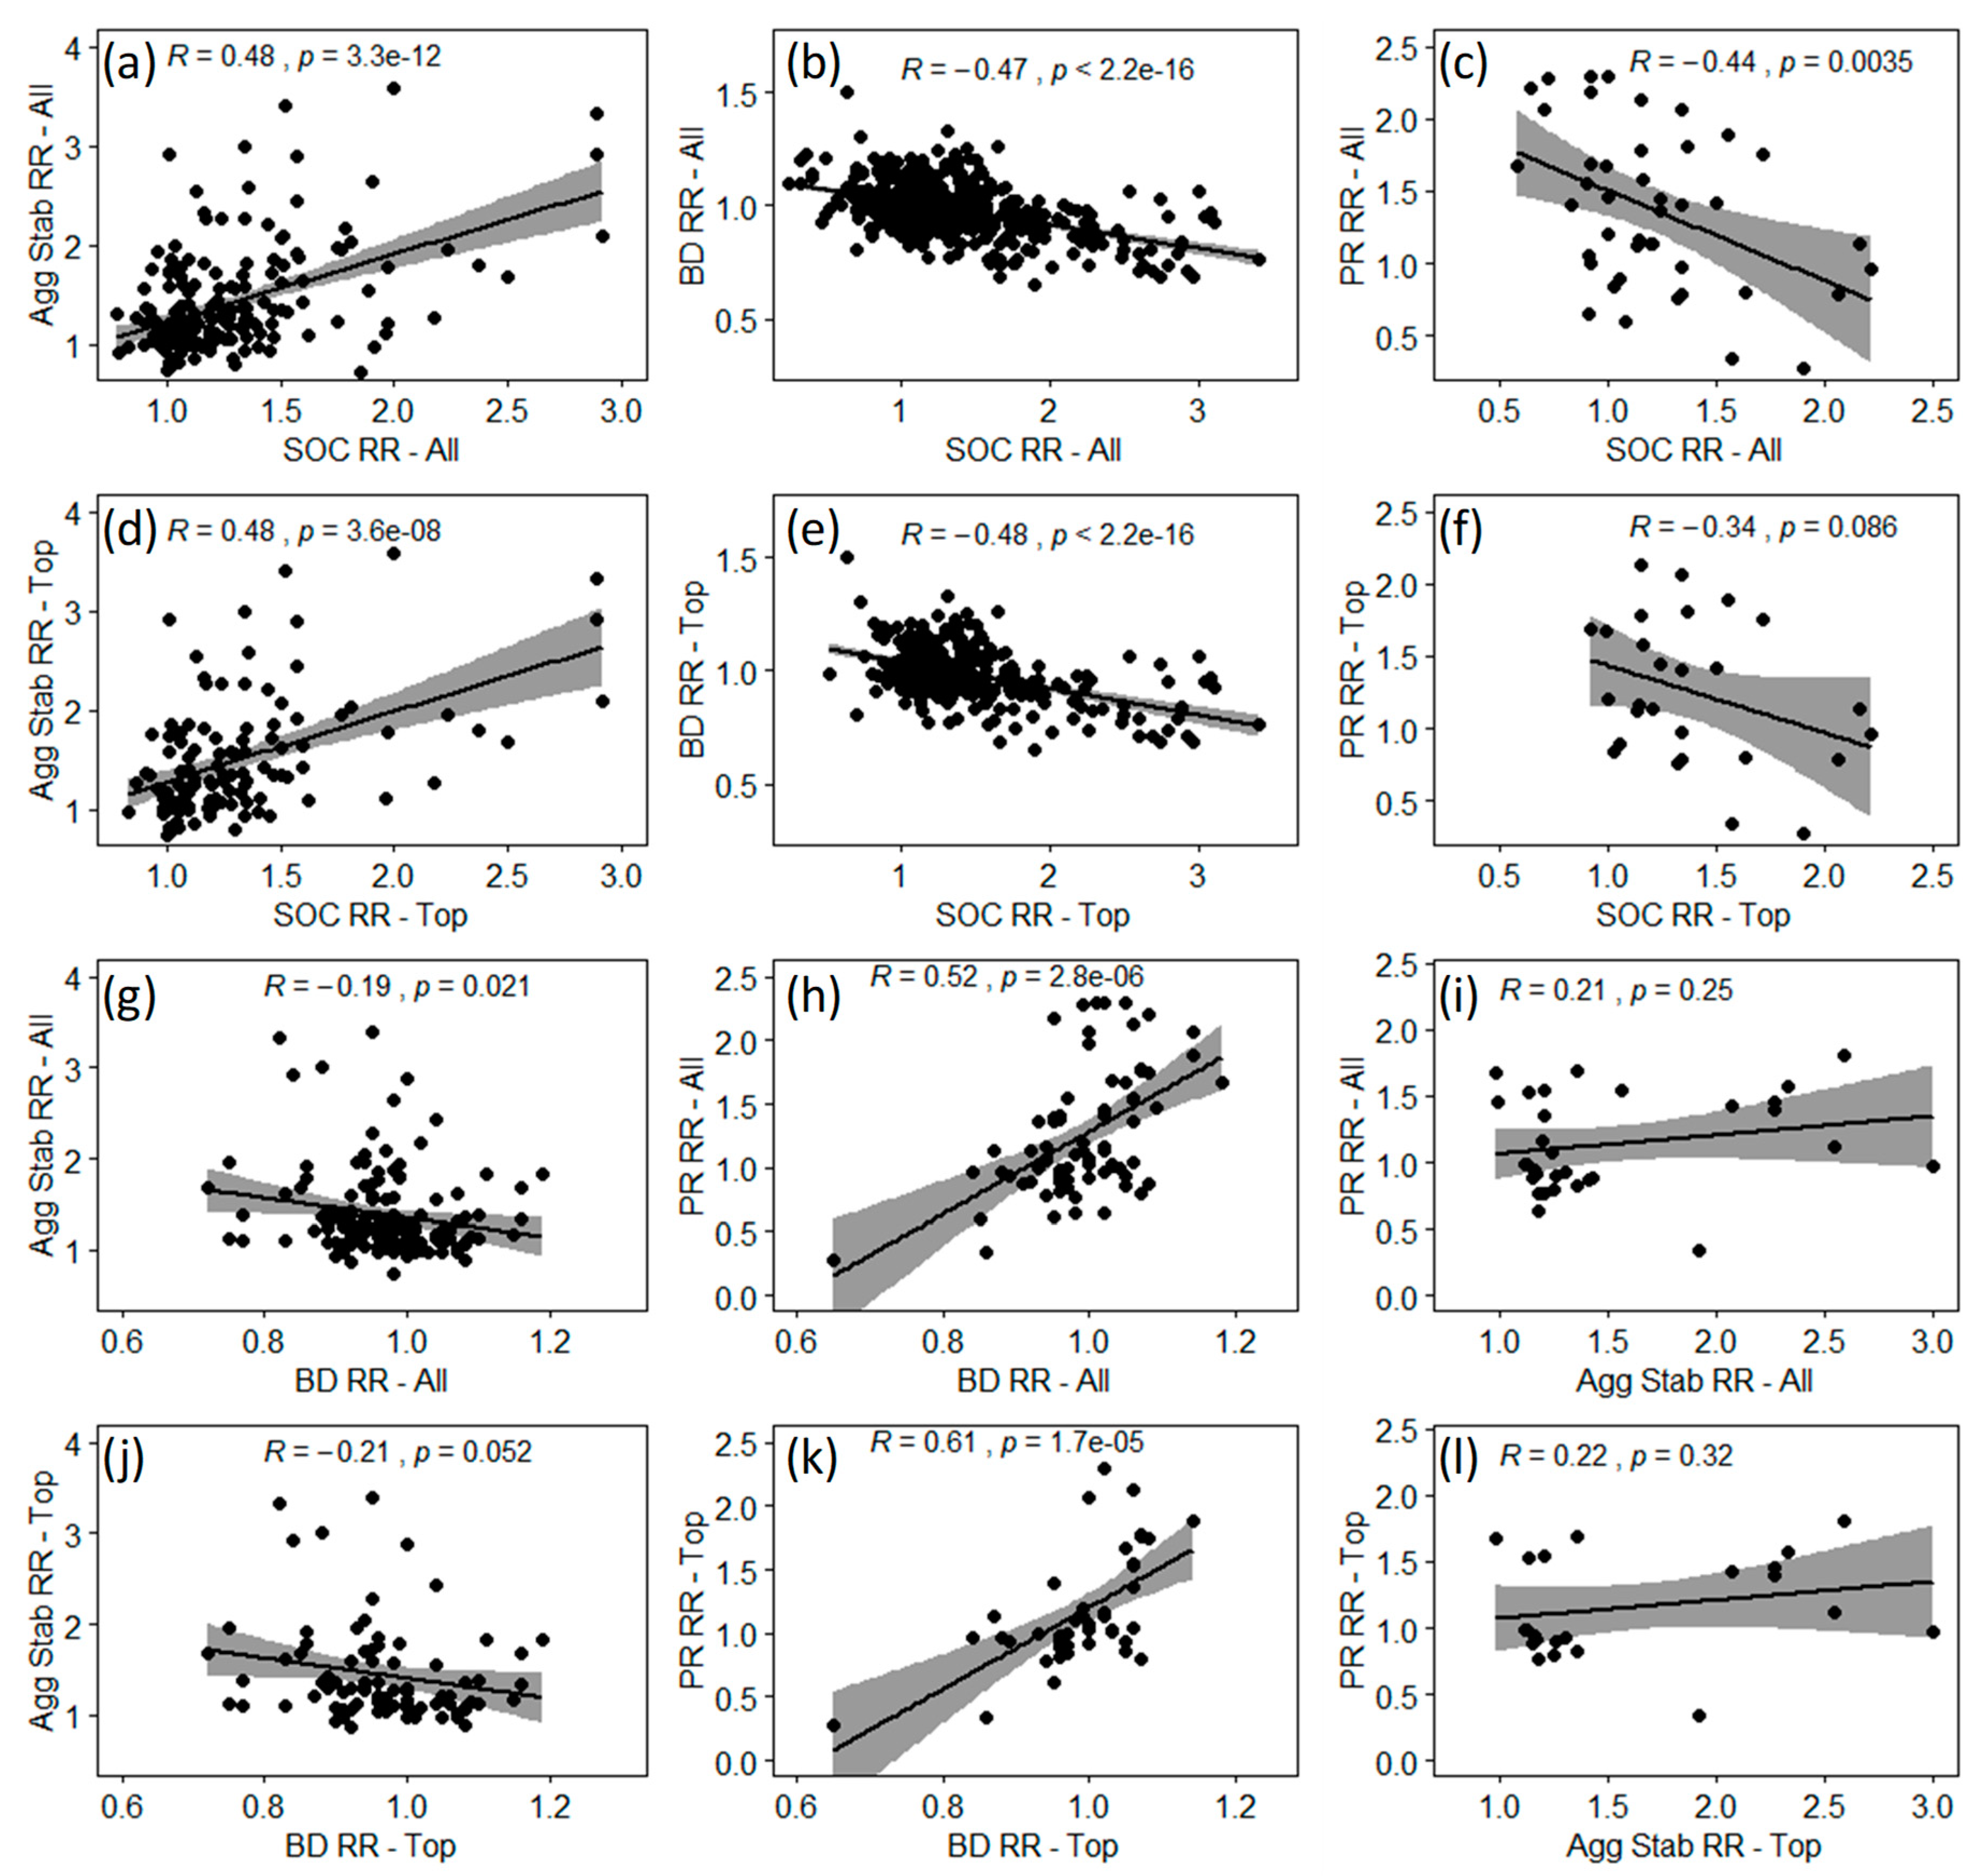
3.5. Pearson Correlation

Evaluations for the topsoil alone or across all depth increments showed significant, positive correlations between SOC and AS response ratios and for BD and PR response ratios (Figure 7). Significant, negative correlations were found between SOC and BD response ratios and for SOC and PR response ratios when averaged across all depths. For response ratio correlations between BD or AS and SOC, values were significant and negative for topsoil comparisons or when averaged across all soil depths (Figure 7).

4. Discussion

A first step toward advancing societal goals for food security and environmental sustainability is identifying the impacts of agricultural practices on soil health, including physical soil health [43]. Intensive tillage promotes soil degradation by increasing subsoil compaction (PR), decreasing topsoil AS and promoting surface crusting, leading to lower crop yield and greater water and wind erosion [44]. Furthermore, compared to NT, intensively tilled soils are more susceptible to soil compaction [45,46], often because of erosion and oxidation of SOM coupled with the cumulative load effect of the soil tillage implements used and the traffic in the area which created the so-called plow pan.
Reduced tillage practices such as CP, fracture only the topsoil and preserve more surface residue. Therefore, CP is considered a conservation tillage practice that can improve soil health, but CP effects are not consistent. Positive responses were reported by Carter [47] who found CP increased soil aggregation compared to MP. Alam et al. [48] also reported higher available water content and greater root mass density for CP than NT. Other studies, however, reported negative effects of CP on soil structure indicators. For example, Blanco-Canqui and Ruis [49] found CP decreased aggregate stability compared to NT. They concluded that even slight soil disturbances can adversely affect soil structural stability. Nunes et al. [6] also reported negative effects of this practice concluding that CP affected soil structure indicators (including AS and compressive properties) and made the soil more vulnerable to fresh soil compaction. This meta-analysis study showed that independent of soil depth, simply reducing tillage intensity from MP to CP did not improve the three soil structure indicators across the continental U.S. (Figure 2 and Figure 3).
Converting from MP to NT clearly increased AS within the topsoil layers (between 0 and 25-cm; Figure 2 and Figure 4) and reduced both PR and BD below that soil depth (Figure 2). These results suggest that soils under NT systems are more resistant to soil erosion by water and wind and have better soil physical quality for crop growth than soils under MP systems. A major concern among producers regarding reduced tillage intensity from MP to NT is the risk of increased soil compaction which is usually indicated by higher BD and PR values. Indeed, studies have shown that long-term NT practiced without other soil enhancing practices (e.g., permanent soil cover or crop diversification) can develop compacted layers (e.g., from 7- to 20-cm) below the surface. This can reduce soil hydraulic conductivity and aeration while increasing BD and hardness [8,23,24]. Compacted layers can also restrict root growth, reduce rooting volume and water infiltration [8,50,51] and increase runoff and/or erosion, thus contributing to environmental pollution. However, this meta-analysis results indicated that adoption of NT did not result in severe soil compaction compared to MP. The only exception was the topsoil PR which was 1.19 times higher under NT than MP (Figure 4).
Accumulation of crop residues at or near the soil surface and the subsequent increases in SOM and aggregation are factors that reduce soil compaction (e.g., BD and PR) under NT, since those soil properties are negatively correlated (Figure 7). Increased biological activity near the soil surface under NT may also help mitigate compaction. Blanco-Canqui and Ruis [49] showed that converting from MP to NT improved topsoil AS by maintaining crop residue on the soil surface, reducing soil disturbance, mitigating near surface soil temperature fluctuations and reducing the frequency and magnitude of wet-dry and freeze-thaw cycles. Similarly, Sharma et al. [52] and Das et al. [53] reported NT increased topsoil SOM and biological activity which improved both formation and preservation of soil aggregates [3]. The absence of severe topsoil compaction under NT can also be attributed to the cumulative effect of shanks attached to NT seeders which penetrate to a depth of approximately 10-cm and can disrupt near-surface soil compaction [54,55]; and to a rearrangement of soil particles and aggregates by several near-surface soil processes and decreased traffic-induced compaction. Mitigation by natural wet-dry or freeze-thaw cycles [56] occurs because those processes improve soil porosity and air permeability after mechanical stress [57,58]. Therefore, in the long-term, NT may mitigate plow pan compaction through bioturbation, soil C translocation to deeper layers and use of deep-rooted cover crops and thus create better soil physical conditions at deeper soil depths when compared to MP (Figure 2).
Crops planted into very loose soil may grow poorly due to poor establishment [59]. Therefore, a slight amount of compaction is not always bad, since it can improve soil-root contact and moderate energy fluxes [60]. From the perspective of soil physical health (i.e., structure) implementing NT practices can reduce soil erosion, increase air, water and plant root permeability, recycle and protect C and nutrients and enhance biotransformation of organic pollutants [1,2].
The meta-analysis also showed increased profile AS under PER systems as compared to MP (Figure 2 and Figure 5). Positive effects of long-term PER systems reflect improved soil structure due to larger and expanded root systems which increase root biomass and ensure a continuous supply of organic materials, root exudates, nutrients and oxygen that stimulates profile soil biological activity [13,14,61,62]. According to Jastrow et al. [63], roots provide large belowground C sources known to affect microbial community structure and soil organic C content, hence affecting soil structure. PER systems also provide longer periods of soil rest and soil cover between tillage operations, thus avoiding mechanical disruption of soil aggregates. Therefore, compared to annual row cropping systems, PER system improvements to soil structure have been repeatedly reported around the world (i.e., References [16,17,64]).
Finally, our analysis confirmed that site-specific factors underpin soil structure responses to tillage intensity. Soil order and experimental duration significantly moderate topsoil AS response. Compared to MP, the greatest positive effect of adopting NT on AS was noted for Inceptisols (RR = 2.16), Entisols (RR = 2.07), Alfisols (RR = 1.46), Ultisols (RR = 1.37) and Mollisols (1.24), while for Aridisols and Vertisols the response of NT relative to MP was not significant (Figure 6b). Furthermore, the AS response to NT adoption was enhanced by long-term management. This means that three or more years under NT will most likely be necessary to improve topsoil AS as compared to MP, with the largest effects requiring 10 years or more to be achieved (Figure 6a).

5. Conclusions

This national meta-analysis confirmed that reducing tillage intensity can significantly improve soil structure within U.S. farmlands. The manganite of improvement, however, varied with the type of reduced tillage and soil depth. For example, converting from MP to CP had minimal effect on the three soil profile structure indicators. Switching from MP to NT, however, had clear benefits documented by increased topsoil AS and decreased soil compaction indicators (BD and PR) in deeper soil layers. NT was most effective in improving soil structure when studies were conducted for a minimum of three years, especially on Entisols and Inceptisols. The results showed that long-term NT adoption does not promote severe topsoil compaction which is usually a concern for producers. Undoubtedly, converting from MP to PER systems was the best strategy for improving soil structure indicators within the soil profile. Those results have important implications for sustainable management and restoration of degraded U.S. soils. Clearly, reducing tillage intensity by transitioning to NT or adopting PER systems can tremendously enhance physical soil health in the U.S. However, to significantly increase perennial production, producers must have markets created by the bioeconomy or payment for ecosystem services. Finally, among the three soil structure indicators evaluated, AS was the most sensitive to changes in cropland use and management practices. Therefore, it should definitely be used as a physical indicator for overall soil health (i.e., biological, chemical and physical indicators) assessment.

Supplementary Materials

The following are available online at https://www.mdpi.com/2071-1050/12/5/2071/s1, Figure S1: Network graph for aggregate stability within the top, second, third and fourth soil depths, Figure S2: Net heat plot for aggregate stability within the top, second and third soil depths, Figure S3: Network graph for bulk density within the top, second, third and fourth soil depths, Figure S4: Net heat plot for bulk density within the top, second, third and fourth depth, Figure S5: Network graph for soil penetration resistance within the top, second and third soil depths, Figure S6: Net heat plot for penetration resistance within the top soil depths.

Author Contributions

Conceptualization, M.R.N. and D.L.K.; Methodology, M.R.N. and D.L.K.; Data acquisition: M.R.N.; Statistical analysis, M.R.N.; Writing—Original Draft Preparation, M.R.N.; Writing—Review and Editing, D.L.K. and T.B.M.; Project Administration, T.B.M.; Funding Acquisition, D.L.K. and T.B.M. All authors have read and agreed to the published version of the manuscript.

Funding

This study was supported by the Natural Resources Conservation Service (NRCS), U.S. Department of Agriculture, under agreement award number 67-3A75-17-391, ‘ARS Soil Management Assessment Framework (SMAF) meta-analysis for indicator interpretations and tool development for use by NRCS Conservation Planners’ and by NRCS staff.

Acknowledgments

Mention of trade names or commercial products in this publication is solely for the purpose of providing specific information and does not imply recommendation or endorsement by the U.S. Department of Agriculture. USDA is an equal opportunity provider and employer.

Conflicts of Interest

The authors declare no conflict of interest.

References

  1. Elliott, E.T.; Coleman, D.C. Let the soil work for us. Ecol. Bull. 1988, 39, 23–32. [Google Scholar]
  2. Thiele-Bruhn, S.; Bloem, J.; Vries, F.T.; Kalbitz, K.; Wagg, C. Linking soil biodiversity and agricultural soil management. Curr. Opin. Environ. Sustain. 2012, 4, 523–528. [Google Scholar] [CrossRef]
  3. Bottinelli, N.; Jouquet, P.; Capowiez, Y.; Podwojewski, P.; Grimaldi, M.; Peng, X. Why is the influence of soil macrofauna on soil structure only considered by soil ecologists? Soil Tillage Res. 2015, 146, 118–124. [Google Scholar] [CrossRef]
  4. Rabot, E.; Wiesmeier, M.; Schlüter, S.; Vogel, H.J. Soil structure as an indicator of soil functions: A review. Geoderma 2018, 314, 122–137. [Google Scholar] [CrossRef]
  5. Dal Ferro, N.; Sartori, L.; Simonetti, G.; Berti, A.; Morari, F. Soil macro- and microstructure as affected by different tillage systems and their effects on maize root growth. Soil Tillage Res. 2014, 140, 55–65. [Google Scholar] [CrossRef]
  6. Nunes, M.R.; Pauletto, E.A.; Denardin, J.E.; Suzuki, L.E.A.S.; van Es, H.M. Dynamic changes in compressive properties and crop response after chisel tillage in a highly weathered soil. Soil Tillage Res. 2019, 186, 183–190. [Google Scholar] [CrossRef]
  7. Nciizah, A.D.; Wakindiki, I.I.C. Physical indicators of soil erosion; aggregate stability and erodibility. Arch. Agron. Soil Sci. 2015, 61, 827–842. [Google Scholar] [CrossRef]
  8. Nunes, M.R.; Denardin, J.E.; Pauletto, E.A.; Faganello, A.; Pinto, L.F.S. Mitigation of clayey soil compaction managed under no-tillage. Soil Tillage Res. 2015, 148, 119–126. [Google Scholar] [CrossRef] [Green Version]
  9. Letey, J. Relationship between soil physical properties and crop production. Adv. Soil Sci. 1985, 1, 277–294. [Google Scholar]
  10. Steele, M.K.; Coale, F.J.; Hill, R.L. Winter annual cover crop impacts on no-till soil physical properties and organic matter. Soil Sci. Soc. Am. J. 2012, 76, 2164–2173. [Google Scholar] [CrossRef]
  11. Blanco-Canqui, H.; Shapiro, C.A.; Wortmann, C.S.; Drijber, R.A.; Mamo, M.; Shaver, T.M.; Ferguson, R.B. Soil organic carbon: The value to soil properties. J. Soil Water Conserv. 2013, 68, 129–134. [Google Scholar] [CrossRef]
  12. Nunes, M.R.; van Es, H.M.; Schindelbeck, R.; Ristow, A.J.; Ryan, M. No-till and cropping system diversication improve fi soil health and crop yield. Geoderma 2018, 328, 30–43. [Google Scholar] [CrossRef]
  13. Chantigny, M.H.; Anger, D.A.; Prévost, D.; Vézina, L.P.; Chalifour, F.P. Soil aggregation and fungal and bacterial biomass under annual and perennial cropping systems. Soil Sci. Soc. Am. J. 1997, 61, 262–267. [Google Scholar] [CrossRef]
  14. Franzluebbers, A.J.; Wright, S.F.; Stuedemann, J.A. Soil aggregation and glomalin under pastures in the Southern Piedmont USA. Soil Sci. Soc. Am. J. 2000, 64, 1018–1026. [Google Scholar] [CrossRef]
  15. Kumar, A.; Dorodnikov, M.; Splettstößer, T.; Kuzyakov, Y.; Pausch, J. Effects of maize roots on aggregate stability and enzyme activities in soil. Geoderma 2017, 306, 50–57. [Google Scholar] [CrossRef]
  16. Kautz, T.; Stumm, C.; Kösters, R.; Köpke, U. Effects of perennial fodder crops on soil structure in agricultural headlands. J. Plant Nutr. Soil Sci. 2010, 173, 490–501. [Google Scholar] [CrossRef]
  17. Veum, K.S.; Kremer, R.J.; Sudduth, K.A.; Kitchen, N.R.; Lerch, R.N.; Baffaut, C.; Stott, D.E.; Karlen, D.L.; Sadler, E.J. Conservation effects on soil quality indicators in the Missouri Salt River Basin. J. Soil Water Conserv. 2015, 70, 232–246. [Google Scholar] [CrossRef]
  18. Lal, R.; Reicosky, D.; Hanson, J. Evolution of the plow over 10;000 years and the rationale for no-till farming. Soil Tillage Res. 2007, 93, 1–12. [Google Scholar] [CrossRef]
  19. Kassam, A.; Friedrich, T.; Derpsch, R.; Kienzle, J. Overview of the worldwide spread of conservation agriculture. Field Actions Sci. Rep. 2015, 8, 1–51. [Google Scholar]
  20. Martínez, I.; Chervet, A.; Weisskopf, P.; Sturny, W.G.; Rek, J.; Keller, T. Two decades of no-till in the Oberacker long-term field experiment: Part II. Soil porosity and gas transport parameters. Soil Tillage Res. 2016, 163, 130–140. [Google Scholar] [CrossRef]
  21. Kinoshita, R.; Schindelbeck, R.R.; van Es, R.M. Quantitative soil profile-scale assessment of the sustainability of long-term maize residue and tillage management. Soil Tillage Res. 2017, 174, 34–44. [Google Scholar] [CrossRef]
  22. Dairon, R.; Dutertre, A.; Tournebize, J.; Marks-Perreau, J.; Carluer, N. Long-term impact of reduced tillage on water and pesticide flow in a drained context. Environ. Sci. Pollut. Res. 2017, 24, 6866–6877. [Google Scholar] [CrossRef] [PubMed]
  23. Suzuki, L.E.A.S.; Reichert, J.M.; Reinert, D.J. Degree of compactness; soil physical properties and yield of soybean in six soils under no-tillage. Soil Res. 2013, 51, 311–321. [Google Scholar] [CrossRef]
  24. Nunes, M.R.; Karlen, D.K.; Denardin, J.E.; Cambardella, C.A. Corn root and soil health indicator response to no-till production practices. Agric. Ecosyst. Environ. 2019, 285, 106607. [Google Scholar] [CrossRef]
  25. Blanco-Canqui, H.; Wienhold, B.J.; Jin, V.L.; Schmer, M.R.; Kibet, L.C. Long-term tillage impact on soil hydraulic properties. Soil Tillage Res. 2017, 170, 38–42. [Google Scholar] [CrossRef] [Green Version]
  26. Van den Putte, A.; Govers, G.; Diels, J.; Gillijns, K.; Demuzere, M. Assessing the effect of soil tillage on crop growth: A meta-regression analysis on European crop yields under conservation agriculture. Eur. J. Agron. 2010, 33, 231–241. [Google Scholar] [CrossRef]
  27. Kemper, W.D.; Rosenau, R.C. Aggregate stability and size distribution. In Methods of Soil Analysis Part 1 Agronomy Monograph 9, 2nd ed.; Klute, A., Ed.; American Society of Agronomy. Inc.: Madison, WI, USA, 1986; pp. 425–442. [Google Scholar]
  28. Quisenberry, V.L.; Smith, B.R.; Phillips, R.E.; Scott, H.D.; Nortcliff, S. A soil classification system for describing water and chemical transport. Soil Sci. 1993, 156, 306–315. [Google Scholar] [CrossRef]
  29. R Core Team. R: A Language and Environment for Statistical Computing; R Foundation for Statistical Computing: Vienna, Austria, 2018. [Google Scholar]
  30. Gurevitch, J.; Koricheva, J.; Nakagawa, S.; Stewart, G. Meta-analysis and the science of research synthesis. Nature 2018, 555, 175–182. [Google Scholar] [CrossRef]
  31. Wiebe, N.; Vandermeer, B.; Platt, R.W.; Klassen, T.P.; Moher, D.; Barrowman, N.J. A systematic review identifies a lack of standardization in methods for handling missing variance data. J. Clin. Epidemiol. 2006, 59, 342–353. [Google Scholar] [CrossRef]
  32. Weir, C.J.; Butcher, I.; Assi, V.; Lewis, S.C.; Murray, G.D.; Langhorne, P.; Brady, M.C. Dealing with missing standard deviation and mean values in meta-analysis of continuous outcomes: A systematic review. BMC Med. Res. Methodol. 2018, 18, 25. [Google Scholar] [CrossRef]
  33. Luo, Y.Q.; Hui, D.F.; Zhang, D.Q. Elevated CO2 stimulates net accumulations of carbon and nitrogen in land ecosystems: A meta-analysis. Ecology 2006, 87, 53–63. [Google Scholar] [CrossRef] [PubMed] [Green Version]
  34. Meurer, K.H.E.; Haddaway, N.R.; Bolinder, M.A.; Kätterer, T. Tillage intensity affects total SOC stocks in boreo-temperate regions only in the topsoil—A systematic review using an ESM approach. Earth Sci. Rev. 2018, 177, 613–622. [Google Scholar] [CrossRef]
  35. Furukawa, T.A.; Barbui, C.; Cipriani, A.; Brambilla, P.; Watanabe, N. Imputing missing standard deviations in meta-analyses can provide accurate results. J. Clin. Epidemiol. 2006, 59, 7–10. [Google Scholar] [CrossRef] [PubMed]
  36. Thiessen Philbrook, H.; Barrowman, N.; Garg, A.X. Imputing variance estimates do not alter the conclusions of a meta-analysis with continuous outcomes: A case study of changes in renal function after living kidney donation. J. Clin. Epidemiol. 2007, 60, 228–240. [Google Scholar] [CrossRef]
  37. Rücker, G.; Schwarzer, G. Reduce dimension or reduce weights? Comparing two approaches to multi-arm studies in network meta-analysis. Stat. Med. 2014, 33, 4353–4369. [Google Scholar] [CrossRef]
  38. Schwarzer, G.; Carpenter, J.R.; Rücker, G. Meta-Analysis with R; Springer International Publishing: Cham, Switzerland, 2015. [Google Scholar]
  39. Rücker, G.; Schwarzer, G. Ranking treatments in frequentist network meta-analysis works without resampling methods. BMC Med. Res. Methodol. 2015, 31, 15–58. [Google Scholar] [CrossRef] [Green Version]
  40. Viechtbauer, W. Conducting meta-analyses in R with the metafor package. J. Stat. Softw. 2010, 6, 1–48. [Google Scholar]
  41. Zuur, A.F.; Ieno, E.N.; Walker, N.J.; Saveliev, A.A.; Smith, G.M. Mixed Effects Model-Ling for Nested Data. In Mixed Effects Models and Extensions in Ecology With R; Springer: Berlin/Heidelberg, Germany, 2009; pp. 101–142. [Google Scholar]
  42. Anzures-Cabrera, J.; Higgins, J.P. Graphical displays for meta-analysis: An overview with suggestions for practice. Res. Synth. Methods 2010, 1, 66–80. [Google Scholar] [CrossRef]
  43. Karlen, D.L.; Veum, K.S.; Sudduth, K.A.; Obrycki, J.F.; Nunes, M.R. Soil health assessment: Past accomplishments, current activities and future opportunities. Soil Tillage Res. 2019, 195, 104365. [Google Scholar] [CrossRef]
  44. Karlen, D.L.; Rice, C.W. Soil degradation: Will humankind ever learn? Sustainability 2015, 7, 12490–12501. [Google Scholar] [CrossRef] [Green Version]
  45. Thomas, G.W.; Haszler, G.R.; Blevins, R.L. The effects of organic matter and tillage on maximum compactibility of soils using the proctor test. Soil Sci. 1996, 161, 502–508. [Google Scholar] [CrossRef]
  46. Veiga, M.; Horn, R.; Reinert, D.J.; Reichert, J.M. Soil compressibility and penetrability of an Oxisol from southern Brazil as affected by long-term tillage systems. Soil Tillage Res. 2007, 92, 104–113. [Google Scholar]
  47. Carter, M.R. Characterization of soil physical properties and organic matter under long-term primary tillage in a humid climate. Soil Tillage Res. 1996, 38, 251–263. [Google Scholar] [CrossRef]
  48. Alam, M.K.; Salahin, N.; Islam, S.; Begum, R.; Hasanuzzaman, M.; Islam, M.; Rahman, M. Patterns of change in soil organic matter; physical properties and crop productivity under tillage practices and cropping systems in Bangladesh. J. Agric. Sci. 2017, 155, 216–238. [Google Scholar] [CrossRef]
  49. Blanco-Canqui, H.; Ruis, S.J. No-tillage and soil physical environment. Geoderma 2018, 326, 164–200. [Google Scholar] [CrossRef]
  50. Grzesiak, S.; Grzesiak, M.T.; Hura, T.; Marcinska, I.; Rzepka, A. Changes in root system structure; leaf matric potential and gas exchange of maize and triticale seedlings affected by soil compaction. Environ. Exp. Bot. 2012, 88, 2–10. [Google Scholar] [CrossRef]
  51. Reichert, J.M.; Suzuki, L.E.A.S.; Reinert, D.J.; Horn, R.; Hakansson, I. Reference bulk density and critical degree-of-compactness for no-till crop production in subtropical highly weathered soils. Soil Tillage Res. 2009, 102, 242–254. [Google Scholar] [CrossRef]
  52. Sharma, P.; Singh, G.; Singh, R.P. Conservation tillage and optimal water supply enhances microbial enzyme (glucosidase; urease and phosphatase) activities in fields under wheat cultivation during various nitrogen management practices. Arch. Agron. Soil Sci. 2013, 59, 911–928. [Google Scholar] [CrossRef]
  53. Das, A.; Lyngdoh, D.; Ghosh, P.K.; Lal, R.; Layek, J.; Idapuganti, R.G. Tillage and cropping sequence effect on physico-chemical and biological properties of soil in Eastern Himalayas, India. Soil Tillage Res. 2018, 180, 182–193. [Google Scholar] [CrossRef]
  54. Mohanty, B.P.; Horton, R.; Ankeny, M.D. Infiltration and macroporosity under a row crop agricultural field in a glacial till soil. Soil Sci. 1996, 161, 205–213. [Google Scholar] [CrossRef] [Green Version]
  55. Silva, A.P.; Ball, B.C.; Tormena, C.A.; Giarola, N.F.B.; Guimarães, R.M.L. Soil structure and greenhouse gas production differences between row and interrow positions under no-tillage. Sci. Agric. 2014, 71, 157–162. [Google Scholar] [CrossRef] [Green Version]
  56. Pillai, U.P.; McGarry, D. Structure repair of a compacted Vertisol with wet–dry cycles and crops. Soil Sci. Soc. Am. J. 1999, 63, 201–210. [Google Scholar] [CrossRef]
  57. Pires, L.F.; Cássaro, F.A.M.; Reichardt, K.; Bacchi, O.O.S. Soil porous system changes quantified by analyzing soil water retention curve modifications. Soil Tillage Res. 2008, 100, 72–77. [Google Scholar] [CrossRef]
  58. Bavoso, M.A.; Silva, A.P.; Figueiredo, G.C.; Tormena, C.A.; Giarola, N.F.B. Resiliência física de dois latossolos vermelhos sob plantio direto. Rev. Bras. Cienc. Solo 2012, 36, 1892–1904. [Google Scholar] [CrossRef]
  59. Kirkegaard, J.A.; Troedson, R.J.; So, H.B.; Kushwaha, B.L. The effect of compaction on the growth of pigeon pea on clay soils. II. Mechanisms of crop response and season effects on an oxisol in a humid coastal environment. Soil Tillage Res. 1992, 24, 129–147. [Google Scholar] [CrossRef]
  60. Arvidsson, J.; Hakansson, I. A model for estimating crop yield losses caused by soil compaction. Soil Tillage Res. 1991, 20, 319–332. [Google Scholar] [CrossRef]
  61. Rachman, A.; Anderson, S.H.; Gantzer, C.J.; Alberts, E.E. Soil hydraulic properties influenced by stiff-stemmed grass hedge systems. Soil Sci. Soc. Am. J. 2004, 68, 1386–1393. [Google Scholar] [CrossRef] [Green Version]
  62. DuPont, S.T.; Beniston, J.; Glover, J.D.; Hodson, A.; Culman, S.W.; Lal, R.; Ferris, H. Root traits and soil properties in harvested perennial grassland; annual wheat; and never-tilled annual wheat. Plant Soil 2014, 381, 405–420. [Google Scholar] [CrossRef]
  63. Jastrow, J.D.; Miller, R.M.; Lussenhop, J. Contributions of interacting biological mechanisms to soil aggregate stabilization in restored prairie. Soil Biol. Biochem. 1998, 30, 905–916. [Google Scholar] [CrossRef]
  64. Nunes, M.R.; Silva, A.P.; Denardin, J.E.; Giarola, N.F.B.; Vaz, C.M.P.; van Es, H.M.; Silva, A.R. Soil chemical management drives structural degradation of Oxisols under a no-till cropping system. Soil Res. 2017, 55, 819–831. [Google Scholar] [CrossRef]
Figure 1. Meta-analysis sites identified where soil health indicators for different agricultural production systems have been compared within the U.S.A.
Sustainability 12 02071 g001
Figure 2. Pooled response ratio of tillage intensity [chisel plow (CP), no-till (NT) and perennial system (PER)] relative to moldboard plow and the 95% confidence intervals (horizontal bars) determined by network meta-analysis for soil aggregate stability (AS), bulk density (BD) and penetration resistance (PR) within four soil depths (Top ≤ 15-cm; Second > 15 to ≤ 25-cm; Third > 25 to ≤ 40-cm; and Fourth ≥ 40-cm).
Sustainability 12 02071 g002
Figure 3. Response ratio [chisel plow (CP)/moldboard plow (MP)] and the associated 95% confidence intervals (horizontal bars) for soil aggregate stability (AS), bulk density (BD) and penetration resistance (PR) within four soil depths (Top ≤ 15-cm; Second > 15 to ≤ 25-cm; Third > 25 to ≤ 40-cm; and Fourth ≥ 40-cm). Where k is the number of pairwise comparisons; Q is the heterogeneity followed by its significance (*** significant at 0.1%, * significant at 5% and ns, not significant) considering a random effect model without moderators.
Sustainability 12 02071 g003
Figure 4. Response ratio [no-till (NT)/moldboard plow (MP)] and the associated 95% confidence intervals (horizontal bars) for soil aggregate stability (AS), bulk density (BD) and penetration resistance (PR) within four soil depths (Top ≤ 15-cm; Second > 15 to ≤ 25-cm; Third > 25 to ≤ 40-cm; and Fourth ≥ 40-cm). Where k is the number of pairwise comparisons; Q is the heterogeneity followed by its significance (*** significant at 0.1%, * significant at 5% and ns, not significant) considering a random effect model without moderators.
Sustainability 12 02071 g004
Figure 5. Response ratio [perennial system (PER)/moldboard plow (MP)] and the associated 95% confidence intervals (horizontal bars) for soil aggregate stability (AS), bulk density (BD) and penetration resistance (PR) within four soil depths (Top ≤ 15-cm; Second > 15 to ≤ 25-cm; Third > 25 to ≤ 40-cm; and Fourth ≥ 40-cm). Where k is the number of pairwise comparisons; Q is the heterogeneity followed by its significance (*** significant at 0.1%, * significant at 5% and ns, not significant) considering a random effect model without moderators.
Sustainability 12 02071 g005
Figure 6. Response ratio (RR) for soil aggregate stability (AS) under no-till (NT) relative to moldboard plow (MP) in the topsoil layer (where RR = AS under NT/AS under MP) and the associated 95% confidence intervals (horizontal bars) for four levels of experimental duration (a) and seven soil orders (b).
Sustainability 12 02071 g006
Figure 7. Pearson correlation coefficients, associated p-values and confidence intervals for soil structure indicator response ratios (RR) considering the data from all depths (All, 0 to > 40-cm) and the data only from the topsoil layer (Top, ≥ 15-cm). Agg Stab, soil aggregate stability; BD, soil bulk density; PR, soil penetration resistance.
Sustainability 12 02071 g007
Table 1. Descriptive analyses grouped by soil layer and tillage intensity.
Depth1Tillage2Soil Bulk Density, g cm−3Soil Aggregate Stability, %Soil Penetration Resistance, MPa
Obs.minmaxmeansdObs.minmaxmeansdObs.minmaxmeansd
OverallMP5450.281.931.360.191546.099.749.926.6500.295.081.531.02
OverallCP2820.271.981.380.225912.093.950.621.1410.184.031.440.96
OverallNT6630.271.951.390.191836.099.760.524.9640.245.801.661.17
OverallPER2230.741.801.270.18619.595.464.024.850.191.360.720.46
TopMP2650.281.801.270.191066.097.945.425.5320.295.081.381.15
TopCP1320.271.981.300.233712.093.950.722.2260.184.031.130.93
TopNT3150.271.891.310.191196.098.358.025.1430.245.801.361.22
TopPER1110.741.501.180.17389.595.463.325.730.191.360.830.59
SecondMP1440.571.931.410.173911.999.763.127.790.632.501.590.60
SecondCP830.621.981.420.212115.089.750.320.0100.672.861.860.68
SecondNT1830.671.951.440.185112.099.768.323.6121.214.272.250.95
SecondPER570.951.601.320.141525.095.069.025.810.380.380.38-
ThirdMP971.141.841.470.15629.158.643.412.270.642.842.070.74
ThirdCP391.081.671.440.16149.849.849.8-50.873.702.231.01
ThirdNT1081.031.871.470.14913.085.051.722.771.463.072.260.54
ThirdPER410.951.671.380.13529.085.061.220.210.730.730.73-
FourthMP391.231.831.490.17333.069.047.618.922.122.122.120.00
FourthCP281.281.721.520.150----0----
FourthNT571.241.791.510.15430.079.057.225.522.032.992.510.68
FourthPER141.231.801.520.16340.074.051.319.60----
1 Top ≤ 15-cm; Second > 15 to ≤ 25-cm; Third > 25 to ≤ 40-cm; and Fourth ≥ 40-cm. 2 MP = moldboard plow; CP = chisel plow; NT = no-tillage; PER = perennial system.
Table 2. Treatment ranking by P-scores for increase aggregate stability (AS), bulk density (BD) and penetration resistance (PR) values within each soil depth.
Depth1Tillage Intensity2ASBDPR
TopPerennial1.000.580.06
No-tillage0.610.870.81
Chisel plow0.340.120.70
Moldboard plow0.050.420.43
SecondPerennial1.000.23-
No-tillage0.670.750.42
Chisel plow0.030.250.66
Moldboard plow0.300.740.42
ThirdPerennial0.770.68-
No-tillage0.530.440.00
Chisel plow-0.101.00
Moldboard plow0.640.780.50
1 Top ≤ 15-cm; Second > 15 to ≤ 25-cm; Third >25 to ≤ 40-cm; and Fourth ≥ 40-cm. 2 P-Score describes the mean level of certainty about a particular treatment being better than another treatment. The P-Score of a treatment, which may range from 0 to 1, can be interpreted as the mean certainty of its superiority in relation to the other treatments.

