Article

Multi-Agent Simulation of Safe Livability and Sustainable Development in Cities

1
School of Computer Science and Technology, Taiyuan University of Science and Technology, Taiyuan 030024, China
2
Institute of Geographical Sciences and Natural Resources Research, Chinese Academy of Sciences, Beijing 100101, China
3
Shenzhen Construction Science Research Institute Co., Ltd., Shenzhen 518049, China
*
Author to whom correspondence should be addressed.
Sustainability 2020, 12(5), 2070; https://doi.org/10.3390/su12052070
Submission received: 22 January 2020 / Revised: 25 February 2020 / Accepted: 2 March 2020 / Published: 8 March 2020
(This article belongs to the Section Sustainable Urban and Rural Development)

Abstract

:
Urban livability is an important factor affecting the sustainable development of modern cities. Safe livability is an important part of urban livability. In view of this, this paper takes security as an example, and based on the actual data of Futian District, Shenzhen City, China, establishes a multi-agent simulation model of urban safe livability. The dynamic interaction feedback mechanism between decision-making behaviors of residents and urban safe livability under the influence of environment and policies has been explored, and residents’ decision-making simulation of the change of urban safe livability is realized. Finally, the main factors influencing urban safe livability are summarized through simulation conclusions. The research can not only provide scientific suggestions for improving the safe livability of Shenzhen, it also provides strong support for the sustainable development of the city.

1. Introduction

With the rapid growth of a city’s size and economy, a series of urban problems [1] such as overcrowded population, environmental degradation, land tension, and decline in ecological quality, emerge. The Third United Nations Conference on Housing and Urban Sustainable Development [2] released the New Urban Agenda in October 2016. The improvement of living conditions in the process of urbanization and building livable cities have become a common global pursuit. “Livable cities” have a good living space environment, humanistic social environment, ecological natural environment, and a clean and efficient production environment. Once this concept was put forward, a broad consensus in the international community was formed and it became a new view of urbanization in the 21st century. Urban livability is a comprehensive evaluation index to judge whether a city is livable. Among them, urban safe livability is a key issue that currently concerns governments, residents, and academia. In recent years, international and domestic communities have emphasized the importance of ensuring public safety and improving urban governance. Building livable cities is increasingly on the policy agenda.
Urban livability, as a comprehensive evaluation index, includes safety, comfort, convenience, accessibility, and inclusiveness. As a new direction in urban scientific research, it has gradually attracted widespread attention from scholars at home and abroad. Zhan and colleagues conducted a large-scale questionnaire survey on 40 major cities in China [3]. They explored the characteristics and influencing factors of urban livability degree and satisfaction degree by using the geographical detector model. Liu and co-workers explored the complex interdependence between emerging tourism and the livability of Chinese cities. Based on the conceptual model and statistical analysis of 35 large- and medium-sized cities in China from 2003 to 2012, the potential threat of overdevelopment of tourism to the livability of the city was deduced [4]. Paul and colleagues took Kolkata, India as the research object, and based their study on integrated urban geographic factors (IUGFs), evaluating the changes to livability in the city center to understand the impact of changes in livability on urban development [5]. Khorasani and Zarghamfard [6] analyzed the influence of spatial factors at local and regional scales on livability, using the urban village of Walamin as an example. The results showed that there was a significant relationship between village spatial factors and livability indicators. Furlan and Petruccioli [7] proposed a model called transit oriented development (TOD). This model improves urban livability through better integration of urban transportation and land use strategies, thereby maintaining sustainable urbanization. Most of the studies in the above literature only consider the meaning and measurement indicators of a more comprehensive livable city. They are limited to the concept and interpretation of the concept. They do not consider changes in the livability of the city under the influence of various factors. They only focus on static spatial equilibrium and the estimation of urban livability under quantitative indicators. Moreover, they ignore complex human factors and individual decision-making behaviors, and it is difficult to reflect the complexity of urban spatial systems. Therefore, in our study, computer technology is used to study the interaction between many environmental factors and complex human factors. Moreover, computer technology is of great significance to the study of urban safe livability.
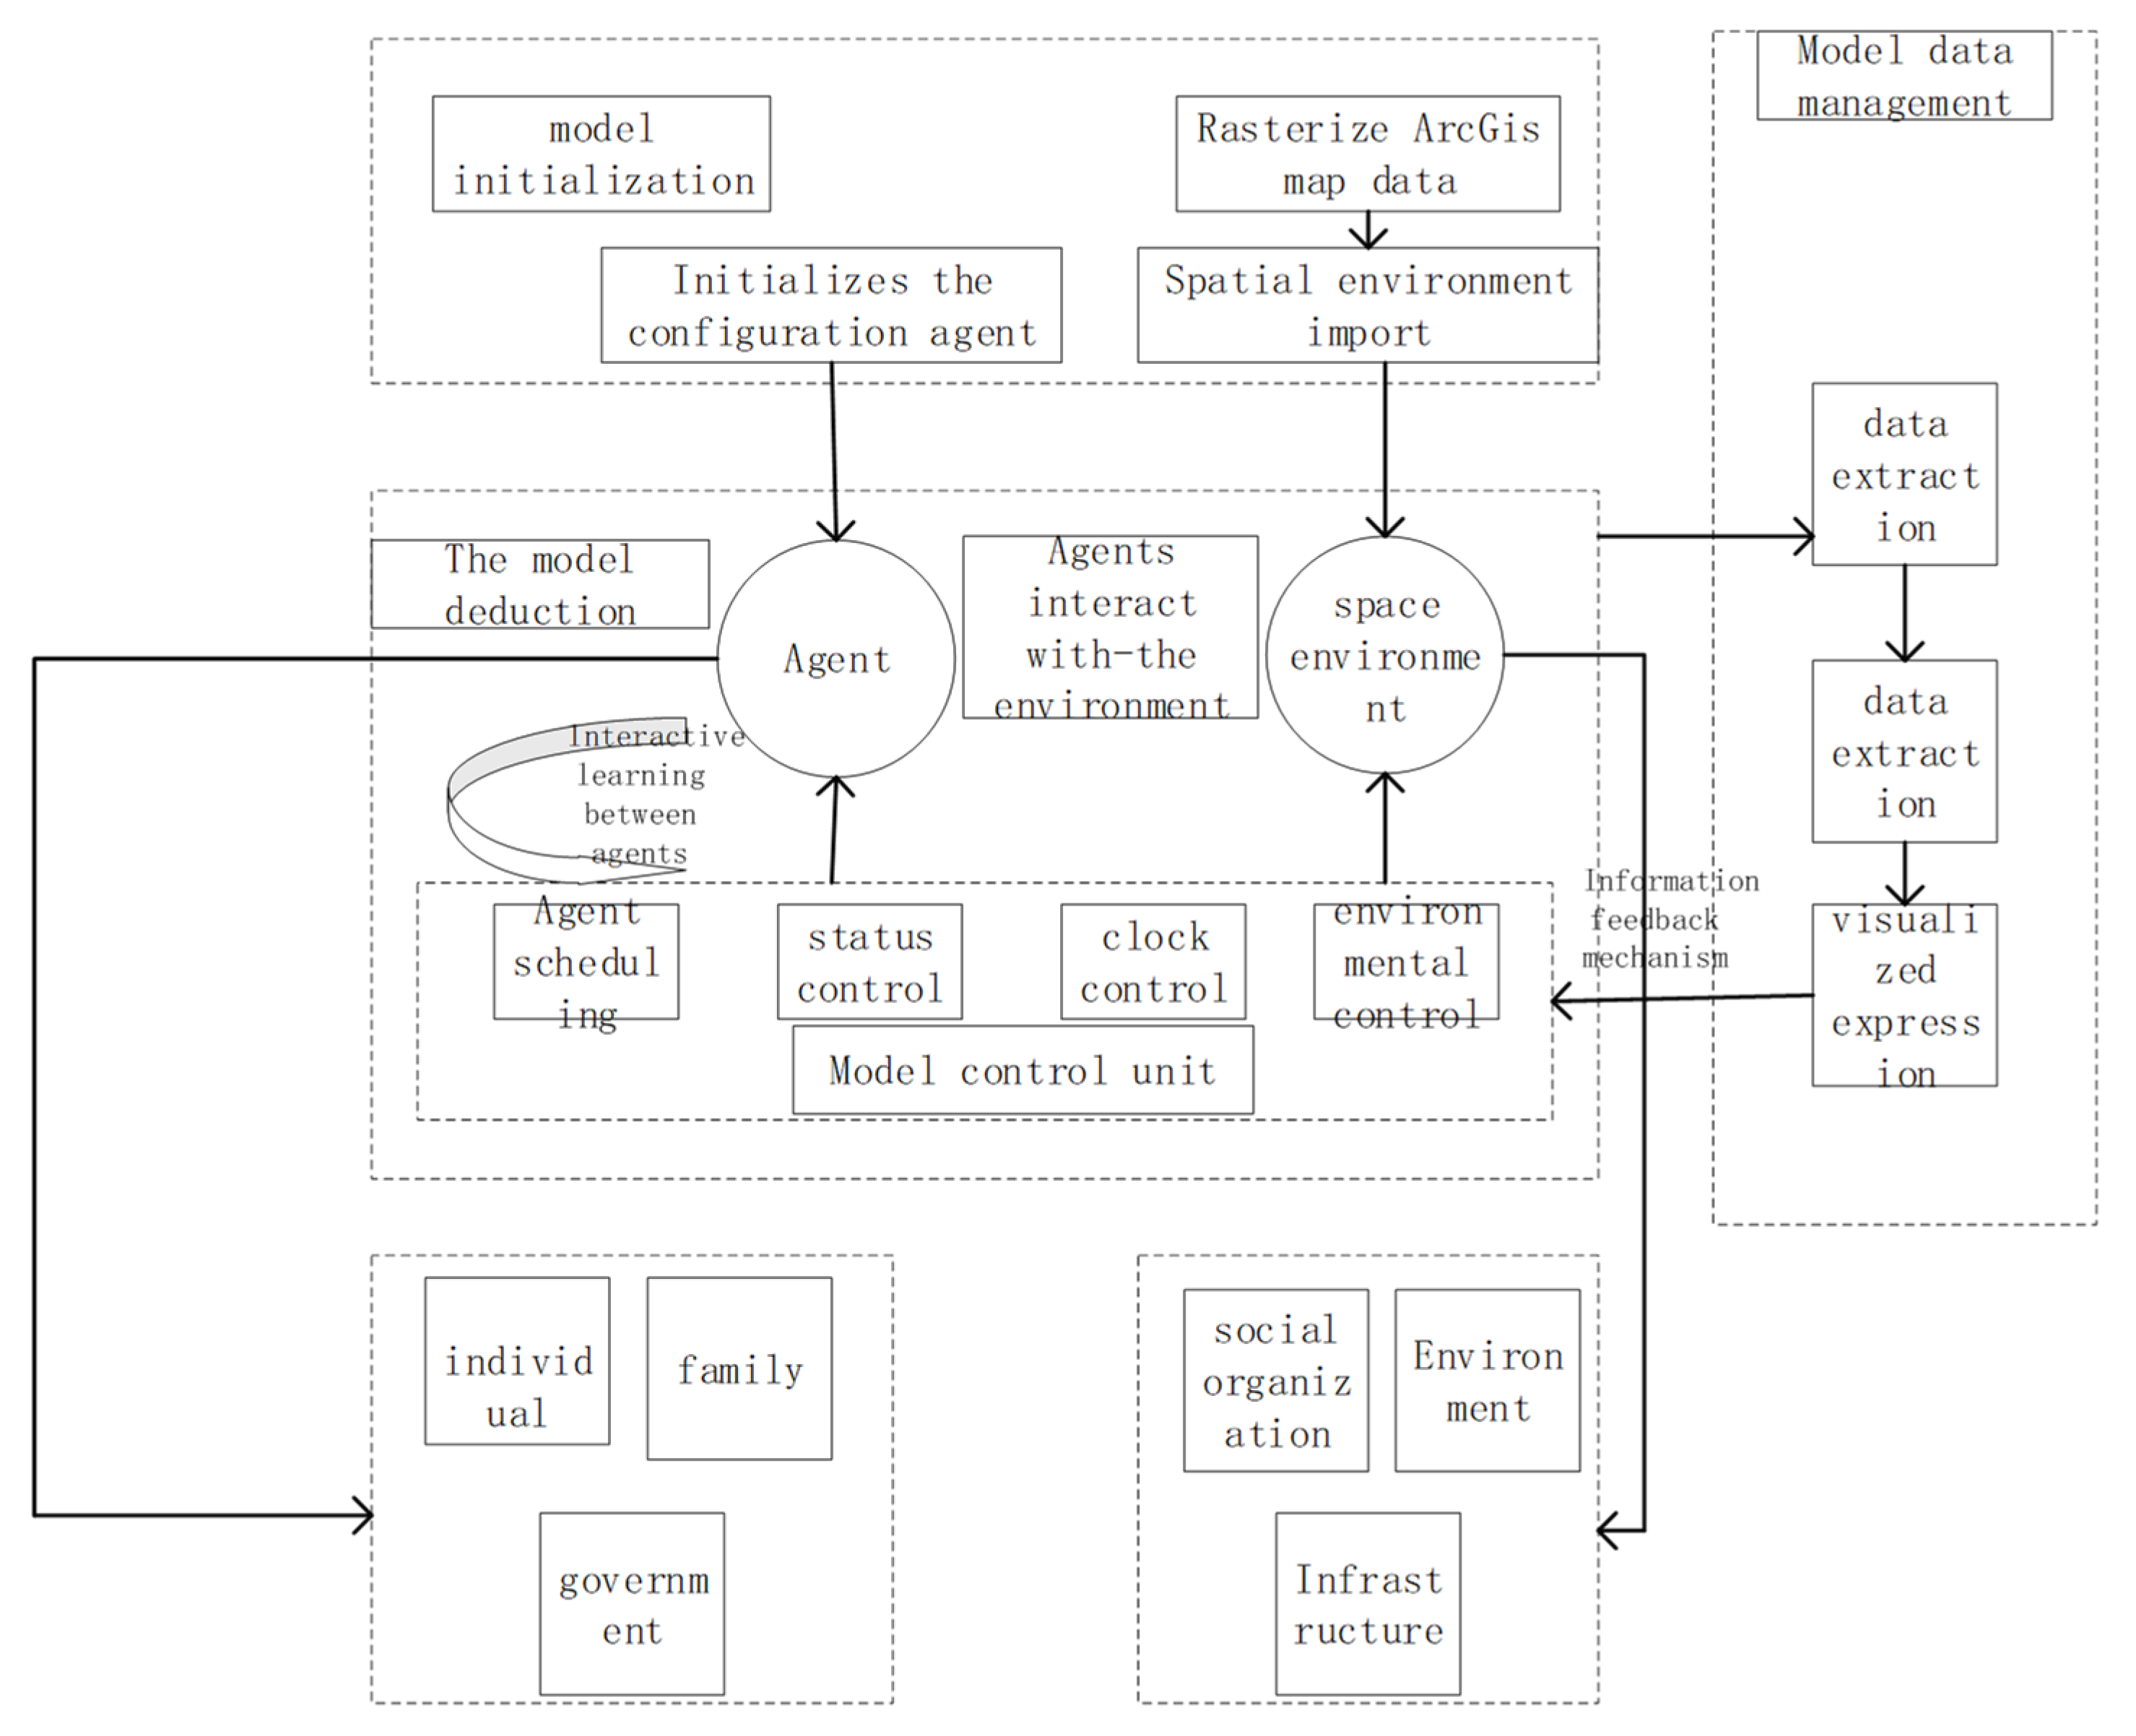
Multi-agent modeling [8] refers to abstracting the basic elements of complex systems into agents. Then, an agent simulation model corresponding to the real world is established, and the agent behavior rules are set to make the model run. This paper uses the bottom-up characteristics of the multi-agent model to analyze not only the decision-making behavior of residents under the influence of environment and policies, but also the interaction mechanism between residents and environmental factors with the city’s safety and livability. Taking Futian District of Shenzhen City as an example, empirical analysis and simulation of the changes and development trends of the safe livability of Futian District are performed. Finally, the key factors affecting the safe livability of Futian District were obtained. The research results provide effective suggestions for the city’s safety management and sustainable development.

2. Regional Study and Data Sources

2.1. Overview of the Region

Since China’s reform and ‘opening up’ 40 years ago, Futian District has become the cultural, political, informational, and international exhibition center of Shenzhen City. It is a leader in development, innovation, and exposure to the outside world. The region’s economy is growing rapidly, with gross domestic product (GDP) growth of 7.5% and population growth of 4% in 2018. However, the rapid economic and population growth has led to a series of urban safety problems [9,10]. These problems have two main causes: (1) importance has been attached to economic development, but the construction of security facilities has been ignored; (2) population growth has led to a decrease in the number of security facilities per capita, which causes frequent security problems. These problems not only affect the happiness and satisfaction of residents, but also hinder the sustainable development of Futian District. In view of these problems, 10 streets in Futian District were studied in this paper. The distribution of the street locations is shown in Figure 1.

2.2. Data Sources

2.2.1. Subject Construction Data

The research group conducted a questionnaire survey and institutional investigation on 10 streets in Futian District in August 2018, and collected more than 10,000 questionnaires, with approximately 9800 valid questionnaires. Accordingly, the weight of the family structure, occupation ratio, wage level, and evaluation index of residents in Futian District were obtained. These indices are considered to be the basis for residents’ decisions to move, and the statistical results are shown in Table 1, Table 2, Table 3, Table 4, Table 5 and Table 6.
Grid data provided by Shenzhen Construction Research Institute Co., Ltd., Shenzhen Statistical Yearbook data (2009–2018) and 2017 census data show that the total population of Futian District is 1.5017 million, the total area is 78.8 square kilometers, with a population density of 19,057 people/km2. There are 330,000 households in the region, with an average of 4.5 people per household. The above data are used as the initialization parameter of the model. In addition, the birth rate is 22.33% and the death rate is 1.34%. The annual growth rate of the migrant population fluctuates between −5% and 5%. The above data are taken as the iterative operation parameters of the model.

2.2.2. Geographical Environment Data

The monitoring index system of human settlements environment under the new data environment formulated by the School of Architecture, Tsinghua University [11] claimed that the indicators of safe livability include public security safety, fire safety, emergency safety, and traffic safety; the investigation found that residential safety was also an important factor affecting urban safety. Therefore, the five indices of public security, fire protection, emergency, traffic, and residential safety were selected as the evaluation factors of urban safe livability. The different types of safety indicators correspond to different types of safety facilities, as shown in Table 6. The model rasterized the real map, with each cell representing a 100 m × 100 m area, and the color depth representing the high and low level of index coverage. One agent in the model represented five people in the real world. With the security facilities as the center, the 500-m buffer zone as the impact area, and the grid as the unit, the real security facilities were transformed into quantifiable coverage data by using Geographic Information System (GIS). The calculation is as follows: coverage of grid security indicators = the buffer area formed by the facilities in the grid included in the security indicators/the total area of the grid. In this way, the security index coverage of 887 grids in Futian District was obtained.

3. Model Construction

3.1. Model Overview

The model of urban safe livability is a complex system that changes over time and space [12,13]. In the system, the degree of urban safe livability, residents’ satisfaction, and family relocation behavior interact. The location and distribution density of all kinds of safety facilities are the main factors affecting the degree of livability. Differences in age level and family structure results affect environmental preferences. It results in different levels of family satisfaction, and family satisfaction varies with its level of ranking in surrounding satisfaction. Family relocation behavior is mainly determined by family satisfaction; there is a negative correlation between the two under certain conditions. Family relocation behavior leads to a dynamic change in population density, per capita safety facilities, and safe livability, resulting in a multi-factor system that affects urban safety livability changes over time and cycles [14,15]. The interactive feedback of safe livability, resident satisfaction, and family relocation behavior in the system is shown in Figure 2.

3.2. Behavior Rule Design

3.2.1. Safe Livability

According to the realistic analysis, the per capita facilities decrease with the increase in the population. This results in a negative correlation between the evaluation index and the population. In this model, the evaluation index of safe livability (security, fire, traffic, emergency, and residence safety) changes iteratively over time according to changes in the population. The specific design rules are as follows:
E v a l u a p = E v a l u a _ l a s t p l a s t _ h e a d c o u n t c e l l h e a d c o u n t c e l l
where E v a l u a p indicates the evaluation index of the degree of safe livability. l a s t _ h e a d c o u n t c e l l and h e a d c o u n t c e l l indicate the number of people in the cell in the previous year and in the year, respectively (including resident and floating population). E v a l u a _ l a s t p represents the evaluation index value of the previous year.
In this model, an area includes several streets, one street is composed of several grids, and one grid contains several cells. Based on this progressive relationship, the calculation formulas for cell, grid, street, and area safety livability are defined:
S L c e l l = p = 1 5 β p E v a l u a p
S L g r i d p = p = 1 N u m b e r c e l l p S L c e l l p N u m b e r c e l l p
S L s t r e e t p = p = 1 N u m b e r g r i d p S L g r i d p N u m b e r g r i d p
S L a r e a = p = 1 N u m b e r s t r e e t p S L s t r e e t p N u m b e r s t r e e t p
where S L c e l l , S L s t r e e t and S L a r e a represent the degree of safe livability of the cell, street, and area, respectively. β p represents the weight of E v a l u a p . In addition, 1 ≤ p ≤ 5, and the cumulative sum is 1. The variable number represents the number of grids and streets. S L c e l l p , S L g r i d p and S L s t r e e t p respectively represent the safe livability of the cell, grid, and street, referred to as p. In the formula, the safe livability of the cell layer is weighted by the coverage rate of various security indicators of this layer. The safe livability of the grid layer, street layer, and regional layer are obtained by calculating the average value of the safe livability of the previous layer.

3.2.2. Residents’ Satisfaction

Resident satisfaction is the degree of residents’ satisfaction with the living environment, denoted as R s . The value of this variable is affected by the current security facilities in residences and the level of satisfaction of nearby residents [16]. Therefore, this variable consists of two parts: (1) how satisfied are residents with their current living environment according to their own preferences. These include residents’ satisfaction with security facilities around them and the change in this value caused by the average value of each preference index of the residents in the eight cells around them, denoted as R S n ; (2) the satisfaction affected by agent interactions, which is denoted as R s i . It varies with the rank of residents’ satisfaction in the neighborhood, the satisfaction of residents with high and low ranking will decrease, while the satisfaction level of those in the middle will remain unchanged. The calculation of R s , R S n , and R s i are as follows:
R s = R s n + R s i
R s n = i = 1 n α i E v a l u a i + i = 1 n α i ( E v a l u a i E v a l u a i ¯ )
R s i = { 0.2 p 0 In   the   top   5 % After   ranking   5 % others
where n denotes the number of residents’ preference indicators, and 0 ≤ n ≤ 5. α i = { α 1 , α 2 , α 3 , α n } represent the weight of the family preference indicator and α i cumulative sum is 1. E v a l u a i = { E v a l u a 1 , E v a l u a 2 , E v a l u a n } represent an array of family preference indicators. E v a l u a i ¯ denotes the mean value of the neighborhood preference term centered on the grid where the family is located. P is the arbitrary value of the interval (−0.1, 0).

3.2.3. Family Relocation

1. Family preferences
Family preference is determined by the family members who are eager to relocate, that is, the decision-maker of the family, denoted as p d , giving priority to vulnerable groups (the elderly and children) and the head of the household. The specific formula is as follows:
f s = p d
p d = { p k p o p h There   are   children   under   16   in   home There   are   old   over   55   in   home head   of   household   ( no   children   and   old )
where f s represents family satisfaction, which is denoted by p d ; p k represents child satisfaction; p o stands for the satisfaction of the elderly family members; and p h represents the homeowner’s satisfaction.
2. Code of conduct for relocation
According to the analysis and survey data, there is a negative correlation between a family’s desire to move and satisfaction with family security; in other words, the lower the current family satisfaction is, the stronger the desire to move, and vice versa. At the same time, relocation is restricted by economic conditions and vacancy number [17,18]. In addition, the unemployed residents in the system look for a job once a year, and the model calculates their salary according to the job position, and judges whether they have the ability to relocate again when entering the next iteration. According to the above rules, the population experiences dynamic changes.
D M = 1 f s
{ D M > D M m i n F e > E t H e > 0
where D M represents the family’s desire to relocate; f s means family satisfaction; D M m i n represents the minimum threshold of the desire to relocate. When D M > D M m i n , the family wants to move. F e represents the family’s economic condition, E t represents the minimum economic condition required for relocation, and when F e > E t , the family has the ability to move. H e represents an empty house resource. When H e > 0 , there are optional empty room resources. That is, when three conditions are established at the same time, the family relocations are a success. In the model S t and E t are adjustable parameters and are adjusted according to urban and economic differences.

3.2.4. Government Decision-Making Behavior

By the end of the model, the government obtained information on the urban safe livability degree, sorted this, and found a grid with a low degree of safe livability, whose center point was selected as the optimal construction location of a safety facility. The radius of 50 m was used as the construction range of the safety facility, which would be built uniformly and put into use in the next year [19].

3.3. Model Structure and Implementation

The simulation model for urban safe livability was divided into three stages: preparation stage, operation stage, and data management stage. These stages are shown in Figure 3.
The simulation configures agents’ attributes according to the corresponding data. The ArcGIS data [20] are converted into a two-dimensional array as the activity space of the agent. The model uses data on the urban security system, such as the living safety, fire safety, and other indicators as operating parameters. Simulation operation is the core function of the model. It mainly includes the interactive learning of residents, families, and government agents [21] and interactions among the three agents and various security facilities [22]. The three types of agents generate corresponding feedback that is based on their behavior, interactions, and follows their behavior rules [23]. By controlling agent scheduling, stating changes, clocking synchronization, and environment objects, the simulation can generate running results, provide statistical and analytical data, and finally present the data in the form of charts. The data management part guarantees that when the model is running, a large amount of dynamically changing map data, population data, key parameters, and other data are extracted, statistically analyzed, and visualized, and the latest data and agent state are saved to the memory as the model.
The simulation model for urban safe livability was written in JAVA language on the Eclipse development platform using the modeling tool Repast [24] (Recursive Porous Agent Simulation Toolkit). In addition, this model combined with ArcGIS [25,26] to realize rasterization of real geographic data and provide operable data for the model. The functions of the model include the digitization and import of the space environment (five safety index data) of agent activities. Key data (state of the agent, livability) were output and saved in appropriate file formats (Excel spreadsheet, Txt text, Mov video). In addition, spatial environment generated automatically, terrain recognized and recorded, etc. The running interface of the model is shown in Figure 4.
Above the interface is the Repast toolbar, which provides operation control functions. The first column on the left of the interface is the view bar, which contains all the viewable and data parameter control bars. The first window in the upper part of the second column on the left of the interface is a parameter setting tool to adjust the environment variables of the model; the second window in the lower part is the model running speed regulator, which controls the number of running times and the running time. The upper part of the right part of the interface is the geographical environment view, which observes the changes of multiple indicators in real time. The lower part of the right part of the interface is a statistical chart, a series of data such as the number and status of agents when the model is running, and it is displayed in the form of a line chart.
The model simulated the population of 1.5 million in Futian District. To ensure simulation efficiency, the model was run in years, in which a resident agent represented five people in reality. All population changes, satisfaction, and livability were calculated annually, and corresponding data were calculated and output at the end of the year. A lot of data that were updated in real time ended up being stored as tables. Different levels of statistical data such as safety livability, satisfaction, population density, and building coverage were represented by normalized values, which were expressed as 0–0.1, 0.1–0.2, …, 0.9–1.0 and divided into ten levels, shown in different colors. The operating parameters are shown in Table 7.

4. Scenario Simulation and Analysis of the Results

This study simulated the impact of the growth rate of the migrant population, the coverage rate of facilities, a certain number of jobs, and the number of housing units on urban safe livability, residents’ satisfaction, and urban population density.
Three scenarios were set correspondingly, and the normal conditions were first run so the model could be observed, in other words, there are four scenarios in total. Scenario 1 was a normal situation. In this scenario, the migrant population changed within the range of −5%–5%, population density was the same as indicated by the initial survey data, the number of housing units and jobs increased or decreased at a rate of 5% per year, and the government built safety facilities at a normal rate to increase the coverage rate by 0.1–0.2 per year. Then, the model simulated the development of Futian District over the next 20 years.
In scenario 2, the migrant population was taken as a change factor, and the other parameters were consistent with those used in scenario 1. The proportion of the migrant population in Futian District was adjusted to increase to 5%–15% to simulate the impact caused by a change in the migrant population.
In scenario 3, the government selected 60 grids (887 total grids) with the lowest level of livability in Futian District to build security facilities and increase the coverage rate of security facilities by 0.2–0.4 every year. The other parameters were consistent with those used in scenario 2, and the development trend over the next 20 years could be deduced according to current development.
In scenario 4, the government provided more jobs and increased the number of housing units, so that the number of jobs and housing units increased by 10% every year [27]. The other parameters were consistent with those used in scenario 3, and the influence of the number of jobs and housing units on the livability [28] and residents’ satisfaction in Futian District were observed.
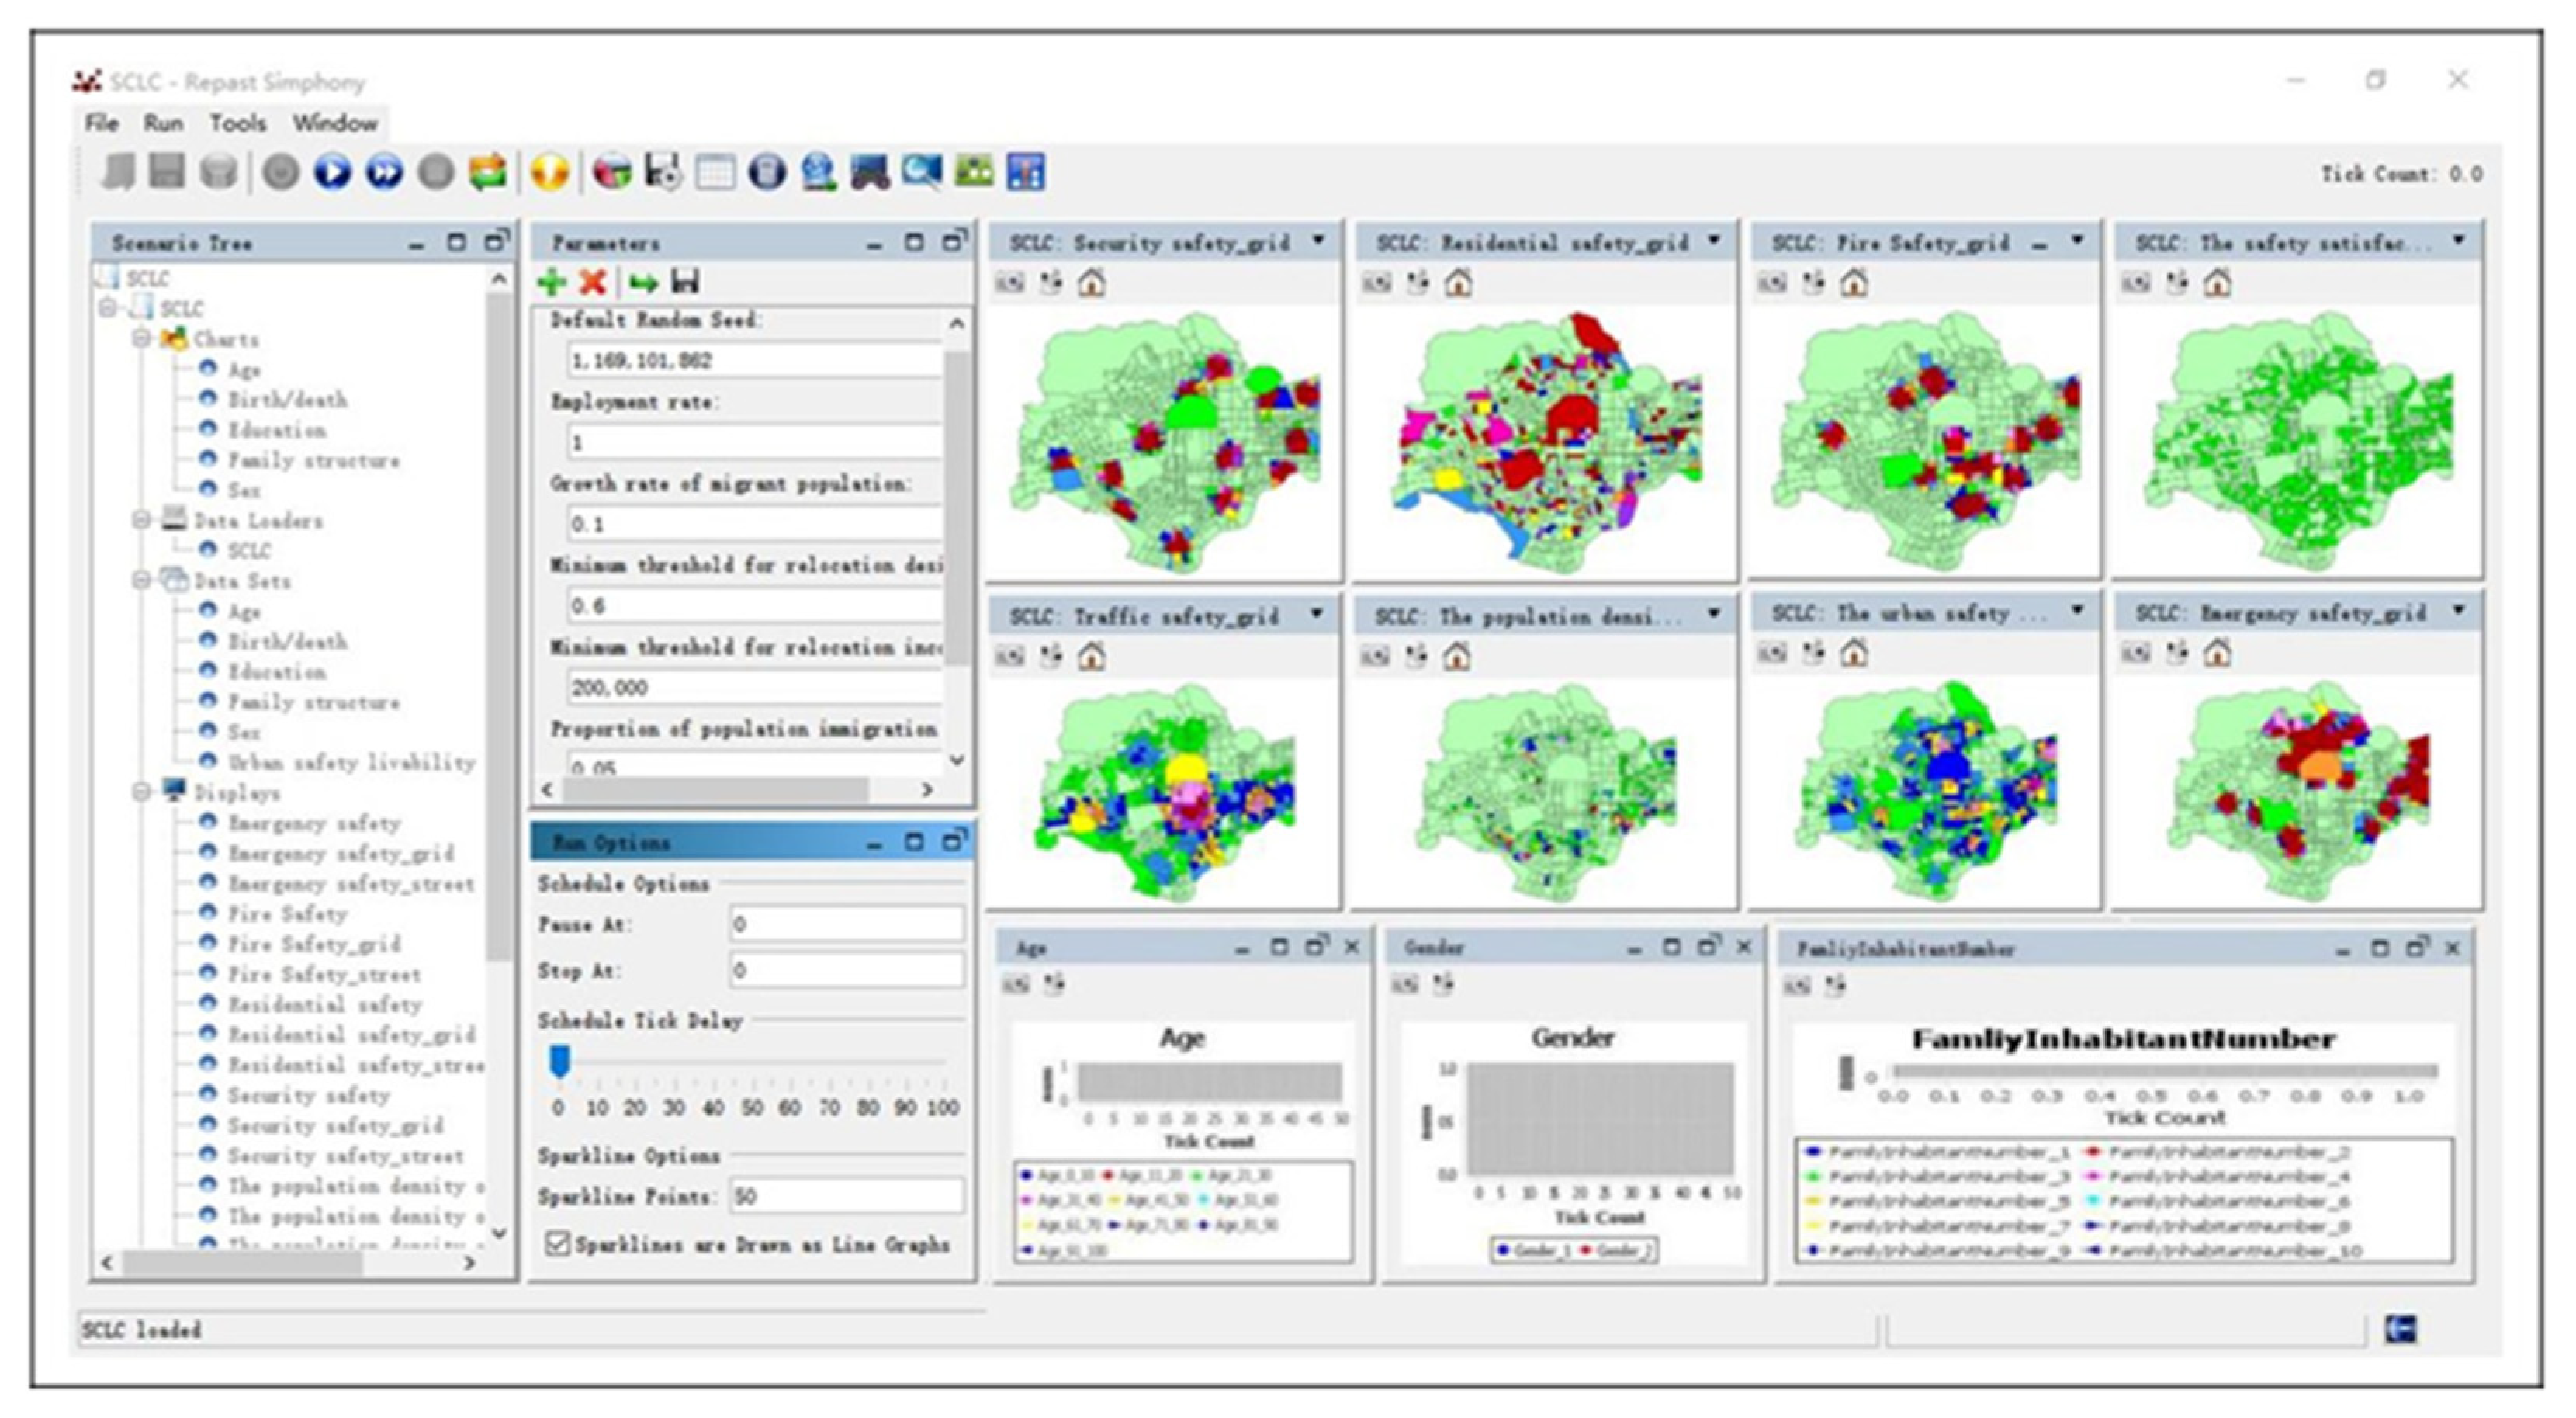
Using the above-mentioned parameter settings in the operation model, the graphs of urban population density, livability, and residents’ satisfaction in Shenzhen over the next 20 years are shown in Figure 5a–d, Figure 6a–d and Figure 7a–d, respectively. The statistical data on the degree of population density, livability, and satisfaction in Futian District were recorded and counted in the model simulation. The results are shown in Figure 8a–d, Figure 9a–d and Figure 10a–d, respectively.
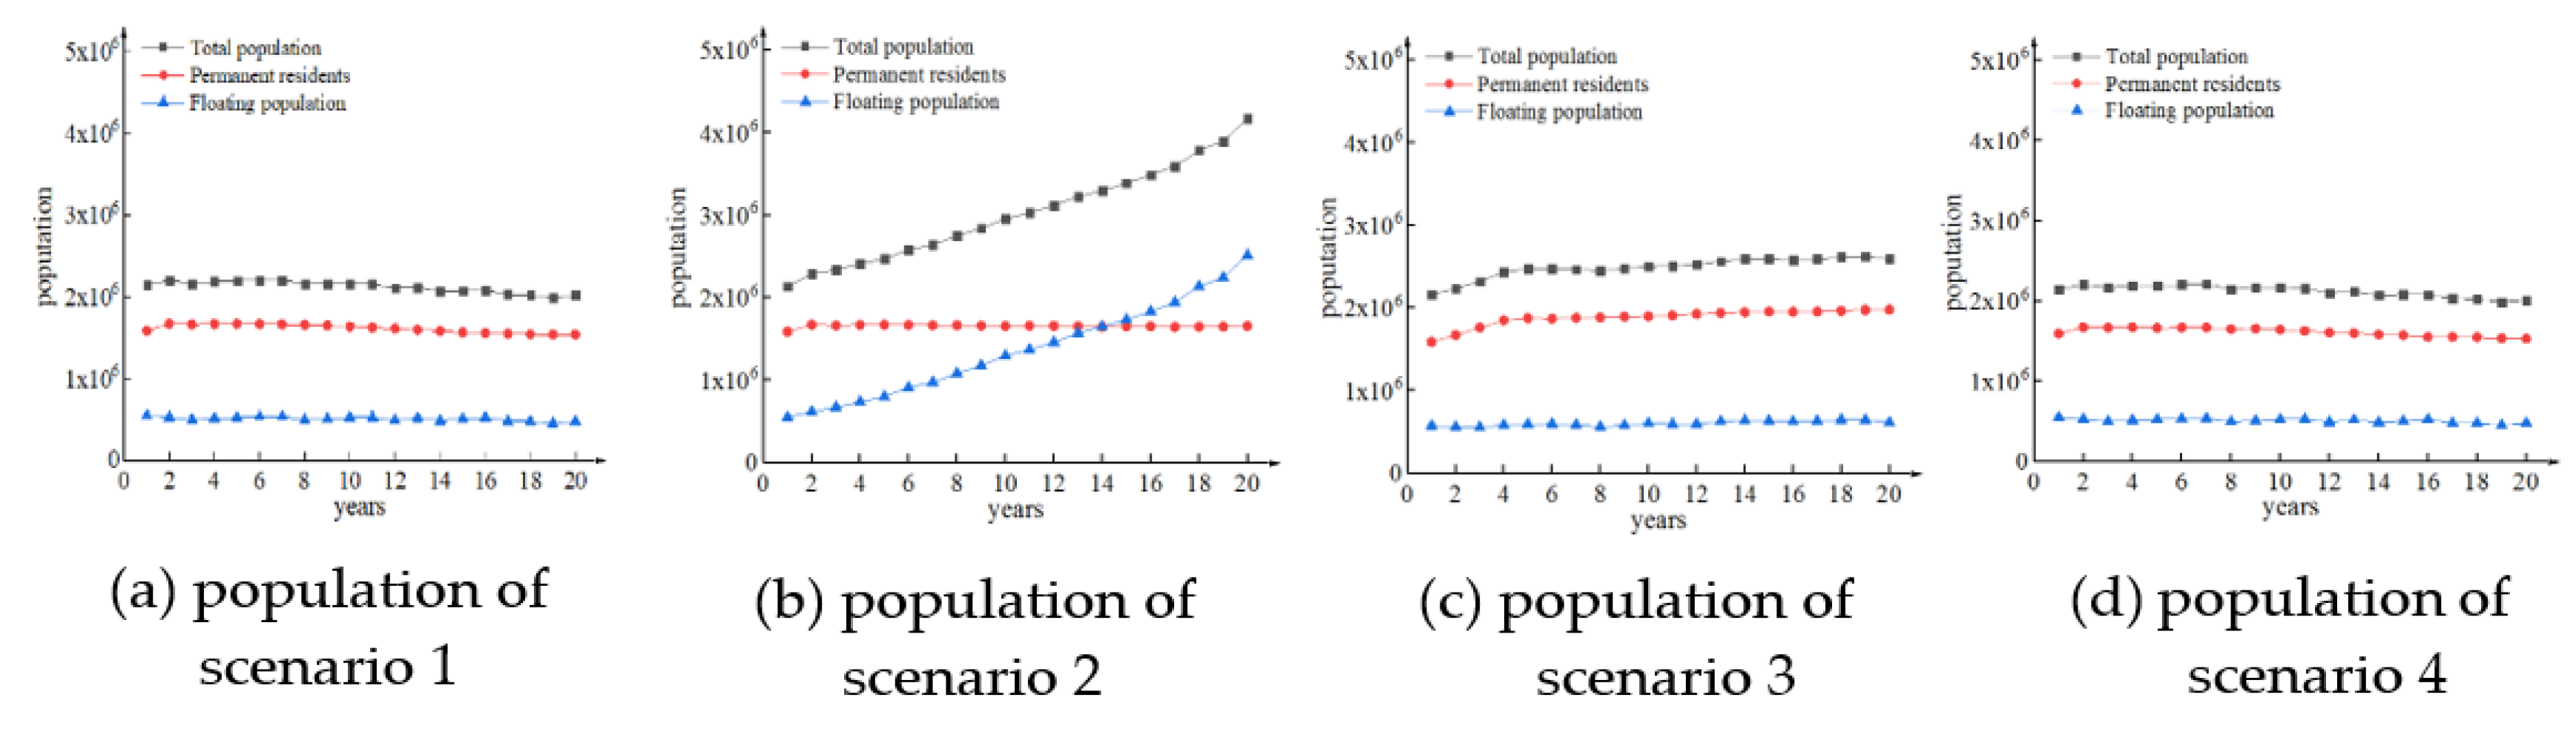
In contrast to scenario one, in scenario 2, the growth rate of the migrant population increased; therefore, the migrant population increased significantly as did the total population of Futian District. In contrast to scenario 1, the total population of this scenario increased by more than 2 million, as shown in Figure 8a,b. The overall urban safe livability and degree of satisfaction in Futian District declined over the 20 years, as shown in Figure 9b and Figure 10b. Although there was a substantial increase in the migrant population, government investment and construction remain unchanged, which made it difficult to balance security facilities resources, per capita security resources, and service capacity of security facilities declined. As a result, urban safe livability and residents’ satisfaction all decreased.
In scenario 3, the government increased its investment; the color of the operation diagram of the livability model became darker. It shows that the coverage of safety facilities in Futian District increased as a whole. Therefore, the degree of safe livability obviously improves, as shown in Figure 6c and Figure 9c. Meanwhile it can be seen from Figure 6c that the development of each street is unbalanced, and differences still exist. Thirdly, as for residents’ satisfaction, the overall trend is stable, as shown in Figure 10c and Figure 7c.
The reason for the rising trend of livability was that it was difficult to balance the existing security facilities resources due to the increase in the population. In addition, the speed of government investment in the construction of security facilities was faster than the reduction rate of per capita security facilities, offsetting reduced safe livability. Therefore, the coverall safe livability of streets in Futian District were improved. The government increased the investment in safety facilities on streets with low livability. This increased the coverage of safety facilities only to a certain extent but did not effectively improve the problem of unbalanced regional development in Futian District. Therefore, the government needs to know how the safe and livable streets in Futian District change over time. It also should take corresponding measures to address streets with a low degree of safe livability, shorten the development gap between streets, and better the unbalanced development of streets in Futian District. Then the number of safe livability streets can gradually increase.
The reason for the decline in the residents’ satisfaction in Futian District is that during this period, the increase in population led to the decrease in employment opportunities and the number of housing units. It greatly affected the happiness of the street residents, so the residents’ satisfaction declined.
Scenario 4 employed the same intensity of government investment, and more housing units and jobs were provided. The urban safe livability and the satisfaction of the residents both show an upward trend, the results of which are shown in Figure 9d and Figure 10d. The coverage rate of safety facilities in Futian District increased. It greatly improved the degree of safe livability. This scenario provided more jobs and housing units and increased the employment opportunities of residents. It also improved the happiness index, expanded living space and improved the living experience. Thus, the residents’ satisfaction improved effectively. Therefore, when planning, the government should improve the coverage of safety facilities and increase employment opportunities and the amount of housing and enhance other cultural factors. Combining the two can maximize the degree of safe livability and residents’ satisfaction.

5. Discussion

With the continuous improvement of simulation technology and computer computing capabilities, modeling and simulation based on multi-agent have become an effective way to study complex systems. Multi-agent models and virtual cities provide a new method for quantitative research on complex social problems centered on human activities. Multi-agent modeling and simulation is an important method for studying social science developed on the basis of modeling and simulation. We can utilize its bottom-up characteristics, as well as its unique advantages in studying urban livability and urban development. Driven by the simulation platform, the multi-agent model (ABM) can reproduce complex social phenomena at the macro-social level through the migration of individuals and the interaction between individuals. Such a modeling methodology that links microscopic models with macroscopic phenomena from bottom to top provides an effective platform for further analyzing the relationship between microscopic individuals and macroscopic complex phenomena. At the same time, it provides favorable support for studying and analyzing the internal mechanism of complex systems. However, due to the complexity and diversity of urban livability, using Repast to build simulation models has drawbacks [29].
The model contains tens of thousands of agents. At each iteration, all agents will participate in the calculation of income and expenditure, birth and death, jobs, population density, public facility coverage, satisfaction, and livability. The large amount of data generated needs to be updated, stored and displayed in real time, resulting in inefficient operating results. So, in the future, we need to combine complex social networks with mature modeling concepts of agents, that is, large-scale simulation, to solve the current problem of low efficiency. In addition, it is necessary to use Repast for high performance computing (Repast HPC) [30,31], combining parallel computing technology and multi-agent modeling theory. Therefore, an agent-oriented parallel computing underlying framework is constructed, and functional modules required by users are also established. This greatly shortens the development cycle and increases the operating rate.
Livable city is a comprehensive concept. It refers to a living environment with the characteristics of a safe [32] living environment, convenient public service facilities, comfortable human environment, social urban tolerance, and a healthy natural environment. In other words, livability is a comprehensive index, including five dimensions of safety, convenience, comfort, accessibility, and health. Due to the limited data, the multi-agent model [33,34,35] only took safety as an example. It gave the dynamic feedback mechanism of the interaction between residents’ decision-making behavior and safe livability under the influence of five environmental safety indicators and policies. Five environmental safety indicators included law and order, fire protection, transportation, emergency, and residential safety. In addition, resident decision-making simulations with changes in urban safe livability were implemented. This study only simulated the safety-related parameters, providing a direction for the research content of future urban livability. In addition to the safety of the city, the convenience, comfort, accessibility, and health of the city are also very important, and further data are needed. It is necessary to analyze the influencing factors and structural characteristics of the changes in livability, and the specific relationship between the dimensions of livability and the evaluation indicators and other influencing factors should be explored. We need to develop quantitative rules for evaluating sub-indicators, various influencing factors, and changes in urban livability. Finally, a comprehensive analysis is made on all aspects to establish a change model of urban livability covering five dimensions.
The urban safe livability model explored the interactions between the three types of agents, including government, households, and residents, and their interaction with the environment. The development of Futian District was simulated under four scenarios: normal conditions, increasing the growth rate of foreign population, increasing government investment, and providing a certain number of jobs and vacancies. In other words, the population trend, safe livability, and satisfaction trends of Futian District, Shenzhen in the next 20 years were simulated and obtained. By comparing the four scenarios, we found: an increased rate of growth of the migrant population, the population increased significantly, and the urban safe livability decreased. The government intervened in safety facilities, increased investment and coverage of safety facilities, thereby increasing the safe livability. Providing a certain number of jobs and vacancies could effectively improve residents’ satisfaction, and changes in residents’ satisfaction would indirectly affect the safety and livability of the city. Therefore, when the government intervenes in safety facilities while providing a certain number of vacancies and jobs, it can effectively improve safe livability and residents’ satisfaction. Then the imbalance between streets gradually improves, which is of great practical significance for the sustainable development of Shenzhen’s urban safety.

6. Conclusions

The analysis and research on the urban safe livability are of great significance to the sustainable development of cities and the progress of human society. The diversity and complexity of the natural environment and human behavior in urban systems are important problems in studying the urban safe livability. They are also the core elements and cannot be ignored. They always affect changes in the livability of cities. At the same time, the urban security system is also an extremely complicated and huge system. Livability involves many factors, including residents’ decision-making behaviors, environmental facilities configuration, and government planning and policies. Moreover, it is a multi-functional, multi-level, multi-objective, and multi-factor evaluation object. Therefore, using computer technology and appropriate modeling methods to study the interaction between many environmental factors and complex human factors in cities is very important. In addition, computer technology is of great significance for studying the safety and livability of cities.
This paper used multi-agent modeling theory to create a simulation model of urban safe livability and abstracted the three main types of agents (government agent, family agent, and resident agent) that affected the urban safe livability as research objects. The dynamic interaction feedback between agents and agents and the system environment affected the change of urban safe livability. At the same time, the change in residents’ satisfaction and the interaction between the decision behavior of relocation and the urban safe livability were both affected by many factors. By designing different scenarios, the influence of three factors on the urban safe livability of a city was simulated, and the three factors included migrant population, government investment, number of vacant houses and the number of jobs. According to the results of the model example, it can be seen that the small range of population changes did not significantly affect the overall level of urban safe livability. However, government intervention and other measures had a significant effect on improving the urban safe livability. Therefore, the main factors affecting the safety and livability of cities can be summarized. It not only provides scientific support for Futian District’s safe and livable management, but also has very important practical significance for achieving sustainable urban development.

Author Contributions

L.P. and F.Y. designed the questionnaire and model running mechanism. F.L., L.P., and S.Q. devised the structure of the model in Java and the Eclipse environment. H.Y., F.Y., and R.P. set the running rules, finished the simulation, and wrote the paper. All authors have read and agree to the published version of the manuscript.

Funding

This work was financially supported by the Strategic Pilot Science and Technology Project of the Chinese Academy of Sciences (XDA20010000), Special Fund for the Development of Strategic Emerging Industries in Shenzhen City, China (JSGG20170413173425899), major scientific and technological cooperation projects between Shanxi Province and the Chinese Academy of Sciences(20151101001), and a large-scale artificial social model simulation based on high performance computing, China (201901D111258).

Conflicts of Interest

The authors declare no conflict of interest.

References

  1. Zanella, A.; Camanho, A.S.; Dias, T.G. The assessment of cities’ livability integrating human wellbeing and environmental impact. Ann. Oper. Res. 2015, 226, 695–726. [Google Scholar] [CrossRef]
  2. Yu, Q.; Wu, W.; Tang, H.; Peng, Y.; Chen, Z.; Chen, Y. Complex System Theory and Agent-based Modeling: Progresses in Land Change Science. Acta Geogr. Sin. 2011, 66, 1518–1530. [Google Scholar]
  3. Zhan, D.; Kwan, M.P.; Zhang, W.; Fan, J.; Yu, J.; Dang, Y. Assessment and determinants of satisfaction with urban livability in China. Cities 2018, 79, 92–101. [Google Scholar] [CrossRef]
  4. Liu, J.; Nijkamp, P.; Huang, X.; Lin, D. Urban livability and tourism development in China: Analysis of sustainable development by means of spatial panel data. Habitat Int. 2017, 68, 99–107. [Google Scholar] [CrossRef]
  5. Paul, A.; Sen, J. Livability assessment within a metropolis based on the impact of integrated urban geographic factors (IUGFs) on clustering urban centers of Kolkata. Cities 2018, 74, 142–150. [Google Scholar] [CrossRef]
  6. Mesimäki, M.; Hauru, K.; Kotze, D.J.; Lehvävirta, S. Neo-spaces for urban livability? Urbanites’ versatile mental images of green roofs in the Helsinki metropolitan area, Finland. Land Use Policy 2017, 61, 587–600. [Google Scholar] [CrossRef]
  7. Khorasani, M.; Zarghamfard, M. Analyzing the Impacts of Spatial Factors on Livability of Peri-Urban Villages. Soc. Indic. Res. 2018, 136, 693–717. [Google Scholar] [CrossRef]
  8. Lai, J.Z.; Liao, S.L. Agent-based simulation method of com- plex system. Appl. Mech. Mater. 2013, 380, 1378–1381. [Google Scholar] [CrossRef]
  9. Mesimäki, M.; Hauru, K.; Kotze, D.J.; Lehvävirta, S. Application of sd-based evaluation of urban traffic habitability. Arch. Cult. 2017, 12, 176–178. (In Chinese) [Google Scholar]
  10. Saitluanga, B.L. Spatial Pattern of Urban Livability in Himalayan Region: A Case of Aizawl City, India. Soc. Indic. Res. 2014, 117, 541–559. [Google Scholar] [CrossRef]
  11. Moya, I.; Chica, M.; Saez-Lozano, J.L.; Cordon, O. An agent-based model for understanding the influence of the 11-M terrorist attacks on the 2004 Spanish elections. Knowl. Based Syst. 2017, 123, 200–216. [Google Scholar] [CrossRef]
  12. De Almeida, S.J.; Ferreira, R.P.M.; Eiras, Á.E.; Obermayr, R.P.; Geier, M. Multi-agent-modeling and simulation of an Aedes aegypti mosquito population. Environ. Model. Softw. 2010, 25, 1490–1507. [Google Scholar] [CrossRef]
  13. Bai, X.; Yan, H.; Lihu, P.; Huang, H.Q. Multi-agent Modeling and Simulation of forest Use Change ina Farming—Pastoral Zone: A Case Study of Qian Jingou Town in Inner Mongolia, China. Sustainability 2015, 7, 14802–14833. [Google Scholar] [CrossRef] [Green Version]
  14. Zhang, W.; Feng, H.; Mao, X. Research progress of urban expansion simulation based on feedback mechanism. Geogr. Geogr. Inf. Sci. 2012, 28, 70–75. (In Chinese) [Google Scholar]
  15. Jiang, W.J.; Zhong, L.; Zhang, L.M.; Shi, D.J. Dynamic Cooperative multi-agent Model of Complex System Based on Sequential Actions’ Logic. Chin. J. Comput. 2013, 36, 1115–1124. [Google Scholar] [CrossRef]
  16. Gupta, M.; Liu, J.S. Residential satisfaction and the propensity to move: An analysis of potential movers from marginal settlements in Costa Rica. Singap. J. Trop. Geogr. 2010, 1, 16–22. [Google Scholar]
  17. He, C.; Chen, T.; Mao, X.; Zhou, Y. The Economic transition, urbanization and population redistribution in China. J. Habitat Int. 2016, 51, 39–47. [Google Scholar] [CrossRef]
  18. Vuoriluoto, K.; Haugen, H.; Kiviluoto, S.; Mpindi, J.P.; Nevo, J.; Gjerdrum, C.; Ivaska, J. Vimentin regulates EMT induction by Slug and oncogenic H—Ras and migration by governing Axl expression in breast cancer. J. Oncogene 2011, 30, 1436–1448. [Google Scholar] [CrossRef] [Green Version]
  19. He, D.; Chen, X.; Shao, N. Influencing factors of family migration and residence of floating populatio-n. Urban. Iss. 2016, 24, 94–103. [Google Scholar]
  20. Zhang, X.; Fang, C.; Wang, Z. Urban construction land suitability evaluation based on improved multi-criteria evaluation based on GIS (MCE-GIS): Case of New Hefei City, China. Chin. Geogr. Sci. 2013, 23, 740–753. [Google Scholar] [CrossRef] [Green Version]
  21. Maneerat, S.; Daude, E. A spatial agent-based simulation model of the dengue vector Aedes aegypti to explore its population dynamics in urban areas. Ecol. Model. 2016, 3339, 66–78. [Google Scholar] [CrossRef]
  22. Lihu, P.; Xiaowen, L.; Shipeng, Q.; Yingjun, Z.; Huimin, Y. Multi-agent simulation model for the change of urban security habitability. J. Syst. Simul. 2019, 7, 1321–1333. (In Chinese) [Google Scholar]
  23. Zhu, Y.; Mei, S.; Zheng, T. Analysis of a major disease infection simulation system based on agent modeling. J. Syst. Simul. 2011, 23, 2505–2511. (In Chinese) [Google Scholar]
  24. Parker, J.; Epstein, J.M. A Distributed Platform for Global-Scale Agent-Based Models of Disease Transmission. ACM Trans. Model. Comput. Simul. Tomacs 2011, 22, 1–25. [Google Scholar] [CrossRef] [Green Version]
  25. Olafsson, A.S.; Skov-Petersen, H. The use of GIS-based support of recreational trail planning by local governments. Appl. Spat. Anal. Policy 2014, 7, 149–168. [Google Scholar] [CrossRef]
  26. Hossain, M.S.; Chowdhury, S.R.; Das, N.G.; Rahaman, M.M. Multi-criteria evaluation approach to GIS-based land-suitability classification for tilapia farming in Bangladesh. Aquac. Int. 2007, 15, 425–443. [Google Scholar] [CrossRef]
  27. Yan, H.; Pan, L.; Xue, Z.; Zhen, L.; Bai, X.; Hu, Y.; Huang, H.Q. Agent-Based Modeling of Sustainable Ecological Consumption for Grasslands: A Case Study of Inner Mongolia, China. Sustainability 2019, 11, 2261. [Google Scholar] [CrossRef] [Green Version]
  28. Zheng, X.; Li, F.; Song, S.; Yu, Y. Central government’s infrastructure investment across Chinese regions: A dynamic spatial panel data approach. China Econ. Rev. 2013, 27, 264–276. [Google Scholar] [CrossRef] [Green Version]
  29. Okulicz-Kozaryn, A.; Valente, R.R. Livability and subjective well-being across European cities. Appl. Res. Qual. Life 2018, 3, 1–24. [Google Scholar] [CrossRef]
  30. Najjar, A.; Serpaggi, X.; Gravier, C.; Boissier, O. Multi-agent Systems for Personalized QoE-Management. In Proceedings of the 28th International Teletraffic Congress, Würzburg, Germany, 12–16 September 2016. [Google Scholar]
  31. Gorur, B.K.; Imre, K.; Oguztuzun, H.; Yilmaz, L. Repast HPC with Optimistic Time Management. In Proceedings of the 24th High Performance Computing Symposium, Pasadena, CA, USA, 3–6 April 2016. [Google Scholar]
  32. Murphy, J.T.; Bayrak, E.S.; Ozturk, M.C.; Cinar, A. Simulating 3-D bone tissue growth using repast HPC: Initial simulation design and performance results. In Proceedings of the 2016 Winter Simulation Conference (WSC), Washington, DC, USA, 11–14 December 2016. [Google Scholar]
  33. Rastyapina, O.A.; Korosteleva, N.V. Urban safety development methods. Procedia Eng. 2016, 150, 2042–2048. [Google Scholar] [CrossRef] [Green Version]
  34. Zhu, Y.; Mei, S.; Zheng, T. Agent modeling based heavy infectious diseases simulation system analysis. J. Syst. Simulat. 2011, 23, 2505–2511. [Google Scholar]
  35. Fu, Z.; Hao, L. Agent-based modeling of China’s rural- urban migration and social network structure. Phys. A Stat. Mech. Appl. 2018, 490, 1061–1075. [Google Scholar] [CrossRef] [PubMed]
Figure 1. Street distribution in Futian District.
Sustainability 12 02070 g001
Figure 2. Interactions among, and feedback from, the factors of city livability.
Sustainability 12 02070 g002
Figure 3. Model architecture.
Sustainability 12 02070 g003
Figure 4. Operation interface diagram.
Sustainability 12 02070 g004
Figure 5. Population density change in Futian District.
Sustainability 12 02070 g005
Figure 6. Livability density change in Futian District.
Sustainability 12 02070 g006
Figure 7. Changes in urban satisfaction in Futian District.
Sustainability 12 02070 g007
Figure 8. Demographics of Futian District.
Sustainability 12 02070 g008
Figure 9. Livability statistics in Futian District.
Sustainability 12 02070 g009
Figure 10. Satisfaction statistics in Futian District.
Sustainability 12 02070 g010
Table 1. Family structure.
Family Size12345678910
Ratio0.00640.12180.23720.35900.12180.07050.03850.01920.01920.0064
Table 2. Age structure.
Age1–10 Years11–20 Years21–30 Years31–40 Years41–50 Years51–60 Years61–70 Years71–80 Years81–90 Years91–100 Years
Ratio0.07260.08940.35370.22010.14510.06510.03730.01360.00260.0005
Table 3. Occupation ratios.
VocationCivil ServantEnterpriseStaffWorkers in a CityJob-SeekerRetireeStudentSelf-Employed
Ratio0.05110.14200.18180.15910.05680.05110.11360.2445
Table 4. Wage levels.
Salary<33k–5k5k–10k10k–15k15k–20k>20k
Ratio0.16770.38320.31140.09580.02990.0120
Table 5. Weight of each evaluation index.
IndexWeight
security safety0.2571
fire safety0.2263
traffic safety0.2433
emergency safety0.1574
living safety0.1159
Table 6. Types of safety facilities.
Safety IndexSpecific Facilities
public security safetypolice stations, police rooms, security booths
traffic safetyroads, vehicles, road conditions, traffic
fire safetyfire stations, fire extinguishers
emergency securityemergency shelters, squares, open spaces
living safetydisgusting facility, garbage landfill, gas station
Table 7. Main parameters of the model.
ParameterSource of Initial ValueWeak Conjugation
Birth Rate/Death RateStatistical yearbook of ShenzhenConstant
Population DensityShenzhen institute of construction science and technologyChanges with natural population growth and migration
Facility CoverageShenzhen institute of construction science and technologyChanges according to specific situation
ForPopuGrowthRateStatistical yearbook of ShenzhenFluctuates between −0.05 and 0.05
Available House58 intra city websiteIncreases or decreases randomly within 5% to 10% every year
Available Job58 intra city websiteIncreases or decreases randomly within 5% to 10% every year
Safe WeightSurvey dataInvariant

