Article

Creating Sustainable Innovativeness through Big Data and Big Data Analytics Capability: From the Perspective of the Information Processing Theory

School of Economics and Management, Xi’an Technological University, Xi’an 720021, China
*
Author to whom correspondence should be addressed.
Sustainability 2020, 12(5), 1984; https://doi.org/10.3390/su12051984
Submission received: 9 February 2020 / Revised: 2 March 2020 / Accepted: 2 March 2020 / Published: 5 March 2020
(This article belongs to the Special Issue Big Data and Sustainability)

Abstract

:
Service innovativeness is a key sustainable competitive advantage that increases sustainability of enterprise development. Literature suggests that big data and big data analytics capability (BDAC) enhance sustainable performance. Yet, no studies have examined how big data and BDAC affect service innovativeness. To fill this research gap, based on the information processing theory (IPT), we examine how fits and misfits between big data and BDAC affect service innovativeness. To increase cross-national generalizability of the study results, we collected data from 1403 new service development (NSD) projects in the United States, China and Singapore. Dummy regression method was used to test the model. The results indicate that for all three countries, high big data and high BDAC has the greatest effect on sustainable innovativeness. In China, fits are always better than misfits for creating sustainable innovativeness. In the U.S., high big data is always better for increasing sustainable innovativeness than low big data is. In contrast, in Singapore, high BDAC is always better for enhancing sustainable innovativeness than low BDAC is. This study extends the IPT and enriches cross-national research of big data and BDAC. We conclude the article with suggestions of research limitations and future research directions.

1. Introduction

The explosive growth of big data has brought opportunities and challenges for firms to rapidly develop and improve their competitiveness and sustainability of the enterprise development [1,2]. Sustainable innovation, particularly service innovation, is a key driver of sustainable competitive advantage [2]. Studies have demonstrated that big data is an invaluable resource in the development of service innovation [2,3,4], but also places great demands on the information processing capability of firms [5]. In the innovation literature, the information processing theory (IPT) [6] suggests that it is important to consider the fit between information processing demands and information processing capability [7,8]. IPT predicts that when there is a fit between a firm’s demands for information and its information processing capability, the firm will gain greater sustainable competitive advantage. In the era of big data, the big data processing and analysis requirements have increased significantly [4]. Firms need to use advanced technologies and tools, such as deep learning [5,9] and essential analytics capability [10,11], to identify market trends and evolution patterns contained in big data. A lack of big data analytics capability (BDAC) can leave firms with unharnessed big data, resulting in increased data storage costs and greater difficulty in converting data into useful, timely information [12,13].
Big data refers to the enormous volume of rapidly and incessantly compiled data from an immeasurable variety of market, consumer, social, and other activities. The increasingly digital modern era has seen the exponential growth of big data as an important information resource [14]. However, extracting value from big data requires analysis and utilization capabilities that can translate big data into usable information and create sustainable competitive advantages in innovation [12,15]. Thus, BDAC has become the focus of many recent researches [2,5]. With BDAC, managers can gain new perspectives and technologies to improve existing theoretical knowledge, enhance decision-making capability, and promote innovation [5,10,16]. Many scholars have begun realizing the importance of fit between big data and BDAC. Isik [4] pointed out that firms can align their big data processing demands with their BDAC to effectively use big data to advance their products or competition mode. Wang and Hajli [17] using the medical industry as their research setting, constructed a theoretical model of how BDAC implements the integration, processing, and visualization of big data to achieve sustainable growth in operational, organizational, management, and strategic areas. Hao et al. [2] examined the positive moderating effect of BDAC on the relationship between big data and sustainable innovation performance. Nevertheless, few researchers have focused on the measurement and empirical testing of the fit between big data and BDAC [4] and there has been little in-depth discussion on the impact of big data/BDAC fit on service innovation.
Innovativeness is a key indicator of service innovation success, which can help firms attract new customers and obtain sustainable competitive advantages [18]. As service innovation is a process of identifying and solving problems through the integration of resources and capabilities, the degree of sustainable innovativeness is largely affected by the type and level of resources and capabilities a firm has. The rapid development of big data has provided new development opportunities for firms [11] by helping them quickly understand changing market demand, identify and create new business opportunities, and achieve successful innovation [3,12,19,20]. BDAC encompasses a firm’s ability to obtain a new strategic and operational perspective through the combination, integration, and deployment of specific big data resources [10]. The effect of the fit between big data and BDAC on sustainable innovativeness is thus very important in discussing the process of service innovation. To facilitate our study of these issues, we developed three research questions:
RQ1: Do fits (the fit between high big data and high BDAC and the fit between low big data and low BDAC) increase sustainable innovativeness more than misfits (the misfit between high big data and low BDAC and the misfit between low big data and high BDAC) do?
RQ2: Does high-high fit (the fit between high big data and high BDAC) increase sustainable innovativeness more than low-low fit (the fit between low big data and low BDAC) does?
RQ3: Does low-high misfit (the misfit between low big data and high BDAC) increase sustainable innovativeness more than high-low misfit (the misfit between high big data and low BDAC) does? Or is the reverse true?
To answer these three questions, we draw on the IPT to develop a theoretical model of the effects of fits and misfits between big data and BDAC on sustainable innovativeness. We consider two types of alignments (fits): the fit between high big data and high BDAC (high-high fit) and the fit between low big data and low BDAC (low-low fit). We also evaluate two types of misfits: the misfit between high big data and low BDAC (high-low misfit) and the misfit between low big data and high BDAC (low-high misfit) (see Figure 1). Therefore, we examine four possible scenarios: high-low misfit, high-high fit, low-low fit, and low-high misfit.
We empirically test the theoretical model and conduct a three-country comparative study to assess its cross-national applicability by collecting data from 477 new service development (NSD) projects in the United States, 632 NSD projects in China, and 294 NSD projects in Singapore. We use dummy regression method to analyze the data.
Our study results suggest: (1) For the United States, China, and Singapore, high-high fit has the greatest impact on sustainable innovativeness. (2) For China, sustainable innovativeness is higher when big data and BDAC align (either high-high fit or low-low fit). Managers of NSD projects in China should increase big data and BDAC simultaneously to ensure that they are always in balance. (3) For the United States and Singapore, when either big data or BDAC is at a low level, fit is not always better than misfit. The U.S. NSD projects should strive to improve the level of big data, while Singapore NSD projects should focus on improving BDAC to achieve greater sustainable innovativeness.
We make three theoretical contributions to the literature on sustainability of big data application and sustainable development theory: (1) We enrich research on the IPT by extending its application to the context of big data and BDAC, defining information processing demands as big data and information processing capability as BDAC. (2) We expand the empirical research on big data and BDAC by exploring the impact of fits and misfits between big data and BDAC on sustainable innovativeness. (3) We contribute to cross-national comparative research on sustainability of big data and BDAC. Through empirical comparative analysis of data from the United States, China, and Singapore, we find different impacts of fits and misfits between big data and BDAC on sustainable innovativeness. The study results not only promote the application of the IPT to study of sustainability of big data but also provide specific management suggestions for firms in different countries to improve sustainable innovativeness through appropriate investment strategies for big data and BDAC.

2. Theoretical Background and Framework

2.1. Information Processing Theory (IPT)

The IPT regards a firm as an open social system that constantly exchanges information with the external environment and utilizes that information in business activities [7,8]. Galbraith [8] described the IPT as having three core concepts: information processing demand, information processing capability, and the fit between this demand and capability. On the one hand, firms can reduce information processing demand by increasing slack resources, but this strategy increases costs for firms. On the other hand, firms can increase the availability of usable information to support decision- making by improving information processing capability [7]. When the information processing capability (collection, transformation, storage, and exchange of information) fit with the firm’s demand for information processing, the firm can obtain sustainable competitive advantage. Since the IPT was first proposed, many scholars have conducted research from the perspective of information processing to explore the impact of fit between the demand for information and information processing capability on firm performance. Most of the early research focused on strategy, structural design of the organization or team, and supply chain management [21,22]. More recently, scholars have applied the IPT to multiple research fields, including operations management, new product development, international management, and knowledge management, which has further expanded the applicability of the IPT [6,23,24]. However, most studies have applied the IPT to explore the fit between the traditional needs for information and information processing capabilities [21,24], with few studies considering the IPT in the context of big data and BDAC.
With the pervasiveness of big data in operations and organizational development, there is also very high demand for specialized information processing capabilities. In the face of the rapidly changing market environment, the value of big data is fleeting, and firms need timely and effective analysis to mine the information resources in the big data [19]. There is no inevitable relationship between the acquisition of information and the improvement of firm performance, only effective use of the information can lead to improved profitability. The IPT considers the effective allocation and coordination of a firm’s resources and capabilities such as how the adaptation and promotion of different elements within a firm can effectively advance innovation activities [25]. BDAC provides new information processing methods and technologies that enable firms to translate big data into new information that can be used in different ways and promote sustainable service innovation. Although some scholars have emphasized the importance of fit between big data processing demands and big data processing capability based on the IPT [4], there is a lack of in-depth empirical testing and consideration of the impact of fit in the field of service innovation. Therefore, in this study, we apply the IPT by treating big data as the information processing demand of firms and BDAC as the important information processing capability of firms, and discuss the impact of fit between big data and BDAC on sustainable innovativeness in the process of service innovation.

2.2. Big Data

There is still no consensus on a definition of big data because of the wide range and rich meaning it comprises [2]. Simply, big data refers to the large-scale data sets produced by new technology forms. A deeper characterization of big data considers the sources and composition of these data sets [1,3,10,14,19]. McAfee and Brynjolfsson [1] proposed that big data can be characterized according to the 3V’s of volume, variety, and velocity. Other scholars have added two additional V’s of veracity and value [14,26]. In this study, we define big data as large, complex, and real-time data streams that require complex management, analysis, and processing techniques to extract valuable information [10]. However, the real value of big data lies not only in its large quantity but also, more importantly, in its differences from traditional data. Big data has created a new and unique data generation and use environment, which is not possible with a small amount of data [3,27].
Since the rise of the Internet and the digital economy, big data has become the most important technological change in business and academia, bringing considerable benefits to business, scientific research, public management, and other industries [1,2]. Many scholars have proposed that big data is one of the most important resources for firms to achieve sustainable development [26,28]. For example, big data can use production processes and supplier information to increase productivity, reduce cost losses, and achieve sustainable corporate development [5]. Big data pervades modern life, transforming thinking and decision-making methods and becoming an important strategic resource for firms to achieve sustainable development [28]. Furthermore, as technology advances, the costs of big data storage and BDAC technologies gradually decline, allowing more firms to realize the importance of using and quantifying big data to enhance their competitive advantage [29].
Scholars have discussed the value of big data for firms from different perspectives. First, big data is helpful for firms to understand market and demand information. It also provides new perspectives for problem solving and enables firms to recombine existing resources and elements to efficiently enhance firm innovation [30]. Big data also provides a database of timely information to guide innovation activities, helping firms accurately predict market demand changes in a rapidly changing environment, enabling quick response to market demand, and suggesting new development directions and goals [3,19]. Second, the information provided by big data can enable managers to make scientifically supported, high-quality decisions based on big data analytics rather than intuition and experience [11,19]. The operational management perspective and new management knowledge provided by big data can help managers make more efficient decisions [11]. Third, big data can help managers better understand the information related to the market environment, customer demand, and product characteristics and thereby improve the efficiency of operation processes [20,31]. The basic information source provided by big data for managers can improve the efficiency of internal information sharing and the operational outcome of firms [20]. In supply chain management, big data can also help firms respond to the changing environment more quickly, reduce management costs, and improve the efficiency of firm operation planning [31]. Finally, big data can help firms identify opportunities and develop new business models to determine effective actions and strategies for successful innovation [20,32].

2.3. Big Data Analytics Capability (BDAC)

With the growth of big data, firms have access to huge and diverse databases. Scholars introduced the term data science to refer to the endeavor of effectively analyzing and visualizing the trends and models contained in big data [5]. BDAC describes the tools and means employed to generate information and knowledge from big data [14,26]. At present, most scholars define BDAC from two perspectives: the resource-based view perspective and big data utilization process perspective. From the perspective of the resource-based view, BDAC is an information technology capability that provides perspective to firms by using data management, infrastructure, and human resources to gain competitive advantage in the big data environment [14,33]. From the perspective of using big data to create business value and scientific decision-making in business processes, BDAC describes the ability of firms to analyze big data in planning, production, and transmission, thus enabling firms to acquire, store, process, and analyze a large amount of data in various forms and extract valuable, timely information [17,26]. In this study, we follow the research of [10] and define BDAC as the capability of firms to combine, integrate, and deploy specific big data resources.
With the increasing importance of big data to firms, many scholars and managers have been exploring how to make better use of BDAC to gain sustainable competitive advantage [26]. Research on BDAC can be divided into the following four aspects: First, BDAC can significantly improve firm performance [10,11,14,33]. In the context of big data, effective combination of organizational structure, infrastructure, human capital, and other resources can help firms to obtain high-level competitive advantage [14]. Second, BDAC can significantly affect the organizational agility of firms and improve their capability to cope with environmental changes. BDAC can help managers accurately grasp the rapidly changing market environment and propose corresponding business plans and solutions to gain sustainable competitive advantage [14,15,34]. Third, BDAC promotes the improvement of innovativeness of firms [16]. Rialti et al. [35] pointed out that BDAC can help firms to reintegrate existing resources and routines to discover and take advantage of new opportunities and develop innovative solutions to positively influence the innovation of firms. Fourth, BDAC can change business processes and management modes, promote effective allocation and control of resources, and realize business model innovation [17,30].

2.4. Sustainable Innovativeness

Innovativeness is an important measure of successful new product development, which is usually described from the perspective of firms or customers [36]. As new service products are the main achievements of NSD of firms, we draw from the results of previous research on product innovativeness to define sustainable innovativeness as the degree of novelty of new service products compared with existing service products and markets of firms [37,38].
NSD has become a key activity for firms to obtain sustainable development in a competitive market environment. Sustainable innovativeness is the key factor of service innovation and one of the important sources of sustainable competitive advantage. Therefore, the influencing factors of sustainable innovativeness are of great interest to scholars and managers [39]. From the resource-based view, relevant resources and information will significantly improve product innovativeness. The market information owned by firms can help them effectively evaluate customer demand and market trends and integrate them into the production of new service products, so as to develop new and distinctive products [40]. Cillo et al. [41] pointed out that different analysis methods of market information will have different effects on product innovativeness while Song et al. [38] found that the marketing resources and research and development (R&D) resources of new ventures have no significant impact on product innovativeness. Retrospective analysis of market information will negatively affect product innovativeness, and prospective analysis of market information will positively affect product innovativeness [41].
Previous research has considered the influencing factors of sustainable innovativeness from the perspective of the firm’s capability to process resources and information, proposing that the firm’s capability will affect sustainable innovativeness [18,39]. However, the relationship between a firm’s knowledge integration mechanism and product innovativeness may not be a simple linear one; instead some scholars have found that there is an inverted U-shaped relationship between them. Overemphasis on knowledge synthesis, configuration, and applicable formal processes and structures among team members can hinder the improvement of product innovativeness [42].
Many studies have found that information and resources are the key influencing factors of product innovativeness. Extending these findings to the context of big data, the key to extracting value from big data lies in the mining and analysis of big data by BDAC [10,19] and the key to the effective implementation of BDAC lies in having sufficient big data resources [13]. Nevertheless, there has been little in-depth examination of the fit between big data and BDAC, in particular with regard to the impact mechanism of such fit on sustainable innovativeness. As a result, firms lack research-based guidance on how to effectively maximize the value of their existing big data resources and BDAC in service innovation. Therefore, pursuing research on the impact of fit between big data and BDAC on sustainable innovativeness has important theoretical and practical significance.

3. Research Hypotheses

When there is fit between big data and BDAC, firms can fully mine their big data resources for valuable information to build their knowledge base, improve the scientific basis and quality of decision-making, and promote sustainable innovativeness. Based on the IPT, the fit between the demand for information and information processing capability will result in more effective output [7]. Therefore, attaining fit between big data and BDAC can help NSD projects achieve successful innovation activities more effectively and produce totally new service products that are novel and accepted by customers, thus building sustainable development.
In the case of high-high fit, NSD project teams have access to a large amount of big data and the high level of BDAC allows them to effectively analyze these data resources to obtain market and customer demand information, clarify the development trend of service innovation [1,14,33], and ultimately design novel service products [1].
In the case of low-low fit, the low level of big data leaves project teams unable to fully grasp the changes in market demand [3] but also reduces the cost of information storage and the pressure of information overload. At the same time, project teams can use the same level of BDAC to deeply mine the data they have to acquire information that helps them identify service innovation market segments, find the invention approaches to service innovation, and develop service products that can have an important impact on the existing industry [16].
When there are misfits between big data and BDAC, project teams cannot effectively balance big data resources and BDAC, which places project developers in the dilemma of a data storm that affects their cognitive ability and decision-making quality [13]. Big data/BDAC misfit also increases the cost of data storage, resulting in resource waste [7,12]. In the case of high-low misfit, although project teams have a large amount of data, they lack BDAC and thus can merely interpret the data. In this situation, the task of converting so much data into timely, usable information is difficult and overwhelming [14], which can affect the accuracy of analysis of market trends and easily lead to blind development and, ultimately, failure of service innovation [16].
In the case of low-high misfit, project managers have enough data mining technology to process, analyze, and visualize big data [34], but they have access to few data resources and thus lower requirements for BDAC. Such an imbalance will not only suppress sustainable innovativeness of service products but also cause redundancy and waste of resources [7], hindering the innovation activities of project teams. Thus, it is apparent that the roles of big data and BDAC are restricted by each other. We therefore hypothesize:
Hypothesis 1 (H1). 
Fits (the fit between high big data and high BDAC and the fit between low big data and low BDAC) improve sustainable innovativeness more than misfits (the misfit between high big data and low BDAC and the misfit between low big data and high BDAC) do.
Although fit between big data and BDAC may be more beneficial than misfit, there are differences in the impact on sustainable innovativeness between high-high fit and low-low fit. High levels of both big data and BDAC enable project managers to use advanced analysis technologies to accurately discover and classify important information from a massive variety of big data to identify new needs of users or determine new market opportunities [33]. With such high-quality, timely information [10], project managers can refine their goals for service innovation and achieve the leading position of service product innovation in their industries.
In the case of low-low fit, because the project managers have a low stock of big data, they lack timely and relevant information sources. Due to the low capability of data mining and analysis, project teams are unable to fully grasp insights into market developments and service innovation and thus suffer from a lack of service innovation inspiration and sustainable innovativeness [1,12]. We therefore hypothesize:
Hypothesis 2 (H2). 
High-high fit (the fit between high big data and high BDAC) improves sustainable innovativeness more than low-low fit (the fit between low big data and low BDAC) does.
When there are misfits between big data and BDAC, low-high misfit can improve sustainable innovativeness more than high-low misfit can. In the case of low-high misfit, although project managers do not have enough big data, the high level of BDAC can help them accurately find and sort out relevant information from existing data, design service innovation process and operation measures, recombine existing resources according to market demand, update product technology and functions [10,30], and otherwise maximize the value of their limited big data resources. Even with a lower level of big data, firms with advanced BDAC can carry out prospective analysis on existing market information, predict market environment and development directions, clarify the direction of service innovation, and effectively improve sustainable innovativeness [41].
In contrast, in the case of high-low misfit, although project managers have a large amount of big data, they lack the capability to extract information on market demand trends and predictions about consumption behavior, so they cannot effectively integrate and analyze the big data they have, resulting in the lack of innovation spirit and the inability to accurately assess the direction of service innovation [16]. Compared with low-high misfit, high-low misfit not only causes waste of resources and increases the cost burden of project managers [12] but creates the dilemma of dealing with too much information [16]. At the same time, big data itself will not be the source of differentiation advantage for project teams [10] because compared with the big data resources owned by project teams, BDAC is the key advantage to effectively utilizing market and customer information [14]. We therefore hypothesize:
Hypothesis 3 (H3). 
Low-high misfit (the misfit between low big data and high BDAC) improves sustainable innovativeness more than high-low misfit (the misfit between high big data and low BDAC) does.

4. Methodology and Data Sources

The data for the U.S. and China come from the research project conducted by Hao et al. [2]. The details of the research methodology and data are described in Hao et al. [2]. For completeness, we rephrase their descriptions here. The research design includes three empirical studies. We empirically test the theoretical model of the impact of fit between big data and BDAC on sustainable innovativeness using data from 477 U.S. NSD projects. We then test the generalizability of the model and compare the similarities and differences between the United States and two other countries by conducting two empirical studies to collect data from 632 NSD projects in China and 294 NSD projects in Singapore, respectively [2]. We report these three empirical studies separately below.
As reported in Hao et al. [2], to develop and refine the study measures, the research team followed the cross-national research methodology recommended by [43] to conduct in-depth interviews with NSD teams in the United States, China, and Singapore. The final study measures and sources of the measures are reported in the Appendix A.

4.1. Empirical Study 1: The United States

4.1.1. Measurement

Different from the measures used by Hao et al. [2], the measurement scale for big data in this article includes five items that are adopted from Gupta and George [10]: (1) “We have access to very large, unstructured, or fast-moving data for analysis”; (2) “We integrate data from multiple internal sources into a data warehouse or mart for easy access”; (3) “We integrate external data with internal data to facilitate high-value analysis of our business environment”; (4) “Our big data analytics projects are adequately funded”; and (5) “Our big data analytics projects are given enough time to achieve their objectives”. Project team leaders rated their agreement or disagreement with these descriptions on a scale ranging from 0 (strongly disagree) to 10 (strongly agree). Based on factor analyses, item 5 was deleted.
The measurement items for BDAC are adopted from Hao et al. [2]. The specific measures are reproduced in the Appendix A. A sample measure is “We have advanced tools (analytics and algorithms) to extract values of the big data”. Project team leaders rated their team’s capabilities on a scale ranging from 0 (no capability) to 10 (very high level of capability).
We adapted the five measurement items for sustainable innovativeness from Song and Parry [37]. As presented in Appendix A, minor modifications were made to the measures based on the in-depth interviews and pretests. The final measures are: (1) “The products and services incorporate innovative technologies that have never been used in the industry before”; (2) “The products and services caused significant changes in the whole industry”; (3) “The products and services are among the first of their kind to be introduced into the market”; (4) “The products and services are highly innovative—totally new to the market”; (5) “The products and services are perceived as being the most innovative in the industry”. Project team leaders rated their team’s sustainable innovativeness in these areas on a scale ranging from 0 (strongly disagree) to 10 (strongly agree).

4.1.2. Data

As reported in Hao et al. [2], we chose 1000 U.S. firms from the Dun and Bradstreet database. We used the same data collection procedure as reported in Hao et al. [2]. We sent, via express mail and e-mail, a package/e-mail that included a personalized letter, the study survey, a pre-signed non-disclosure agreement (NDA), and (for the mail package) a prepaid return envelope. We asked each participating firm to select four different NSD projects for providing data: a “successful” NSD project, a “failure” NSD project, a typical NSD project, and a recent NSD project. We sent a follow-up letter/e-mail a week later. In addition, we sent second and third follow-up letters/e-mails and made phone calls to nonresponding firms to improve the response rate.
For this study, we selected all 477 NSD projects collected using the above procedure. The final data included 46 projects in hotel, traveling, and tourism services; 146 projects in banking, insurances, securities, financial investments, and related activities; 99 projects in information and semiconductor; 95 projects in Internet-related services; and 91 projects in health care services [2].

4.1.3. Analysis and Results

Table 1 shows the mean, standard deviation, correlations, and construct reliability for the U.S. sample. The values on the diagonal are Cronbach’s alpha coefficients for each variable, which are all above the threshold value of 0.7, indicating that the study measures we employed have high reliability.
We also conducted exploratory factor analysis of the scale items. Table 2 shows the factor loadings for the U.S. sample. For each measure to be included in the final analyses, it must load to the correct factor with loading greater than 0.5 and must have no cross-loadings with loading greater than 0.4 in all three empirical studies. Item 5 of big data and item 3 of BDAC did not meet the requirements and were deleted from the final analyses. The factor loadings of the remaining measures for the U.S. sample are presented in Table 2. All final measures loaded correctly into the corresponding factor.
Before regression analysis, we used the sample mean value of big data (5.315) and the sample mean value of BDAC (6.044) to divide the 477 NSD projects into four scenarios: two fits (high-high fit and low-low fit) and two misfits (high-low misfit and low-high misfit), as shown in Figure 2.
We used ordinary least squares (OLS) dummy regression to test the effect of two fits and two misfits on sustainable innovativeness. Proc Reg of SAS 9.4 was used to provide estimates. As four independent variables (two fits and two misfits) represent four dummy variables, option “noint” was included in the model statement of the “Proc Reg” to exclude the intercept term in the “Proc Reg” estimations. The estimated coefficients were the effects of fits and misfits on sustainable innovativeness under four scenarios. To test the three hypotheses, we used the “TEST” statement of the “Proc Reg Model” to examine whether or not the coefficients estimated in the model were significantly different from each other as hypothesized. We tested for possible differences of all six possible pairs and the results were all significant (p < 0.01).
Table 3 displays the final estimates. The results in Table 3 indicate that both fits and misfits have significant positive impact on the sustainable innovativeness of NSD projects in the United States. The results from six paired-wise tests indicate that these effects differ from each other (p < 0.01). To examine whether or not each hypothesis is supported, we use the standardized estimates and the results of the paired-wise tests.
As predicted by H1, the effect of high-high fit on sustainable innovativeness (b = 0.701; p < 0.01) is the greatest. However, counter to H1, the positive effect of high-low misfit on sustainable innovativeness (b = 0.400; p < 0.01) is greater than that of low-low fit (b = 0.384; p < 0.01). Thus, H1 is only partially supported by the data.
The results suggest that the effect of high-high fit on sustainable innovativeness (b = 0.701; p < 0.01) is significantly higher than that of low-low fit (b = 0.384; p < 0.01). Thus, as predicted by H2, high-high fit increases sustainable innovativeness more than low-low fit does (p < 0.01). The data provide supports for H2.
H3 predicts that low-high misfit improves sustainable innovativeness more than high-low misfit does. Counter to H3, the results in Table 3 indicate that the effect of low-high misfit on sustainable innovativeness (b = 0.340; p < 0.01) is significantly lower, not higher (as hypothesized by H3), than that of high-low misfit (b = 0.400; p < 0.01). Thus, H3 is not supported by the U.S. data.

4.2. Empirical Study 2: China

4.2.1. Measurement Validation in Empirical Study 2

As reported in Hao et al. [2], all measures were translated into Chinese using the double-translation method [2] using four translators. Minor differences were discussed and resolved. Two pretests were performed to evaluate the appropriateness of formats and accuracies using the participants of the earlier interviewees. After pretests, minor modifications were made to formatting and wordings to create the final survey [2].

4.2.2. Data

As reported in Hao et al. [2], to ensure comparability with the sample of the United States, 524 companies listed in the Small and Medium Enterprise and Growth Enterprise Market Boards of the Shenzhen Stock Exchange in China were chosen as initial sampling frame. These companies were further reduced to 482 companies to match with the sample from the United States after deleting all companies with missing data. The details of the data collection were reported in [2]. This study used all 632 NSD projects from the dataset. The final data included 40 from hotel, traveling, and tourism services; 217 from banking, insurances, securities, financial investments, and related activities; 120 from information and semiconductor; 91 from Internet-related services; and 164 from health care services [2].

4.2.3. Analysis and Results

Table 4 shows the descriptive statistics and correlation coefficient matrix of each variable for the Chinese sample. The values on the diagonal are the Cronbach’s alpha coefficients of each variable, all of which are greater than 0.7, indicating high reliability of our study measures. To ensure the cross-national comparability of the data between China and the United States, we retained the same measurement items for factor analysis as in the U.S. analysis. Table 5 shows the factor loadings of each variable, which are all greater than 0.6, indicating high structural validity of the measurement items.
Following analysis of the U.S. sample, we used the mean values of big data and BDAC to divide the sample of Chinese NSD projects into four scenarios: two fits (high-high fit and low-low fit) and two misfits (high-low misfit and low-high misfit), as shown in Figure 3.
We used OLS dummy regression analysis to test the impacts of the two fits and the two misfits on sustainable innovativeness. Table 6 shows the results of dummy regression analysis. To test the three hypotheses, we used the “TEST” statement of the “Proc Reg Model” to examine whether or not the coefficients estimated in the model were significantly different from each other as hypothesized. We tested for possible differences of all six possible pairs and the results were all significant (p<0.01).
Our results show that both fits and misfits between big data and BDAC have significant positive impacts on sustainable innovativeness in China. The results from six paired-wise tests indicate that these effects differ from each other (p < 0.01). To examine whether or not each hypothesis is supported, we use the standardized estimates and the results of the paired-wise tests.
Results in Table 6 indicate that the positive effects of high-high fit (b = 0.688; p < 0.01) and low-low fit (b = 0.427; p < 0.01) on sustainable innovativeness are greater than for high-low misfit (b = 0.329; p < 0.01) and low-high misfit (b = 0.360; p < 0.01). Therefore, when there is a fit between big data and BDAC, NSD projects can achieve higher sustainable innovativeness. Thus, H1 is supported by the Chinese data.
Consistent with H2, the effect of high-high fit (b = 0.688; p < 0.01) on sustainable innovativeness is higher than that of low-low fit (b = 0.427; p < 0.01), indicating that NSD projects with high levels of both big data and BDAC can achieve higher sustainable innovativeness. Thus, H2 is also supported by the data.
As predicted by H3, the positive effect of low-high misfit (b = 0.360; p < 0.01) on sustainable innovativeness is greater than that of high-low misfit (b = 0.329; p < 0.01). Therefore, H3 is also supported by the Chinese data.

4.3. Empirical Study 3: Singapore

4.3.1. Measurement Validation

To collect data in Singapore, we used the same measurement items as for the U.S. sample. As in the Chinese sample, we distributed the study survey to 42 executives to conduct a pretest to ensure that the expression of each item would be accurately understood by the participants in Singapore. We made minor modifications on the formatting of the survey based on their feedback.

4.3.2. Data

To ensure comparability with the U.S. and China sample, companies were selected from the Singapore Stock Exchange and supplemented with a list of members of four business associations in Singapore. The data collection procedures described in the U.S. sample were adopted in Singapore. We ultimately collected complete data for 294 NSD projects: 14 NSD in hotel, traveling, and tourism services; 102 NSD in banking, insurances, securities, financial investments, and related activities; 62 NSD in information and semiconductor; 46 NSD in Internet-related services; and 70 NSD in health care services.

4.3.3. Analysis and Results

The same data analyses are used to analyze the Singapore data. Table 7 shows the descriptive statistics and correlation coefficient matrix of each variable for the Singapore sample. The values on the diagonal are the Cronbach’s alpha coefficient for each variable, all of which are above 0.7, confirming the high validity of our study measures. We also conducted factor analysis of the scale items. As shown in Table 8, all factor loadings are between 0.641 and 0.884, indicating high structural validity of our measurement scale.
Following Study 1 and 2, we used the mean values of big data and BDAC to divide the Singapore sample into fits (high-high fit and low-low fit) and misfits (high-low misfit and low-high misfit) categories as shown in Figure 4.
We then used OLS dummy regression analysis to test the impacts of the fits and misfits between big data and BDAC on sustainable innovativeness. To test the three hypotheses, we used the “TEST” statement of the “Proc Reg Model” to examine whether or not the coefficients estimated in the model were significantly different from each other as hypothesized. The results shown in Table 9 reveal that the fits and misfits between big data and BDAC have significant positive impacts on sustainable innovativeness. The results from six paired-wise tests indicate that these effects differ from each other (p < 0.10).
To examine whether or not each hypothesis is supported, we used the standardized estimates and the results of the paired-wise tests. The results in Table 9 indicate that high-high fit (b = 0.684; p < 0.01) has the greatest impact on sustainable innovativeness. However, counter to H1, the positive effect of low-low fit (b = 0.399; p < 0.01) on sustainable innovativeness is lower, not higher, than that of low-high misfit (b = 0.406; p < 0.01). Thus, H1 is only partially supported by the Singapore data.
We further find that the effect of high-high fit (b = 0.684; p < 0.01) on sustainable innovativeness is greater than that of low-low fit (b = 0.399; p < 0.01), indicating that H2 is supported by the Singapore data.
The date also shows that as predicted by H3, the effect of low-high misfit (b = 0.406; p < 0.01) on sustainable innovativeness is greater than that of high-low misfit (b = 0.264; p < 0.01). Thus, H3 is supported by the Singaporean data.

4.4. Summary of Hypothesis Testing for All Three Empirical Studies

Table 10 summarizes the results of the six paired-wise tests for three empirical studies. The results suggest the following results of the effects of fits and misfits on innovativeness:
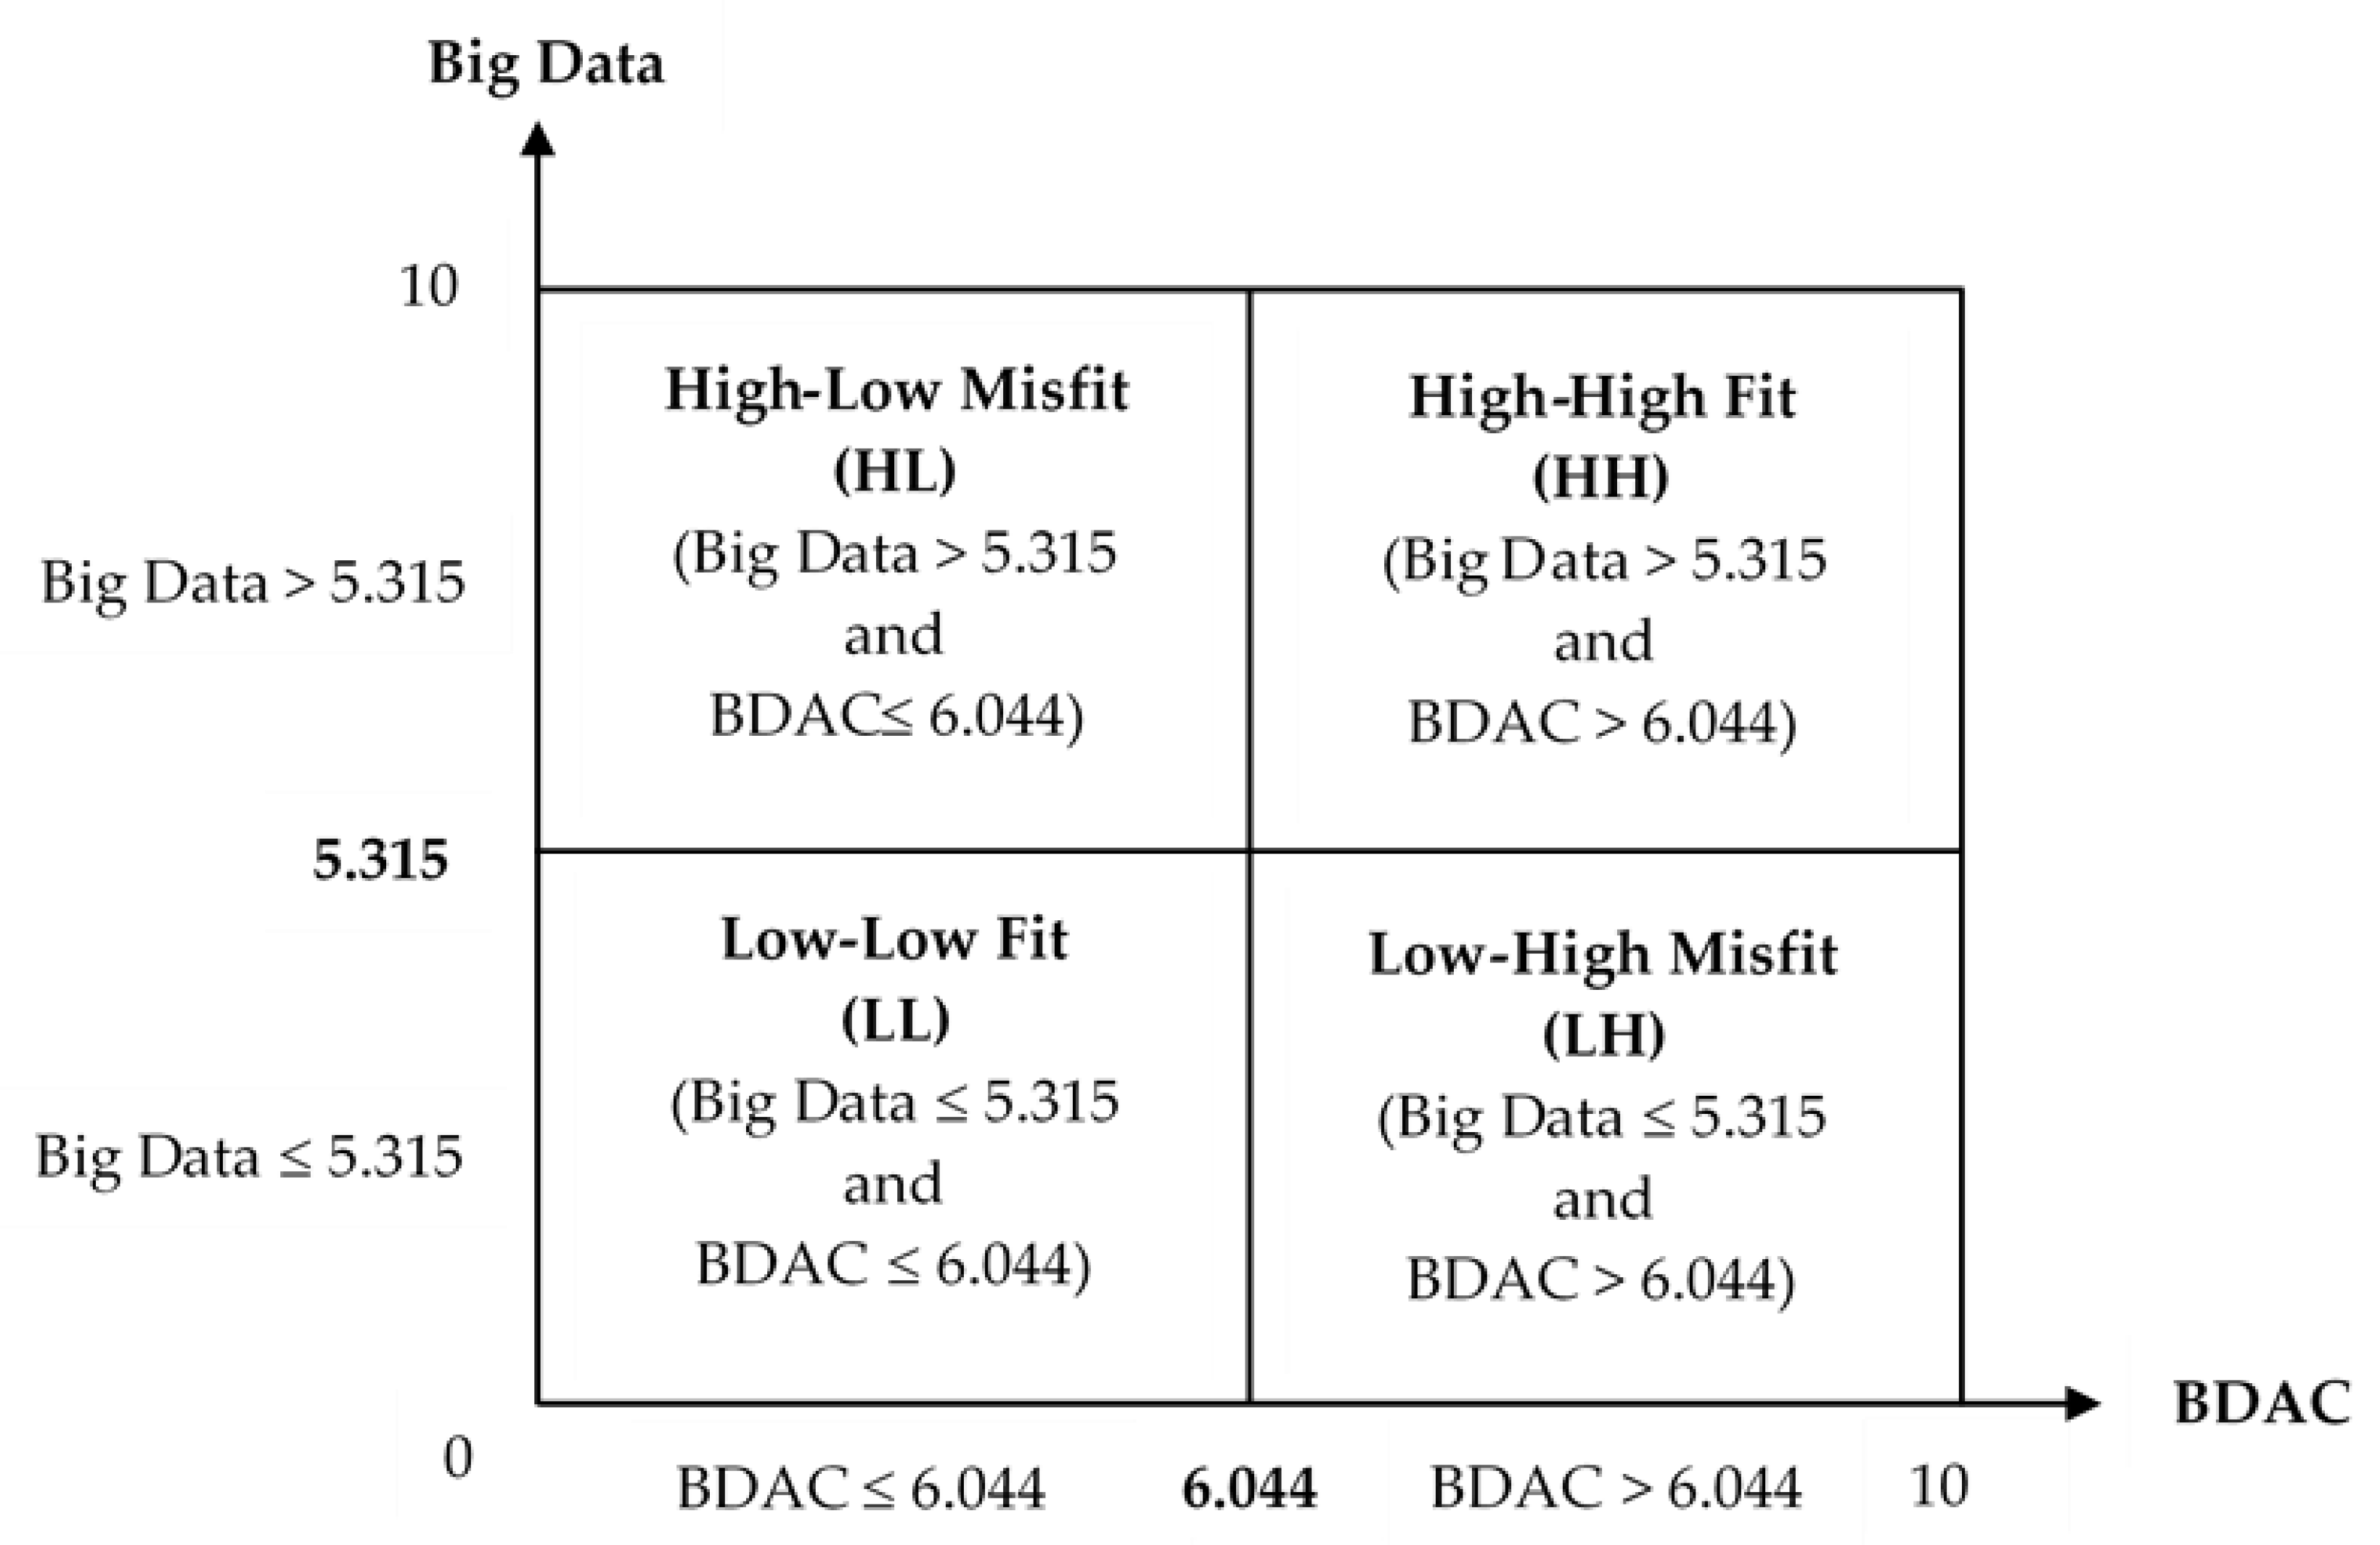
  • In the United States, high-high fit > high-low misfit > low-low fit > low-high misfit (p < 0.01). Therefore, H1 is partially supported because low-low fit < high-low misfit (not > as predicted by H1); and H2 is supported. However, counter to H3, the effect of low-high misfit fit on sustainable innovativeness is less, not higher (as predicted by H3), than High-Low Misfit is.
  • In China, high-high fit > low-low fit > low-high misfit > high-low misfit (p < 0.01). Therefore, all three hypotheses are supported as predicted.
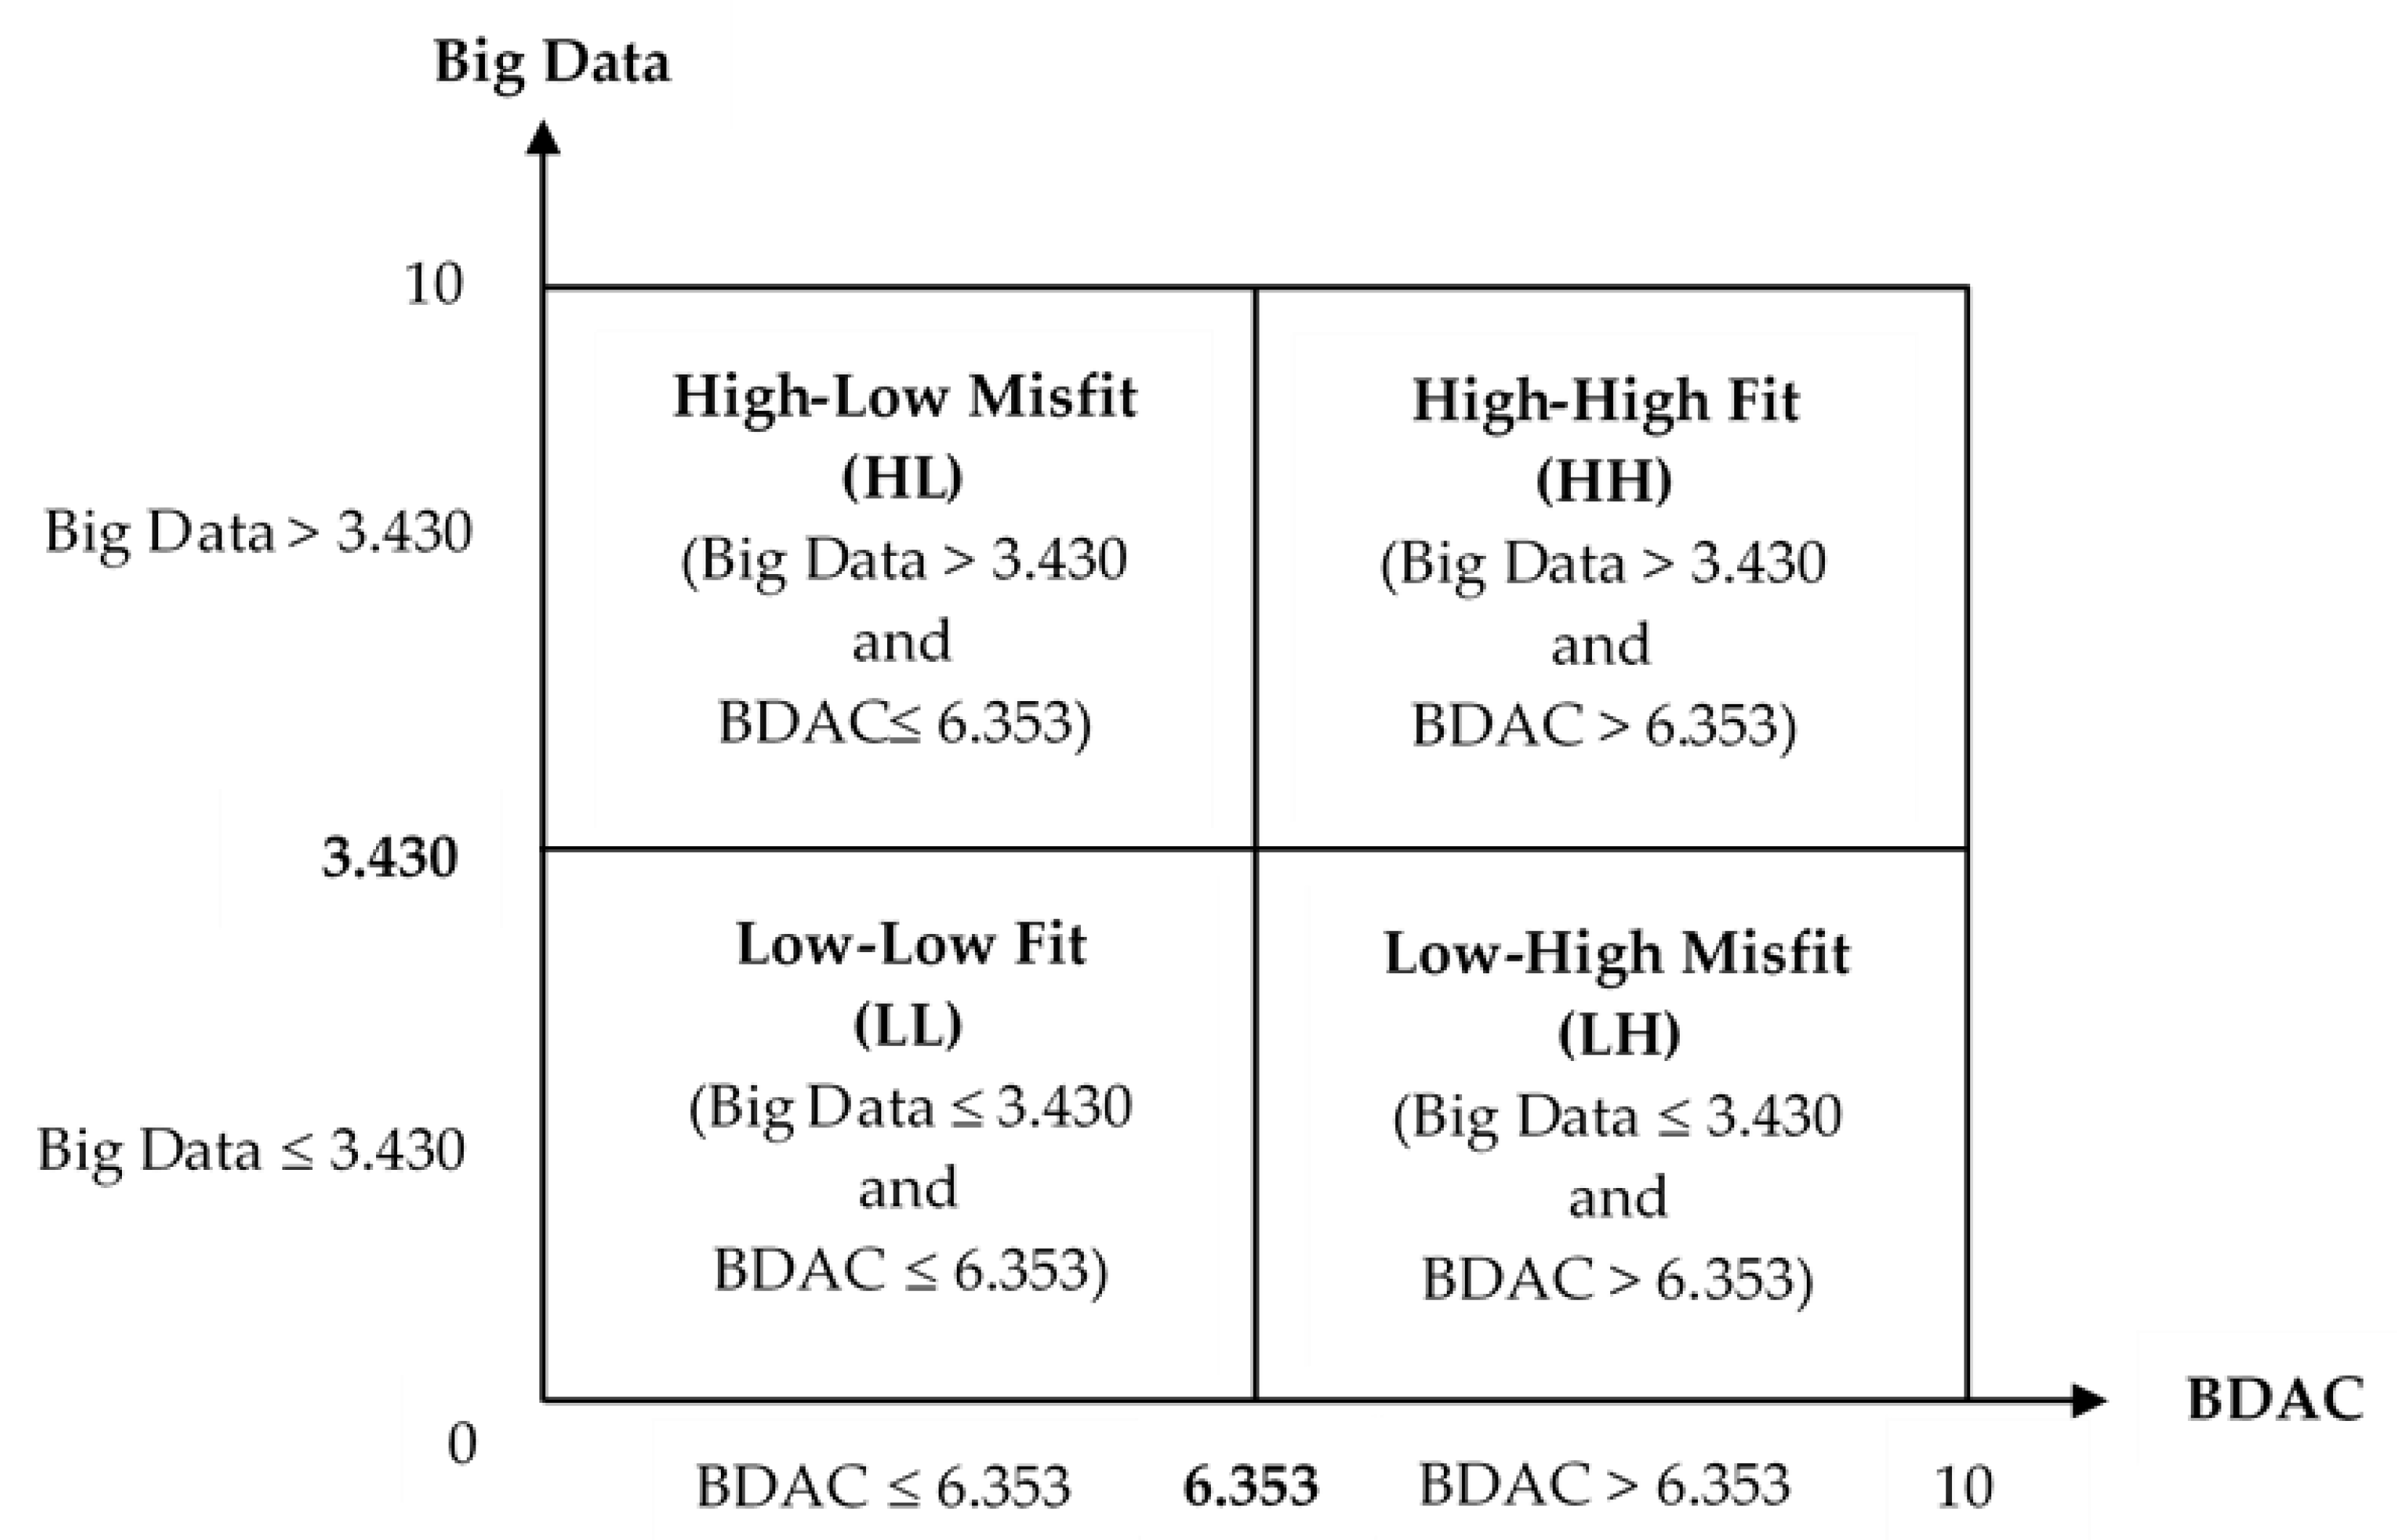
  • In Singapore, high-high fit > low-high misfit > low-low fit > high-low misfit (p < 0.10). Therefore, H1 is partially supported because low-low fit < low-high misfit (not > as predicted by H1); and both H2 and H3 are supported.

5. Cross-National Comparative Analyses

To explore the similarities and differences among our samples in the United States, China, and Singapore, we summarize the standardized estimates of fits and misfits on sustainable innovativeness in Table 11. The results suggest that a high level of big data matched with a high level of BDAC has the greatest positive effect on sustainable innovativeness. The importance of the other three scenarios differs across countries.
In the United States, high-low misfit has a larger effect on sustainable innovativeness than low-low fit and low-high misfit do. Low-high misfit has the least effect on sustainable innovativeness. The significant differences are validated by the paired-wise tests (p < 0.01). Access to high big data resources provides project leaders with rich information about markets, customers, and competitors to inform innovation activities [19]. A low level of big data resources reduces project team’s ability to accurately evaluate the market development and demand directions, resulting in misdirected innovation activities and missed market opportunities. In addition, when big data is lacking, too much BDAC can cause capacity redundancy and blur the focus of existing big data analysis, leading to ineffective innovation activities.
In China, low-low fit has a larger impact on sustainable innovativeness than low-high misfit and high-low misfit. Fits are better than misfits. Results of paired-wise tests in Table 10 suggest that the differences are significant (p < 0.01). Thus, for NSD projects in China, it is important that the levels of big data and BDAC be in alignment to support the improvement of sustainable innovativeness. When there is high big data and low BDAC, projects are unable to meet the needs for data analysis, and experience data overload and blind innovation.
In Singapore, a high level of BDAC can improve sustainable innovativeness: after high-high fit, low-high misfit has the largest impact, followed by low-low fit and high-low misfit. Results of paired-wise tests in Table 10 suggest that the differences are significant (p < 0.10). The effect of low-high misfit on sustainable innovativeness is 1.538 times higher (0.406/0.264) than that of high-low misfit, indicating that big data on its own is unlikely to be a source of competitive advantage for NSD projects in Singapore [33], but a high level of BDAC can lead to effective mining and analysis of the available big data to create benefits for NSD projects.
To further evaluate cross-national differences on how fits and misfits affect sustainable innovativeness, we performed dummy regression analyses using pooled data of three countries. The United States is the base case. Two country dummy variables (China and Singapore) and eight interaction terms (country dummy variables multiply by four fits and misfits) were introduced into the equation. Table 12 presents the results of the analyses. The four coefficient estimates for the four interaction terms with China (or Singapore) as dummy variable show the differences between the United States and China (or Singapore). The differences between China and Singapore can be evaluated by using the sum of the coefficients (U.S. + China vs. U.S. + Singapore). We used “TEST” option in the model statement of the “Proc Reg” to compare the estimates. We present the results in Table 13.
The results in Table 12 and Table 13 suggest that the coefficients for interaction terms (for both China and Singapore) are all negative and that the numbers are more negative in Singapore than in China. Therefore, the effects of fits and misfits on innovativeness is highest in the U.S. than in China and in Singapore. The results suggest following additional cross-national differences for each of the scenarios:
(1)
For effect of high-low misfit on sustainable innovativeness, the effect is less (β = −0.974; p < 0.05), in Singapore than in the U.S. There are no significant differences in the effect between U.S. and China (p > 0.10) and between China and Singapore (p > 0.10).
(2)
For effect of high-high fit on sustainable innovativeness, the effect is the largest in the U.S. (β = 6.963), the same in China (−0.215) but it is not significantly different from the U.S. with p > 0.10), and the smallest in Singapore (β = 6.963–0.873= 6.090; p < 0.01). The results in Table 12 suggest that the difference between U.S. and Singapore is significant (p < 0.01). The results in Table 13 indicate that the difference between China and Singapore is significant (p < 0.01).
(3)
For effect of low-low fit on sustainable innovativeness, the effect is also the highest in the U.S. (β = 4.179), the same in China (−0.049 but it is not significantly different from the U.S. with p > 0.10), and the lowest in Singapore (β = 4.179–0.963= 3.216; p < 0.01). The results in Table 12 suggest that the difference between U.S. and Singapore is significant (p < 0.01). The results in Table 13 indicate that the difference between China and Singapore is significant (p < 0.01).
(4)
For low-high misfit on sustainable innovativeness, the effect is the highest in the U.S. (β = 5.380), second in China (β = 5.380–0.727 = 4.653) and lowest in Singapore (β = 5.380–1.738 = 3.642). The differences are all significant (p < 0.01).

6. Conclusions, Implications, and Future Research

6.1. Conclusions

Based on the IPT, we developed a theoretical model for studying the differential effects of fits and misfits between big data and BDAC on sustainable innovativeness. We investigated four scenarios and their impacts on sustainable innovativeness in a three-country comparative study. We tested for significant differences between six pairs of the combinations and between the three pairs of the countries. The empirical results provided at least partial supports for all three hypotheses.
First, as predicted by Hypothesis 1, we found that in China the effect of fits between big data and BDAC on sustainable innovativeness is always stronger than that of misfits. However, in the United States and Singapore, we found that the effect of low-low fit on sustainable innovativeness is lower than that of misfits, indicating that the effect of fits between big data and BDAC on sustainable innovativeness is not always stronger than that of misfits in these countries. This finding challenges the assertions of previous research that fit between information, and information processing capability is necessary to obtain value for the firm [4,7].
Second, as hypothesized in H3, across all three countries, we found that the positive impact of high-high fit on sustainable innovativeness is greater than that of low-low fit. This finding supports the conclusions of previous research that a high level of big data is a high-quality resource that can be fully interpreted with a high level of BDAC to provide NSD project managers with insights into markets and customers and thereby ensure the development of successful service products [10,19,30,33]. Our finding that high levels of big data and BDAC can maximize sustainable innovativeness thus adds to the results of Hao et al. [2], who suggested that when big data is high, improving BDAC will inhibit innovation performance.
Third, we found significant differences in the impact of low-high misfit and high-low misfit on sustainable innovativeness across the three countries. In the United States, the positive impact of high-low misfit on sustainable innovativeness is higher than that of low-high misfit. This result, consistent with Tan and Zhan [3], shows that rich big data resources can provide more sufficient, reliable, and relevant information to guarantee the success of NSD projects even if BDAC is insufficient to fully exploit these resources. Contrary to Song et al. [38], who found that the level of marketing and R&D resources has an insignificant relationship with product innovativeness, we found that if U.S. firms pursuing NSD projects lack big data resources, they cannot accurately obtain the valuable information needed to ensure the sustainable innovativeness of service products. In contrast, in China and Singapore, the impact of high-low misfit on sustainable innovativeness is less, not greater, than that of low-high misfit. This result suggests that firms in China and in Singapore should operate differently from firms in the U.S. They need to focus on increasing big data rather than BDAC to successfully develop innovative service products. As Rialti et al. [35], Gupta and George [10], and Ferraris et al. [11] have also found, even if there are limited big data resources, increasing BDAC can enable project leaders to integrate and internalize existing big data information to improve the sustainable innovativeness of projects.
Finally, the results from cross-national comparative analyses reveal four major conclusions. First, the fits have greater effect on sustainable innovativeness in the U.S. and in China than that in Singapore. Second, the impact of high-low misfit on sustainable innovativeness is higher in the U.S. than in Singapore. Third, the positive effect of low-high misfit on sustainable innovativeness is the largest in the U.S., followed by China, and then by Singapore. The possible reasons may be that there are differences in the development speed of big data and analytics capability among the three countries. Firms in the U.S. are better with applying big data and BDAC to develop innovative services and products than firms in China and in Singapore are.

6.2. Theoretical Implications

This research enriches the literature on big data and innovation in several ways. First, this study expands the application of the IPT with regard to big data. Previous studies on the IPT have focused on firms’ need for traditional information sources and information processing capability [21,24]. However, in the current marketplace, the need for information is largely affected by big data, which necessitates higher information processing capability [19]. This study specifically considers big data and BDAC, explores the application of the IPT in the context of big data and service innovation, and complements existing research on the IPT [23,24].
Although other scholars such as Isik [4] have discussed the need for big data and information processing capability and stressed the importance of their alignment to generate value from big data, they have neither specified measurement items for these constructs nor conducted in-depth empirical tests. Thus, this study fills these gaps in the empirical analysis of big data and BDAC by using fieldwork and case studies to refine the definitions and connotations of big data and BDAC, improving existing measurement scales, and proposing systematic measurement scales [14]. This study is also the first to consider both fits and misfits between big data and BDAC and assess their impacts on sustainable innovativeness. This not only enhances the previous research focusing only on the impact of big data or BDAC [3,14,16,19] but also contributes to research on sustainable innovativeness [18] by demonstrating the important impact of different configurations of fit between big data and BDAC in the context of service innovation.
Finally, this study enriches the theory of cross-national big data management. Previous research on big data and BDAC has mostly focused on the data of a single country [3,17,35]. In this study we conducted a comparative analysis across three countries. By analyzing the data from NSD projects in the United States, China, and Singapore, we explored the similarities and differences of fits and misfits between big data and BDAC in the process of service innovation in these countries, building the literature in this area.

6.3. Managerial Implications

The results of our analysis of the impact of fits and misfits between big data and BDAC on sustainable innovativeness offer targeted recommendations for project managers in the different countries to achieve successful service innovation.
First, when there are sufficient resources available, NSD project managers in the United States, China, and Singapore should all invest in both big data and BDAC to improve sustainable innovativeness. It is important that managers ensure the synchronous improvement of both big data and BDAC and not emphasize the development of one aspect over the other.
Second, if resources are limited, then the recommended development strategies for project managers differ among the three countries.
NSD project managers in the United States should invest in large amounts of high-quality big data to ensure that the project always has a high level of big data resources to serve as the foundation of the project. Project managers can improve their big data resources in four ways: (1) increase the quantity and stock of big data as much as possible and constantly update the existing data to ensure its timeliness so team members can understand changing market conditions and make timely adjustments to the project; (2) build a data warehouse or mart to integrate various internal and external sources of big data (e.g., customer demand, market development trends, business processing, competitor information, etc.) and create a comprehensive knowledge base; (3) invest sufficient funds in NSD projects so they can be fully developed; and (4) allocate time for effective analysis of big data to ensure retention of reliable and relevant information, avoid decision-making mistakes, and achieve successful project outcomes.
In China, managers can improve sustainable innovativeness by ensuring that big data and BDAC maintain a balanced level. For example, if an NSD project has less big data, it should not invest in further improving analysis tools and technologies but instead should focus on in-depth analysis of existing data.
In Singapore, NSD project managers should focus on improvement of BDAC by investing in pertinent analysis technologies and tools to enhance the ability of the project team to transform big data into useful information. Managers can improve BDAC in three ways: (1) introduce advanced analysis and algorithm tools, effectively analyze big data of different structure forms, extract all information related to development activities, and find the connection between different processes and activities; (2) focus on predicting potential market opportunities and development trends from existing data resources; and (3) recruit high-quality team members with strong analytical skills and provide regular training to assist team members in adapting to the development of technology and analysis tools. Overall, project managers need to build a data-driven culture in their firm that supports big data thinking and improves the sensitivity and cognitive ability of employees with regard to data.

6.4. Limitations and Future Research

There are several shortcomings of this study that can be improved upon in future work. We focused here only on sustainable innovativeness as an important indicator of service innovation output. Future studies should also consider how fits and misfits affect the quality of new service products, the adoption of new service products, and innovation speed. These are all important sustainable competitive advantages for sustainable service development. Furthermore, our study sample included only five industries. Future studies should collect more data in other industries to assess the generalizability of the research conclusions. Although we gained valuable insight from our analysis of data from the United States, China, and Singapore, future endeavors can be enhanced with data from other countries, particularly those that represent a variety of economic and cultural systems, to further enrich cross-national comparative research and contribute to the understanding of the sustainability of new service development.

Author Contributions

M.S. and H.Z. share the first-authorship of this article. H.Z. is corresponding author. Conceptualization, M.S., J.H., and H.Z.; methodology, M.S. and H.Z.; data curation, H.Z. and M.S.; writing—original draft preparation, J.H., H.Z., and M.S., writing-review and editing, M.S., J.H., and H.Z.; funding acquisition, H.Z. All authors have read and agreed to the authorship and content of the article. All authors have read and agreed to the published version of the manuscript.

Funding

This research was funded by the Humanities and Social Science Project of the China Ministry of Education under the grant with project title: “Breakthrough service innovation: effects of big data analytics and AI capability”. The partial funding was also supported by the Natural Science Foundation of Shaanxi Province of China, grant number 2018JQ7003.

Acknowledgments

The authors thank assistant editor of Sustainability and two anonymous reviewers for their useful suggestions which improve the quality of this article. The literature review and hypothesis development were based on the graduation thesis of Jinjin Heng.

Conflicts of Interest

The authors declare no conflict of interest. The funders had no role in the design of the study; in the collection, analyses, or interpretation of data; in the writing of the manuscript, or in the decision to publish the results.

Appendix A. Study Measures and Sources

Big Data (adopted from Gupta and George [10]). (0 = strongly disagree; 5 = neutral; 10 = strongly agree)
(1)
We have access to very large, unstructured, or fast-moving data for analysis.
(2)
We integrate data from multiple internal sources into a data warehouse or mart for easy access.
(3)
We integrate external data with internal to facilitate high-value analysis of our business environment.
(4)
Our big data analytics projects are adequately funded.
(5)
* Our big data analytics projects are given enough time to achieve their objectives.
Big Data Analytics Capability (BDAC) (adopted from Hao et al. [2]).
(1)
We have advanced tools (analytics and algorithms) to extract values of the big data. (0 = no capability; 5 = median level; 10 = very high level of capability; adopted from Hao et al. [2], which was derived from Dubey et al. [34]; Gupta and George [10]).
(2)
Our capability to discover relationships and dependencies from the big data is: (0 = no capability; 5 = neutral; 10 = very high level of capability; adopted from Hao et al. [2], which was developed based on field research).
(3)
* Our capability to perform predictions of outcomes and behaviors from the big data is: (0 = no capability; 5 = median level; 10 = very high level of capability; adopted from Hao et al. [2], which was derived from Gupta and George [10]).
(4)
Our capability to discover new correlations from the big data to spot market demand trends and predict user behavior is: (0 = no capability; 5 = median level; 10 = very high level of capability; adopted from Hao et al. [2]; which was derived from Akter et al. [14]; Wamba et al. [33]).
(5)
Our big data analytics staff has the right skills to accomplish their jobs successfully. (0 = none; 5 = median level; 10 = very high level of capability; adopted from Hao et al. [2], which was derived from Gupta and George [10]).
Sustainable Innovativeness (adapted from Song and Parry [37]). (Minor modifications were made based on the pretests as reported in the text. The changes are shown below using the notations: deletion is marked using deletion . Added text is marked with underline.) (0 = strongly disagree; 5 = neutral; 10 = strongly agree).
(1)
Our The products and services often incorporate innovative technologies which have never been used in the industry before.
(2)
Our The products and services caused significant changes in the whole industry.
(3)
Our The products and services are one of the first of its kind introduced into the market.
(4)
Our The products and services are highly innovative—totally new to the market.
(5)
Our The products and services are perceived as most innovative in the industry.
Note: * indicates that the item was deleted based on factor analyses as described in the text.

References

  1. Mcafee, A.; Brynjolfsson, E. Big data: The management revolution. Harv. Bus. Rev. 2012, 90, 60–68. [Google Scholar] [PubMed]
  2. Hao, S.; Zhang, H.; Song, M. Big data, big data analytics capability, and sustainable innovation performance. Sustainability 2019, 11, 7145. [Google Scholar] [CrossRef] [Green Version]
  3. Tan, K.H.; Zhan, Y. Improving new product development using big data: A case study of an electronics company. R&D Manag. 2016, 47, 570–582. [Google Scholar]
  4. Isik, Ö. Big Data Capabilities: An Organizational Information Processing Perspective. In Analytics and Data Science. Annals of Information Systems; Deokar, A., Gupta, A., Iyer, L., Jones, M., Eds.; Springer: Berlin, Germany, 2018; pp. 29–40. [Google Scholar]
  5. George, G.; Osinga, E.C.; Lavie, D.; Scott, B. Big data and data science methods for management research. Acad. Manag. J. 2016, 59, 1493–1507. [Google Scholar] [CrossRef] [Green Version]
  6. Peng, D.X.; Heim, G.R.; Mallick, D.N. Collaborative product development: The effect of project complexity on the use of information technology tools and new product development practices. Prod. Oper. Manag. 2014, 23, 1421–1438. [Google Scholar] [CrossRef]
  7. Tushman, M.; Nadler, D. Information processing as an integrating concept in organization design. Acad. Manag. Rev. 1978, 3, 613–624. [Google Scholar]
  8. Galbraith, J.R. Organization design: An information processing view. Interfaces 1974, 4, 28–36. [Google Scholar] [CrossRef]
  9. LeCun, Y.; Bengio, Y.; Hinton, G. Deep learning. Nature 2015, 521, 436–444. [Google Scholar] [CrossRef]
  10. Gupta, M.; George, J.F. Toward the development of a big data analytics capability. Inf. Manag. Amst. 2016, 53, 1049–1064. [Google Scholar] [CrossRef]
  11. Ferraris, A.; Mazzoleni, A.; Devalle, A.; Couturier, J. Big data analytics capabilities and knowledge management: Impact on firm performance. Manag. Deci. 2019, 57, 1923–1936. [Google Scholar] [CrossRef]
  12. Bumblauskas, D.; Nold, H.; Bumblauskas, P.; Igou, A. Big data analytics: Transforming data to action. Bus. Proc. Manag. J. 2017, 23, 703–720. [Google Scholar] [CrossRef]
  13. Ghasemaghaei, M.; Ebrahimi, S.; Hassanein, K. Data analytics competency for improving firm decision making performance. J. Strateg. Inf. Syst. 2018, 27, 101–113. [Google Scholar] [CrossRef]
  14. Akter, S.; Wamba, S.F.; Gunasekaran, A.; Dubey, R.; Childe, S.J. How to improve firm performance using big data analytics capability and business strategy alignment. Int. J. Prod. Econ. 2016, 182, 113–131. [Google Scholar] [CrossRef] [Green Version]
  15. Jin, D.H.; Kim, H.J. Integrated understanding of big data, big data analysis, and business intelligence: A case study of logistics. Sustainability 2018, 10, 3778. [Google Scholar] [CrossRef] [Green Version]
  16. Tan, K.H. Managerial perspectives of big data analytics capability towards product innovation. Strateg. Direc. 2018, 34, 33–35. [Google Scholar] [CrossRef]
  17. Wang, Y.; Hajli, N. Exploring the path to big data analytics success in healthcare. J. Bus. Res. 2017, 70, 287–299. [Google Scholar] [CrossRef]
  18. Su, Z.; Ahlstrom, D.; Li, J.; Cheng, D. Knowledge creation capability, absorptive capacity, and product innovativeness. R&D Manag. 2013, 43, 473–485. [Google Scholar]
  19. Johnson, J.S.; Friend, S.B.; Lee, H.S. Big data facilitation, utilization, and monetization: Exploring the 3Vs in a new product development process. J. Prod. Innov. Manag. 2017, 34, 640–658. [Google Scholar] [CrossRef]
  20. Urbinati, A.; Bogers, M.; Chiesa, V.; Frattini, F. Creating and capturing value from big data: A multiple-case study analysis of provider companies. Technovation 2019, 84–85, 21–36. [Google Scholar] [CrossRef]
  21. Bensaou, M.; Venkatraman, N. Configurations of interorganizational relationships: A comparison between U.S. and Japanese automakers. Manag. Sci. 1995, 41, 1471–1492. [Google Scholar] [CrossRef] [Green Version]
  22. Gómez, J.; Salazar, I.; Vargas, P. Firm boundaries, information processing capacity, and performance in manufacturing firms. J. Manag. Inf. Syst. 2016, 33, 809–842. [Google Scholar] [CrossRef]
  23. Song, M.; Bij, H.V.D.; Weggeman, M. Determinants of the level of knowledge application: A knowledge-based and information processing perspective. J. Prod. Innov. Manag. 2005, 22, 430–444. [Google Scholar] [CrossRef]
  24. Moser, R.; Kuklinski, J.W.; Srivastava, M. Information processing fit in the context of emerging markets: An analysis of foreign SBUs in China. J. Bus. Res. 2017, 70, 234–247. [Google Scholar] [CrossRef]
  25. Venkatraman, N.; Camillus, J.C. Exploring the concept of “fit” in strategic management. Acad. Manag. Rev. 1984, 9, 513–525. [Google Scholar]
  26. Oncioiu, I.; Bunget, O.C.; Türkeș, M.C.; Căpușneanu, S.; Topor, D.I.; Tamaș, A.S.; Rakoș, I.S.; Hint, M.Ș. The impact of big data analytics on company performance in supply chain management. Sustainability 2019, 11, 4864. [Google Scholar] [CrossRef] [Green Version]
  27. George, G.; Haas, M.R.; Pentland, A. Big data and management. Acad. Manag. J. 2014, 57, 321–326. [Google Scholar] [CrossRef]
  28. Hu, F.; Liu, W.; Tsai, S.B.; Gao, J.; Bin, N.; Chen, Q. An empirical study on visualizing the intellectual structure and hotspots of big data research from a sustainable perspective. Sustainability 2018, 10, 667. [Google Scholar] [CrossRef] [Green Version]
  29. Chen, H.; Chiang, R.H.L.; Storey, V.C. Business intelligence and analytics: From big data to big impact. MIS Q. 2012, 36, 1165–1188. [Google Scholar] [CrossRef]
  30. Günther, W.A.; Rezazade Mehrizi, M.H.; Huysman, M.; Feldberg, F. Debating big data: A literature review on realizing value from big data. J. Strateg. Inf. Syst. 2017, 26, 191–209. [Google Scholar] [CrossRef]
  31. Ghasemaghaei, M. The role of positive and negative valence factors on the impact of bigness of data on big data analytics usage. Int. J. Inf. Manag. 2020, 50, 395–404. [Google Scholar] [CrossRef]
  32. Ghasemaghaei, M.; Calic, G. Does big data enhance firm innovation competency? The mediating role of data-driven insights. J. Bus. Res. 2019, 104, 69–84. [Google Scholar] [CrossRef]
  33. Wamba, S.F.; Gunasekaran, A.; Akter, S.; Ren, S.J.; Dubey, R.; Childe, S.J. Big data analytics and firm performance: Effects of dynamic capabilities. J. Bus. Res. 2017, 70, 356–365. [Google Scholar] [CrossRef] [Green Version]
  34. Dubey, R.; Gunasekaran, A.; Childe, S.J. Big data analytics capability in supply chain agility: The moderating effect of organizational flexibility. Manag. Deci. 2019, 57, 2092–2112. [Google Scholar] [CrossRef] [Green Version]
  35. Rialti, R.; Zollo, L.; Ferraris, A.; Alon, I. Big data analytics capabilities and performance: Evidence from a moderated multi-mediation model. Technol. Forecast. Soc. Chang. 2019, 149, 1–10. [Google Scholar] [CrossRef]
  36. Danneels, E.; Kleinschmidtb, E.J. Product innovativeness from the firm’s perspective: Its dimensions and their relation with project selection and performance. J. Prod. Innov. Manag. 2001, 18, 357–373. [Google Scholar] [CrossRef]
  37. Song, X.M.; Parry, M.E. Challenges of managing the development of breakthrough products in Japan. J. Oper. Manag. 1999, 17, 665–688. [Google Scholar] [CrossRef]
  38. Song, L.Z.; Song, M.; Di Benedetto, C.A. Resources, supplier investment, product launch advantages, and first product performance. J. Oper. Manag. 2011, 29, 86–104. [Google Scholar] [CrossRef]
  39. Calantone, R.J.; Chan, K.; Cui, A.S. Decomposing product innovativeness and its effects on new product success. J. Prod. Innov. Manag. 2006, 23, 408–421. [Google Scholar] [CrossRef]
  40. McNally, R.C.; Cavusgil, E.; Calantone, R.J. Product innovativeness dimensions and their relationships with product advantage, product financial performance, and project protocol. J. Prod. Innov. Manag. 2010, 27, 991–1006. [Google Scholar] [CrossRef] [Green Version]
  41. Cillo, P.; De Luca, L.M.; Troilo, G. Market information approaches, product innovativeness, and firm performance: An empirical study in the fashion industry. Res. Policy 2010, 39, 1242–1252. [Google Scholar] [CrossRef]
  42. Tsai, K.H.; Liao, Y.C.; Hsu, T.T. Does the use of knowledge integration mechanisms enhance product innovativeness. Ind. Mark. Manag. 2015, 46, 214–223. [Google Scholar] [CrossRef]
  43. Song, X.M.; Parry, M.E. What separates Japanese new product winners from losers. J. Prod. Innov. Manag. 1996, 13, 422–439. [Google Scholar] [CrossRef]
Figure 1. Four scenarios of the fits and misfits between big data and BDAC.
Sustainability 12 01984 g001
Figure 2. The U.S. sample: fits and misfits between big data and BDAC (N = 477).
Sustainability 12 01984 g002
Figure 3. The Chinese sample: fits and misfits between big data and BDAC (N = 632).
Sustainability 12 01984 g003
Figure 4. The Singaporean sample: fits and misfits between big data and BDAC (N = 294).
Sustainability 12 01984 g004
Table 1. The U.S. sample: descriptive statistics and correlation coefficient matrix (N = 477).
InnovativenessBig DataBDAC
Innovativeness0.855
Big Data0.587 ***0.918
BDAC0.433 ***0.419 ***0.803
Mean5.7175.3156.044
S.D.2.1382.7492.056
Note: *** p < 0.01 (two-tailed test). BDAC = Big data analytics capability. The Cronbach’s alpha for each variable is on the diagonal; the intercorrelations among the variables are on the off diagonal.
Table 2. The U.S. sample: factor loadings from exploratory factor analysis (N = 477).
Measure ItemsInnovativenessBig DataBDAC
INNO 10.8330.1870.190
INNO 40.7720.2290.086
INNO 20.7230.2600.125
INNO 30.7220.1780.238
INNO 50.6710.2720.181
Big Data 20.2250.8700.146
Big Data 40.2680.8680.149
Big Data 10.3290.8130.121
Big Data 30.2620.7840.313
BDAC 20.1140.1150.821
BDAC 10.1350.1620.759
BDAC 40.1720.1490.752
BDAC 50.2040.1370.720
Note: BDAC = Big data analytics capability. Bold numbers indicate items that load highly for the corresponding factor.
Table 3. The U.S. sample: results of dummy regression analysis (N = 477).
Dependent Variable: Sustainable Innovativeness
Parameter Estimate (β)Standard Error (S.E.)Standardized Estimate (b)
High-Low Misfit6.118 ***0.2060.400
High-High Fit6.963 ***0.1340.701
Low-Low Fit4.179 ***0.1460.384
Low-High Misfit5.380 ***0.2130.340
Model F-value1263.050 ***
R-square0.914
Adjusted R-square0.914
Note: *** p < 0.01 (two-tailed test). High-Low Misfit = the misfit between high big data and low BDAC; High-High Fit = the fit between high big data and high BDAC; Low-Low Fit = the fit between low big data and low BDAC; Low-High Misfit = the misfit between low big data and high BDAC. The six paired-wise tests indicate that all pairs are significantly different from each other at p < 0.01 (one-tailed test).
Table 4. The Chinese sample: descriptive statistics and correlation coefficient matrix (N = 632).
InnovativenessBig DataBDAC
Innovativeness0.869
Big Data0.588 ***0.894
BDAC0.389 ***0.506 ***0.767
Mean5.2974.5716.254
S.D.2.1922.5852.085
Note: *** p < 0.01 (two-tailed test). BDAC = Big data analytics capability. The Cronbach’s alpha for each scale is on the diagonal in italics; the intercorrelations among the variables are on the off diagonal.
Table 5. The Chinese sample: factor loadings from exploratory factor analysis (N = 632).
Measure ItemsInnovativenessBig DataBDAC
INNO 10.8190.2420.070
INNO 30.8110.2380.049
INNO 50.7430.2240.194
INNO 40.7350.1800.191
INNO 20.7280.2110.149
Big Data 10.2430.8650.159
Big Data 20.2410.7970.275
Big Data 30.2520.7670.210
Big Data 40.3770.7520.200
BDAC 10.0350.2370.800
BDAC 20.1750.0230.762
BDAC 50.0660.2410.730
BDAC 40.2850.2370.622
Note: BDAC = Big data analytics capability. Bold numbers indicate items that load highly for the corresponding factor.
Table 6. The Chinese sample: results of dummy regression analysis (N = 632).
Dependent Variable: Sustainable Innovativeness
Parameter Estimate (β)Standard Error (S.E.)Standardized Estimate (b)
High-Low Misfit5.660 ***0.2240.329
High-High Fit6.748 ***0.1280.688
Low-Low Fit4.130 ***0.1260.427
Low-High Misfit4.653 ***0.1690.360
Model F-value1315.420 ***
R-square0.893
Adjusted R-square0.893
Note: *** p < 0.01 (two-tailed test). High-Low Misfit = the misfit between high big data and low BDAC; High-High Fit = the fit between high big data and high BDAC; Low-Low Fit = the fit between low big data and low BDAC; Low-High Misfit = the misfit between low big data and high BDAC. The six paired-wise tests indicate that all pairs are significantly different from each other at p < 0.01 (one-tailed test).
Table 7. The Singaporean sample: descriptive statistics and correlation coefficient matrix (N = 294).
InnovativenessBig DataBDAC
Innovativeness0.881
Big Data0.566 ***0.915
BDAC0.393 ***0.521 ***0.775
Mean4.2983.4306.353
S.D.2.1842.5072.167
Note: *** p < 0.01 (two-tailed test). BDAC = Big data analytics capability. The Cronbach’s alpha for each scale is on the diagonal in italics; the intercorrelations among the variables are on the off diagonal.
Table 8. The Singaporean sample: factor loading of variables (N = 294).
Measure ItemsInnovativenessBig DataBDAC
InnovativenessINNO 10.8540.2490.117
INNO 30.8500.1230.002
INNO 20.7780.1160.222
INNO 40.7000.3350.105
INNO 50.6790.3970.199
Big DataBig Data 10.2140.8840.168
Big Data 20.2730.8420.205
Big Data 40.2800.8310.197
Big Data 30.2430.7440.225
BDACBDAC 10.0580.2400.817
BDAC 20.0960.0020.743
BDAC 40.3020.2420.703
BDAC 50.0620.4130.641
Note: BDAC = Big data analytics capability. Bold numbers indicate items that load highly for the corresponding factor.
Table 9. The Singaporean sample: results of dummy regression analysis (N = 294).
Dependent Variable: Sustainable Innovativeness
Parameter Estimate (β)Standard Error (S.E.)Standardized Estimate (b)
High-Low Misfit5.144 ***0.4260.264
High-High Fit6.091 ***0.1950.684
Low-Low Fit3.215 ***0.1770.399
Low-High Misfit3.642 ***0.1960.406
Model F-value449.170 ***
R-square0.861
Adjusted R-square0.859
Note: *** p < 0.01 (two-tailed test). High-Low Misfit = the misfit between high big data and low BDAC; High-High Fit = the fit between high big data and high BDAC; Low-Low Fit = the fit between low big data and low BDAC; Low-High Misfit = the misfit between low big data and high BDAC. The six paired-wise tests indicate that all pairs are significantly different from each other at p < 0.10 (one-tailed test).
Table 10. Summary results of three hypotheses in three countries.
HypothesisPair ComparisonThe United States
(N = 477)
China
(N = 632)
Singapore
(N = 294)
H1 (fits > misfits)High-High Fit > Low-High Misfit39.680 ***98.070 ***78.300 ***
High-High Fit > High-Low Misfit11.860 ***17.760 ***4.070 **
Low-Low Fit > Low-High Misfit21.640 ***6.180 ***2.620 * (<)
Low-Low Fit > High-Low Misfit59.020 *** (<)35.350 ***17.480 ***
H2 (HH > LL)High-High Fit > Low-Low Fit197.290 ***212.910 ***119.450 ***
H3 (LH > HL)Low-High Misfit > High-Low Misfit6.220 *** (<)12.860 ***10.240 ***
Note: Numbers in Table 10 are F-statistics. (<) indicates that the effect is “less, not higher as predicted by the hypothesis”. * p < 0.10; ** p < 0.05; *** p < 0.01 (because all hypotheses are directional, one-tailed test is used). High-Low Misfit = the misfit between high big data and low BDAC; High-High Fit = the fit between high big data and high BDAC; Low-Low Fit = the fit between low big data and low BDAC; Low-High Misfit = the misfit between low big data and high BDAC.
Table 11. Ranking of the standardized estimates of the effects of fits and misfits on sustainable innovativeness.
Dependent Variable: Sustainable Innovativeness
RankThe United States
(Standardized Estimate b)
China
(Standardized Estimate b)
Singapore
(Standardized Estimate b)
1High-High Fit (0.701)High-High Fit (0.688)High-High Fit (0.684)
2High-Low Misfit (0.400)Low-Low Fit (0.427)Low-High Misfit (0.406)
3Low-Low Fit (0.384)Low-High Misfit (0.360)Low-Low Fit (0.399)
4Low-High Misfit (0.340)High-Low Misfit (0.329)High-Low Misfit (0.264)
Note: High-Low Misfit = the misfit between high big data and low BDAC; High-High Fit = the fit between high big data and high BDAC; Low-Low Fit = the fit between low big data and low BDAC; Low-High Misfit = the misfit between low big data and high BDAC.
Table 12. Results of regression analysis using pooled data (N = 1403).
Dependent Variable: Sustainable Innovativeness
Independent VariablesParameter Estimate
(β)
Standard Error
(S.E.)
Standardized Estimate
(b)
High-Low Misfit6.118 ***0.2110.368
High-High Fit6.963 ***0.1370.718
Low-Low Fit4.179 ***0.1500.429
Low-High Misfit5.380 ***0.2180.423
China × High-Low Misfit−0.4580.304−0.018
China × High-High Fit−0.2150.185−0.015
China × Low-Low Fit−0.0490.194−0.003
China × Low-High Misfit−0.727 ***0.273−0.038
Singapore × High-Low Misfit−0.974 **0.481−0.019
Singapore × High-High Fit−0.873 ***0.241−0.038
Singapore × Low-Low Fit−0.963 ***0.234−0.046
Singapore × Low-High Misfit−1.738 ***0.295−0.075
Model F-value1006.620 ***
R-square0.897
Adjusted R-square0.896
Note: ** p < 0.05; *** p < 0.01 (two-tailed test). High-Low Misfit = the misfit between high big data and low BDAC; High-High Fit = the fit between high big data and high BDAC; Low-Low Fit = the fit between low big data and low BDAC; Low-High Misfit = the misfit between low big data and high BDAC. China = 1 if the sample is Chinese; 0 otherwise. Singapore = 1 if the sample is Singaporean; 0 otherwise. The base case is the United States.
Table 13. Testing results of the cross-national differences between China and Singapore.
ChinaSingaporeDoes the Effect Differ?
(F-Statistics and Significant Level)
The Effect of High-Low MisfitThe Effect of High-Low Misfit1.130
The Effect of High-High FitThe Effect of High-High Fit7.900 ***
The Effect of Low-Low FitThe Effect of Low-Low Fit17.700 ***
The Effect of Low-High MisfitThe Effect of Low-High Misfit15.300 ***
Note: *** p < 0.01 (two-tailed test). High-Low Misfit = the misfit between high big data and low BDAC; High-High Fit = the fit between high big data and high BDAC; Low-Low Fit = the fit between low big data and low BDAC; Low-High Misfit = the misfit between low big data and high BDAC. Dummy variables: China = 1 if the sample is Chinese, 0 if not; Singapore = 1 if the sample is Singaporean, 0 if not.

