A Mixed Rough Sets/Fuzzy Logic Approach for Modelling Systemic Performance Variability with FRAM


Abstract
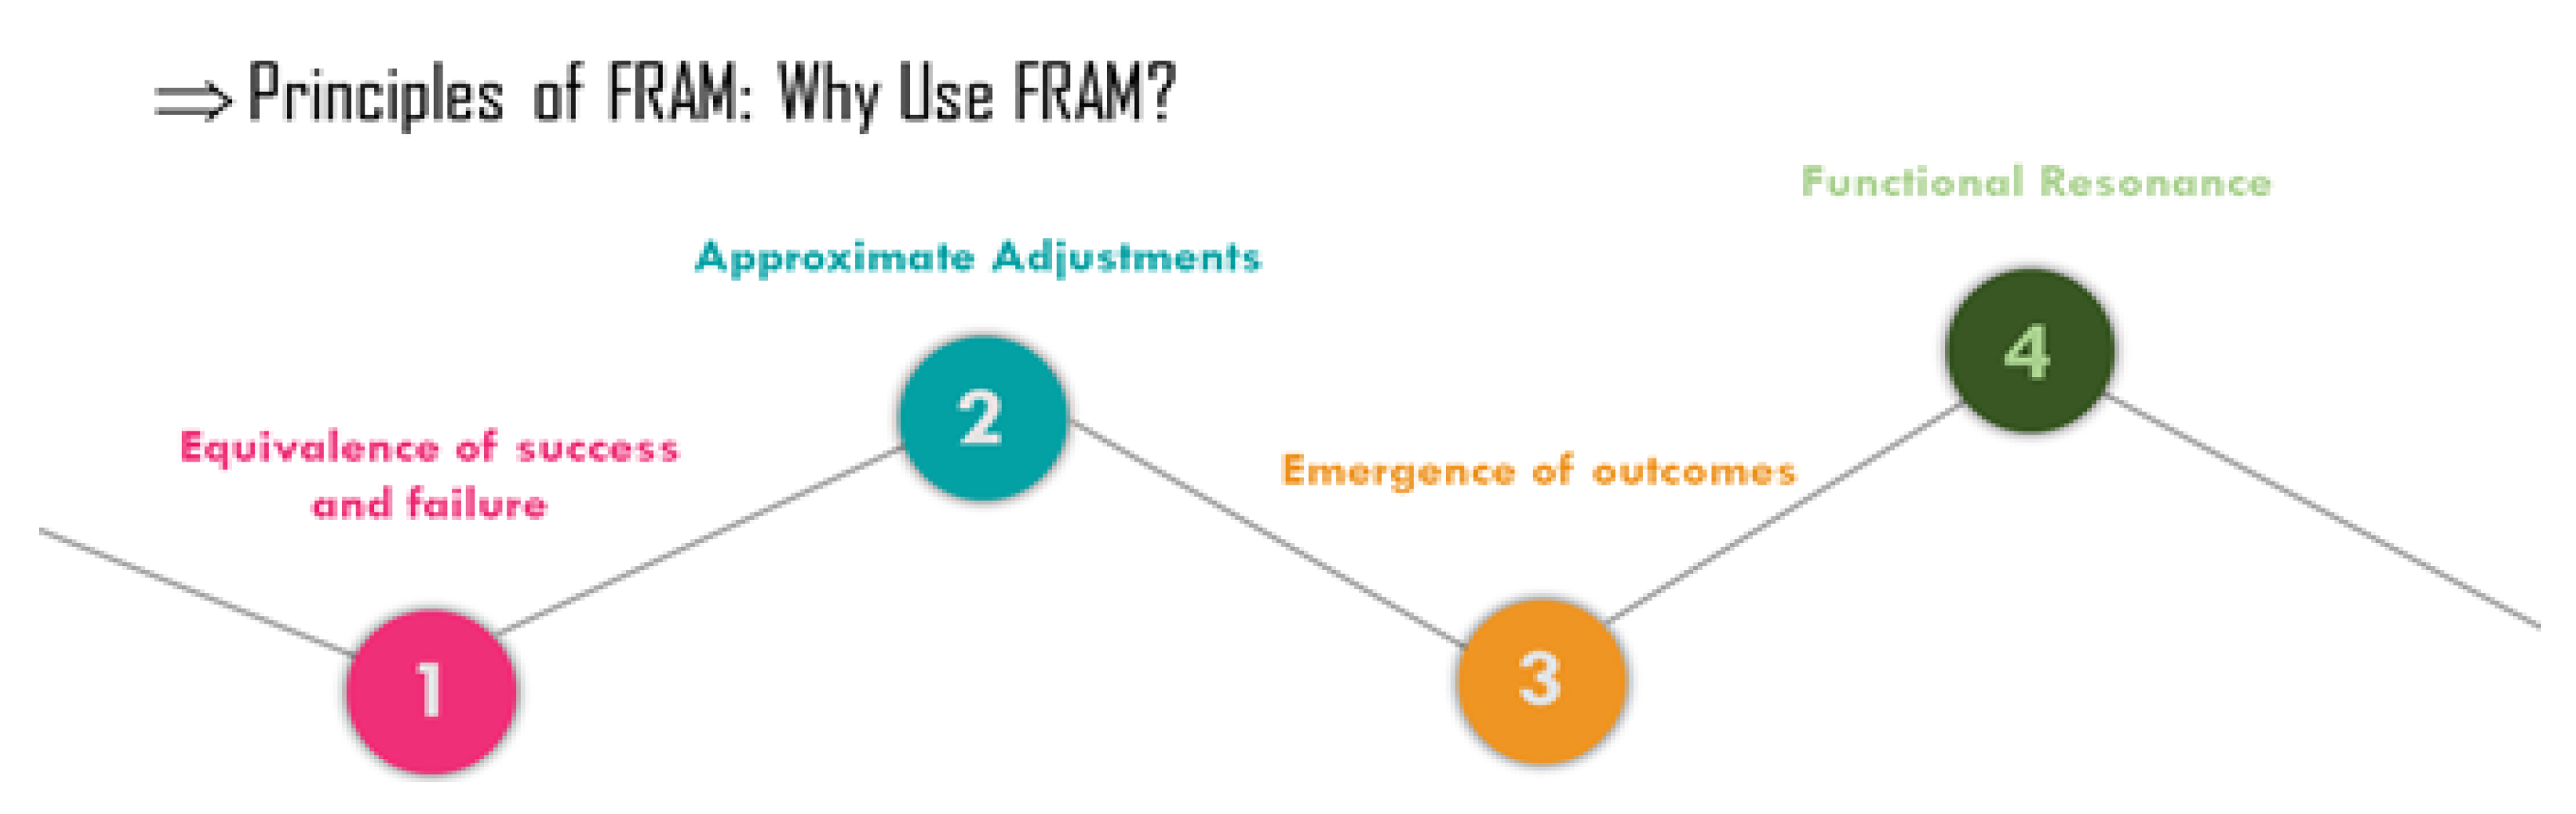
1. Introduction
2. Materials and Methods
2.1. An Overview of Rough Set Theory (RST)
2.1.1. Reducts
2.1.2. Decision Rules
2.2. Proposed Approach
2.2.1. Step Zero
2.2.2. Step One
2.2.3. Step Two
2.2.4. Step Three
2.2.5. Step Four
3. Results: A Case Study
3.1. Step Zero: Context and Objective
3.2. Step One: Functions’ Definition and Characterization
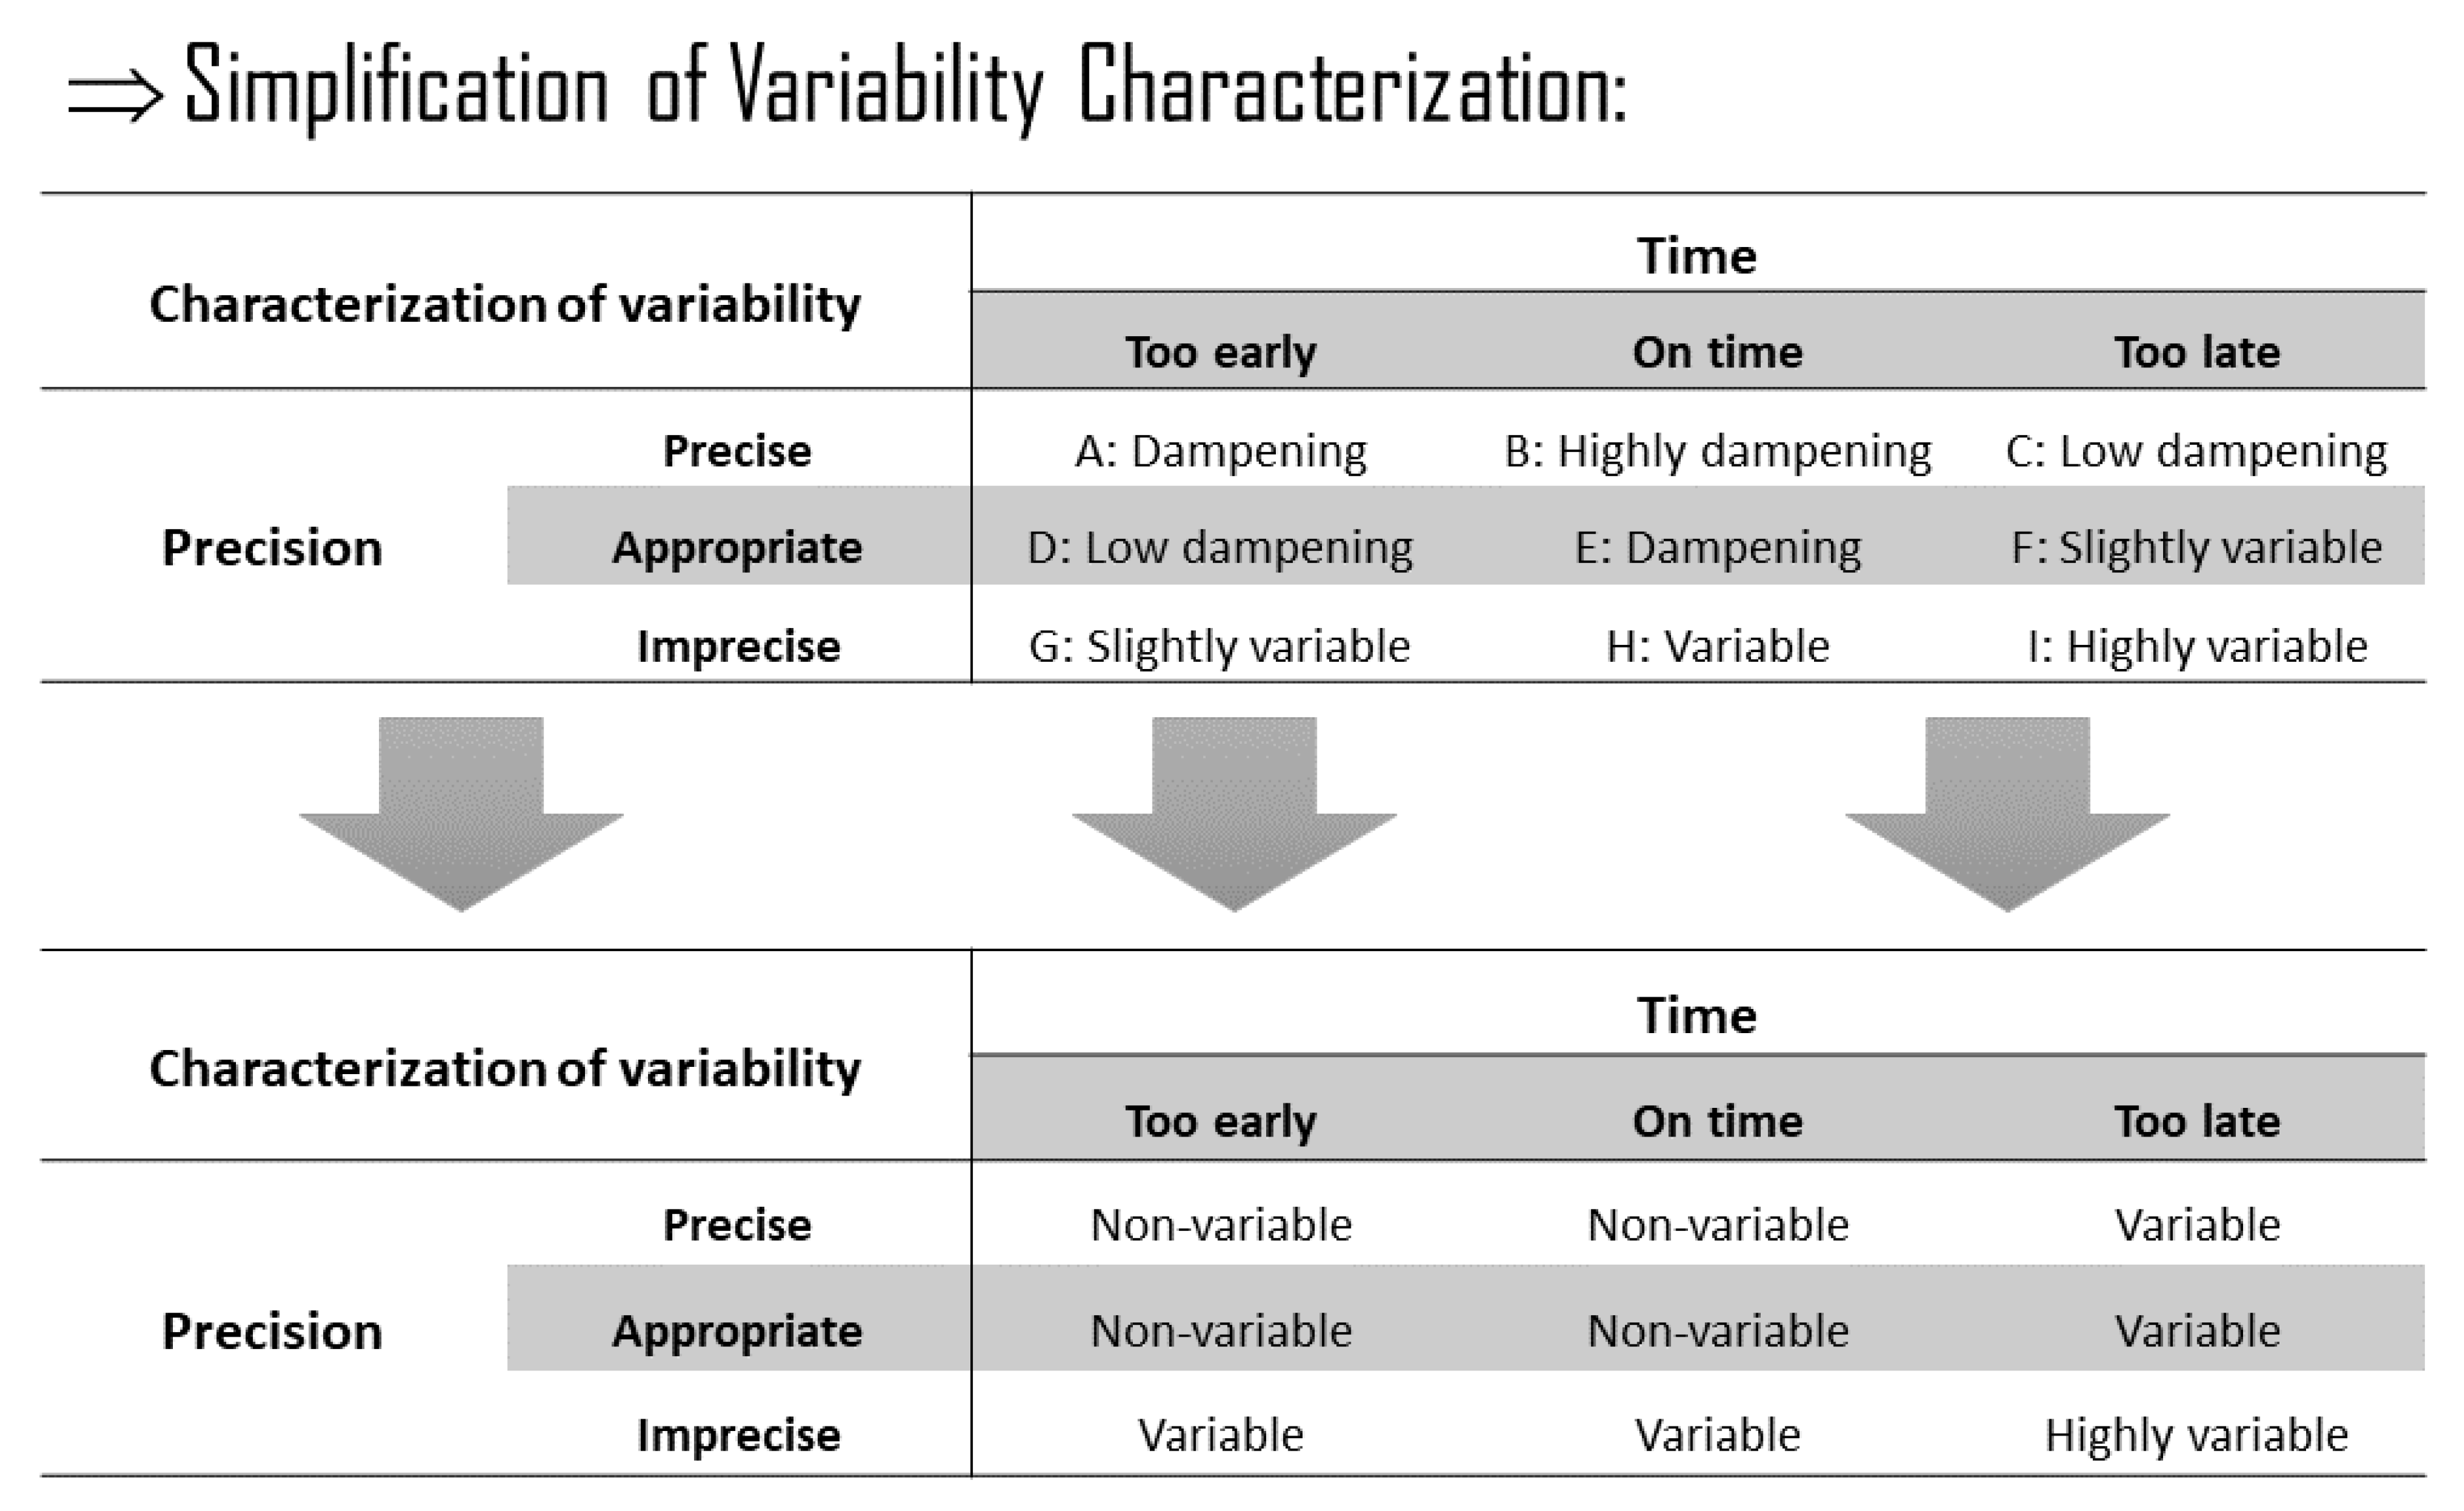
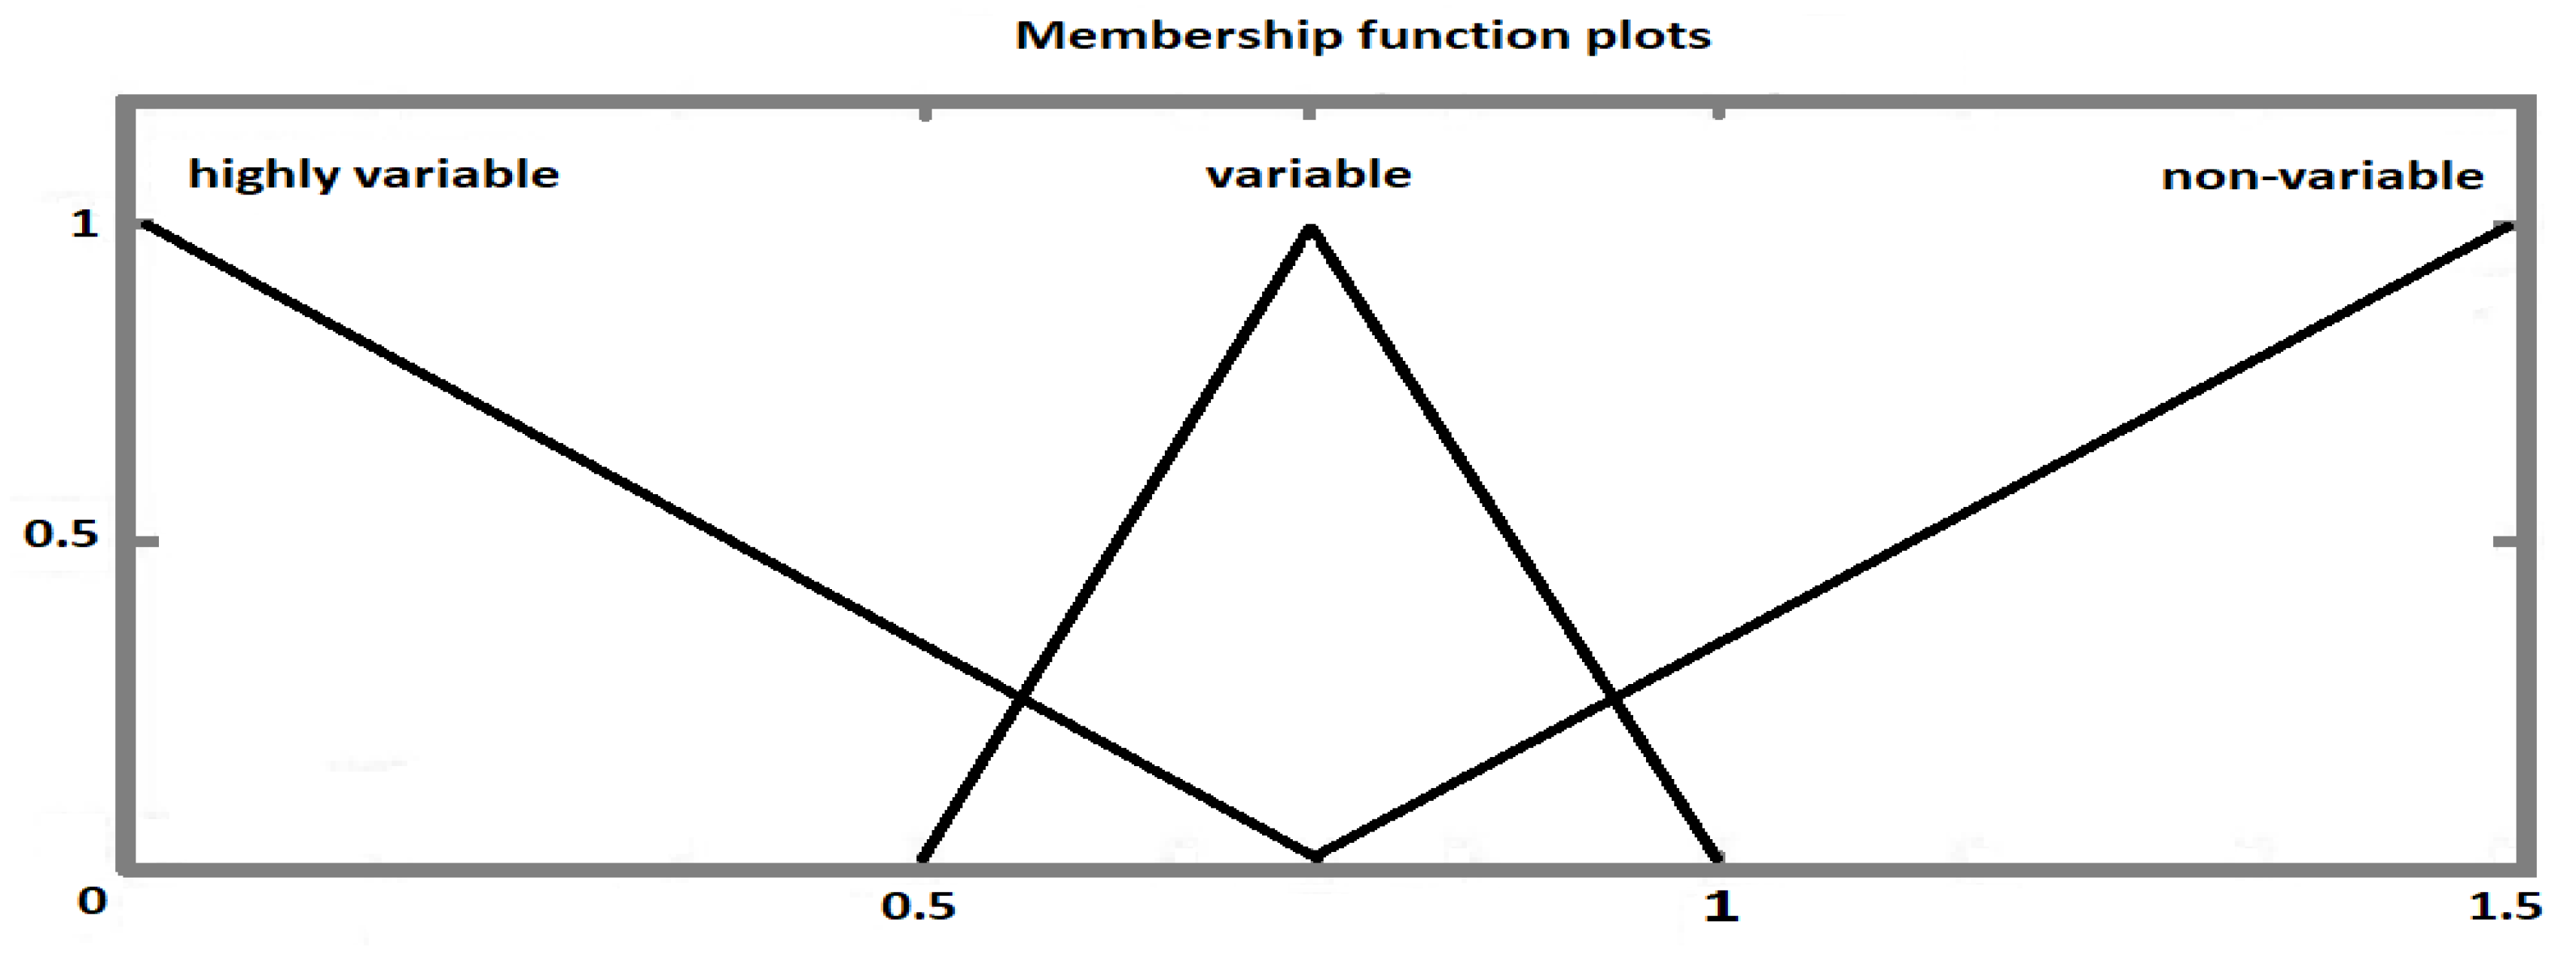
3.3. Step Two: Variability Characterization
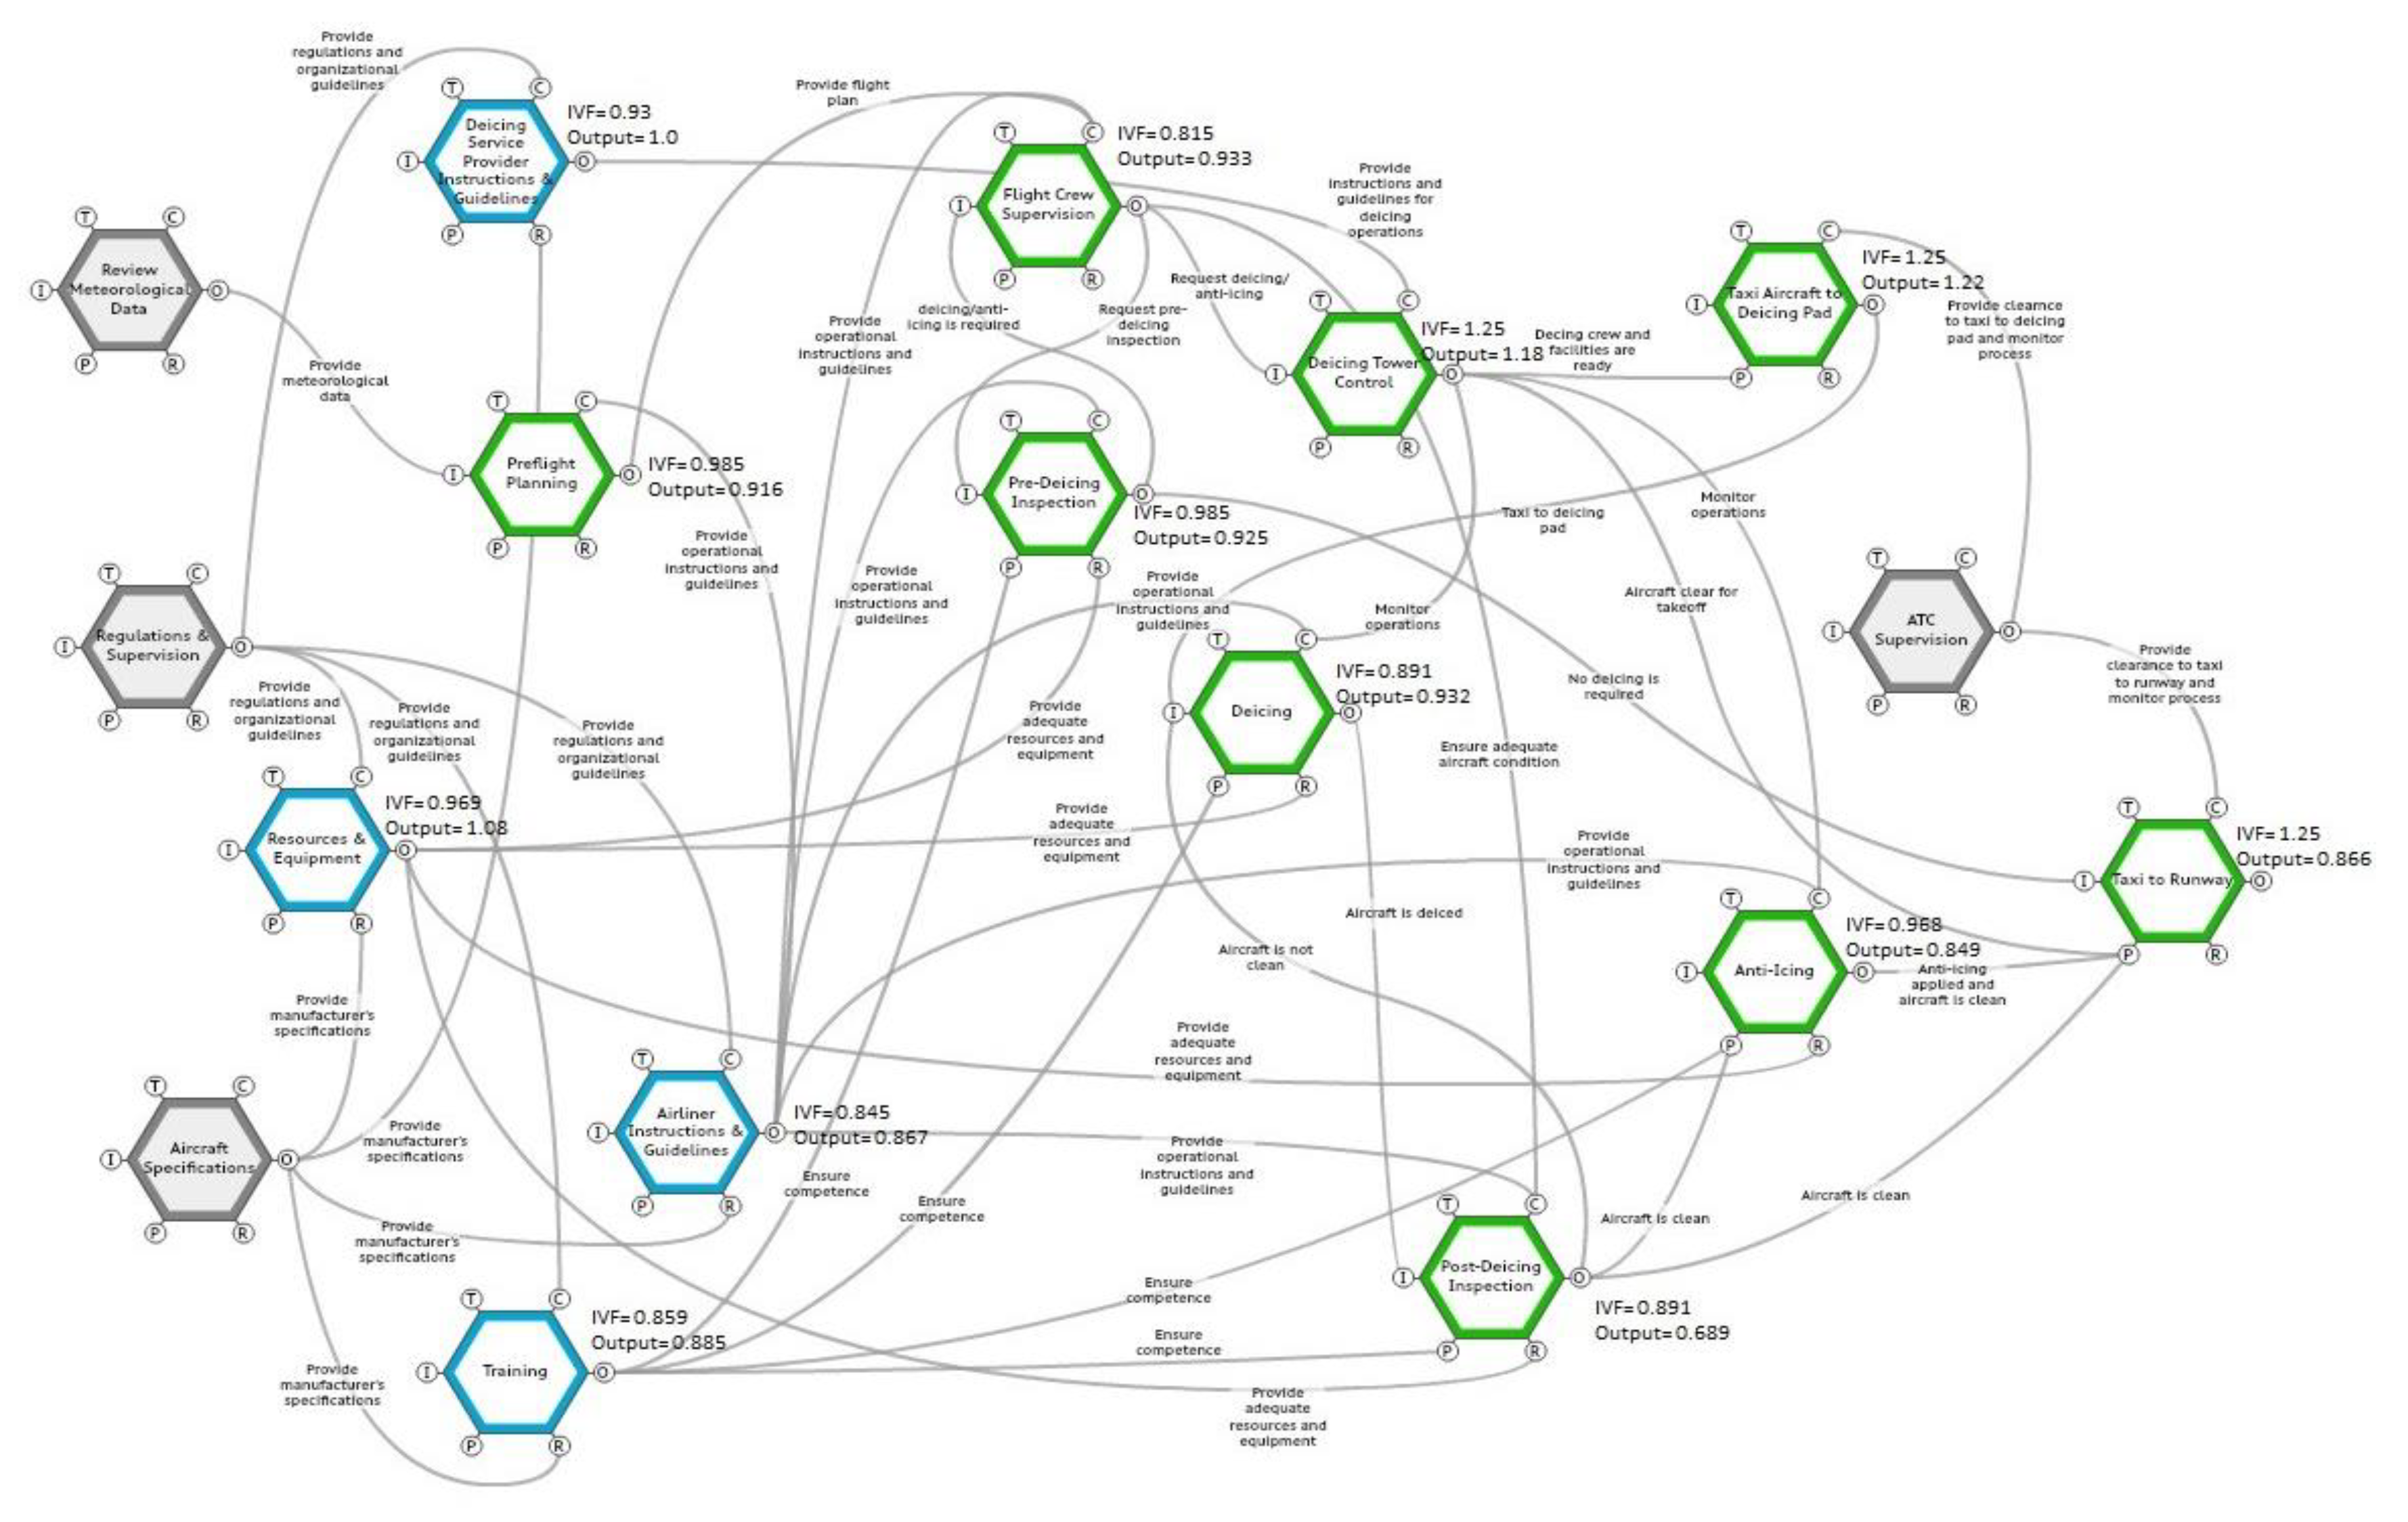
3.4. Step Three: Functional Resonance
3.5. Step Four: Variability Management
4. Discussion
5. Conclusions
Supplementary Materials
Author Contributions
Funding
Acknowledgments
Conflicts of Interest
References
- Patriarca, R.; Adriaensen, A.; Peters, M.; Putnam, J.; Costantino, F.; Di Gravio, G. Resilience Engineering: Current Status of the Research and Future Challenges. Saf. Sci. 2018, 102, 79–100. [Google Scholar] [CrossRef]
- Hollnagel, E. Barriers and Accident Prevention; Ashgate Publishing, Ltd.: Aldershot, UK, 2004. [Google Scholar]
- Hollnagel, E. FRAM, the Functional Resonance Analysis Method: Modeling Complex Socio-Technical Systems; Ashgate Publishing, Ltd.: Farnham, UK, 2012. [Google Scholar]
- Hollnagel, E. Safety-I and Safety-II: The Past and Future of Safety Management; Ashgate Publishing, Ltd.: Farnham, UK, 2014. [Google Scholar]
- García-Lapresta, J.L.; Pérez-Román, D. Consensus-Based Clustering under Hesitant Qualitative Assessments. Fuzzy Sets Syst. 2016, 292, 261–273. [Google Scholar] [CrossRef]
- De Carvalho, P.V.R. The Use of Functional Resonance Analysis Method (FRAM) in a Mid-Air Collision to Understand Some Characteristics of the Air Traffic Management System Resilience. Reliab. Eng. Syst. Saf. 2011, 96, 1482–1498. [Google Scholar] [CrossRef]
- Nouvel, D.; Travadel, S.; Hollnagel, E. Introduction of the Concept of Functional Resonance in the Analysis of a Near-Accident in Aviation. In Proceedings of the 33rd ESReDA Seminar: Future Challenges of Accident Investigation, Ispra, Italy, 13–14 November 2007. [Google Scholar]
- Patriarca, R. New trends for risk and safety management in the aviation domain: A resilience engineering perspective. In New Trends in Civil Aviation; CRC Press: Boca Raton, FL, USA, 2018; pp. 283–288. [Google Scholar] [CrossRef]
- Rosa, L.V.; Haddad, A.N.; de Carvalho, P.V.R. Assessing Risk in Sustainable Construction Using the Functional Resonance Analysis Method (FRAM). Cognit. Technol. Work 2015, 17, 559–573. [Google Scholar] [CrossRef]
- Pickup, L.; Atkinson, S.; Hollnagel, E.; Bowie, P.; Gray, S.; Rawlinson, S.; Forrester, K. Blood Sampling-Two Sides to the Story. Appl. Ergon. 2017, 59, 234–242. [Google Scholar] [CrossRef]
- Patriarca, R.; Falegnami, A.; Costantino, F.; Bilotta, F. Resilience Engineering for Socio-Technical Risk Analysis: Application in Neuro-Surgery. Reliab. Eng. Syst. Saf. 2018, 180, 321–335. [Google Scholar] [CrossRef]
- Patriarca, R.; Gravio, G.D.; Costantino, F.; Tronci, M.; Severoni, A.; Vernile, A.; Bilotta, F. A Paradigm Shift to Enhance Patient Safety in Healthcare, a Resilience Engineering Approach: Scoping Review of Available Evidence. Int. J. Healthc. Technol. Manag. 2017, 16, 319–343. [Google Scholar] [CrossRef]
- Slim, H.; Nadeau, S.; Morency, F. The Application of the Functional Resonance Analysis Method (FRAM) to Evaluate Factors Affecting Times-to-Completion and Graduation in Graduate Studies. In Gesellschaft für Arbeitswissenschaft (Frankfurt, Germany, Feb. 21-23, 2018) Coll. « Kongress der Gesellschaft für Arbeitswissenschaft »; GFA Press: Dortmund, Germany, 2018; Volume 64. [Google Scholar]
- Zadeh, L.A. Outline of a New Approach to the Analysis of Complex Systems and Decision Processes. IEEE Trans. Syst. Man Cybern. 1973, 1100, 38–45. [Google Scholar] [CrossRef]
- Macchi, L.; Hollnagel, E.; Leonhard, J. Resilience Engineering Approach to Safety Assessment: An Application of FRAM for the MSAW System. In Proceedings of the EUROCONTROL Safety R&D Seminar, Munich, Germany, 21–22 October 2009. [Google Scholar]
- Patriarca, R.; Del Pinto, G.; Di Gravio, G.; Costantino, F. FRAM for Systemic Accident Analysis: A Matrix Representation of Functional Resonance. Int. J. Reliab. Qual. Saf. Eng. 2018, 25, 01. [Google Scholar]
- Patriarca, R.; Bergström, J.; Di Gravio, G. Defining the Functional Resonance Analysis Space: Combining Abstraction Hierarchy and FRAM. Reliab. Eng. Syst. Saf. 2017, 165, 34–46. [Google Scholar] [CrossRef]
- Patriarca, R.; Bergström, J. Modelling Complexity in Everyday Operations: Functional Resonance in Maritime Mooring at Quay. Cognit. Technol. Work 2017, 19, 711–729. [Google Scholar] [CrossRef]
- Patriarca, R.; Di Gravio, G.; Costantino, F. A Monte Carlo Evolution of the Functional Resonance Analysis Method (FRAM) to Assess Performance Variability in Complex Systems. Saf. Sci. 2017, 91, 49–60. [Google Scholar] [CrossRef]
- Slater, D. Modelling, Monitoring, Manipulating and Managing? Modelling Process Flow in Complex Systems; CAMBRENSIS: Hereford, UK, 2017. [Google Scholar]
- Lee, J.; Chung, H. A New Methodology for Accident Analysis with Human and System Interaction Based on FRAM: Case Studies in Maritime Domain. Saf. Sci. 2018, 109, 57–66. [Google Scholar] [CrossRef]
- Zadeh, L.A. Fuzzy Sets. Inf. Control 1965, 8, 338–353. [Google Scholar] [CrossRef]
- Pawlak, Z. Rough Sets. Int. J. Comput. Inf. Sci. 1982, 11, 341–356. [Google Scholar] [CrossRef]
- Slim, H.; Nadeau, S. A Proposal for a Predictive Performance Assessment Model in Complex Sociotechnical Systems Combining Fuzzy Logic and the Functional Resonance Analysis Method (FRAM). Am. J. Ind. Bus. Manag. 2019, 9, 1345–1375. [Google Scholar] [CrossRef]
- Hirose, T.; Sawaragi, T. Extended FRAM Model Based on Cellular Automaton to Clarify Complexity of Socio-Technical Systems and Improve Their Safety. Saf. Sci. 2020, 123, 104556. [Google Scholar] [CrossRef]
- Hollnagel, E. Cognitive Reliability and Error Analysis Method (CREAM); Elsevier: Oxford, UK, 1998. [Google Scholar]
- Pawlak, Z. Rough Set Theory and Its Applications to Data Analysis. Cybern. Syst. 1998, 29, 661–688. [Google Scholar] [CrossRef]
- Pawlak, Z. Some Issues on Rough Sets. In Transactions on Rough Sets I; Springer: Berlin/Heidelberg, Germany, 2004; pp. 1–58. [Google Scholar]
- Pawlak, Z. Rough Sets: Theoretical Aspects of Reasoning about Data; Springer Science & Business Media: Berlin, Germany, 2012; Volume 9. [Google Scholar]
- Hvidsten, T.R. A tutorial-based guide to the ROSETTA system: A Rough Set Toolkit for Analysis of Data. J. Comput. Commun. 2010, 1–43. [Google Scholar]
- Øhrn, A. Discernibility and Rough Sets in Medicine: Tools and Applications. Ph.D. Thesis, Norwegian University of Science and Technology, Trondheim, Norway, 2000. [Google Scholar]
- Jelonek, J.; Krawiec, K.; Slowiński, R. Rough Set Reduction of Attributes and Their Domains for Neural Networks. Comput. Intell. 1995, 11, 339–347. [Google Scholar] [CrossRef]
- Swiniarski, R.W.; Skowron, A. Rough Set Methods in Feature Selection and Recognition. Pattern Recognit. Lett. 2003, 24, 833–849. [Google Scholar] [CrossRef]
- Dimitras, A.I.; Slowinski, R.; Susmaga, R.; Zopounidis, C. Business Failure Prediction Using Rough Sets. Eur. J. Oper. Res. 1999, 114, 263–280. [Google Scholar] [CrossRef]
- Parmar, D.; Wu, T.; Blackhurst, J. MMR: An Algorithm for Clustering Categorical Data Using Rough Set Theory. Data Knowl. Eng. 2007, 63, 879–893. [Google Scholar] [CrossRef]
- Law, R.; Au, N. A Rough Set Approach to Hotel Expenditure Decision Rules Induction. J. Hosp. Tour. Res. 1998, 22, 359–375. [Google Scholar] [CrossRef]
- Komorowski, J.; Øhrn, A. Modelling Prognostic Power of Cardiac Tests Using Rough Sets. Artif. Intell. Med. 1999, 15, 167–191. [Google Scholar] [CrossRef]
- Kumar, A.; Agrawal, D.P.; Joshi, S.D. Advertising Data Analysis Using Rough Sets Model. Int. J. Inf. Technol. Decis. Mak. 2005, 4, 263–276. [Google Scholar] [CrossRef]
- Chien, C.F.; Chen, L.F. Using Rough Set Theory to Recruit and Retain High-Potential Talents for Semiconductor Manufacturing. IEEE Trans. Semicond. Manuf. 2007, 20, 528–541. [Google Scholar] [CrossRef]
- Alisantoso, D.; Khoo, L.P.; Lee, B.I.; Fok, S.C. A Rough Set Approach to Design Concept Analysis in a Design Chain. Int. J. Adv. Manuf. Technol. 2005, 26, 427–435. [Google Scholar] [CrossRef]
- Pawlak, Z.; Skowron, A. Rudiments of Rough Sets. Inf. Sci. 2007, 177, 3–27. [Google Scholar] [CrossRef]
- Dubois, D.; Prade, H. Rough Fuzzy Sets and Fuzzy Rough Sets. Int. J. Gen. Syst. 1990, 17, 191–209. [Google Scholar] [CrossRef]
- Anderson, G.T.; Zheng, J.; Wyeth, R.; Johnson, A.; Bissett, J.; GROUP, T.P. A Rough Set/Fuzzy Logic Based Decision Making System for Medical Applications. Int. J. Gen. Syst. 2000, 29, 879–896. [Google Scholar] [CrossRef]
- Wei, L.L.; Zhang, W.X. Probabilistic Rough Sets Characterized by Fuzzy Sets. Int. J. Uncertain. Fuzziness Knowl. Based Syst. 2004, 12, 47–60. [Google Scholar] [CrossRef]
- Mamdani, E.H.; Assilian, S. An Experiment in Linguistic Synthesis with a Fuzzy Logic Controller. Int. J. Man-Mach. Stud. 1975, 7, 1–13. [Google Scholar] [CrossRef]
- Heckerman, D.; Mannila, H.; Pregibon, D.; Uthurusamy, R. Proceedings of the 3rd International Conference on Knowledge Discovery and Data Mining; AAAI Press: Menlo Park, CA, USA, 1997. [Google Scholar]
- Zou, Z.; Tseng, T.L.B.; Sohn, H.; Song, G.; Gutierrez, R. A Rough Set Based Approach to Distributor Selection in Supply Chain Management. Expert Syst. Appl. 2011, 38, 106–115. [Google Scholar] [CrossRef]
- Patriarca, R.; Adriaensen, A.; Peters, M.; Putnam, J.; Costantino, F.; Di Gravio, G. Receipt and Dispatch of an Aircraft: A Functional Risk Analysis. In Proceedings of the REA Symposium on Resilience Engineering Embracing Resilience: Scaling Up and Speeding Up, Kalmar, Sweden, 24–27 June 2019. [Google Scholar]
- SHK Board of Accident Investigation. Report C 1993:57 Air Traffic Accident on 27 December 1991 at Gottrӧra, AB County Case L-124/91; SHK Board of Accident Investigation: Stockholm, Sweden, 1993; Available online: http://www.havkom.se/assets/reports/English/C1993_57e_Gottrora.pdf (accessed on 15 October 2019).
- Transport Safety Board of Canada (TSB). Aviation Occurrence Report: Collision Royal Air Maroc Boeing 747-400, CN-RGA, Montreal (Mirabel), 1995. International Airport, Québec 21 January 1995; Report Number A95Q0015; TSB: Gatineau, QC, Canada, 1995; Available online: http://www.tsb.gc.ca/eng/rapports-reports/aviation/1995/a95q0015/a95q0015.pdf (accessed on 15 October 2019).
- Cacciabue, P.C. Human Factors Impact on Risk Analysis of Complex Systems. J. Hazard. Mater. 2000, 71, 101–116. [Google Scholar] [CrossRef]
- Roelen, A.L.C.; Klompstra, M.B. The Challenges in Defining Aviation Safety Performance Indicators; PSAM: Helsinki, Finland, 2012. [Google Scholar]
- Konstandinidou, M.; Nivolianitou, Z.; Kiranoudis, C.; Markatos, N. A Fuzzy Modeling Application of CREAM Methodology for Human Reliability Analysis. Reliab. Eng. Syst. Saf. 2006, 91, 706–716. [Google Scholar] [CrossRef]
- Melanson, A.; Nadeau, S. Resilience Engineering for Sustainable Prevention in the Manufacturing Sector: A Comparative Study of Two Methods of Risk Analysis. Am. J. Ind. Bus. Manag. 2019, 9, 267. [Google Scholar] [CrossRef]


| Set of Objects U | Set of Attributes A | Decision D | |||
|---|---|---|---|---|---|
| ... | |||||
| ... | |||||
| ... | |||||
| ... | |||||
| ... | ... | ... | ... | ... | ... |
| ... | |||||
| Function | Common Performance Conditions | IVF | |||
|---|---|---|---|---|---|
| CPC1 | CPC2 | ... | CPCn | ||
| Function 1 | Adequate | Inadequate | ... | Adequate | Non-Variable |
| Function 2 | Adequate | Adequate | ... | Adequate | Non-Variable |
| Function 3 | Inadequate | Adequate | ... | Inadequate | Variable |
| ... | ... | ... | ... | ... | ... |
| Function m | Inadequate | Inadequate | ... | Inadequate | Highly Variable |
| Function | IVF | Input | Time | Control | Preconditions | Resources | Output |
|---|---|---|---|---|---|---|---|
| Function 1 | Non-Variable | Non-Variable | Non-Variable | Non-Variable | Non-Variable | Non-Variable | Non-Variable |
| Function 2 | Non-Variable | Non-Variable | Variable | Variable | Variable | Non-Variable | Variable |
| Function 3 | Non-Variable | Non-Variable | Highly Variable | Non-Variable | Non-Variable | Non-Variable | Variable |
| ... | ... | ... | ... | ... | ... | ... | ... |
| Function m | Highly Variable | Highly Variable | Highly Variable | Highly Variable | Highly Variable | Highly Variable | Highly Variable |
| No. | Function Name | Type | Description |
|---|---|---|---|
| 1 | Review meteorological data | Background | Review of weather conditions for preflight planning and inspections |
| 2 | Aircraft specifications | Background | Aircraft technical and operational information provided mainly by manufacturer |
| 3 | Regulations and supervision | Background | Supervision and regulations provided by governmental agencies |
| 4 | ATC supervision | Background | Clearances provided by the Air Traffic Control (ATC) to navigate aircraft on the airport grounds |
| 5 | Resources and equipment | Organizational | Resources and equipment provided for the inspection and deicing operations |
| 6 | Training | Organizational | Training provided to the deicing personnel |
| 7 | Airliner instructions & guidelines | Organizational | Guidelines provided by the airliner for the flight crew and deicing personnel |
| 8 | DSP instructions & guidelines | Organizational | Guidelines provided by the Deicing Service Provider (DSP) to its personnel |
| 9 | Preflight planning | Human | Flight planning performed by the pilot and the flight dispatcher |
| 10 | Flight crew supervision | Human | Supervision provided by the pilot and flight crew to monitor and control operations |
| 11 | Deicing tower control | Human | Supervision provided by the deicing tower or the bay-lead to monitor and control operations |
| 12 | Pre-deicing inspection | Human | Inspection of the aircraft to decide if deicing/anti-icing is required |
| 13 | Taxi aircraft to deicing pad | Human | Taxi aircraft from gate to the deicing pad |
| 14 | Deicing | Human | The application of deicing fluids and removal of contamination |
| 15 | Post-deicing inspection | Human | Inspection after deicing to ensure all surfaces are clean |
| 16 | Anti-icing | Human | The application of anti-icing fluid to keep aircraft clean until take-off |
| 17 | Taxi to runway | Human | Taxi aircraft from deicing pad to runway for takeoff within the specified holdover time |
| No. | Function Name | Conditions of Work | Number of Goals & Conflict Resolution | Quality & Support of the Organization | IVF |
|---|---|---|---|---|---|
| 1 | Resources and equipment | 9 | 9 | 9 | 0.969 |
| 2 | Training | 7 | 9 | 5 | 0.859 |
| 3 | Airliner Instructions & guidelines | 8 | 9 | 4 | 0.845 |
| 4 | DSP instructions & guidelines | 8 | 8 | 9 | 0.93 |
| No. | Function Name | Availability of Resources | Goals & Conflict Resolution | Quality of Communication | Availability of Procedures and Plans | Training & Experience | Available Time | Circadian Rhythm and Stress | Team Collaboration | IVF |
|---|---|---|---|---|---|---|---|---|---|---|
| 1 | Preflight planning | 9 | 10 | 8 | 8 | 8 | 8 | 9 | 10 | 0.985 |
| 2 | Flight crew supervision | 6 | 10 | 6 | 6 | 6 | 6 | 9 | 10 | 0.815 |
| 3 | Deicing tower control | 10 | 10 | 10 | 10 | 10 | 10 | 10 | 10 | 1.25 |
| 4 | Pre-deicing inspection | 8 | 10 | 8 | 8 | 8 | 8 | 9 | 10 | 0.985 |
| 5 | Taxi aircraft to deicing pad | 10 | 10 | 10 | 10 | 10 | 10 | 10 | 10 | 1.25 |
| 6 | Deicing | 10 | 10 | 7 | 7 | 7 | 7 | 10 | 10 | 0.891 |
| 7 | Post-deicing inspection | 10 | 10 | 7 | 7 | 7 | 7 | 10 | 10 | 0.891 |
| 8 | Anti-icing | 10 | 10 | 8 | 8 | 8 | 7 | 10 | 10 | 0.968 |
| 9 | Taxi to runway | 10 | 10 | 10 | 10 | 10 | 10 | 10 | 10 | 1.25 |
| No. | Function Name | Output’s Score |
|---|---|---|
| 1 | Review meteorological data | 1.0 |
| 2 | Aircraft specifications | 1.0 |
| 3 | Regulations and supervision | 1.0 |
| 4 | ATC supervision | 1.0 |
| 5 | Resources and equipment | 1.08 |
| 6 | Training | 0.885 |
| 7 | Airliner instructions & guidelines | 0.867 |
| 8 | DSP instructions & guidelines | 1.0 |
| 9 | Preflight planning | 0.916 |
| 10 | Flight crew supervision | 0.933 |
| 11 | Deicing tower control | 1.18 |
| 12 | Pre-deicing inspection | 0.925 |
| 13 | Taxi aircraft to deicing pad | 1.22 |
| 14 | Deicing | 0.932 |
| 15 | Post-deicing inspection | 0.689 |
| 16 | Anti-icing | 0.849 |
| 17 | Taxi to runway | 0.866 |
© 2020 by the authors. Licensee MDPI, Basel, Switzerland. This article is an open access article distributed under the terms and conditions of the Creative Commons Attribution (CC BY) license (http://creativecommons.org/licenses/by/4.0/).
Share and Cite
Slim, H.; Nadeau, S. A Mixed Rough Sets/Fuzzy Logic Approach for Modelling Systemic Performance Variability with FRAM. Sustainability 2020, 12, 1918. https://doi.org/10.3390/su12051918
Slim H, Nadeau S. A Mixed Rough Sets/Fuzzy Logic Approach for Modelling Systemic Performance Variability with FRAM. Sustainability. 2020; 12(5):1918. https://doi.org/10.3390/su12051918
Chicago/Turabian StyleSlim, Hussein, and Sylvie Nadeau. 2020. "A Mixed Rough Sets/Fuzzy Logic Approach for Modelling Systemic Performance Variability with FRAM" Sustainability 12, no. 5: 1918. https://doi.org/10.3390/su12051918
APA StyleSlim, H., & Nadeau, S. (2020). A Mixed Rough Sets/Fuzzy Logic Approach for Modelling Systemic Performance Variability with FRAM. Sustainability, 12(5), 1918. https://doi.org/10.3390/su12051918