1. Introduction
In many developed countries, the period of rapid expansion of new road networks has reached its peak, existing road infrastructure is outdated, and a significant number of roads are approaching the end of their exploitation life. Pavement damages are the result of many different impacts on roads and occur in varying degrees of intensity. In many Western European and US countries, binding materials with improved viscoelastic range should play a leading role in sustainable road construction concerning the environmental aspects [
1].
Cold recycling technology for the reconstruction of pavement structures is a rational and environmentally advanced approach in the system of modern road exploitation. As a raw material to produce new pavement layers of extremely good mechanical characteristics, the damaged layers of existing pavement structures are used, with the amount of binder lower than in conventional asphalt mixtures. It significantly reduces the need for the exploitation of natural resources and the use of new materials to develop a sustainable road network [
2,
3,
4]. Compared to conventional pavement rehabilitation procedures, the usage of recycled layers reduces energy consumption during construction and indirectly reduces emission of greenhouse gases. In addition, by this procedure, the time required to execute the works was shortened, too. With all the above, the activities of removing, transporting, and depositing old pavement material are minimized or do not exist at all [
2]. The recycling of asphalt obtained by the process of scraping surface layers of pavement structures consists of the selection of waste material, crushing of asphalt layers, removal of impurities, and mixing with natural aggregate. All built-in components must be removed and prevented from mixing with other materials such as concrete, earth, clay, glass, plaster, paper, or wood. The plants for recycling aggregates are not significantly different from plants that produce crushed aggregate from natural sites. Any variant that promotes the reuse of construction components and the recycling of scraps of construction materials would transform the method by which the construction sector currently operates and would create a vision for new business development [
5].
The paper presents the current and improved state of recycling of current flexible pavement structures under different conditions with the aid of experimental research and mathematical modeling in a function of parameters related to the production of recycled asphalt. The scope of the research included recycling materials from existing flexible pavement structures on both main roads and roads with low traffic loads. The materials tested were obtained from road maintenance, reconstruction, and demolition.
2. Background of the Research
Testing and development of methods and equipment suitable for recycling materials from pavement layers is ongoing constantly. New technologies allow an increasing number of pavement materials to be reused. The best technologies allow nearly 100% of the extracted asphalt to be used to produce new asphalt concrete. However, this extremely efficient process has not become widely used yet. Still, it is a challenge for researchers and innovators to continue developing technological improvements to increase the overall efficiency of recycling methods [
6,
7,
8].
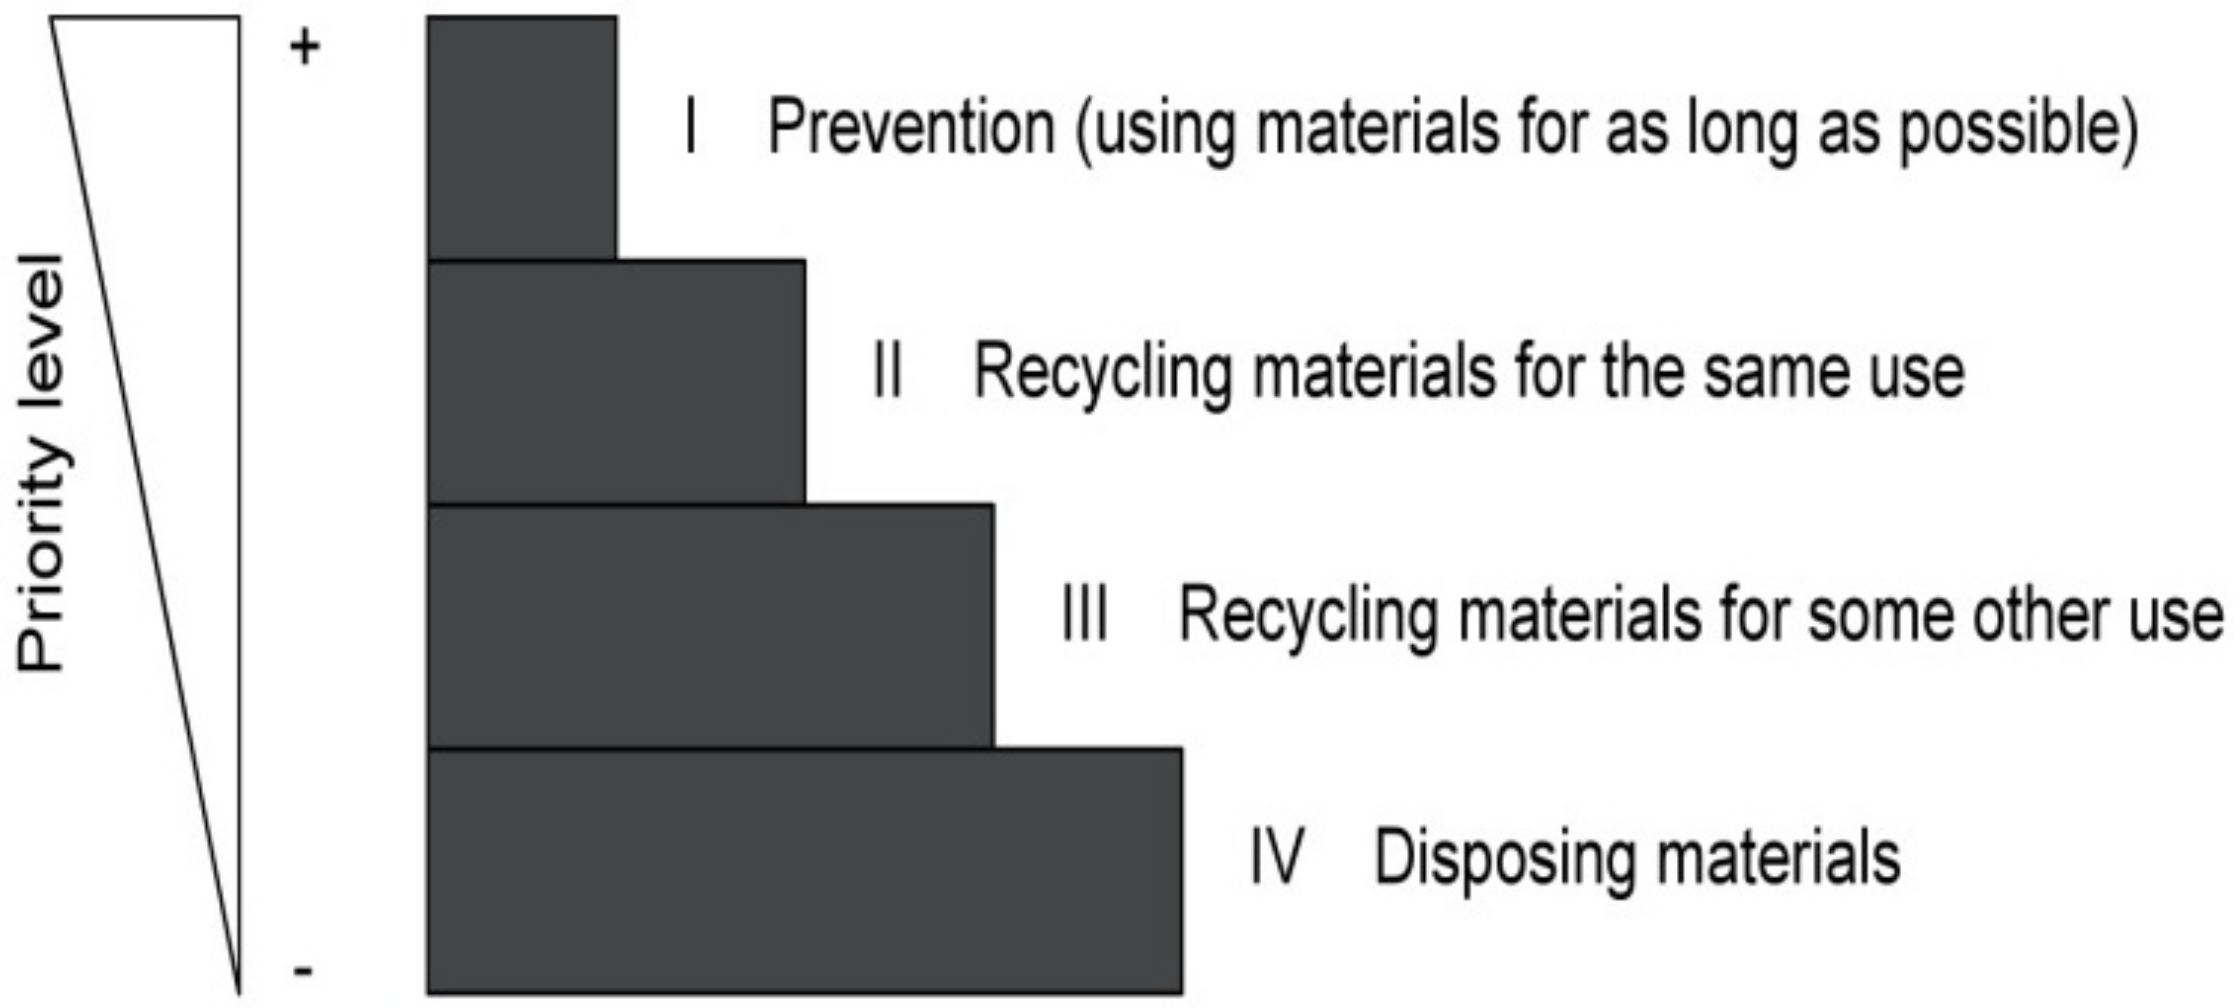
As a useful strategy for preserving material in the road economy is a so-called “scale concept”, which is widespread. According to this concept, illustrated in
Figure 1, the efforts should concentrate on the use of the most durable pavement materials, for example, the construction of roads with long design life [
6,
7].
However, individual components can be modified to obtain an optimally designed asphalt mixture. Road sections that would be recycled would result in minimal traffic disruptions, so that the road would be open for traffic as works progress. Additionally, a thorough examination of pavement material that is the subject of recycling is necessary, with the identified deficiencies of the recycled mixture being adjusted by certain additives in the mixture. Consequently, pavement materials have been studied for many years [
9]. In a study [
10], an experimental research of recycled asphalt with high percentages used in a new pavement structure is presented. The study characterizes the mechanical behavior of bituminous mixtures. Two semi-dense mixtures of 12 and 20 mm were analyzed as the maximum aggregate size containing 40% and 60% of the recycled mixture, i.e., (S-12 and S 20, in accordance with Spanish specifications). The authors [
11] worked on an analytical approach to evaluate the performance of cold asphalt mixture of recycled layers. The experimental research was conducted by producing in parallel two series of cold-prepared asphalt concrete, one with new mineral aggregates and the other with recycled aggregate from a pavement structure. The study identified the influence of different variables on mixtures of both types of samples. Researchers [
12] conducted research focused on the use of recycled roofing shingles in pavement layers. Tests showed that a percentage of 4–6% of shingles is the optimum proportion that fully meets the qualitative and quantitative characteristics of pavement structure. Author [
13] implemented and tested the mechanical properties of foam-stabilized mixes for a recycled pavement mixture in detail. He experimentally presented and compared the mechanical properties of foamed bitumen created by two different gradations and eight types of bitumen from six different sources. The foam-stabilized mixes provided reasonable moisture resistance as the index of retained strength (IRS) exceeded 80 to 90% after 5 days of soaking. In addition, the same author in [
14] analyzed the characterization of foamed bitumen, the quality and mechanical properties of mixes. In his research, the quality of foamed bitumen was assessed by two empirical parameters, namely half lifetime and expansion ratio. New methods were developed to characterize the foam quality that was specifically developed in that study. This researcher proposed a method that would use a so-called brook field.
For roads with high traffic loads, maintenance and reconstruction activities can lead to significant release of asphalt concrete, so recycling of extracted material becomes a high priority. For roads with low traffic loads, relatively small amounts of extracted asphalt are produced, and it is more important to properly recycle granular materials, as well as unbound or bonded substrate layers. Recycling of asphalt into new asphalt layers is of less importance due to the limited quantity and quality of the material so that its reuse as an unbound aggregate in the substrate or subbase course is more widespread [
15,
16,
17]. Some other authors in [
18] provided the analysis of results obtained by measuring biggest rutting depths determined on asphalt samples of different composition. The resistance to rutting was measured by a small-size device according to procedure B as specified in EN 12697-22 [
19], and the composition of the sample was determined by a spatial model in which components were expressed as volume concentrations. Statistical analysis of the research results has revealed dependence of rutting depth on asphalt sample composition, which is valid for all test samples. In experimental work done by the authors [
20] described and analyzed the results obtained by measuring tensile strength of asphalt samples of different composition, which discovered the dependence of the tensile strength on the asphalt sample composition. This test was measured by an indirect method, and the asphalt sample composition was defined according to a spatial model in which components were expressed by volume concentrations. The statistical analysis of the measurement results revealed the functional dependence of the asphalt sample tensile strength on its composition. Optimization of foaming and bitumen properties have been extensively elaborated by experts at study [
15], where foamed bitumen was produced after adding water under regulated pressure (water pressure at a gauge of 1 Bar to be greater than air pressure) and the required temperature of bitumen.
3. Materials and Methods
3.1. Materials
Due to the specificity of recycling machinery and simplification of recycling process, the techniques of recycling have been defined at the international level. The recycling techniques involve defining sites and materials in flexible pavement structures, the way of recycling current pavement structures and conditions for using the same structure for new roads. Based on the set of rules, recycled asphalt can be used as:
For cold recycling, granular material can be directly embedded, but with certain limitations in quantity due to inappropriate accuracy in its formula and stabilizers, which are determined by laboratory. The amount used on site is determined by practical tests and its percentage varies within the range of 20–50%.
Primary raw material in a cold recycling process is a recycled aggregate that is produced by mechanical treatment (milling and, if necessary, further crushing) of existing pavement layers in an on-site recycling process, optionally mixing with new stone material that is brought to the site of installation and added in order to improve grain-size distribution of whole recycled aggregate mixture. Stone aggregates in a mixture of milled recycled aggregate originally used to produce current pavement layers meet certain quality parameters. When recycling, it is not necessary to re-prove some of aggregate properties, such as shape index, crushing resistance, total sulfur content, and freezing and thawing resistance. The above does not apply if the aggregate is from another source or its origin is unknown [
6,
10].
3.2. Hypothesis
The initial hypothesis of the study Equation (1) is that the influence of milled asphalt in the process of producing bituminous base courses of pavement is the objective function of input variables:
where
a1 represents a recycled aggregate from asphalt layers,
a2 represents a new aggregate to be added to the asphalt mixture,
b1 represents bitumen extracted from the recycled asphalt mixture,
b2 represents new bitumen to be added to the asphalt mixture,
sz represents the indirect tensile strength of the specimen,
dz represents the indirect tensile strength in the wet and dry state of the specimen,
ρ represents the density of the specimen,
pa represents the characteristics of the asphalt surface,
c represents cement in a new added mixture.
By applying the method of optimization, the optimum solution of the process of making recycled asphalt mass by cold process will be determined. As a result, testing recycled material in road construction must be shifted from a simple testing of mixture components to a mixture performance test.
The process of producing bituminous asphalt base of road construction made of milled asphalt enhanced with hydraulic cement binders and cold-foamed bitumen is a complex technological process conditioned by several parameters, some parameters are variable and some are of constant size. Their significance depends on the characteristics of the observed output size. Due to the specific composition of asphalt mixture, which is not common in practice and can be classified as rigid and flexible road surfacing in a certain way, it is practically impossible to determine reliably and theoretically its composition using analytical models. Accordingly, the application of experimental analysis of the investigated parameters is of great importance for improving the technological procedure for processing and installing the asphalt mixture made of recycled asphalt that is produced by cold process, with the aim of shortening the production process and its control, i.e., reducing production costs while maintaining the quality of asphalt mixture and installation in accordance with required standards.
The aim of the experimental research is to investigate influential parameters, such as: maximum percentage of milled asphalt from a pavement structure, cement binder admixture, foamed bitumen binder admixture, and the analysis of experimental data in terms of achieving the maximum tensile strength ratio of wet and dry specimens, maximum density ratio of dry and wet specimens without compromising quality and by reducing the overall costs of the production process. The purpose of the experiment plan is to generate mathematical models, a relevant equation (Second-degree polynomials) that describes the process. If parameters studied in the experiment are really those that affect the process, and the data obtained by the experiment of acceptable accuracy and precision, then it is possible to develop a model that describes the process in a credible way.
3.3. Sample Preparation
In this case, the main goal is to create a model that can reliably predict the amount of cement required (percentage) if the amount of bitumen is known (also percentage), the required tensile strength of the dry specimen and the ratio of tensile strength of the wet and dry specimen. By identifying influential factors, it determines the influential sizes and their changes significantly affect the desired (output) size. In this regard, the basic sizes that enter the process (mathematical model) are:
The quality of the recycled mixture produced by a cold recycling process is determined by the Indirect Tensile Strength (ITS) measured by a standard procedure on a laboratory-prepared test object. The laboratory test object is prepared according to the Marshall method in a mold of 100.6 mm (4 inch) with 2 × 75 strokes on a standard Marshall rammer. Thereafter, according to the procedure, a specimen is left for 24 h in a mold at room temperature (20–25 °C). The specimen is then removed from the mold and conditioned for 72 h at a constant temperature of 60 ºC in an air circulation thermostat. The indirect tensile strength is measured on specimens thus prepared in dry (ITSs) and wet (ITSv) conditions. To test specimens in dry conditions, laboratory test objects prepared as described above are conditioned at a temperature of 25 ± 1 °C for at least one and not more than two hours prior to the test.
The following section provides equations used to calculate the properties of the laboratory test object prepared by compaction according to a modified Proctor method in the process of determining the quality of recycled mixture prepared by cold recycling procedure.
The density of the wet specimen is defined by the Equation (2):
where
h represents the mean height of the specimen [m], while
d represents the diameter of the specimen [m].
The density of the dry specimen is defined by the following Equation (3):
where
%masH2O represents the mass percentage of water in the specimen,
AU represents the surface of the asphalt specimen [m
2],
h represents the mean height of the specimen [m], and
d represents the diameter of the specimen [m].
The following section presents equations used to calculate the properties of the laboratory test object prepared by compaction according to the Marshall (2 × 75 strokes at 25 °C) method in the process of determining the quality of asphalt mixture prepared by cold recycling procedure.
The ITS of the dry and water-saturated specimen is obtained by the following Equation (4):
where
h represents the mean height of the specimen [m],
d represents the diameter of the specimen [m],
P represents the fracture force [N].
The retained tensile strength is obtained by the Equation (5):
The experiment examined the following parameters of producing laboratory specimens with the content of 85% of recycled aggregate in five levels:
The parameters were tested in different combinations with different percentage amounts of cement, foamed bitumen, and fresh aggregate according to a standard procedure.
3.4. The Laboratory Testing Procedure
The laboratory testing procedure in the process of designing cold recycling consists of the following phases.
3.4.1. Preparation of Raw Materials for Designing the Composition of Recycled Mixture:
For the purpose of sampling the pavement structure, determining the thickness and composition of individual pavement layers, testing grain-size distribution, plasticity index, moisture content, composition and properties of milled asphalt,
Defining the composition design; combination of different aggregates (mixing ratio of milled asphalt to stone material, depth of intervention, type of binder),
Testing the optimum moisture content by MPP (modified Proctor procedure) (4) and (5),
Determining the binder content in milled asphalt by extraction of binder from heated milled asphalt mixture,
Determining penetration on bituminous binder separated from milled asphalt mixture,
Testing how much cement/lime (depending on plasticity index) is needed to be added,
Testing how much bitumen binder (depending on physical and mechanical properties) is needed to be added.
3.4.2. Determination of the Grain-Size Distribution of Recycled Mixture (RM) as Specified in EN 933-1/A1:
Determining the grain-size distribution of milled asphalt as specified in EN 933-1/A1 [
21]
Determining the grain-size distribution of a milled mechanically compacted unbound layer under asphalt layers as specified in EN 933-1/A1 [
21]
Determining the number of added fractions to improve the granulometry of a mixture of milled asphalt and unbound layers below the asphalt
Determining the plasticity index for a mixture of recycled material as specified in ASTM D 422
Determining optimum moisture by MPP as specified in EN 1097-5 and AASHTO T-180. The method for determining optimum moisture is defined in detail in a composition design procedure [
22]
3.4.3. Determining Dry or Laboratory Reference Density and Optimum Humidity
Mixtures consisting of an unbound bituminous layer and a coarse aggregate are generally less sensitive to moisture in terms of determining their optimum humidity during compaction. Therefore, the optimum moisture content of these mixtures is determined by manual mixing, which can be used to deduce cohesion and workability of the mixture.
Optimum humidity is used to evaluate the behavior of hand-mixed specimens, while the dry laboratory reference volume is determined using the Proctor test as specified in EN 13286-2 at optimum humidity on one test specimen. In mixtures that are moisture sensitive when compacting, the optimum humidity is determined by the standard procedure as specified in EN 13286-2 [
23].
The optimum moisture content can also be determined during the compaction of test specimens. If there is water release from the mold during the production of test specimens, without further increase in density and with water beginning to flow from the specimen, the humidity in the prepared specimen is close to optimum. When adding water to the mixture, the presence of water in bitumen emulsion must be taken into account. The real humidity of the mixture is determined according to EN 1097 [
22].
3.4.4. Determining Binder Characteristics and Optimum Binder Amounts in Recycled Mixtures
For recycled mixtures stabilized with foamed bitumen, it is necessary to determine the optimum content of foamed bitumen and foaming bitumen characteristics (expansion coefficient and degradation half-life, optimum bitumen foaming temperature, and optimum amount of water for bitumen foaming). For designing the composition, we select the bitumen content at which the highest value of the ITS of wet specimen group is obtained. For recycled mixtures stabilized with bituminous emulsion: determination of the optimum content and characteristics of bitumen emulsion and stability if bitumen emulsion is used as a binder in combination with cement. For recycled mixtures stabilized with cement or other hydraulic binders: determination of the optimum content of cement binder [
24]. The calculation of the cement proportion of the mixture is carried out using the Equation (6):
where %
C/mixture represents the proportion of cement in an embedded, fully compacted base course [% (m/m)],
MC represents the mass of cement spreading over m
2 expressed in [kg/ m
2],
ρZS represents the density (dry Proctor density) of the fully compacted base course expressed in [kg], whereas
DZS represents the thickness of the base course made of recycled cement-stabilized pavement structure expressed in [m].
If, in laboratory, a certain optimum content of cement is expressed as a percentage, then the sum of cement and recycled material must be 100% by definition. The unit used to express the proportion of cement in the mixture is [% (m/m)]. If, in laboratory, a certain content of cement is expressed as a fraction (C/100RM) per 100 parts of recycled material, then the proportion of cement in the mixture (C/100RM) is calculated by the Equation (7) [
16]:
where
C/100RM represents the proportion of cement per 100 parts of recycled aggregate; while %
C represents the percentage of cement in the mixture.
3.4.5. Designing Test Specimens and Measuring the ITS and Water Resistance
Producing test specimens for measuring the ITS and water resistance. Six test specimens are prepared for one RM. Three of them are used to test the tensile strength of cross-section after seven days and three to test the decrease of ITS after seven days of air storage and seven days of storage in water. The preparatory specimen for testing the mass is made using the Equation (8): [
6]
where
V represents the volume of specimen in [cm
3];
p represents the volume density of dry soil in [g/cm
3];
w represents the humidity of the mixture in [%].
In a mixture with a cement binder or other hydraulic binders, bitumen emulsion with a cement binder or foamed bitumen, the specimen is stored in a mold at a temperature of (20 ± 2) °C for a period of (24 ± 6) h. The compacted specimen is then weighed with an accuracy of ± 1 [g] and its average height (average of four measurements) ± 1 mm is determined. The compacted specimen should have a height of (125 ± 20) mm. Holding it at humidity of 90% to 100% can be replaced by using airtight containers. The nurturing of test specimens and their testing is performed as follows:
Seven days after being produced, three specimens are tested for cross-section tensile strength
Seven days after being produced, three specimens are placed in water for further seven days at a temperature of (20 ± 2) °C, after which they are tested for water resistance.
When using slow-sticking binders, maturation time is prolonged.
3.4.6. Laboratory Testing of Specimen Density
Two specimens need to be tested as specified in EN 12697-6+A1, procedure D. The EN12697-6 +A1 standard is intended for asphalt produced by hot processing. Regarding the standard, weighing is possible with an accuracy of ± 1 g [
25].
3.4.7. Determining the Maximum Density of Recycled Mixture
Determining the maximum volume of the mixture is carried out on two test specimens in water as specified in EN 12697-5+A1, procedure A. The EN12697-5+A1 standard is intended for asphalt produced by hot processing. Regarding the standard, weighing is possible with an accuracy of ± 1 [g] [
25].
3.4.8. Calculation of Void Proportion
The proportion of voids is determined by the maximum density of the mixture and specimen density by the Equation (9):
where
Vm represents the proportion of voids,
pm represents the maximum density of the mixture;
pt represents the specimen density.
3.4.9. Determining the ITS and Water Resistance
At this stage, there is a procedure as specified in EN 13286-42 satisfying the following conditions: (1) the specimen should be air-tempered; (2) the specimen should stand for four hours at a temperature of (15 ± 1) °C; (3) the pressure bar has an average width of 0.1 cm; (4) the specimen is tested with a constant pressure displacement of (50 ± 1) mm/min [
26]. The results of testing specimen strength by indirect tension are calculated using the Equation (10):
where
Rt represents the strength of the specimen at cross-section [kN/m];
F represents the maximum load force at specimen cracking [F];
H represents the specimen height [mm];
D represents the specimen diameter [mm].
The result is determined by an average of three specimens. If one of the values differs by more than 20% from the average value, the specimen must be discarded and the average is calculated based on two remaining values.
3.4.10. Determining the Compressive Strength and Resistance to Freezing and Water (EN 14227-1)
The maximum time from the moment of producing a fresh mixture to preparing a test specimen is one hour (in case of using foamed bitumen, three hours). If it is not possible to ensure timely delivery of fresh mixture to the laboratory for testing, the production of on-site test specimens must be ensured.
In mixtures stuck with cement binders and other hydraulic binders, the following features are controlled: (1) humidity, (2) compressive strength and freezing and water resistance (EN 14227-1) [
27], (3) ITS, and (4) water resistance. In mixtures stuck with cement binders and bituminous emulsion or foamed bitumen, the following features are controlled: (1) humidity and (2) ITS and water resistance. In mixtures stuck with bitumen emulsion or foamed bitumen, the following features are controlled: (1) humidity, (2) ITS and water resistance, (3) void proportion.
3.4.11. Determining the Expansion Coefficient and Degradation Half-Life of Foamed Bitumen
The purpose of this test is to determine the characteristics and properties of foamed bitumen to ensure good-quality wrapping of aggregate grain. The experimental space is defined by the area of changes in basic factors. For the purposes of the experiment, i.e., modeling, tests have been carried out with factor changes that can be found in practical applications. It means that the percentage of bitumen changes at an interval of 0.5%–2.5%, and the percentage of cement changes at an interval of 0%–2%. For a degree model, one of the values (mean or one of boundary values) is determined by interpolation, i.e., extrapolation since tabular experimental data can hardly reach the condition that
fsr2 = fmaxxfmin required by this model. Based on the previous experience and research, for defining the dependence of achieved tensile strength for a given composition on a wet and dry specimen, the starting point is the first-order model that will be extended to a model with two-factor interaction. All input sizes (factors) are varied at two levels, implying minimum, maximum, and central-point values that may occur at the interval of interest. The mathematical model is developed for a two-level two-factor 2
k plan of the experiment that requires a minimum of
N = 2k = 22 = 4 (Equation (11)) of experimental point. The plan will be expanded with additional points (repeated measurements) at the center of the interval (central point). If such a model proves to be inadequate, there is a switch to a higher-order model, i.e., the previous model is extended by four symmetric points on the central axes (±α) to improve accuracy. This central composite rotatable plan has in total:
i.e.,
experimental points where
N represents the total number of experiments,
k represents the number of varied factors,
k = 2, while
n0 represents the number of repetitions of the experiment at the central point, for this model
n0 = 5.
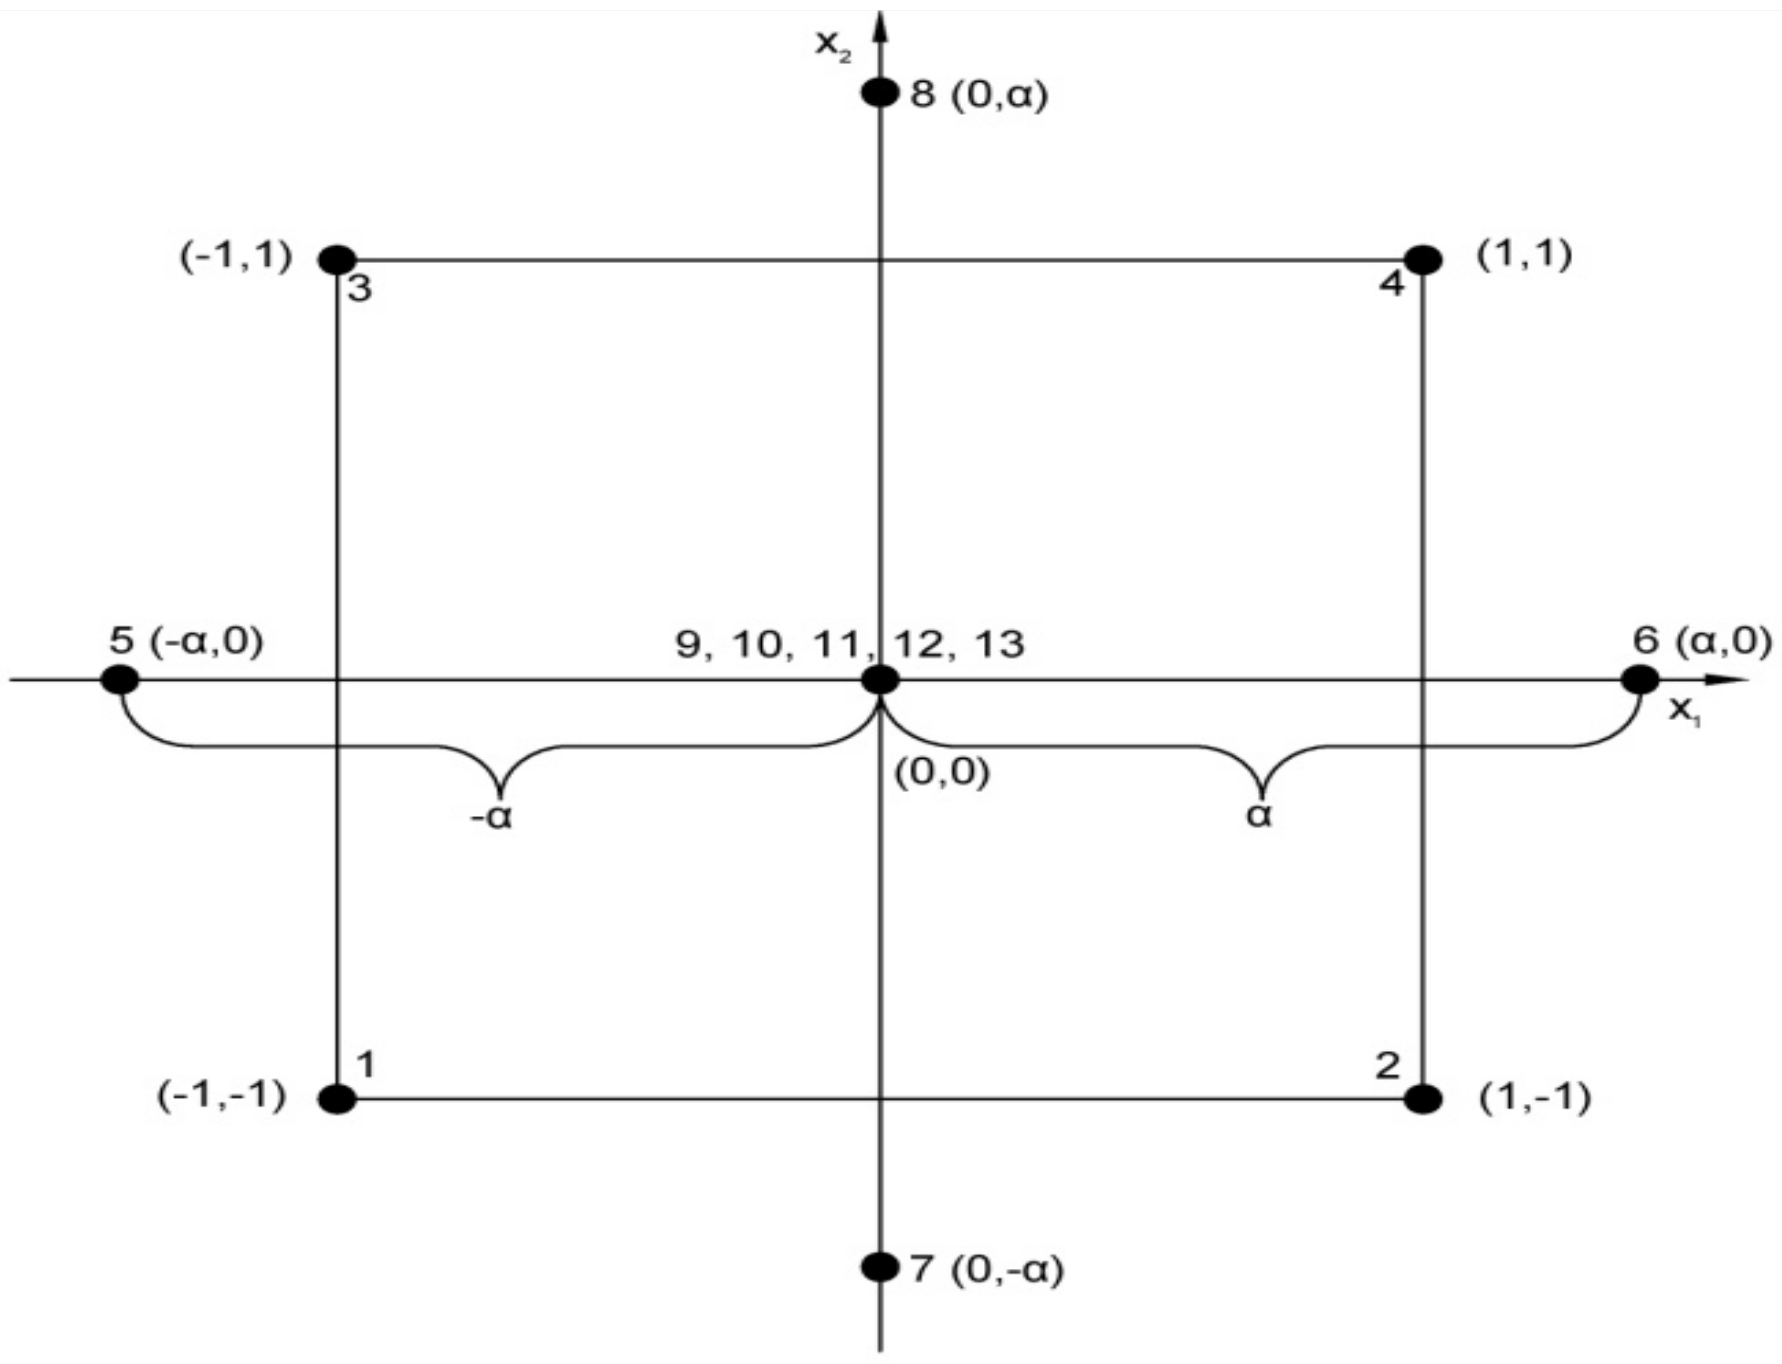
The distance from the central point of supplementary measurement points (±α) is selected in a way to maintain the symmetry and orthogonality of the model. For this case, the number of repeated measurements
no and the value ±α are interdependent and for
no = 5, follows that α = 1.4142. The values of the output size for that value of input sizes are obtained by extrapolation from the tables of experimental data. The specified distance value of supplementary experimental points from the central point of the plan (α) ensures that the plan remains orthogonal and the distribution of points remains optimum. Extension in the number of measurements at the central axes (axial points) and at the central point is an efficient replacement for the 3
k model, which requires more experiments is presented in
Figure 2.
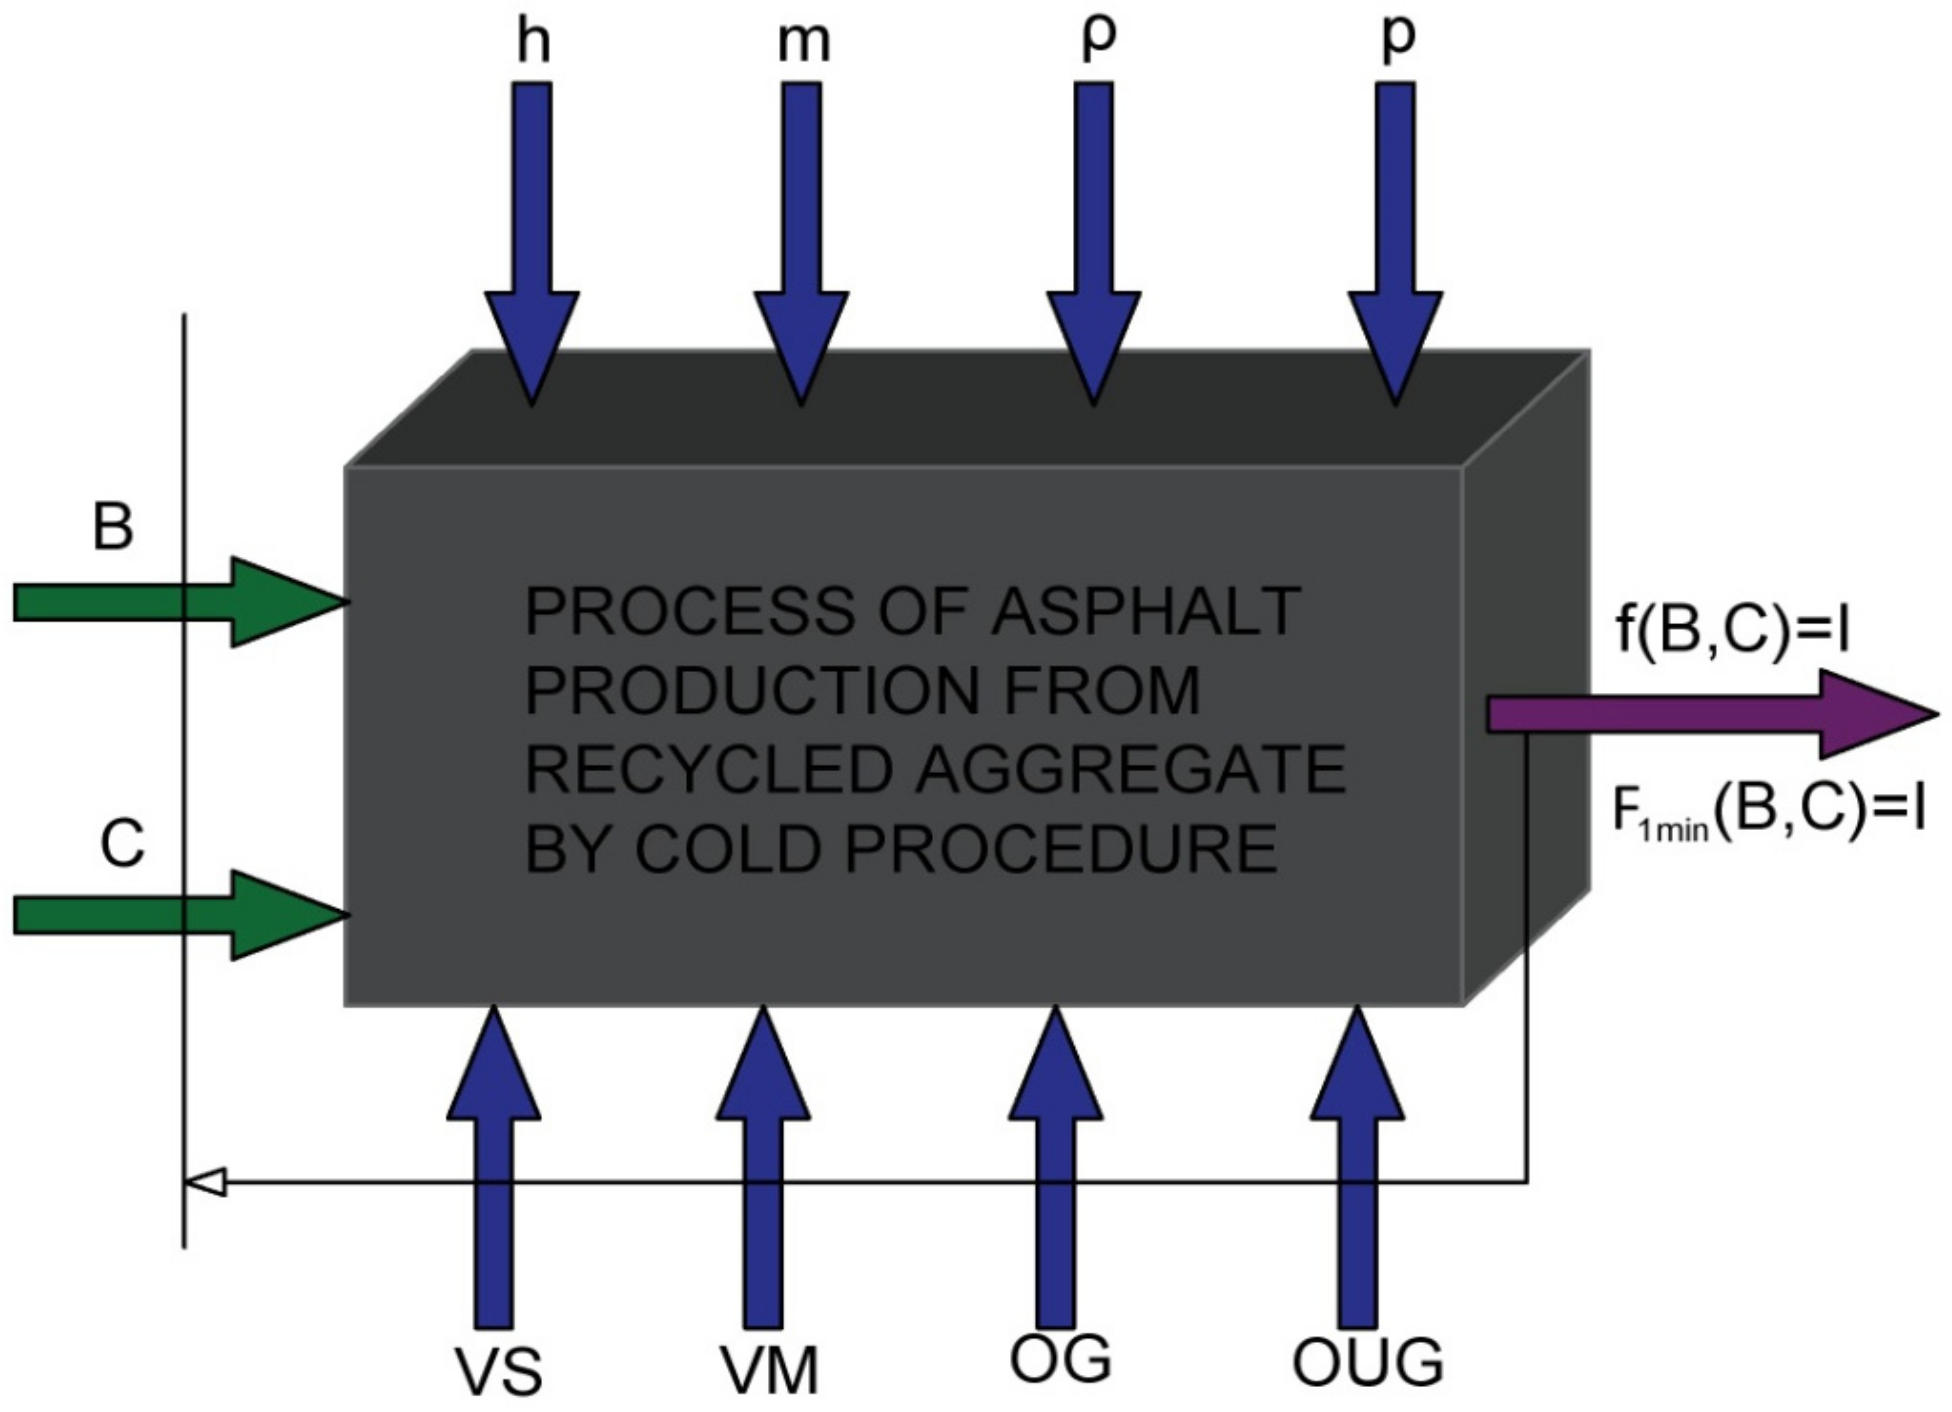
Input sizes present the amount of bitumen B (%) and the amount of cement C (%), while the output size presents the ITS of dry specimens I (MPa). The state function of the process is defined as
z = f (B, C). A graphical representation of input-output sizes is given in
Figure 3.
The independently variable sizes presented in
Figure 3 are B (bitumen expressed in %) and C (cement expressed in %). The dependent variable shown in
Figure 3 is I, which represents the ITS of dry specimens (MPa). Other sizes are specimen height (h), specimen mass (m), specimen density (ρ), fracture force (P), ITS of dry specimen (VS), wet/dry specimen strength ratio (VM), density ratio of dry to wet specimen (OG), the dependence of total specimen density on bitumen proportion (OUG). The influential factors are: B– x1; C – x2 and α = 1.4142.
3.5. Experimental Plan
The space of coded coordinates is an area that is necessary for the design of an experiment matrix plan in which the coding of basic factors is required. Independent variables (x
1, x
2) in stochastic process modeling are usually transformed into coded forms (X
1, X
2), Equation (12):
where:
Ximin = −1, for the value
fi = fi min;
Xisr = 0; for the value
fi = fisr;
Ximin = 1; for the value
fi = fimax.
The coded values of variables, regardless of their physical measuring unit, are expressed by two values, +1 and −1, which are obtained by using coding equations, so that the upper (maximum) level takes on the value +1 and the lower (minimum) −1. When there is an intermediate level, the encoded value is zero. In this case, the coding is performed using the Equation (13):
The medium part of the physical value is obtained by the Equation (14):
where
Xi represents the coded value of independent variables,
i represents the number of independent variables (
i = 1,2,3, …),
xi represents the physical value of independent variables at the upper or bottom level, x
0i represents the physical value of independent variables at the center of the plan, i.e., zero-mean value, and Δx
i represents the boundary interval of the physical value of the variables from the midpoint to the maximum, i.e., minimum value of the variable.
The variation interval of factor I is half of the difference between the maximum (
fimax) and (
fimin) values of the
i-
th parameter (
i = 1,2,3) and can be defined by Equation (15) as follows:
where:
represents the mean value of the i-th factor;
represents the variation interval.
A desirable feature of each experiment is mutual independence of the evaluation of main effects and their interactions, which can be achieved by orthogonality and rotatability of the experiment. It is an orthogonal experiment if the sum of products of coded states for any two columns in the experiment matrix is equal to zero. A rotatable plan is a special form of central compositional plan that is very often applied in modeling and adaptive control in multi-variable processes. In addition to application properties, these plans also have optimality features that are suitable for optimizing selected processes and technologies. The rotatability of the central compositional plan of the experiment is achieved by adding the state of the experiment so that all states are equidistant from the center of the experiment, i.e., the rotatability depends on the axial distance α (the distance of the states at the axes from the center). The experiment is said to be rotatable if , where F represents the number of factor states (F = 2k in the case of a complete factor experiment).
In
Table 1 are shown lists the physical and coded values of the percentages of bitumen and cement that added to the mix of recycled asphalt. Minimal values are coded as “–α”, maximal values are coded with “+α”, while average values are denoted as −1, 0 and +1.
In
Table 2 are shown the physical and coded values of the percentages of bitumen and cement and the variation of compressive strengths depending on the additive of binder (bitumen and cement). The number of performed experiments is 13 that shown in
Table 2, also.
4. Results and Discussion
4.1. Decoding a Dry Specimen Model and Wet Specimen Model
Table 3 shows the combined percentage of bitumen and cement carried out in the experimental study. For given percentage values of cement and bitumen, values of medium density and ITS and their mutual relations in the dry and wet state were obtained. The percentage value of bitumen is given by random selection of the experiment.
After the coefficients of the mathematical model have been determined in coded coordinates and the significance and adequacy of the model have been confirmed, we return to the space of physical coordinates by decoding. When the above Equations (13)–(15) are applied to the input factors in the opposite direction, returning from the coded to the physical coordinate system are obtained:
Substituting the bold values (x1 and x2) in the mathematical model yields a mathematical model in a system of physical coordinates x1, x2 corresponding to the percentage of bitumen and cement, respectively. Inserting the numerical values, the following is obtained:
Y(X
1,X
2) = 0.396 + 0.0147 X
1 + 0.0238 X
2 + 0.0061 X
1X
2 − 0.0077 X
12 − 0.0449X
22After arranging, the mathematical model takes the following form:
On the other hand, considering only the significant coefficients, we obtain that:
where
x1 represents the percentage of bitumen (%B), while
x2 represents the percentage of cement (%C).
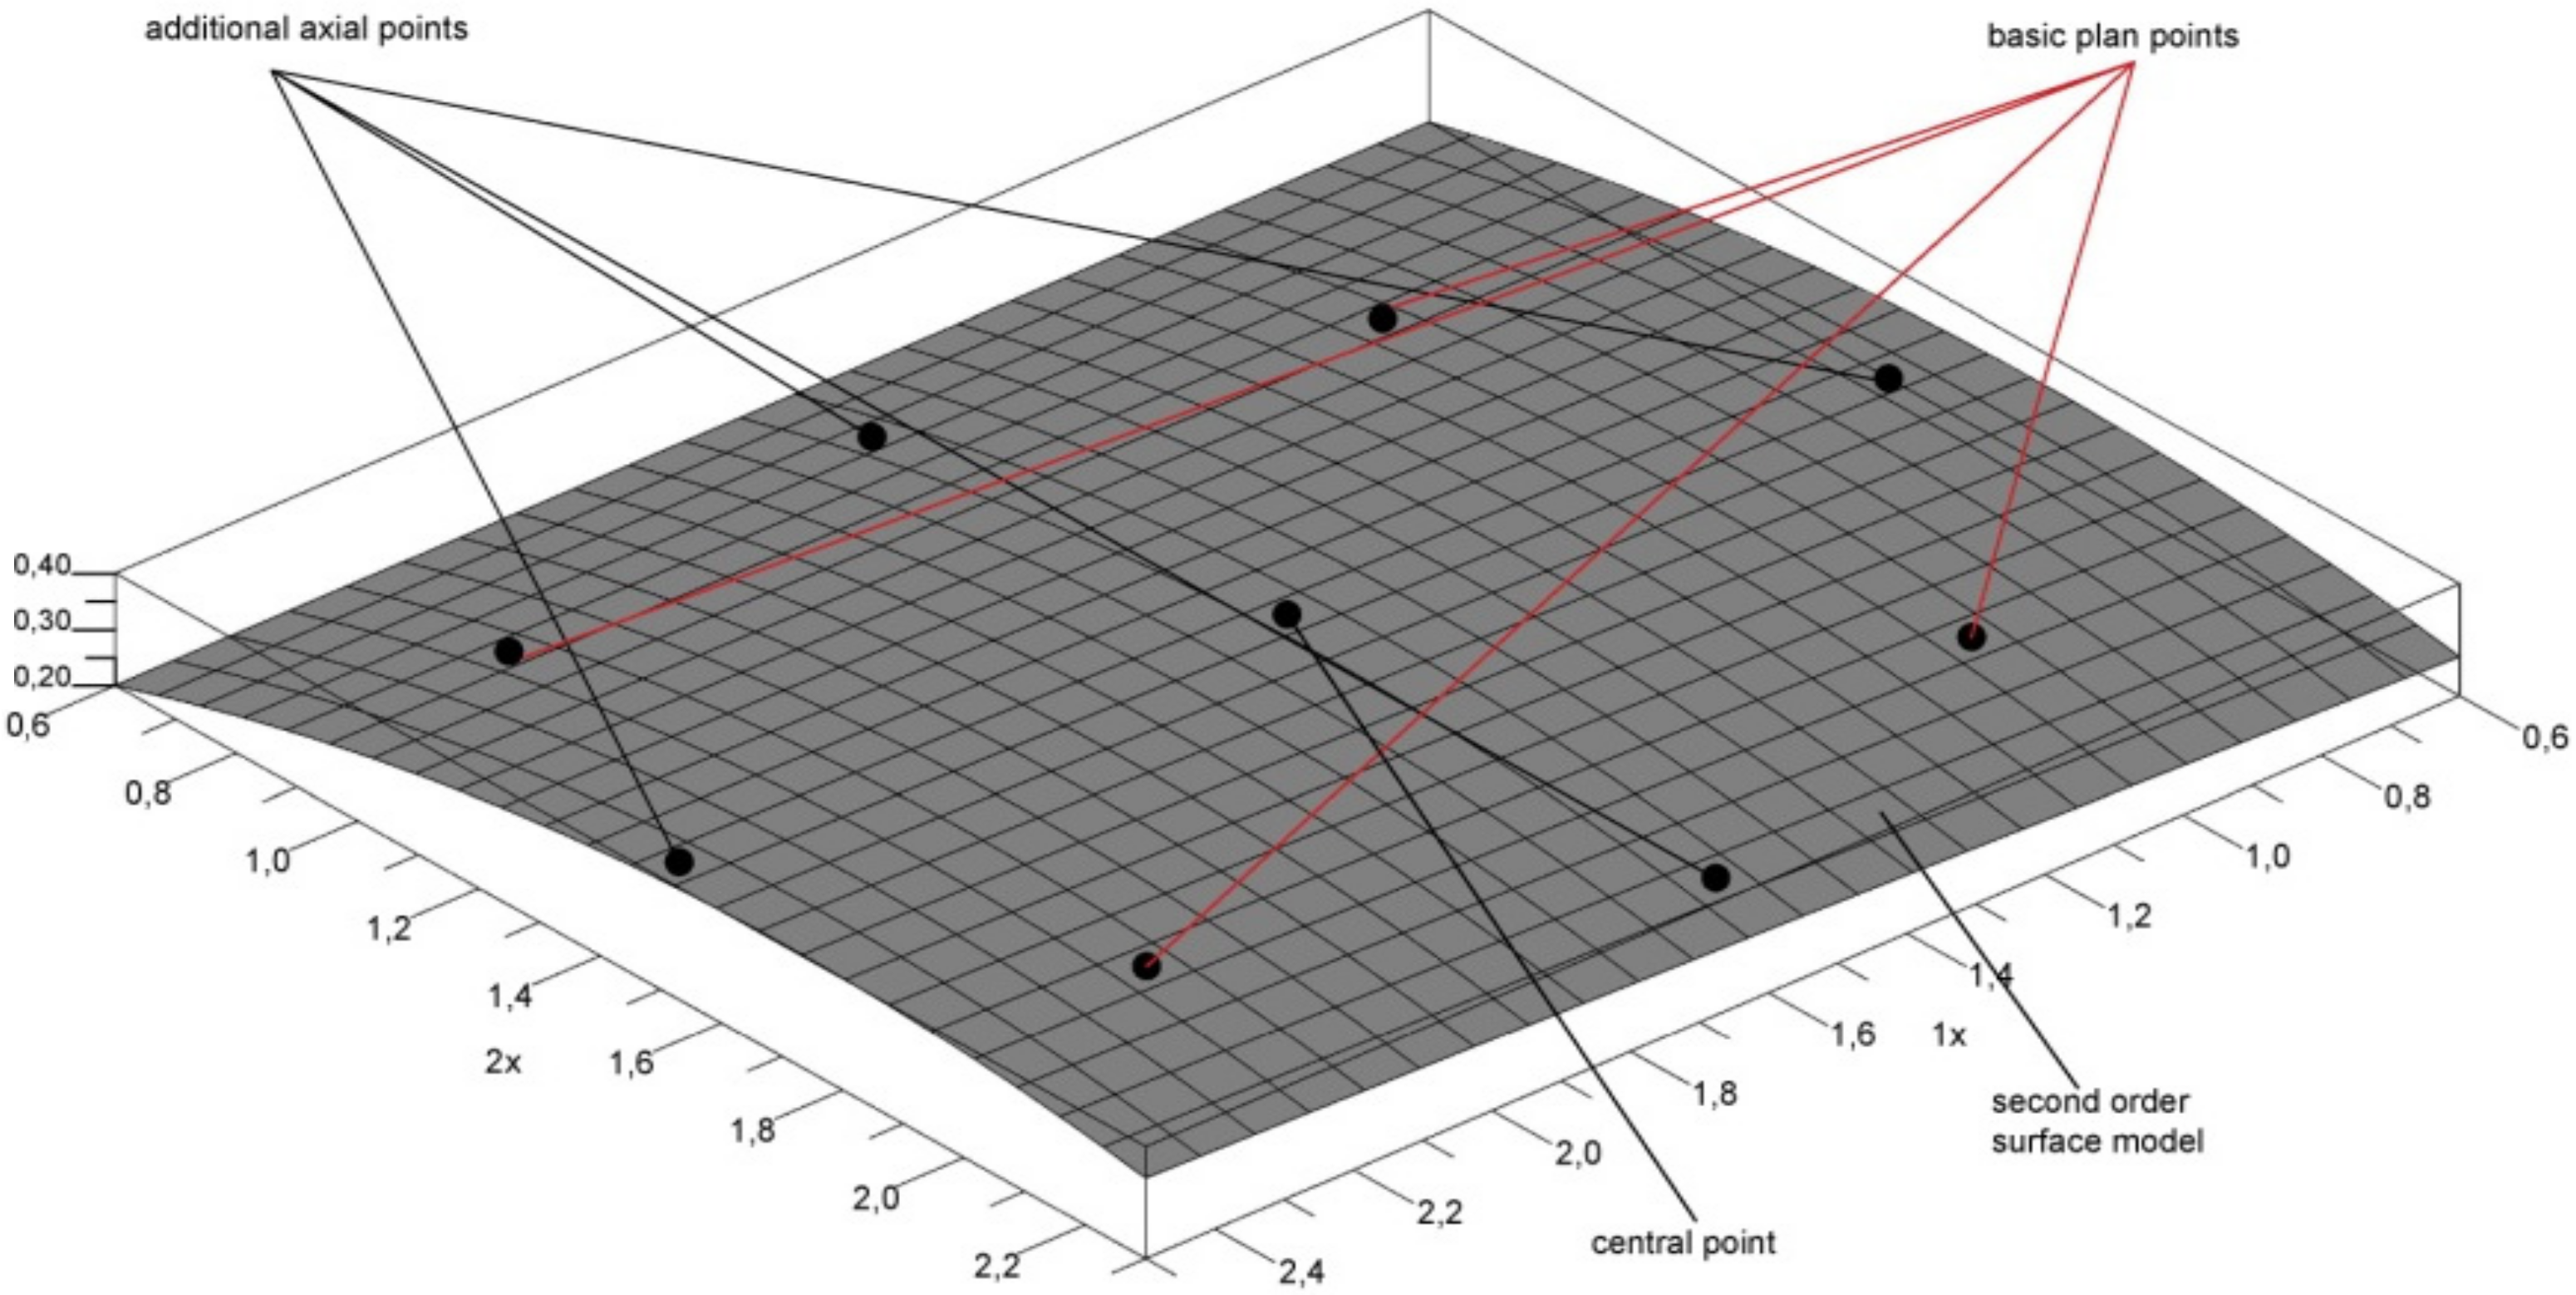
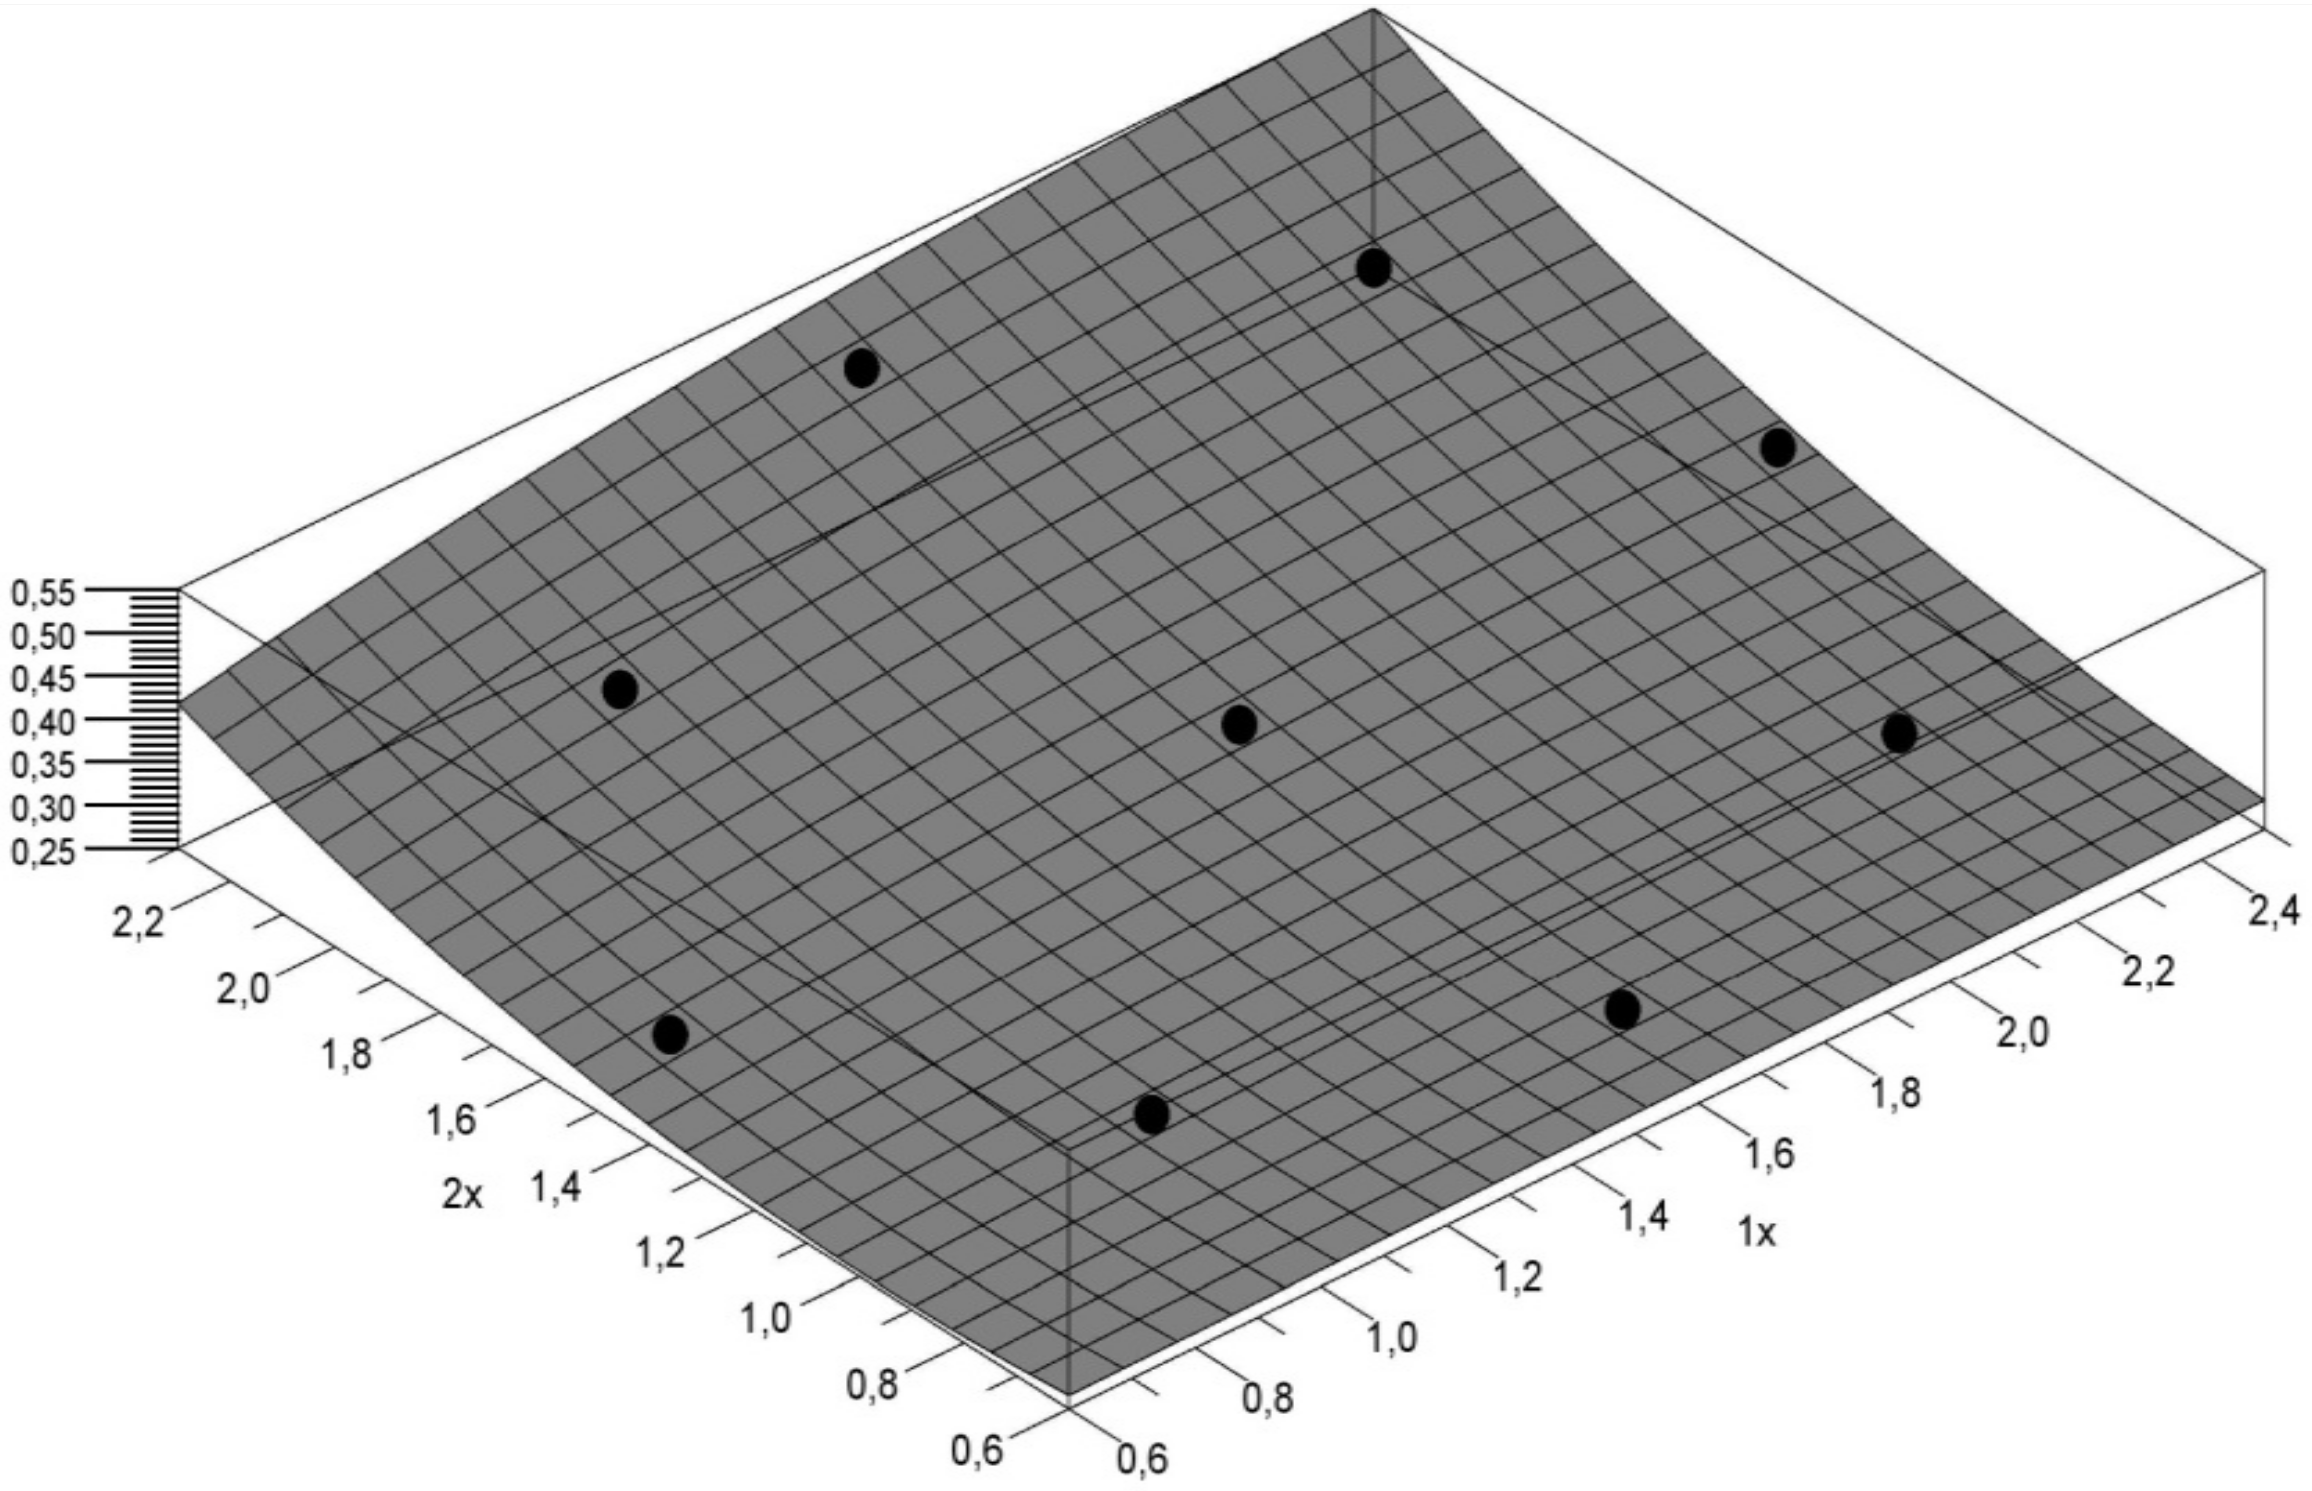
The quality of the approximation is shown in the 3D representation of the model and experimental points.
Figure 4 presents the curvature of the surface (functions of two independent variables) representing the second-order model, as well as the position of points in the experiment space on the basis of which the coefficients of the model have been calculated are clearly visible.
When encoding patterns are applied to the input factors in the opposite direction, equations for decoding, i.e., returning from the encoded to the physical coordinate system are obtained:
Inserting the numerical values, the following is obtained:
Y(X
1,X
2) = 0.3362 + 0.02477 X
1 + 0.06748 X
2 + 0.01 X
1X
2 − 0.006975 X
12 + 0.02452X
22After arranging, the mathematical model takes the following form:
On the other hand, considering only the significant coefficients, the following is obtained:
where
x1 represents the percentage of bitumen (%B), while
x2 represents the percentage of cement (%C). The representation of the previous model in 3D in the space of physical coordinates is given in
Figure 5. It is graphically confirmed that the model adequately approximates the experimental data,
Figure 5.
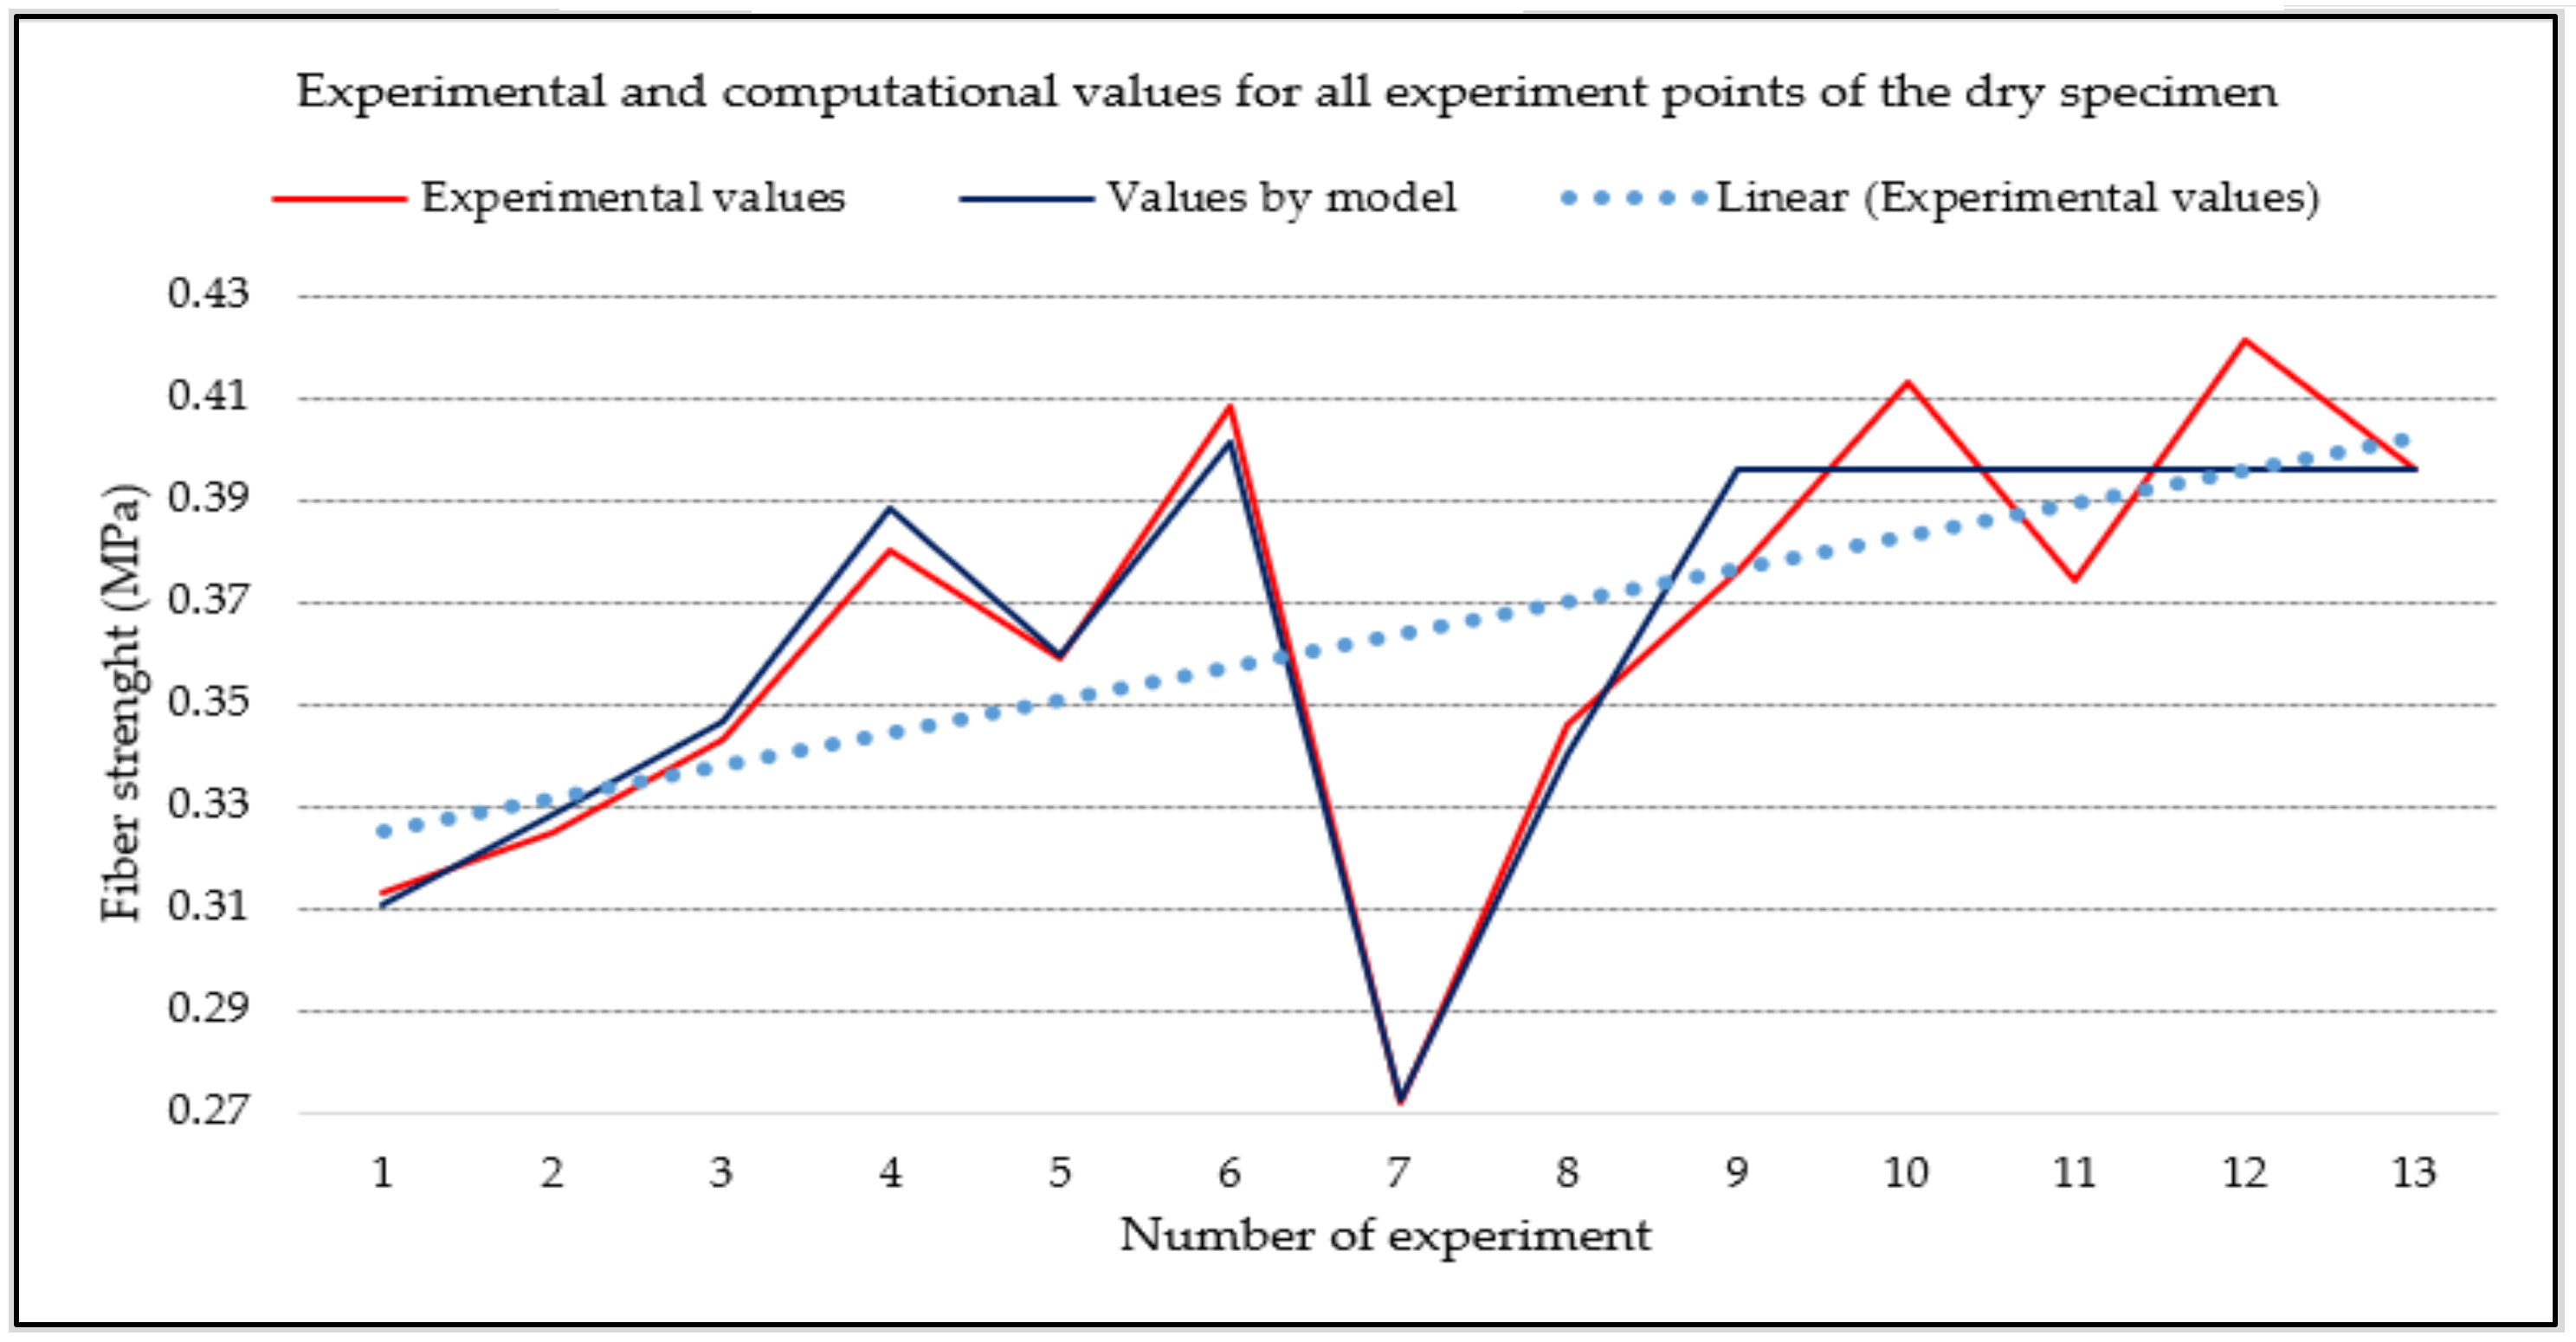
In addition to the above test, the multiple regression coefficient can be checked as a supplementary indicator to evaluate the adequacy of the model. In this case, applying the pattern to the results given in the previous tables, the following is obtained R = 0.6552:
The high value of the regression coefficient for the dry specimen is an indication that the previously developed model describes experimental data properly, i.e., confirms its adequacy. The coefficient of determination (R2) confirms that a high percentage (95.5%) of the variability of the output size (% I) can be justified by changes in the input sizes.
Model prediction can be graphically compared with experimental data if for each performed experiment, the real (measured) value and the value obtained by computing is presented,
Figure 6.
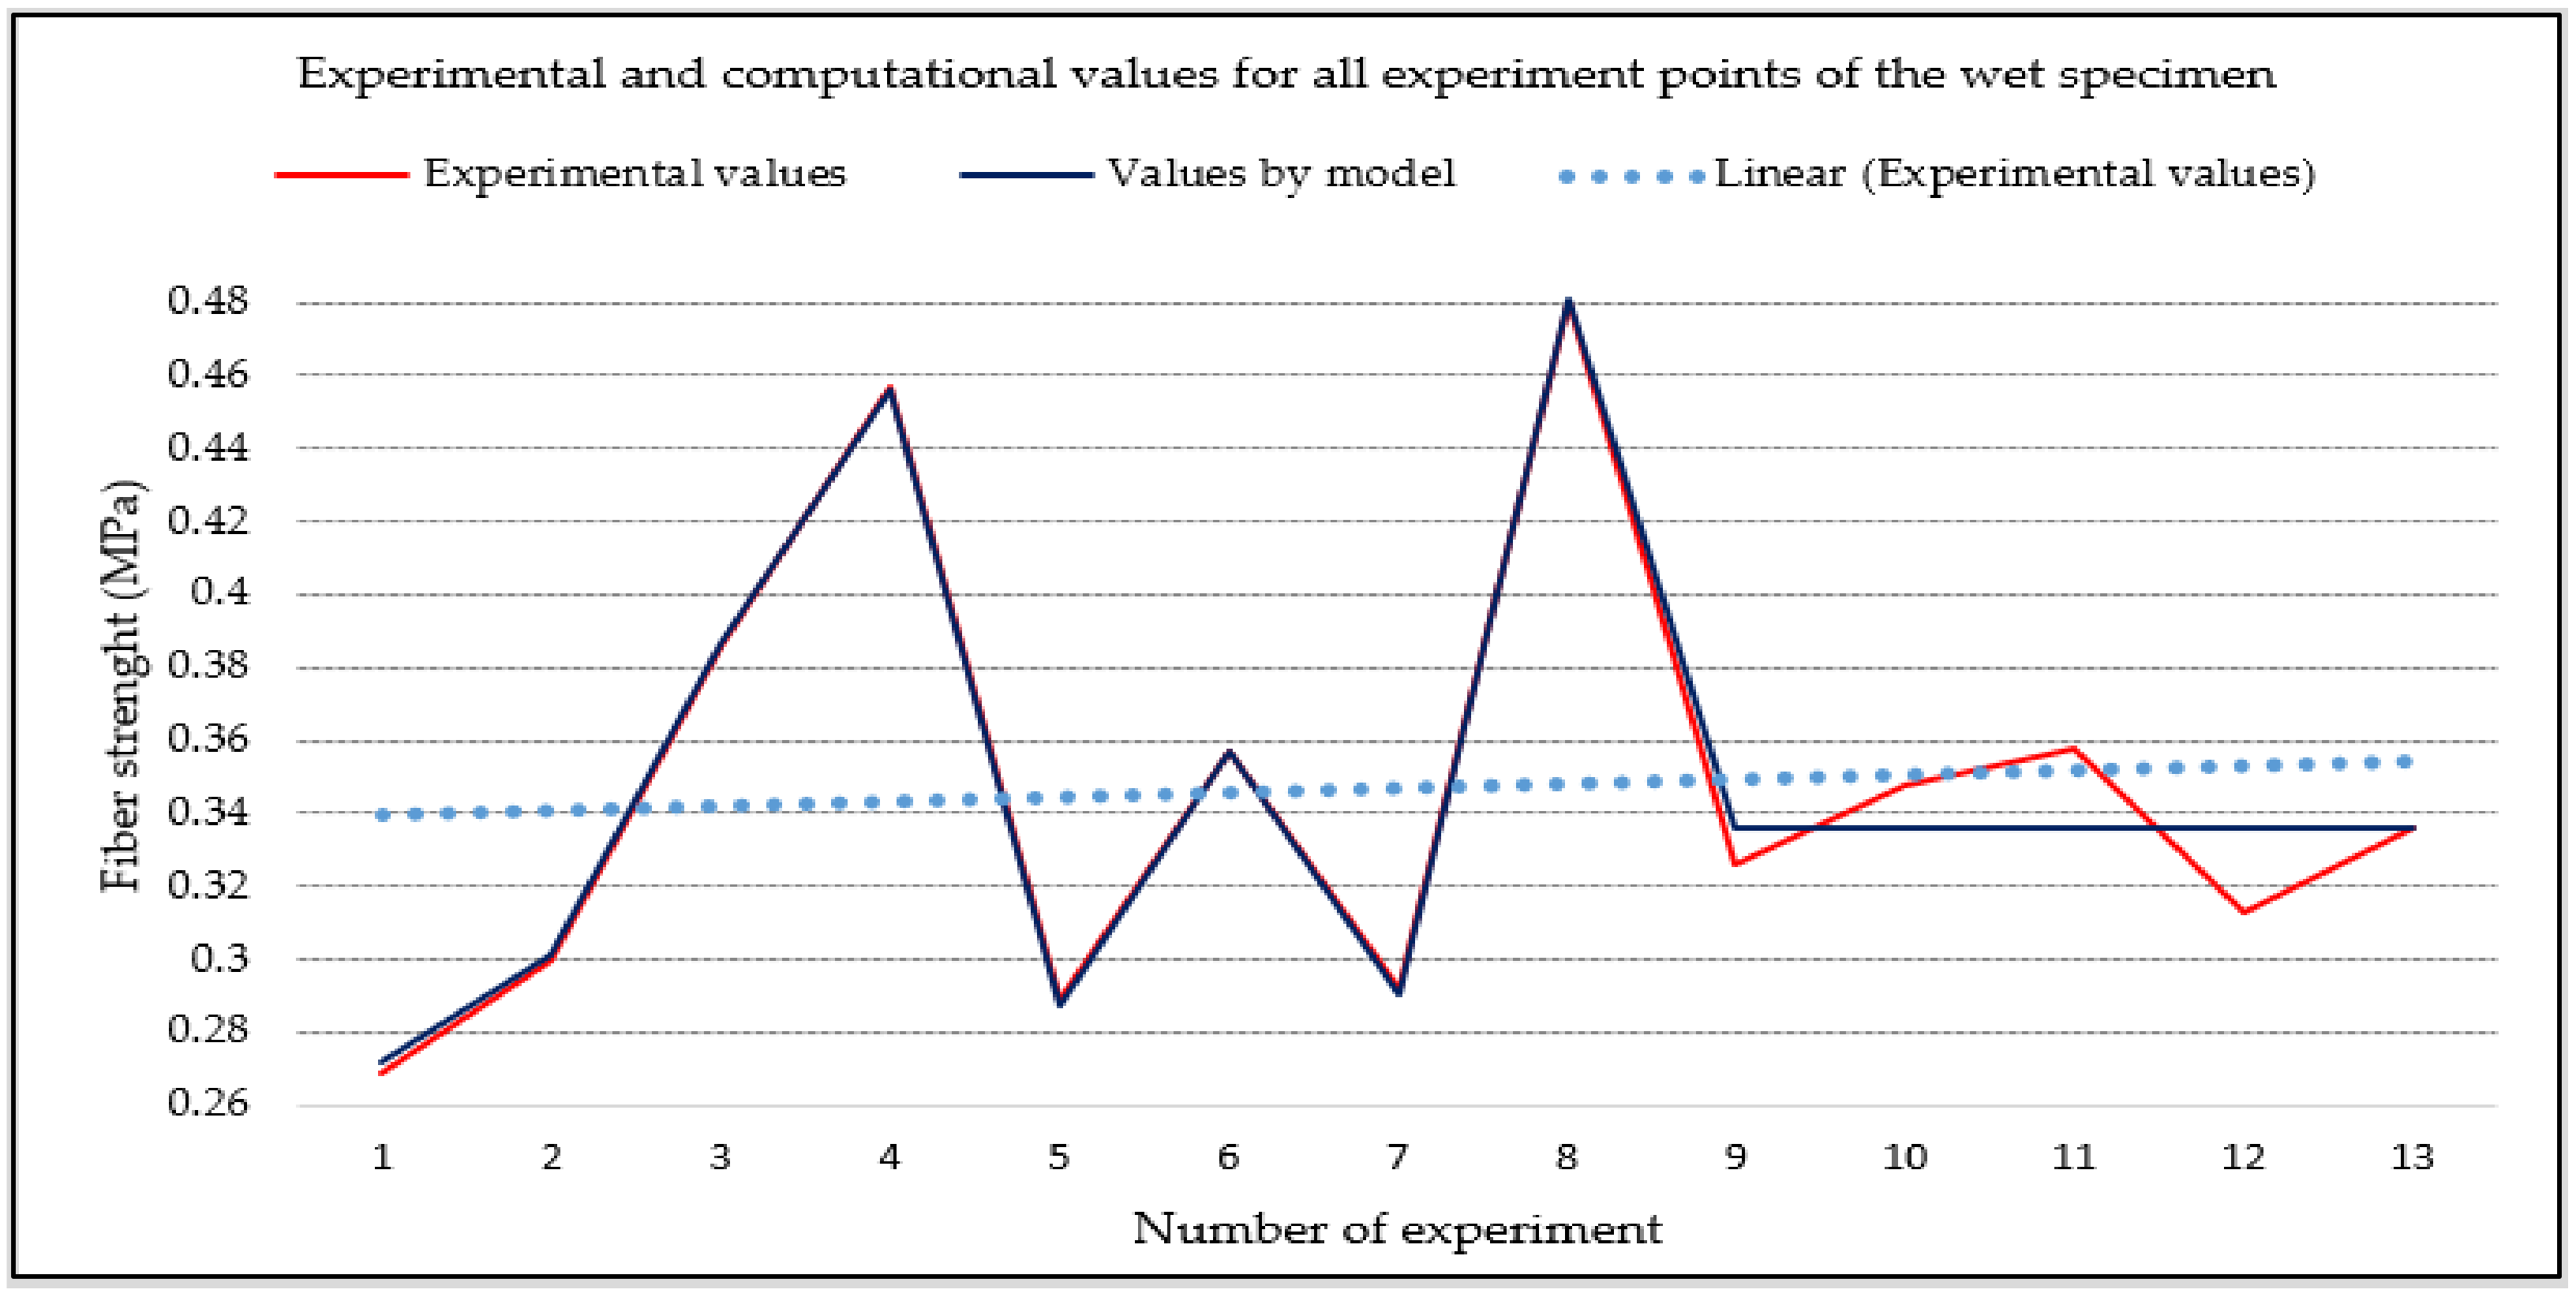
A graphical representation of the relationship between experimental and model points is shown in
Figure 6. The multiple regression coefficient in the case of a wet specimen has the following value
R = 0.986.
The high value of the regression coefficient presented in
Figure 7 is an indication that the previously developed model describes experimental data properly, i.e., its adequacy is confirmed.
4.2. Discussion on the Results of Testing the Optimum Content of Bitumen and Cement in a Stabilization Layer
It should be emphasized that in our area, asphalt layers (bituminous base and wearing) are used almost exclusively in all layers of pavement structures. In support of this fact, and based on a review of the total number of constructed roads at the Cantonal and Federal Roads Directorates, as well as the Public Enterprise “Putevi Republike Srpske”, not a single section of road was constructed from recycled layers of existing and dilapidated pavement structures by cold recycling. In addition, it is important to note that most of regional and main roads, in terms of standard and technical regulations, do not meet the criteria of bearing and high-quality drainage since most of them are made with a bituminous base course, mainly of asphalt of limestone origin. According to the results obtained by testing the optimum content of bitumen and cement binders, it can be concluded that the condition on tested specimens is satisfactory according to standard parameters. The diversity of the total number of specimens leads us to the following discussion:
- The highest values of ITS of wet and dry specimens are provided by recycled asphalt specimens with a percentage of cement of 2% and a percentage of bitumen of: (0.7; 1.2; 1.7; 2.2; 2.7)%. In this specific case, the highest value of ITS is provided by a specimen made with a percentage of cement content of 2%, and bitumen of 2.2%, which have a strength ratio of 120.4 which is 50% higher than an allowed value of 80.
- The lowest value of ITS is given by the specimen made of recycled layer with a percentage of cement content of 0.5% and bitumen of 1%, which are 50% less than the allowed value.
- Recycled masses of pavement structure which contain a higher percentage of asphalt concrete (AB 11, AB 16) than an average specimen provides extremely high values of ITS with lower percentages of cement and bitumen binders.
- It has been clearly established that different types of recycled asphalt stabilization mixture produced from the same RM, with different values of grain-size distribution provide different values of ITS, as well as density of dry and wet specimens. At the same time, recycled stabilization mixtures of fine-grained structure provide better results.
- The type of binder used in a recycled stabilization asphalt mixture is crucial and affects the value of ITS when it comes to RMs of the same type. It is especially evident in a more detailed analysis of specimens with a cement content of 0.5–2% and a bitumen content of 0.5–2.5%.
- By the extraction of the obtained grain-size distribution of individually separated asphalt concrete layers that have to be recycled, it can be confirmed that there is no significant difference between the improved RM compared to the mixture originally sampled without improvement.
- Stabilization layers of recycled mixture improved with a certain percentage of cement and bitumen have a much rougher structure than basic asphalt layers (AB 16, BNS 16, BNHS 16, BNS 22, BNHS 22, BNS 32, etc.) since it has a large number of grains larger than 16 mm.
- These specimens show a significant increase in the value of slip resistance coefficient with respect to the basic types of asphalt layers and referring to this type of mixture, as well as the type and position of the base course.
- The value of slip resistance coefficient, as well as the roughness of the stabilization layer obtained by milling a worn pavement structure enhanced with cement and foamed bitumen binders, rises with increasing binders.
- The nature of aggregates in a recycled pavement layer greatly influences the value of the ITS of wet and dry specimens, their interrelationship with the same percentages of binder materials. This fact is significant and is based on studies that show that most deformations of pavement structures arise from longitudinal and transverse cracks of flattened ruts that indirectly depend on the type and origin of aggregates used in the structure. The values of ITS of stabilized layers of recycled pavement structure are on average 30% lower for limestone rocks compared to aggregates of eruptive origin that represent the basis of recycled pavement material.
- The selection of the type and proportion of hydraulic stabilizing agent determined by experimental testing based on plasticity index (IP < 10), cement with a percentage of 1% was selected.
- The search for the optimum content of bitumen in stabilized recycled material was performed by experimental testing during the formula preparation for cement and bitumen of stabilized granular material in the range of bitumen content of 0.5%–2.5%. For this prepared series of specimens, the ITS of dry and water-saturated specimens was measured. The following optimum proportions of foamed bitumen were identified to be in a range of 2.2%–2.4%.
4.3. Discussion on the Results on Formula Preparation with Different Content Percentages of Added Aggregate in the Total Mass of Recycled Mixture
The specificity of the milled material from the worn pavement structure intended to produce recycled stabilization mixture in bituminous base courses of the pavement is its limited use.
Besides the stated, the milled pavement material can be successfully used in surfacing. This application limits production spectrum to obtaining precisely defined percentages of aggregates 0–32 mm, which in a technological sense significantly influences the choice of reuse. Analyzing the grain-size distribution as the most important qualitative parameter, the plants in the world that are used exclusively in technological schemes for processing milled material from flexible pavement structure have faced with certain limitations when it comes to the selection of processing technology and economic justification of particular pavement layers. According to this analysis, and based on the test results, it has been determined that the amount and type of binder and grain-size distribution is a key and prevalent factor and parameter for a clear selection of an optimum formula with different content percentages of aggregate added to the total mass of the RM.
When searching for the optimum grain-size mixture of milled material, it was difficult to find such a grain-size mixture that would best meet the boundary curves defined by the Wirtgen Cold Recycling Manual for pavement structures.
It has been found and experimentally determined that a mixture of milled material from the pavement structure and added fraction of stone material have to be mixed in a ratio of 85:15 in both designed compositions. Such a mixture does not satisfy fully conditioned granulometry, but largely meets the recommendations for materials intended to be mixed with cement and foamed bitumen.
In a procedure for making a formula, the optimum moisture content of mixtures of grain-size material, which ranged from 4.8–5%, was experimentally determined.
4.4. Discussion on the Selection of Technology for Processing Recycled Mixtures from Pavement Structures in Terms of Economic Justification
In addition to the grain-size distribution of recycled aggregate from the pavement structure, the shape of aggregate grain, the addition of binder stabilizers and foamed bitumen, the main feature when selecting the technology for processing recycled stone from the pavement structure in terms of its technical soundness and usability in new base courses of pavement is the cost-effectiveness of the selected system. This is due to the fact that as a rule, good stone resistance to wear implies increased compressive strength and rock hardness.
As a result, more energy is required to process a recycled mass from the pavement structure, since the crush resistance is directly dependent on the physical and mechanical characteristics and binder of the recycled material from the pavement structure.
However, what is indicative and decisive in the assessment of technology selection when it comes to recycled pavement material is the question of the value of unit costs and costs due to the processing of worn-out pavement structures into a recycled mass that would be wholly or largely used in bituminous base courses of new pavement structures.
It can be very easily checked by analysis determined by direct measurement of specific propulsion energy consumption, which in this case has been obtained from the energy consumed and the quantities of usable recycled material obtained from the worn-out pavement structure. Specific propulsion energy consumption during the production of recycled material from the pavement structure on a Wirtgen WR 2500 S machine ranges from 30–40% of the price compared to the price of a new aggregate.
Accordingly, it was found that the specific consumption of propulsion energy in crushing and processing of worn-out pavement structures compared to the use of a new aggregate is two to three times lower. This indicator is directly dependent on the type of rock, the crushing plant used, its working principle, the type and origin of the material from the pavement structure that needs to be recycled and other parameters.
5. Conclusions
The mathematical model presented in the paper showed dependence, i.e., interaction between the retained and added amount of binder with regard to the percentage of milled (used) aggregate and the added new aggregate that was necessary in order to adjust defined limits of grain-size distribution curve. The paper presents that the improved model is optimum and not overly complex for implementation since it has been defined and tested in actual, realistic, and practical, conditions. There is always concern that many of laboratory tests used on traditional materials cannot predict a true effect of recycled materials.
Multiple regression coefficients for a dry and wet specimen are Rs = 0.9552, Rm = 0.986 proving good and mutual dependence of factors in the mathematical model, showing that this mathematical model describes the process with sufficiently proper accuracy. It should be remembered that the amount of resistance obtained is primarily related to the amount of cement binder added to the recycled material. In addition, tests have shown that adding more binding material does not mean better specimen characteristics since recycled materials treated with a cement binder tend to become stiffer and at the same time very prone to cracking. An increase in the amount of cement binder increases the stiffness of RM, which is associated with a decrease in fatigue resistance and an increase in shrinkage and consequent cracking. The amount of cracking resulting from the shrinkage associated with cement binders can be mitigated by the following procedures: (1) adding the amount of cement binder as closely as possible to the designed content in the previous mixture, (2) compacting the recycled mixture below the optimum humidity content or saturation of 75%, (3) by controlled drying of recycled material layer.
The results presented in this study have shown that recycled materials stabilized with bitumen provide a flexible material with better fatigue resistance properties when compared to those treated with cement stabilizing agents. Bitumen-stabilized mixtures are resistant to cracking due to shrinkage and can be opened for traffic before those mixtures treated only with cement. Additionally, FDR with a bitumen-stabilizing binder, using bitumen, makes a stabilized material rather than an asphalt layer, so it has a higher content of voids of between 10% and 20%. Bitumen-stabilized material tends to act partly as unbound material (stone aggregate) and partly as viscous-elastic material capable of withstanding repeated tensile stresses. Based on the results obtained, we can conclude that the initial hypothesis is fully confirmed.
Based on the newly acquired knowledge, experience, and the results obtained in this paper, it may be recommended to continue researching on the detection of quantitative and qualitative characteristics of materials from flexible pavement worn-out structures that have to be recycled and further improved with binders in order to use the same material in new layers of bituminous base and wearing pavement courses. It is also possible to improve further the technology of milling and processing of worn-out layers of flexible pavements in accordance with the indicators of the technical road parameters. In this regard, the direction of scientific research should be specifically focused on:
- -
the impact of the degree of grain wear and its suitability for fabrication in recycled pavement layers with respect to the exploitation lifetime of the road, depending on the quantity of newly added binder material
- -
the impact of binder (cement-foamed bitumen-filler-new fraction) on increasing use of recycled aggregate from worn-out pavement structures
- -
state of roads and study of economic and technical aspects of the development of transport network in Bosnia and Herzegovina
- -
the impact of grain size and shape on adding, i.e., consuming new binders in a recycled mass of pavement structure, as well as the impact of technology on processing and the shape of recycled aggregate
- -
combining other binder materials (cement, lime, fly ash, bituminous emulsion, geocrete, etc.) with the aim of maximizing the use of recycled materials from a pavement structure while meeting technical regulations and standards in the field of road construction
- -
dependence of tire consumption on the type of newly constructed road from a recycled mass if used for producing wearing courses of flexible pavement structure
- -
the possibility of using a recycled mass from the pavement structure to improve the substrate and ballast prism on railway tracks if it is economically and technically proven that the material does not meet the minimum conditions for reuse for road construction.


 ,
, 


