Abstract
The increasing discharge of wastewater containing inorganic salts, sometimes accompanied by high pH, has been a worldwide environmental problem. Constructed wetlands (CWs) are considered a viable technology for treating saline and/or alkaline wastewater provided that saline-alkaline tolerant plant species are selected and applied. The influence of both saline and alkaline stress on four wetland plant species during their seed germination, early growth, vegetative propagation and continued growth stages was evaluated by three experiments. Principal component analysis (PCA) was conducted for selecting representative indicators for evaluating the saline and alkaline tolerance of plants during vegetative propagation and plant growth stages. The saline and alkaline stress inhibited the vegetative propagation and plant growth of all tested plant species to varying degrees, therein the influences of saline-alkaline stress on plants were more marked than saline stress. The length of new roots, Na+ accumulation in plant tissue, Na+/K+ ratios in aerial tissue and the total dry biomass were selected as most representative indicators for evaluating the saline and alkaline tolerance of plants. Iris sibirica and Lythrum salicaria showed better saline and alkaline tolerance ability among tested species and could be grown in CWs for treating saline and/or alkaline wastewater.
1. Introduction
Saline and/or alkaline wastewater usually contains both inorganic salts and other contaminants and maybe accompanied by high pH. This type of wastewater is mainly produced by agriculture production, aquaculture and various industrial sections (e.g., agro-food, petrochemical and tanning industries) [1,2,3]. The salinity level of saline and/or alkaline wastewater varies with specific sources and has a wide range. According to literature reports, drainage water with a salinity level (EC) of 15.2 mS cm−1 was found in Central California [4]. The effluents of some processes in the tanning industry, such as pickling and chromium tanning processes, can reportedly contain with 80 g L−1 of sodium chloride and the pH ranging from 7 to 10 [5]. The receiving water bodies have been negatively impacted by the direct discharge of saline and /or alkaline wastewater due to the presence of both salt and other contaminants, causing the destruction of aquatic ecosystems [6]. Therefore, the treatment of saline and/or alkaline wastewater has been an urgent task in the present world.
As a workable wastewater technology, constructed wetlands (CWs) have been paid more and more attention owing to their lower cost, less operation and maintenance requirements and especially their feasibility to be applied in remote areas compared with traditional technologies [7,8]. The macrophytes planted in CWs may directly uptake potential pollutants into their plant tissue (e.g., heavy metals), provide a habitat for the growth of microorganisms and release oxygen to the substrate and water via their roots [9]. However, saline and/or alkaline stress could result in the growth inhibition of and sometimes even mortality of plant in CWs, which remarkably limit the efficiency of CWs [10]. Therefore, it is of great practical significance to assess the growth performance of typical wetlands plants under various saline and/or alkaline stress during their vegetative propagation and plant growth stages thereby screening relatively salt tolerant species for growing in CWs.
The influence of saline and/or alkaline stress on various plant species has been previously evaluated in numerous studies. Most of the available studies, however, focused on a specific life stage of plants, for example, seed germination, early growth or vegetative growth and so forth [11,12,13]. To comprehensively evaluate the response of wetland plants to saline and/or alkaline stress throughout their entire life stage, it is necessary to grow them in CWs, because plants usually vary in their response to saline and alkaline stress during different life stages [14]. Additionally, in the natural environment, saline and/or alkaline stress often origins from affected by various salts. Previous studies proved that the response of arid plant species to saline and/or alkaline stress varied with different salts [15,16]. For example, alkaline salts (i.e., Na2CO3 and NaHCO3) led to more severe effects on multiple physiological indicators of oat (Avena sativa L.) seedlings and disturbed the pH stability in root tissue fluid compared with neutral salts (i.e., NaCl and NaSO4) [17]. It is also reported that NaCl and NaHCO3 can cause different effects on the germination of Medicago sativa and Elymus dahuricus [18]. Although typical wetland plants might also exhibit a varied response to different salts, the comparative studies of the impact of different salts on wetland plants are rare [13]. Besides, many physiological and ecological parameters of plants can be affected by the saline and/or alkaline stress. For example, Na+/K+ ratios and proline content can be considered useful parameters to evaluate saline-alkaline tolerant ability [19]. Therefore, to select some representative indicators for evaluating the salt tolerance of plants is of great importance for building a systematic and reasonable evaluation system. However, a general consensus towards this issue has not yet emerged.
The overall goal of this study was to reveal the effect of saline and alkaline stress on four typical wetland plant species in China, that is, Acorus tatarinowi, Iris sibirica, Lythrum salicaria and Typha orientalis during their different life stages. The specific aims are as follows: 1) evaluate the influence of different levels of saline and alkaline stress on germination and seedlings growth (i.e., the chlorophyll content index (CCI), the length of new propagules (LNP), total biomass (TB) and plant height (PH)), vegetative propagation (i.e., the number of new propagules (NNP)), growth (i.e., CCI in leaves, the length of new roots (LNR) and the total dry biomass (TDB)) and ion content (i.e., Na+ and K+ content) of the tested plant species; 2) identify the most representative indicators for evaluating salt tolerance of typical wetland plant species based on the performance of vegetative propagation and plant growth; 3) screen the relatively salt tolerant plant species for planting in CWs for saline and alkaline wastewater treatment. The findings of this study will provide both a theoretical guidance for revealing the response of wetland plants to saline and alkaline stress and a practical reference for establishing CWs in a specific environment.
2. Materials and Methods
2.1. Materials
In this study, three experiments were set up at Northeast Institute of Geography and Agroecology, Chinese Academy of Sciences, Changchun, China, that is, Experiment A, B and C as described below (Figure 1). Experiment A was carried out in the laboratory and experiment B and C were set up in an environment-controlled greenhouse. According to previous studies, four aquatic plant species were tested—Acorus tatarinowi, Iris sibirica, Lythrum salicaria and Typha orientalis. These plants are common CWs plant species and some of them have been shown to be resistant to saline and/or alkaline stress [1,20,21,22,23]. In addition, all these plant species can be propagated from seeds or by vegetative propagation. It is beneficial to comprehensively observe the physiological indicators of each growth stage. Filled seeds and mature healthy plants of four species collected from the field in August 2016 in Suqian, Jiangsu Province of China was purchased. All the seeds were soaked in 0.1% fungicide for 10 min to dislodge fungus and seeds were then rinsed with deionized water and dried before use. The pH and chemistry characteristics of soil used in both Experiment B and C were described in our pervious study [13]. In Experiment A, all the experimental dishes were soaked with disinfectant for 1 h and then sterilized at 121 °C for 30 min. Soils used in Experiment B were thoroughly homogenized after removing rocks and other debris. The mature plants used for Experiment C were rinsed, transplanted into buckets containing 1/4 Hoagland solution until the experiment was started. In Experiment C, five cuboids tanks (60 cm long × 50 cm wide × 34 cm deep) made of Polyvinyl chloride (PVC) were applied for simulating the wetland beds.
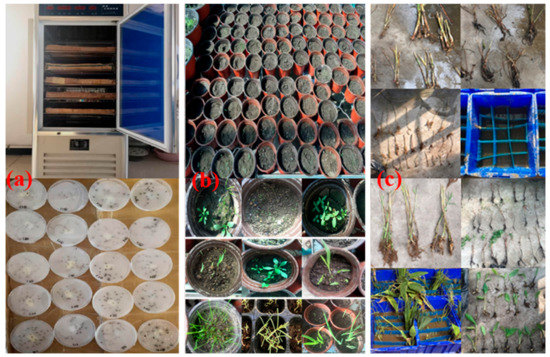
Figure 1.
The experiment plots of three experiments (a: Experiment A, b: Experiment B, c: Experiment C).
2.2. Methods
2.2.1. Germination and Seedlings Growth in Culture Dishes under Different Salinity Treatments (Experiment A)
Experiment A was conducted in September and October 2016 in a programmed controlled growth chamber (PGX-250C, China). The growth chamber was operated under an alternating 12 h light/12 h dark photoperiod and 25/15 °C day/night temperatures within per 24 h period. The maximum light intensity of 22000 Lux during the day was provided by fluorescent tube and there was no light supplied at night. In this experiment, the influence of two salts, that is, NaCl and NaHCO3 on germination of four tested plant species was evaluated. There were five treatments for each respective salt type, that is, Control (deionized water), Electrical conductivity (EC) of 5, 7.5, 10 and 15 dS m−1. Smart meters (Thermo Scientific TM, Hudson, NH, USA) was used to the measurement of EC and pH values of solution. Double filter papers were placed on the bottom of culture dishes (diameter of 9 cm) and wetted with 5 mL of the designated NaCl and NaHCO3 solution. Thirty seeds of A. tatarinowi, L. salicaria, T. orientalis and twenty seeds of I. sibirica (seeds were larger than other three species) were evenly spread on the wetted filter paper in per culture dish. Culture dishes were sealed with parafilm and then put in the growth chamber. The number of new propagules was recorded per 24 h. There were three replicates for each treatment. The germination percentage, speed of germination, CCI and LNP were calculated and measured at the end of experiment.
2.2.2. Germination and Seedlings Growth in Soil Irrigated with Saline and Alkaline Water (Experiment B)
Experiment B was conducted in September and October 2016 in a greenhouse. The greenhouse was maintained for 30 days under day/night temperatures of (25 ± 3) °C / (15 ± 3) °C and 40%–50% air relative humidity. Approximately 150 g soil was placed in each pot (9 cm length × 9 cm width × 8 cm depth) with depth of 5 cm. Thirty seeds respectively of A. tatarinowi, L. salicaria, T. orientalis and twenty seeds of I. sibirica were evenly distributed on the surface of the soil in per pot. The seeds were then covered with a 3–5 mm layer of the same soil. The same salinity treatments were applied in Experiment A. All pots received 20 mL designated salt solution at planting and subsequently were irrigated with 10 mL salt solution every three days to maintain soil moisture. There were three replicates for each treatment. The number of seedlings (when radicles emerged from the soil surface) was counted every 24 h. After 30 d experiment, seedling growth indicators (i.e., CCI, TB and PH) in each pot were measured and the seedlings in each pot were collected for ion content measurement.
In Experiment A and B, germination percentage on Day 30 under different saline treatments was calculated by using the following formula:
where Ng represent the number of seedlings on the last day of each observation period and Nt represent the number of total seeds in each culture dishes /pot.
The speed of germination under different salinity treatments was calculated by using the following formula:
where represent the germination percentage on day i. represent the germination percentage on day i-1.
2.2.3. Vegetative Propagation and Plant Growth of Mature Plants under Different Salinity Treatments (Experiment C)
Experiment C was conducted in September 2016 in the same greenhouse as described in Experiment B. Three mature plants of each species with similar growth condition were used in the experiment. Each plant species was subject to nine salinity treatments (i.e., EC of 5, 10, 15 and 20 dS m−1 prepared by NaCl and NaHCO3, respectively) and one control (0.3 dS m−1). The detailed design and operation of the wetland beds was described in our previous study [13] and is also available in Supplementary Materials. NNP, LNR, TDB and CCI were measured on Day 30 after the plant were transplanted into the wetland beds. CCI of leaves was determined by digital chlorophyll meter (CCM-200 plus, Opti-Sciences, Inc.). After experiment, the plants tissue was collected for ion content measurements.
2.3. Ion Content Measurements
All fresh biomass samples were rinsed in deionized water, sub packaged and dried for 3 days in a drying oven at 65 °C. Dry tissue was grounded to a fine powder for determining the Na+ and K+ content. The detailed measuring process is described in the Supplementary Materials.
2.4. Statistical Data Analyses
The calculation of germination percentages and speed of germination was described in our previous study [24]. SPSS 19.0 was used to carry out the data analysis. Significant differences were carried out by One-way ANOVA, Tukey test. The significance level of ANOVA was set at 5%. All Figures were plotted by Origin 8.5.
3. Results
3.1. Germination
The germination percentages of four tested plant species under saline and alkaline stress are shown in Figure 2. In the growth chamber, the germination percentages of A. tatarinowii and T. orientalis were significantly (p < 0.05) reduced at EC treatments from 0 to 7.5 dS m−1 and there was no germination observed at EC of 10 and 15 dS m−1 treatments (Figure 2I). The greatest germination percentages of I. sibirica and L. salicaria were observed in EC of 7.5 and 5 dS m−1 treatments, respectively. Lower or higher saline stress were significantly (p < 0.05) inhibited the germination. The effect of saline-alkaline stress (NaHCO3) on germination was more serious than saline stress (Figure 2II). The increasing saline-alkaline treatments significantly (p < 0.05) inhibited the germination percentages for all tested plant species and the germination of T. orientalis was completely inhibited by all saline-alkaline treatments.
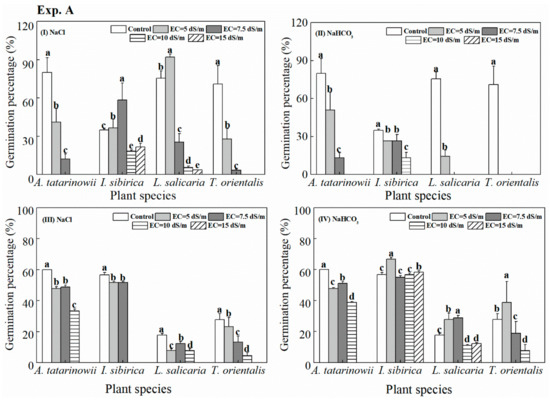
Figure 2.
The germination percentage of tested plants observed under different treatments (I, II: growth chamber; III, IV: soil pots). Values represent the mean of three replicates and error bars represent standard deviations. Columns containing different letters indicate significant differences among treatments for each respective plant species at p = 0.05 (hereinafter inclusive). The absence of column indicates no germination occurred in these treatments.
The germination of four tested plant species in soil pots was different with that in the growth chamber (Figure 2III, 2IV). Under saline stress (Figure 2III), there was no germination for any of the plant species at EC of 15 dS m−1 treatment. Compared to control, the germination percentages were all significantly (p < 0.05) inhibited by saline stress. Under saline-alkaline stress (Figure 2IV), for I. sibirica, L. salicaria and T. orientalis, the highest germination percentages were observed at EC of 5, 7.5 and 5 dS m−1, respectively. However, the germination percentages of A. tatarinowii significantly (p < 0.05) decreased with the gradient of saline-alkaline treatment increased.
The trend of the speed of germination of each respective plant species as affected by different saline and alkaline stress was similar with germination percentages. The detailed description is available in Text S3 and Figure S1 in Supplementary Materials.
3.2. Seedlings Growth
The indicators of seedlings growth (i.e., CCI and LNP) of four tested plant species in the growth chamber are exhibited in Figure 3. Under saline stress (Figure 3I), for A. tatarinowii, CCI at EC of 7.5 dS m−1 treatment was significantly (p < 0.05) less than other treatment. For I. sibirica, the maximum CCI occurred at EC of 7.5 dS m−1 treatments. For CCI of L. salicaria, there was no significant difference among different saline treatments. For T. orientalis, there was no significant difference among EC of 0, 5 and 7.5 dS m−1 treatments. Under saline-alkaline stress (Figure 3II) CCI of A. tatarinowii and I. sibirica was significantly (p < 0.05) reduced with increasing saline-alkaline treatments. For L. salicaria, there was no significant difference between control and EC of 5 dS m−1. For T. orientalis, CCI was only measured in the control treatment because there was no germination in other treatments.
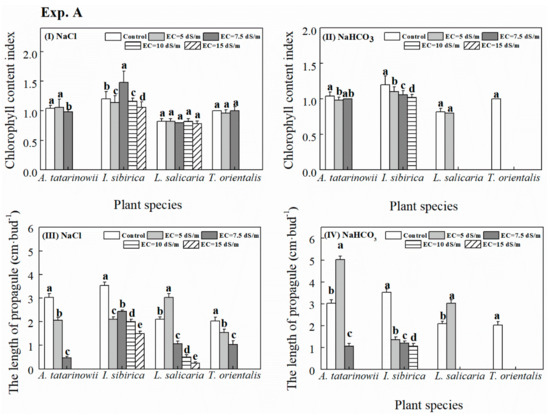
Figure 3.
The growth indicators (I, II: chlorophyll content index (CCI); III, IV: length of new propagules (LNP)) of four tested plant species under saline and alkaline stress in the growth chamber. The absence of column indicates no seedlings growth data obtained in these treatments due to the unsuccessful germination.
Under saline stress (Figure 3III), LNP of A. tatarinowii and T. orientalis significantly (p < 0.05) declined when saline treatment increased from EC of 0 to 7.5 dS m−1. For L. salicaria, the greatest LNP occurred at EC of 5 dS m−1. For I. sibirica, all saline stress significantly (p < 0.05) inhibited LNP compared to control. Under saline-alkaline stress (Figure 3IV), the maximum LNP of A. tatarinowii and L. salicaria was observed at EC of 5 dS m−1. Due to the presence of NaHCO3, LNP of I. sibirica decreased significantly (p < 0.05) with increasing saline-alkaline stress.
The seedlings growth indicators (i.e., CCI, TB and PH) of four plant species in soil pots are presented in Figure 4. Under saline stress (Figure 4I), CCI of four plant species was significantly (p < 0.05) reduced compared to control. Under saline-alkaline stress (Figure 4II), the presence of NaHCO3 significantly (p < 0.05) reduced CCI of A. tatarinowii, I. sibirica and T. orientalis. However, for L. salicaria, CCI significantly (p < 0.05) increased by the EC of 5 dS m−1 treatment compared to other treatments.
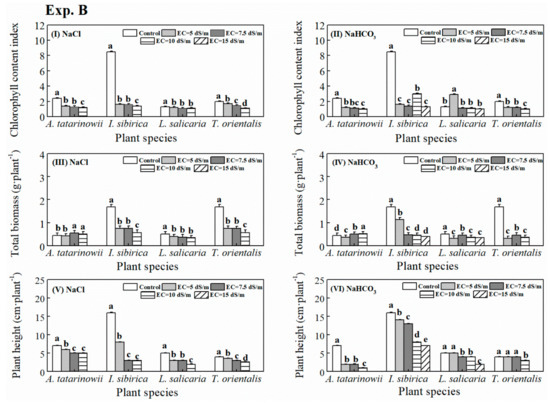
Figure 4.
The growth indicators of seedlings (I, II: CCI; III, IV: total biomass (TB); and V, VI: plant height (PH)) of four tested plant species under saline and alkaline stress in the soil pots. The absence of column indicates no seedlings growth data obtained in these treatments due to the unsuccessful germination.
Under saline stress (Figure 4III), TB of T. orientalis and I. sibirica was significantly (p < 0.05) reduced compared to control. For A. tatarinowii and L. salicaria, there was no significant difference between different salinity treatments. Under saline-alkaline stress (Figure 4IV), TB of A. tatarinowii in EC of 10 dS m−1 treatments were significantly (p < 0.05) greater than other treatments. For I. sibirica, L. salicaria and T. orientalis, TB significantly (p < 0.05) decreased under all saline-alkaline treatment compared to control.
PH of seedlings of four plant species under saline and alkaline stress was shown in Figure 4V and 4VI, respectively. Under saline stress (Figure 4V), PH of four plant species were all significantly (p < 0.05) inhibited by saline stress compared to control. Under saline-alkaline stress (Figure 4VI), PH of A. tatarinowii and I. sibirica was significantly (p < 0.05) reduced under saline-alkaline stress compared to control. PH of L. salicaria at EC from 7.5 to 15 dS m−1 was significantly (p < 0.05) lower than that in EC of 0 and 5 dS m−1. For T. orientalis, PH was significantly (p < 0.05) inhibited by EC of 10 dS m−1 compared to other treatments.
3.3. Vegetative Propagation
NNP of four plant species are shown in Figure 5. Under saline stress (Figure 5I), A. tatarinowii and L. salicaria could reproduce asexually in treatments with EC from 0.3 dS m−1 to 20 dS m−1. I. sibirica could reproduce asexually when EC was between 0.3 dS m−1 to 15 dS m−1. However, NNP of T. orientalis were only observed at EC of 5 dS m−1. For L. salicaria, high saline stress (i.e., EC of 15 and 20 dS m−1) significantly (p < 0.05) produced greater NNP compared to other treatments. For A. tatarinowii and I. sibirica, the greatest NNP both occurred at EC of 5 dS m−1 treatments. Under saline-alkaline stress (Figure 5II), NNP of four plant species was less than that under saline stress. L. salicaria and I. sibirica can reproduce asexually at EC of 0.3 and 5 dS m−1 and higher saline-alkaline stress significantly (p < 0.05) inhibited the vegetative propagation of L. salicaria and I. sibirica. For A. tatarinowii, the new propagules were observed in all saline-alkaline treatments and the maximum NNP occurred at EC of 5 dS m−1. For T. orientalis, the new propagules were observed at both EC of 5 and 10 dS m−1 and the maximum NNP appeared in EC of 5 dS m−1.

Figure 5.
Number of new propagules (NNP) of four tested plant species under saline and alkaline stress in wetland beds (I: saline stress; II: alkaline stress). The absence of column indicates no new propagules occurred in these treatments.
3.4. Continued Growth
The growth indicators (i.e., LNR, CCI in leaves and TDB) of four plant species growing in the wetland beds, are presented in Figure 6. Under saline stress (Figure 6I), new roots of L. salicaria were observed in all treatments, LNR at EC of 10, 15 and 20 dS m−1 treatment was significantly (p < 0.05) increased compared control and EC of 5 dS m−1. LNR of A. tatarinowii at EC of 10 dS m−1 was significantly (p < 0.05) longer than other treatments. LNR of I. sibirica and T. orientalis significantly (p < 0.05) was reduced when saline stress came to EC of 5 and 10 dS m−1, respectively. Under saline-alkaline stress (Figure 6II), new roots of I. sibirica were observed in all treatments. The maximum LNR of A. tatarinowii, L. salicaria and T. orientalis was observed at EC of 10, 5 and 5 dS m−1 treatment, respectively. The LNR of I. sibirica significantly (p < 0.05) decreased in treatments with EC from 10 to 20 dS m−1 compared to other treatments.

Figure 6.
The growth indicators (I, II: LNR; III, IV: CCI in leaves; and V, VI: total dry biomass (TDB)) of four tested plant species under saline and alkaline stress in wetland beds. The absence of column indicates no new roots growth occurred in these treatments.
CCI in leaves of four plant species are presented in Figure 6III, 6IV. Under saline stress (Figure 6III), the increasing salinity levels significantly (p < 0.05) reduced CCI of I. sibirica. The highest CCI of L. salicaria appeared in EC of 15 dS m−1. CCI of A. tatarinowii and T. orientalis was significantly (p < 0.05) inhibited by saline stress compared to control. Under saline-alkaline stress (Figure 6IV), CCI of I. sibirica significantly (p < 0.05) decreased with the increasing saline-alkaline stress. The existence of saline-alkaline stress significantly (p < 0.05) reduced CCI in leaves of A. tatarinowii and T. orientalis compared to control. The maximum CCI of L. salicaria was observed at EC of 5 dS m−1.
TDB of four plant species is exhibited in Figure 6V, 6VI. Under saline stress (Figure 6V), the maximum TDB of A. tatarinowii, L. salicaria and T. orientalis occurred at EC of 5, 15 and 5 dS m−1, respectively. The presence of saline stress significantly (p < 0.05) decreased TDB of I. sibirica compared to control. Under saline-alkaline stress (Figure 6VI), TDB of I. sibirica significantly (p < 0.05) decreased with the increasing saline-alkaline stress. For A. tatarinowii L. salicaria and T. orientalis, the greatest biomass was observed at EC of 5, 15 and 20 dS m−1 treatment respectively.
3.5. Ionic Absorption by Plants
The ionic absorption of (i.e., Na+, K+ and Na+/K+ ratios) both seedlings (in soil pots) and mature plant (in wetland beds) of four tested plant species under different saline and alkaline stress was evaluated. Due to word count limit, considering the wetland bed experiment is closer to real condition, only the results of the wetland beds experiment are presented in this section, while the results of the soil pot experiment are available in Figure S2 in Supplementary Materials.
3.5.1. Ionic Absorption by Plants under Saline Stress
The Na+ content in aerial and underground tissue of tested plant growing in wetland beds with saline (NaCl) stress are presented in Figure 7I, 7IV. The average Na+ content in aerial and underground tissue of four plant species were approximately 55 and 100 mg g−1 DW, respectively. saline treatments significantly (p < 0.05) promote the Na+ absorption in aerial and underground tissue of four plant species compared to control.
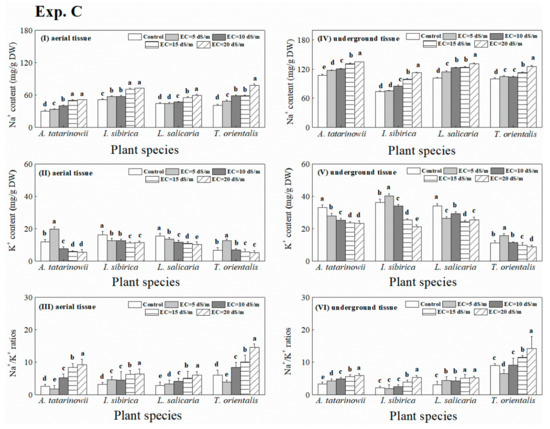
Figure 7.
Na+ and K+ content (I, IV, II and V) and Na+/K+ ratios (III, VI) in four tested plant species under saline stress.
The K+ content in aerial and underground tissue is presented in Figure 7II, 7V. The average K+ content of all tested plant species in aerial and underground tissue was approximately 10 and 20 mg g−1 DW, respectively. For aerial tissue (Figure 7II), the highest K+ content of A. tatarinowii and T. orientalis occurred at EC of 5 dS m−1. For I. sibirica, the existence of salinity significantly (p < 0.05) reduced K+ content compared to control. The K+ content of L. salicaria was significantly (p < 0.05) decreased with the increasing salinity levels. For underground tissue (Figure 7V), the presence of salinity significantly (p < 0.05) decreased K+ content of A. tatarinowii and L. salicaria compared to control. The highest K+ content in underground of I. sibirica and T. orientalis were observed at EC of 5 dS m−1.
The variation of Na+/K+ ratios in aerial and underground tissue of four plant species is exhibited in Figure 7 III, 7VI. For L. salicaria and I. sibirica, Na+/K+ ratios in aerial tissue significantly (p < 0.05) increased with increasing saline stress (Figure 7III). For A. tatarinowii and T. orientalis, Na+/K+ ratios in aerial tissue significantly (p < 0.05) decreased at EC of 10, 15 and 20 dS m−1 treatments compared to other treatments. For underground tissue (Figure 7VI), the Na+/K+ ratios of A. tatarinowii significantly (p < 0.05) increased with increasing saline stress. For I. sibirica and T. orientalis, the Na+/K+ ratios in underground tissue at EC of 10 and 15 dS m−1 significantly (p < 0.05) greater than other treatments. The Na+/K+ ratios in underground tissue of L. salicaria were all significantly (p < 0.05) increased by saline stress compared to the control.
3.5.2. Ionic Absorption by Plants under Saline-Alkaline Stress
The variation of ionic absorption of all tested plant species under saline-alkaline stress was similar with that under saline stress (Figure 8). The existence of saline-alkaline stress increased Na+ content of most plant species compared to control. The average Na+ content in aerial and underground tissue of four plant species were approximately 65 and 110 mg g−1 DW, respectively, which was higher than that under saline stress. In general, the change of K+ content under saline-alkaline stress was consistent with that under saline stress. However, the average K+ content in underground tissue under saline-alkaline stress was greater than that under saline stress. The response of Na+/K+ ratios to saline-alkaline stress for most tested plant species was similar with that to saline stress except for T. orientalis. which exhibited the maximum Na+/K+ ratios in aerial and underground tissue was observed at EC of 15 dS m−1 treatment.
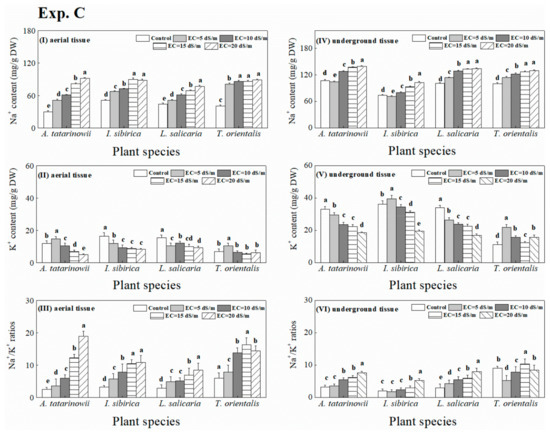
Figure 8.
Na+ and K+ content (I, IV, II and V) and Na+/K+ ratios (III, VI) of four tested plant species under saline-alkaline stress.
4. Discussion
4.1. Effects of Saline and Alkaline Stress on the Germination of Plant Seeds
Germination is a vital step for the successful establishment of plant. Under saline and alkaline stress, the low water potential caused by osmosis stress can be considered a crucial factor inhibiting the germination of seeds [25]. However, the germination of some plant species may be stimulated by low saline stress due to their salt tolerance or specific salt-avoidance mechanisms [26]. In this study, both conditions (i.e., growth chamber and soil pot) for testing the germination of plants were designed. According to the results obtained in Experiment A, it can be illustrated that the salt tolerance capacity of plants is species dependent. For example, the germination of I. sibirica and L. salicaria was promoted by specific saline stress, respectively. However, the inhibition of germination in T. orientalis was greater than in the other plant species. The non-germinated seeds may exhibit dormancy to reduce the risk of adverse environment [27]. When the environmental conditions improve (e.g., rain fall causes saline stress decrease), then the seeds are able to germinate and this might be a strategy for some plants to survive under high salinity stress [12]. Saline stress leads to osmotic pressure and ion-induced injury [28]; however, there is an additional effect of high pH under saline-alkaline stress [29], similar to that reported by Guo et al. [30]. Both germination percentages and speed of germination in the plant species under saline-alkaline stress in this study were lower than that under saline stress at the same EC value, especially for T. orientalis, which exhibited no germination under saline-alkaline stress even at low EC treatments. This observation has probably been explained by damage to the seed structure and even death due to high pH [30].
The germination percentages and speed of most tested plants in soil pots were greater than that in growth chamber. This observation might be explained by the soil moisture and the existence of nutrients in soils [31,32]. Both above factors can alleviate the damage to seeds under lower treatment levels. Unlike the growth chamber experiment, the germination of all tested species in soil pots was inhibited by saline stress compared to control. While, under saline-alkaline stress, the germination of all the species except for A. tatarinowii was promoted under low stress treatment. This might be owing to the diverse adaptation strategy of various plant species to the nutrient in soils [33].
In general, the seed germination of I. sibirica and L. salicaria exhibited relatively better saline and alkaline tolerance. However, the response of each tested plant to saline-alkaline stress during their germination is different between growth chamber and soil pots. Therefore, it is recommended that different culture environment should be tested in the future studies for obtained a comprehensive assessment of saline and alkaline tolerance capacity of plant species.
4.2. Effects of Saline and Alkaline Stress on Seedlings Growth
Seedling growth is also a critical and salt-sensitive stage for plants [33]. The influences of saline and alkaline stress on seedlings growth might be caused by the combined effects on cell water relations and ionic toxicity [34]. In this study, CCI of L. salicaria was rarely inhibited by saline stress. Low saline stress was even beneficial to the increase of CCI of A. tatarinowii and I. sibirica. The length of the new propagules of A. tatarinowii, I. sibirica and T. orientalis was inhibited by saline stress due to low water potential and ionic toxicity [35]. For L. salicaria, low saline stress (i.e., EC of 5 dS m−1) can stimulate the growth in height of its seedlings. With the addition of alkaline salt, the damaging effect of saline-alkaline stress was generally more severe than that of saline stress at the same EC due to high pH, which was consistent with previous study [36]. CCI was inhibited by saline-alkaline stress in most tested plant species in this study. This observation might be caused by the destruction of thylakoids under saline-alkaline stress [37]. The LNP of all tested plant species was inhibited completely by high saline-alkaline stress (i.e., EC of 15 dS m−1). This can be explained by the perturbations of metabolic processes (i.e., nucleic acid and protein syntheses) under high levels of saline-alkaline stress [38].
In soil pots, the dilution of the soil and organic matter and nutrients (i.e., N, P, K and Ca) in the soil reduce the impacts of saline and alkaline stress on the seedlings [39], their early growth and development in the soil pots was much better than that in growth chamber. All growth indicators in soil pots remained at higher levels than in growth chamber. However, seedlings growth of most tested plant species, in agreement with previous studies, was still inhibited by saline and alkaline stress compared to control [40]. Saline and alkaline stress caused ionic toxicity, ionic imbalance and generation of excessive reactive oxygen species (ROS), which leads to cell toxicity, membrane dysfunction and cell death, then the inhibition of seedlings growth [41,42].
In general, most growth indicators of I. sibirica and L. salicaria remained at high levels during the stage of seedlings growth indicating their better tolerance of saline and alkaline stress than A. tatarinowii and T. orientalis.
4.3. Effects of Saline and Alkaline Stress on Vegetative Propagation and Growth
Vegetative propagation and growth were affected by saline and alkaline stress, which might be related to the lack of photosynthesis and the decrease of carbon assimilation rate due to ionic toxicity and osmotic pressure [43]. In addition to the ionic toxicity and osmotic pressure, a high pH under saline-alkaline stress may also adversely affect vegetative propagation and growth in the plant species studied compared to saline stress [44].
In this study, NNP was used to represent the vegetative propagation capacity. survival and growth of new propagules can be inhibited by saline and alkaline stress [45]. The vegetative propagation of most tested plant species (e.g., A. tatarinowii, L. salicaria and T. orientalis) under saline stress was promoted by specific treatments. This observation may be explained by the presence of soil microorganisms, which can sometimes promote the vegetative propagation of plants [46]. Additionally, due to the combined damage of osmotic stress and high pH, the vegetative propagation was inhibited more severely by saline-alkaline stress than saline stress, which was similar to germination under saline-alkaline stress.
During the plant growth stage, the growth indicators (i.e., LNR, CCI and TDB) of the tested plant species was used to evaluate the effect of saline and alkaline stress on the plant growth. Previous study reported that high salt concentrations limit the nutrient uptake by roots and disturb the water relations of plant; high salinity may also cause ionic imbalance and toxicity in plants [47]. In addition, high pH in saline-alkaline stress may lead to structural destruction of root cell and affect physiological functions of plants [48]. In this study, saline and alkaline stress inhibited the growth of root cell and decreased LNR in most tested plant species. However, for A. tatarinowii, L. salicaria and T. orientalis, specific saline and alkaline treatment (i.e., EC of 5, 10 and 20 dS m−1) can promote roots growth, which was in agreement with previous research [49]. Saline and alkaline stress also can affect the photosynthetic function [50]. In this study, CCI of most tested plant species was inhibited by saline and alkaline stress. A similar result was identified by Li et al. [11]. The decrease in CCI of plant might be caused by the stimulated activity of chlorophyllase and chlorophyll degrading enzyme under saline and alkaline stress [51]; as this type of enzyme can disturb biosynthesis of chlorophyll and inhibited the photosynthetic activity [52]. The typical symptom of plant under saline and alkaline stress is cell elongation was inhibited [53], which leads to the inhibition on TDB in the tested plant species. Generally, during vegetative propagation and growth stage, I. sibirica and A. tatarinowii showed better tolerance under saline and alkaline environment.
4.4. Effects of Saline and Alkaline Stress on Ionic Balance during Seedlings Growth and Mature Plant Growth Stages
The Na+ content, K+ content as well as Na+/K+ ratios during seedlings growth and mature plant growth stage were tested for evaluating the effect of saline and alkaline stress on ionic balance in plants. Several prior studies illuminated that saline and alkaline stress might cause ionic toxicity through the accumulation of Na+ and the reduction of K+ in plant tissues [24]. Furthermore, saline-alkaline stress posed a greater adverse impact on ionic balance than saline stress [52,54]. In seedlings growth and mature plant growth stage, the Na+ content under saline and alkaline stress were higher than control in this study. The uptake, transport and accumulation of the Na+ ions were disturbed by saline and alkaline stress. An excessive Na+ would cause ionic toxicity, nutritional imbalance, metabolic disturbance and physiological drought in plants [55]. For mature plant growth stage, the Na+ content in the aerial tissue were lower than that in the underground tissue. The greater accumulation of Na+ in the underground tissue may indicate the existence of an inhibition mechanism of Na+ transport to aerial [13]. In contrast with the Na+ content, the K+ content of most plant species in growth stage was inhibited by saline and alkaline stress and the saline-alkaline stress caused a greater reduction of K+ content. The high Na+ accumulation can interfere with K+ uptake due to the damaging effect to the membrane systems [56]. Saline-alkaline stress may have a greater impact on the K+ uptake due to high pH. Low Na+ content and high K+ content in plants are vital for plants to maintain many enzymatic processes [55]. In this study, Na+/K+ ratios of most plant species increased with increasing NaCl and NaHCO3 concentration. Much higher Na+/K+ ratios were observed under saline-alkaline stress. This phenomenon might because high pH leads to more severe damage to the intracellular membrane system than saline stress [57].
4.5. Principal Component Analysis (PCA) for Selecting Salt Tolerance Evaluation Indicators
Saline and alkaline stress can affect various indicators of plants. In previous studies, many biochemical indicators (e.g., superoxide dismutase (SOD), chloroplast protein (CP12), glutathione S-transferase (GST), peroxiredoxin, proline, etc.) and related genes were widely used to evaluate the salt tolerance of plants [58,59,60]. However, the determination of biochemical indicators is costly and complicated as they are usually non-intuitive. More intuitive indicators need to be selected and applied for quick evaluation of the salt tolerance capacity of plants. Therefore, PCA was applied for selecting the most reprehensive salt tolerance indicators from the multiple indicators tested in this study. It is noteworthy that this study aimed to select salt tolerant plant species in CWs for saline and/or alkaline wastewater treatment, therefore only the growth indicators during vegetative propagation and plant growth stages were given priority to be used in the analysis.
Three principal components were selected for evaluating the salt tolerance capacity of wetland plants (Table 1). The first principal component mainly consisted of Na+ content in underground tissue and the length of new roots, which represent the root growth condition of plants under saline and alkaline stress. This suggests that the above parameters of root growth (i.e., Na+ content in underground tissue and the length of new roots) can be regarded as the primary indicators for evaluating salt tolerance capacity of wetland plant species. Due to the direct contact with salt, the first organ to be affected by saline and alkaline stress is underground tissue (i.e., root) [61]. The existing salt on the outside of roots has an immediate effect on cell growth and associated metabolism [55]. Therefore, wetland plant species which have better roots growth and less Na+ accumulation in underground tissue can better resist saline and alkaline stress. The second principal component was mainly composed of Na+ content in aerial tissue, Na+/K+ ratios in aerial tissue. Saline and alkaline stress can cause ionic imbalance, large number of Na+ ions enter cell, resulting in ionic toxicity and nutrient deficiency [12]. Less Na+ accumulation and lower Na+/K+ ratios in aerial tissue can be beneficial for keep ionic balance of plant [19]. Total dry biomass was mainly in the third principal component. Plant species with greater biomass under saline and alkaline stress may have less damage and greater resistance to saline and alkaline stress [62]. In summary, the length of new roots, the Na+ content of plant in aerial and underground tissue, Na+/K+ ratios in aerial tissue and total dry biomass were selected as the most representative indicators for salt tolerance capacity evaluation of wetland plant species.

Table 1.
Principal component analysis (PCA) of plants indicators under saline and alkaline stress.
5. Conclusions
In this study, the influences of saline and alkaline stress on the entire growth process of four typical wetland plants used in CWs was evaluated. Saline and alkaline stress exhibited an adverse effect on the entire growth process of plants and the influence of saline-alkaline stress was more serious than that of saline stress due to the detrimental effects of high pH. The degree of this influence on four tested plant species is varied between species. For some indicators (e.g., germination, the number of new propagules, the length of new roots and total dry biomass), the low and moderate saline and alkaline stress can sometimes play a promotive role. Overall, A. tatarinowi and I. sibirica can effectively resist saline and alkaline stress in this study.
In order to evaluate the salt tolerance of plant species comprehensively and intuitively, some representative indicators need to be selected. According to the result of PCA, the length of new roots, Na+ content in plant tissue, Na+/K+ ratios in aerial tissue and total dry biomass can be considered the most representative indicators for evaluating the salt tolerance capacity of wetland plant species during their vegetative propagation and mature plant growth stages.
Supplementary Materials
The following are available online at https://www.mdpi.com/2071-1050/12/5/1913/s1, Figure S1: Speed of germination of tested plants observed under different treatments (I, II: growth chamber; III, IV: soil pots). The absence of column indicates no germination occurred in these treatments. Figure S2: Na+ and K+ content (I, IV, II and V) and Na+/K+ ratios (III, VI) of wetland plant seedlings under saline and alkaline stress. The absence of column indicates no seedlings growth data obtained in these treatments due to the unsuccessful germination.
Author Contributions
Funding acquisition, H.Z.; Investigation, R.C.; Methodology, R.C. and X.C.; Project administration, H.Z.; Resources, H.Z. and B.X.Y.; Supervision, H.Z. and B.Y.; Writing—original draft, R.C.; Writing—review & editing, H.Z. and B.S. All authors have read and agreed to the published version of the manuscript.
Funding
This work was funded by the National Key R&D Program of China (No. 2016YFC0500404-4) and the Youth Innovation Promotion Association of CAS (No. 2017274).
Conflicts of Interest
The authors declare no conflicts of interest.
References
- Liang, Y.; Zhu, H.; Bañuelos, G.; Yan, B.; Zhou, Q.; Yu, X.; Cheng, X. Constructed wetlands for saline wastewater treatment: A review. Ecol. Eng. 2017, 98, 275–285. [Google Scholar] [CrossRef]
- Liang, Y.; Cheng, X.; Zhu, H.; Shutes, B.; Yan, B.; Zhou, Q.; Yu, X. Historical evolution of mariculture in China during past 40 years and its impacts on eco-environment. Chinese Geogr. Sci. 2018, 28, 363–373. [Google Scholar] [CrossRef]
- Jeddi, M.; Karray, F.; Loukil, S.; Mhiri, N.; Abdallah, M.B.; Sayadi, S. Anaerobic biological treatment of industrial saline wastewater: Fixed bed Reactor performance and analysis of the microbial community structure and abundance. Environ. Technol. 2018, 1–29. [Google Scholar] [CrossRef] [PubMed]
- Bañuelos, G.; Lin, Z. Reuse of agricultural drainage water in central California: phytosustainability in soil with high levels of salinity and toxic trace elements. Geo. Soc. London Special Pub. 2006, 266, 79–88. [Google Scholar] [CrossRef]
- Lefebvre, O.; Vasudevan, N.; Torrijos, M.; Thanasekaran, K.; Moletta, R. Halophilic biological treatment of tannerysoak liquor in a sequencing batch reactor. Water Res. 2005, 39, 1471–1480. [Google Scholar] [CrossRef] [PubMed]
- Yang, C.; Xu, H.; Wang, L.; Liu, J.; Shi, D.; Wang, D. Comparative effects of salt-stress and alkali-stress on the growth, photosynthesis, solute accumulation and ion balance of barley plants. Photosynthetica. 2009, 47, 79–86. [Google Scholar] [CrossRef]
- Wu, S.; Wallace, S.; Brix, H.; Kuschk, P.; Kirui, W.K.; Masi, F.; Dong, R. Treatment of industrial effluents in constructed wetlands: challenges, operational strategies and overall performance. Environ. Pollut. 2015, 201, 107–120. [Google Scholar] [CrossRef]
- Wang, M.; Zhang, D.; Dong, J.; Tan, S. Application of constructed wetlands for treating agricultural runoff and agro-industrial wastewater: a review. Hydrobiologia 2017, 805, 1–31. [Google Scholar] [CrossRef]
- Vymazal, J. Plants used in constructed wetlands with horizontal subsurface flow: a review. Hydrobiologia 2011, 674, 133–156. [Google Scholar] [CrossRef]
- Calheiros, C.S.; Silva, G.; Quitério, P.V.; Crispim, L.F.; Brix, H.; Moura, S.C.; Castro, P.M. Toxicity of high salinity tannery wastewater and effects on constructed wetland plants. Int. J. Phytoremedia. 2012, 14, 669–680. [Google Scholar] [CrossRef]
- Li, R.; Shi, F.; Fukuda, K.; Yang, Y. Effects of salt and alkali stresses on germination, growth, photosynthesis and ion accumulation in alfalfa (Medicago sativa L.). Soil Sci. Plant Nutr. 2010, 56, 725–733. [Google Scholar] [CrossRef]
- Zhang, H.; Zhang, G.; Lv, X.; Zhou, D.; Han, X. Salt tolerance during seed germination and early seedling stages of 12 halophytes. Plant Soil. 2015, 388, 229–241. [Google Scholar] [CrossRef]
- Cheng, X.; Zhu, H.; Bañuelos, G.; Yan, B.; Shutes, B.; Liang, Y.; Chen, X. Saline-alkaline tolerance of hygrophilous plant species during their asexual propagation and continued growth stages. S. Afr. J. Bot. 2018, 118, 129–137. [Google Scholar] [CrossRef]
- Zhao, Y.; Lu, Z.; He, L. Effects of saline-alkaline stress on seed germination and seedling growth of Sorghum bicolor (L.) Moench. Appl. Biochem. Biotech. 2014, 173, 1680–1691. [Google Scholar] [CrossRef]
- Vicente, M.J.; Conesa, E.; Alvarez-Rogel, J.; Franco, J.A.; Martínez-Sánchez, J.J. Relationships between salt type and seed germination in three plant species growing in salt marsh soils of semi-arid Mediterranean environments. Arid Land Res. Mana. 2009, 23, 103–114. [Google Scholar] [CrossRef]
- Lin, J.; Mu, C.; Wang, Y.; Li, Z.; Li, X. Physiological adaptation mechanism of leymus chinensis during germination and early seedling stages under saline and alkaline conditions. J. Anim. Plant Sci. 2014, 24, 904–912. [Google Scholar]
- Gao, Z.; Han, J.; Mu, C.; Lin, J.; Sun, S. Effects of saline and alkaline stresses on growth and physiological changes in oat (Avena sativa L.) seedlings. Not. Bot. Horti. Agro. Bo. 2014, 42, 357–362. [Google Scholar] [CrossRef]
- Zhang, H.; Tian, Y.; Guan, B.; Zhou, D.; Sun, Z.; Baskin, C.C. The best salt solution parameter to describe seed/seedling responses to saline and sodic salts. Plant Soil. 2018, 426, 313–325. [Google Scholar] [CrossRef]
- Kanawapee, N.; Sanitchon, J.; Lontom, W.; Threerakulpisut, P. Evaluation of salt tolerance at the seedling stage in rice genotypes by growth performance, ion accumulation, proline and chlorophyll content. Plant Soil. 2012, 358, 235–249. [Google Scholar] [CrossRef]
- Zhao, Y.; Cheng, P.; Pei, X.; Zhang, H.; Yan, C.; Wang, S.B. Performance of hybrid vertical up- and downflow subsurface flow constructed wetlands in treating synthetic high-strength wastewater. Environ. Sci. Pollut. R. 2012, 2013, 4886–4894. [Google Scholar] [CrossRef]
- Gao, J.; Wang, W.; Guo, X.; Zhu, S.; Chen, S.; Zhang, R. Nutrient removal capability and growth characteristics of Iris sibirica in subsurface vertical flow constructed wetlands in winter. Ecol. Eng. 2014, 70, 351–361. [Google Scholar] [CrossRef]
- Liu, B.; Ji, M.; Zhai, H. Anodic potentials, electricity generation and bacterial community as affected by plant roots in sediment microbial fuel cell: Effects of anode locations. Chemosphere 2018, 209, 739–747. [Google Scholar] [CrossRef] [PubMed]
- Tang, X.; Yang, Y.; McBride, M.B.; Tao, R.; Dai, Y.; Zhang, X. Removal of chlorpyrifos in recirculating vertical flow constructed wetlands with five wetland plant species. Chemosphere 2019, 216, 195–202. [Google Scholar] [CrossRef] [PubMed]
- Zhu, H.; Bañuelos, G. Influence of salinity and boron on germination, seedling growth and transplanting mortality of guayule: A combined growth chamber and greenhouse study. Ind. Crop Prod. 2016, 92, 236–243. [Google Scholar] [CrossRef]
- Debez, A.; Hamed, K.B.; Grignon, C.; Abdelly, C. Salinity effects on germination, growth and seed production of the halophyte Cakile maritima. Plant Soil. 2004, 262, 179–189. [Google Scholar] [CrossRef]
- Nichols, P.G.H.; Malik, A.I.; Stockdale, M.; Colmer, T.D. Salt tolerance and avoidance mechanisms at germination of annual pasture legumes: importance for adaptation to saline environments. Plant Soil. 2009, 315, 241–255. [Google Scholar] [CrossRef]
- Smýkal, P.; Vernoud, V.; Blair, M.W.; Soukup, A.; Thompson, R.D. The role of the testa during development and in establishment of dormancy of the legume seed. Front Plant Sci. 2014, 5, 351. [Google Scholar]
- Chen, S.; Xing, J.; Lan, H. Comparative effects of neutral salt and alkaline salt stress on seed germination, early seedling growth and physiological response of a halophyte species Chenopodium glaucum. Afr. J. Biotechnol. 2012, 11, 9572–9581. [Google Scholar]
- Piovan, M.J.; Zapperi, G.M.; Pratolongo, P.D. Seed germination of Atriplex undulata under saline and alkaline conditions. Seed Sci. Technol. 2014, 42, 286–292. [Google Scholar] [CrossRef]
- Guo, R.; Shi, L.; Ding, X.; Hu, Y.; Tian, S.; Yan, D.; Gao, Y.; Shao, S.; Liu, R.; Yang, Y. Effects of saline and alkaline stress on germination, seedling growth and ion balance in wheat. Agron. J. 2010, 102, 1252–1260. [Google Scholar] [CrossRef]
- Bonilla, I.; El-Hamdaoui, A.; Bolaños, L. Boron and calcium increase Pisum sativum seed germination and seedling development under salt stress. Plant Soil. 2004, 267, 97–107. [Google Scholar] [CrossRef]
- Kołodziejek, J. Effect of seed position and soil nutrients on seed mass, germination and seedling growth in Peucedanum oreoselinum (Apiaceae). Sci. Rep. UK. 2017, 7, 1959. [Google Scholar] [CrossRef] [PubMed]
- Berendse, F. Effects of dominant plant species on soils during succession in nutrient-poor ecosystems. Biogeochemistry 1998, 42, 73–88. [Google Scholar] [CrossRef]
- Sanchez, P.L.; Chen, M.K.; Pessarakli, M.; Hill, H.J.; Gore, M.A.; Jenks, M.A. Effects of temperature and salinity on germination of non-pelleted and pelleted guayule (Parthenium argentatum A. Gray) seeds. Ind. Crop Prod. 2014, 55, 90–96. [Google Scholar] [CrossRef]
- Hosseini, M.K.; Powell, A.A.; Bingham, I.J. Comparison of the seed germination and early seedling growth of soybean in saline conditions. Seed Sci. Res. 2002, 12, 165–172. [Google Scholar] [CrossRef]
- Habib, S.H.; Kausar, H.; Saud, H.M.; Ismail, M.R.; Othman, R. Molecular Characterization of Stress Tolerant Plant Growth Promoting Rhizobacteria (PGPR) for Growth Enhancement of Rice. Int J. Agr. Biol. 2016, 18, 184–191. [Google Scholar]
- Li, G.; Wan, S.; Zhou, J.; Yang, Z.; Qin, P. Leaf chlorophyll fluorescence, hyperspectral reflectance, pigments content, malondialdehyde and proline accumulation responses of castor bean (Ricinus communis L.) seedlings to salt stress levels. Ind. Crop Prod. 2010, 31, 13–19. [Google Scholar] [CrossRef]
- Wang, X.; Wang, J.; Liu, H.; Zou, D.; Zhao, H. Influence of natural saline-alkali stress on chlorophyll content and chloroplast ultrastructure of two contrasting rice (Oryza sativa L. japonica) cultivars. Aust. J. Crop Sci. 2013, 7, 289–292. [Google Scholar]
- Anuradha, S.; Rao, S.S.R. Effect of brassinosteroids on salinity stress induced inhibition of seed germination and seedling growth of rice (Oryza sativa L.). Plant Growth Regul. 2001, 33, 151–153. [Google Scholar] [CrossRef]
- Mahdy, A.M. Soil properties and wheat growth and nutrients as affected by compost amendment under saline water irrigation. Pedosphere 2011, 21, 773–781. [Google Scholar] [CrossRef]
- Senay, G.B.; Leake, S.; Nagler, P.L.; Artan, G.; Dickinson, J.; Cordova, J.T.; Glenn, E.P. Estimating basin scale evapotranspiration (ET) by water balance and remote sensing methods. Hydrol. Process. 2011, 25, 4037–4049. [Google Scholar] [CrossRef]
- Sawada, H.; Shim, I.S.; Usui, K. Induction of benzoic acid 2-hydroxylase and salicylic acid biosynthesis-modulation by salt stress in rice seedlings. Plant Sci. 2006, 171, 263–270. [Google Scholar] [CrossRef]
- Corratgé-Faillie, C.; Jabnoune, M.; Zimmermann, S.; Véry, A.A.; Fizames, C.; Sentenac, H. Potassium and sodium transport in non-animal cells: the Trk/Ktr/HKT transporter family. Cell. Mol. Life Sci. 2010, 67, 2511–2532. [Google Scholar] [CrossRef] [PubMed]
- Berković, B.; Cabaco, S.; Barrio, J.M.; Santos, R.; Serrão, E.A.; Alberto, F. Extending the life history of a clonal aquatic plant: dispersal potential of sexual and asexual propagules of Zostera noltii. Aquat Bot. 2014, 113, 123–129. [Google Scholar] [CrossRef]
- Hajiboland, R.; Aliasgharzadeh, A.; Laiegh, S.F.; Poschenrieder, C. Colonization with arbuscular mycorrhizal fungi improves salinity tolerance of tomato (Solanum lycopersicum L.) plants. Plant Soil 2010, 331, 313–327. [Google Scholar] [CrossRef]
- Ben Ahmed, C.; Ben Rouina, B.; Sensoy, S.; Boukhriss, M.; Abdullah, F.B. Saline water irrigation effects on antioxidant defense system and proline accumulation in leaves and roots of field-grown olive. J. Agr. Food chem. 2009, 57, 11484–11490. [Google Scholar] [CrossRef]
- López-Climent, M.F.; Arbona, V.; Pérez-Clemente, R.M.; Gómez-Cadenas, A. Relationship between salt tolerance and photosynthetic machinery performance in citrus. Environ Exp Bot. 2008, 62, 176–184. [Google Scholar] [CrossRef]
- Turan, M.A.; Elkarim, A.H.A.; Taban, N.; Taban, S. Effect of salt stress on growth and ion distribution and accumulation in shoot and root of maize plant. Afr. J. Agr. Res. 2010, 5, 584–588. [Google Scholar]
- Hussain, S.; Morillon, R.; Anjum, M.A.; Ollitrault, P.; Costantino, G.; Luro, F. Genetic diversity revealed by physiological behavior of citrus genotypes subjected to salt stress. Acta Physiol. Plantarum. 2015, 37, 1740. [Google Scholar] [CrossRef]
- Degenhardt, B.; Gimmler, H.; Hose, E.; Hartung, W. Effect of alkaline and saline substrates on ABA contents, distribution and transport in plant roots. Plant Soil. 2000, 225, 83–94. [Google Scholar] [CrossRef]
- Qiu, N.; Lu, C. Enhanced tolerance of photosynthesis against high temperature damage in salt-adapted halophyte Atriplex centralasiatica plants. Plant Cell Environ. 2003, 26, 1137–1145. [Google Scholar] [CrossRef]
- Noreen, Z.; Ashraf, M. Assessment of variation in antioxidative defense system in salt-treated pea (Pisum sativum) cultivars and its putative use as salinity tolerance markers. J. Plant Physiol. 2009, 166, 1764–1774. [Google Scholar] [CrossRef] [PubMed]
- Guo, R.; Yang, Z.; Li, F.; Yan, C.; Zhong, X.; Liu, Q.; Xia, X.; Li, H.; Zhao, L. Comparative metabolic responses and adaptive strategies of wheat (Triticum aestivum) to salt and alkali stress. BMC Plant Biol. 2015, 15, 170. [Google Scholar] [CrossRef] [PubMed]
- Yasar, F.; Ellialtioglu, S.; Yildiz, K. Effect of salt stress on antioxidant defense systems, lipid peroxidation and chlorophyll content in green bean. Russ. J. Plant Physl. 2008, 55, 782. [Google Scholar] [CrossRef]
- Munns, R.; Tester, M. Mechanisms of salinity tolerance. Annu. Rev. Plant Biol. 2008, 59, 651–681. [Google Scholar] [CrossRef] [PubMed]
- Zhu, J. Salt and drought stress signal transduction in plants. Annu. Rev. Plant Biol. 2002, 53, 247–273. [Google Scholar] [CrossRef]
- Zeng, J.; Chen, A.; Li, D.; Yi, B.; Wu, W. Effects of salt stress on the growth, physiological responses and glycoside contents of Stevia rebaudiana Bertoni. J. Agri. Food Chem. 2013, 61, 5720–5726. [Google Scholar] [CrossRef]
- Lv, D.; Subburaj, S.; Cao, M.; Yan, X.; Li, X.; Appels, R.; Yan, Y. Proteome and phosphoproteome characterization reveals new response and defense mechanisms of Brachypodium distachyon leaves under salt stress. Mol. Cell Proteomics. 2014, 13, 632–652. [Google Scholar] [CrossRef]
- Cheng, X.; Deng, G.; Su, Y.; Liu, J.; Yang, Y.; Du, G.; Liu, F. Protein mechanisms in response to NaCl-stress of salt-tolerant and salt-sensitive industrial hemp based on iTRAQ technology. Ind. Crop Prod. 2016, 83, 444–452. [Google Scholar] [CrossRef]
- Hu, H.; Liu, H.; Du, G.; Yang, F.; Deng, G.; Yang, Y.; Liu, F. Fiber and seed type of hemp (Cannabis sativa L.) responded differently to salt-alkali stress in seedling growth and physiological indices. Ind. Crop Prod. 2019, 129, 624–630. [Google Scholar] [CrossRef]
- Zhang, H.; Liu, X.; Zhang, R.; Yuan, H.; Wang, M.; Yang, H.; Ma, H.; Jiang, C.; Liang, Z. Root damage under alkaline stress is associated with reactive oxygen species accumulation in rice (Oryza sativa L.). Front Plant Sci. 2017, 8, 1580. [Google Scholar] [CrossRef] [PubMed]
- Sánchez, E.; Scordia, D.; Lino, G.; Arias, C.; Cosentino, S.L.; Nogués, S. Salinity and water stress effects on biomass production in different Arundo donax L. clones. BioEnerg Res. 2015, 8, 1461–1479. [Google Scholar] [CrossRef]
© 2020 by the authors. Licensee MDPI, Basel, Switzerland. This article is an open access article distributed under the terms and conditions of the Creative Commons Attribution (CC BY) license (http://creativecommons.org/licenses/by/4.0/).