Article

Intelligent Intersection Control for Delay Optimization: Using Meta-Heuristic Search Algorithms

1
Department of Civil and Environmental Engineering, King Fahd University of Petroleum & Minerals, KFUPM Box 5055, Dhahran 31261, Saudi Arabia
2
Department of City and Regional Planning, King Fahd University of Petroleum & Minerals, KFUPM Box 5053, Dhahran 31261, Saudi Arabia
3
School of Transportation and Logistics, Dalian University of Technology, Dalian 116024, China
4
College of Metropolitan Transportation, Beijing University of Technology, Beijing 100124, China
*
Authors to whom correspondence should be addressed.
Sustainability 2020, 12(5), 1896; https://doi.org/10.3390/su12051896
Submission received: 30 January 2020 / Revised: 18 February 2020 / Accepted: 26 February 2020 / Published: 2 March 2020
(This article belongs to the Special Issue Optimization in Logistics and Mobility Using Metaheuristics)

Abstract

:
Traffic signal control is an integral component of an intelligent transportation system (ITS) that play a vital role in alleviating traffic congestion. Poor traffic management and inefficient operations at signalized intersections cause numerous problems as excessive vehicle delays, increased fuel consumption, and vehicular emissions. Operational performance at signalized intersections could be significantly enhanced by optimizing phasing and signal timing plans using intelligent traffic control methods. Previous studies in this regard have mostly focused on lane-based homogenous traffic conditions. However, traffic patterns are usually non-linear and highly stochastic, particularly during rush hours, which limits the adoption of such methods. Hence, this study aims to develop metaheuristic-based methods for intelligent traffic control at isolated signalized intersections, in the city of Dhahran, Saudi Arabia. Genetic algorithm (GA) and differential evolution (DE) were employed to enhance the intersection’s level of service (LOS) by optimizing the signal timings plan. Average vehicle delay through the intersection was selected as the primary performance index and algorithms objective function. The study results indicated that both GA and DE produced a systematic signal timings plan and significantly reduced travel time delay ranging from 15 to 35% compared to existing conditions. Although DE converged much faster to the objective function, GA outperforms DE in terms of solution quality i.e., minimum vehicle delay. To validate the performance of proposed methods, cycle length-delay curves from GA and DE were compared with optimization outputs from TRANSYT 7F, a state-of-the-art traffic signal simulation, and optimization tool. Validation results demonstrated the adequacy and robustness of proposed methods.

1. Introduction

Traffic congestion has become a threatening social concern in major urban cities around the world. It has severe negative consequences for smooth mobility, urban economy as well as increased environmental issues [1,2,3]. For example, in 2014 alone, the US economy suffered $160 billion loss, and over 560 billion pounds of harmful CO2 emissions to the environment in 2011 because of road traffic congestion [4,5]. Functional biodiversity is considered one of the primary index for environment monitoring [6]. In the European Union, traffic congestion costs accounted for approximately 1% of entire gross domestic product (GDP) [7]. In Europe, the concept of green revolution has become quite popular to achieve the goals of sustainable transport infrastructures in recent years [8]. Likewise, it was reported that influential Chinese cities cumulatively suffered a huge daily economic loss worth $1 billion because of traffic congestion [9]. Kingdom of Saudi Arabia (KSA) along with neighboring Gulf states have witnessed rapid rise in economy, increased population growth, and motorization rate since the oil boom in 1970s, which has led to less unsustainable travel patterns such as extreme traffic congestion, social costs, and environmental emissions [10]. According to a study, traffic congestion costs in the city of Riyadh, KSA were estimated to be around $8 billion [11], which is an alarming situation. The primary cause of increased traffic congestion in KSA is lack of public transport and infrastructure except few main cities (Jeddah, Riyadh, Mecca, and Madinah), which has consequently resulted in increased auto-ownership. In 2013, the auto-ownership surged to 220 vehicles per 1000 persons [12]. As per statistics of US Department of Commerce, KSA imported over one million vehicles in 2016 [13]. Rapid motorization in the country has also brought miserable safety concerns including increased road traffic crashes and fatalities [14]. Thus, there is an urgent need to take appropriate steps to make transport infrastructure in KSA more user friendly and environmentally sustainable.
Mobility, safety, and environmental impacts are critical concerns in urban transport networks, particularly at intersections. Intersections are essential component of urban road network, and aimed to ensure safety and smooth flow through urban corridors [15]. However, intersection management has become a global challenge in the present era of rapid motorization. Statistics from previous research conducted by fatality analysis reporting system (FARS) suggest that approximately 40% of total crashes occur near intersections, and about 22% of crash fatalities are intersection related [16]. A recent study conducted in Eastern province, KSA suggested that a large proportion of severe crashes at intersection are associated with driver distractions [17]. In the conventional traffic control paradigm, traffic at the intersection is regulated either by signs or through traffic signals. The vehicles are bound to remain idle and make frequent stops, thus restraining the overall capacity of intersections. In other words, intersection traffic lights are unable to adapt to varying traffic situations leading to extreme congestions, fuel waste, crashes, and exhaust emissions. In recent past, cluster analysis coupled with unsupervised classification has been successfully employed to lower CO2 emissions and to boost circular economy [18]. Signalized intersections are important points along the highway and streets. To evaluate the optimal performance and quality of operations is a challenging task. Various performance measures are adopted by traffic engineers to evaluate and quantify the performance of signalized intersections. Some of these performance measures include average queue length (number of vehicle waiting to cross the intersection), the average delay per vehicle (s/veh.) number of stops, speed and average travel through intersection, etc. It is estimated that, on average, delay at intersection accounts for 15–30% of all traffic delays [19]. Length of a queue is an important measure to determine when the discharge from an adjacent upstream intersection will begin to impede through a given intersection. Delay is a measure of extra time needed to traverse an intersection. The number of stops made during a journey is also an important input variable, particularly in air quality models.
Traffic light settings play a vital role in determining the capacity and quality of operating conditions (level of service, LOS) at signalized intersections. Aiming to minimize average vehicle delay or some other measures of effectiveness (MOEs like emissions, fuel consumptions) through intersections, various models for optimizing signal cycle length have been proposed in previous research studies. The first class of methods in this regard is based on linear and non-linear regressions, and other probability-based methods [20,21,22]. However, the performance of these methods has been frequently questioned under unforeseen traffic conditions (such as traffic incidents, special events etc.,), and oversaturated conditions. A second class of methods deals with optimizing cycle length under both saturated and oversaturated intersection conditions [23,24]. The third group of methods are utilized to optimize other performance measures like pollutant emissions, fuel consumptions by adjusting the cycle length [25,26,27]. The past decade has witnessed rapid development in information and communication technologies such as fourth generation (4G), dedicated short range communication (DSRC), Internet of Things (IOT) sensors that provide unprecedented opportunities for detailed data collection. Consequently, the fourth class of methods are based on simulations and intelligent algorithms to enhance operations at signalized intersections by optimizing cycle length, green splits and offsets [28,29,30,31]. Methods based on simulation and heuristics are more realistic, robust, and efficient in capturing the non-linear and stochastic traffic conditions [32,33]. Various methods discussed above for traffic signal control were mainly focused on lane-based homogenous traffic conditions. However, real-time traffic characteristics are highly stochastic, non-linear, and heterogenous which limits the large-scale adoption of these methodologies. Hence, current study is dedicated to develop intelligent traffic control methods based on meta-heuristics under heterogenous transient traffic conditions to optimize operations at signalized intersections.
During past three decades, KSA has witnessed rapid increase in motorization and auto ownership due to lack of public transportation, except few major cities resulting in huge annual billions of dollars loss to economy due to traffic congestion. However, heuristic-based traffic control has not been thoroughly studied so far, although some signalized intersections in urban metropolitans are operating under actuated traffic control. Thus, heuristic-based intersection traffic control is minimal because of the lack of research in local conditions. Without concrete and authentic research to demonstrate that how heuristic-based intelligent intersection control could significantly improve the prevailing miserable traffic conditions, the government officials, policy and decision-makers have yet not been convinced to city-wide adoption of traffic control using such methods. Therefore, this study is conducted to assess the applicability and performance of heuristic-based intelligent intersection control to mitigate congestion through a case study in the city Dhahran, Eastern Province, KSA. Meta-heuristics were applied and validated to solve an important real-world traffic control problem. Specifically, GA and DE based demand-responsive traffic control schemes were proposed to optimize delay by rationally adjusting signal timings plan at two isolated signalized intersections. The proposed methods were compared in terms of effectiveness, robustness, and convergence to optimal objective function i.e., minimum delay prediction. Validation results in TRANSYT 7F proved the adequacy and superior performance of both methods compared to existing fixed-time traffic control. Although, from scientific view point this study may seem slightly less innovative, however, we firmly believe that it will likely to have significant societal impact and add value to scientific community in local context. Since, to the best of our knowledge, it is among the very first scientific research on current topic in the region.
The remainder of this paper is organized into different sections as follows. Section 2 provides an overview of related work including: strategies for signalized intersection control, detailed concepts of delay through intersection, and brief summary of previous studies focused on delay optimization. Section 3 describes the study area and data description. Section 4 first introduces basics concepts of GA and DE-based optimization, followed by step-wise procedure of search algorithms, and constraints setting. Section 5 provides results and discussions and validation of proposed methods. Finally, Section 6 presents a brief summary of key findings, study, and outlook for future research.

2. Related Work

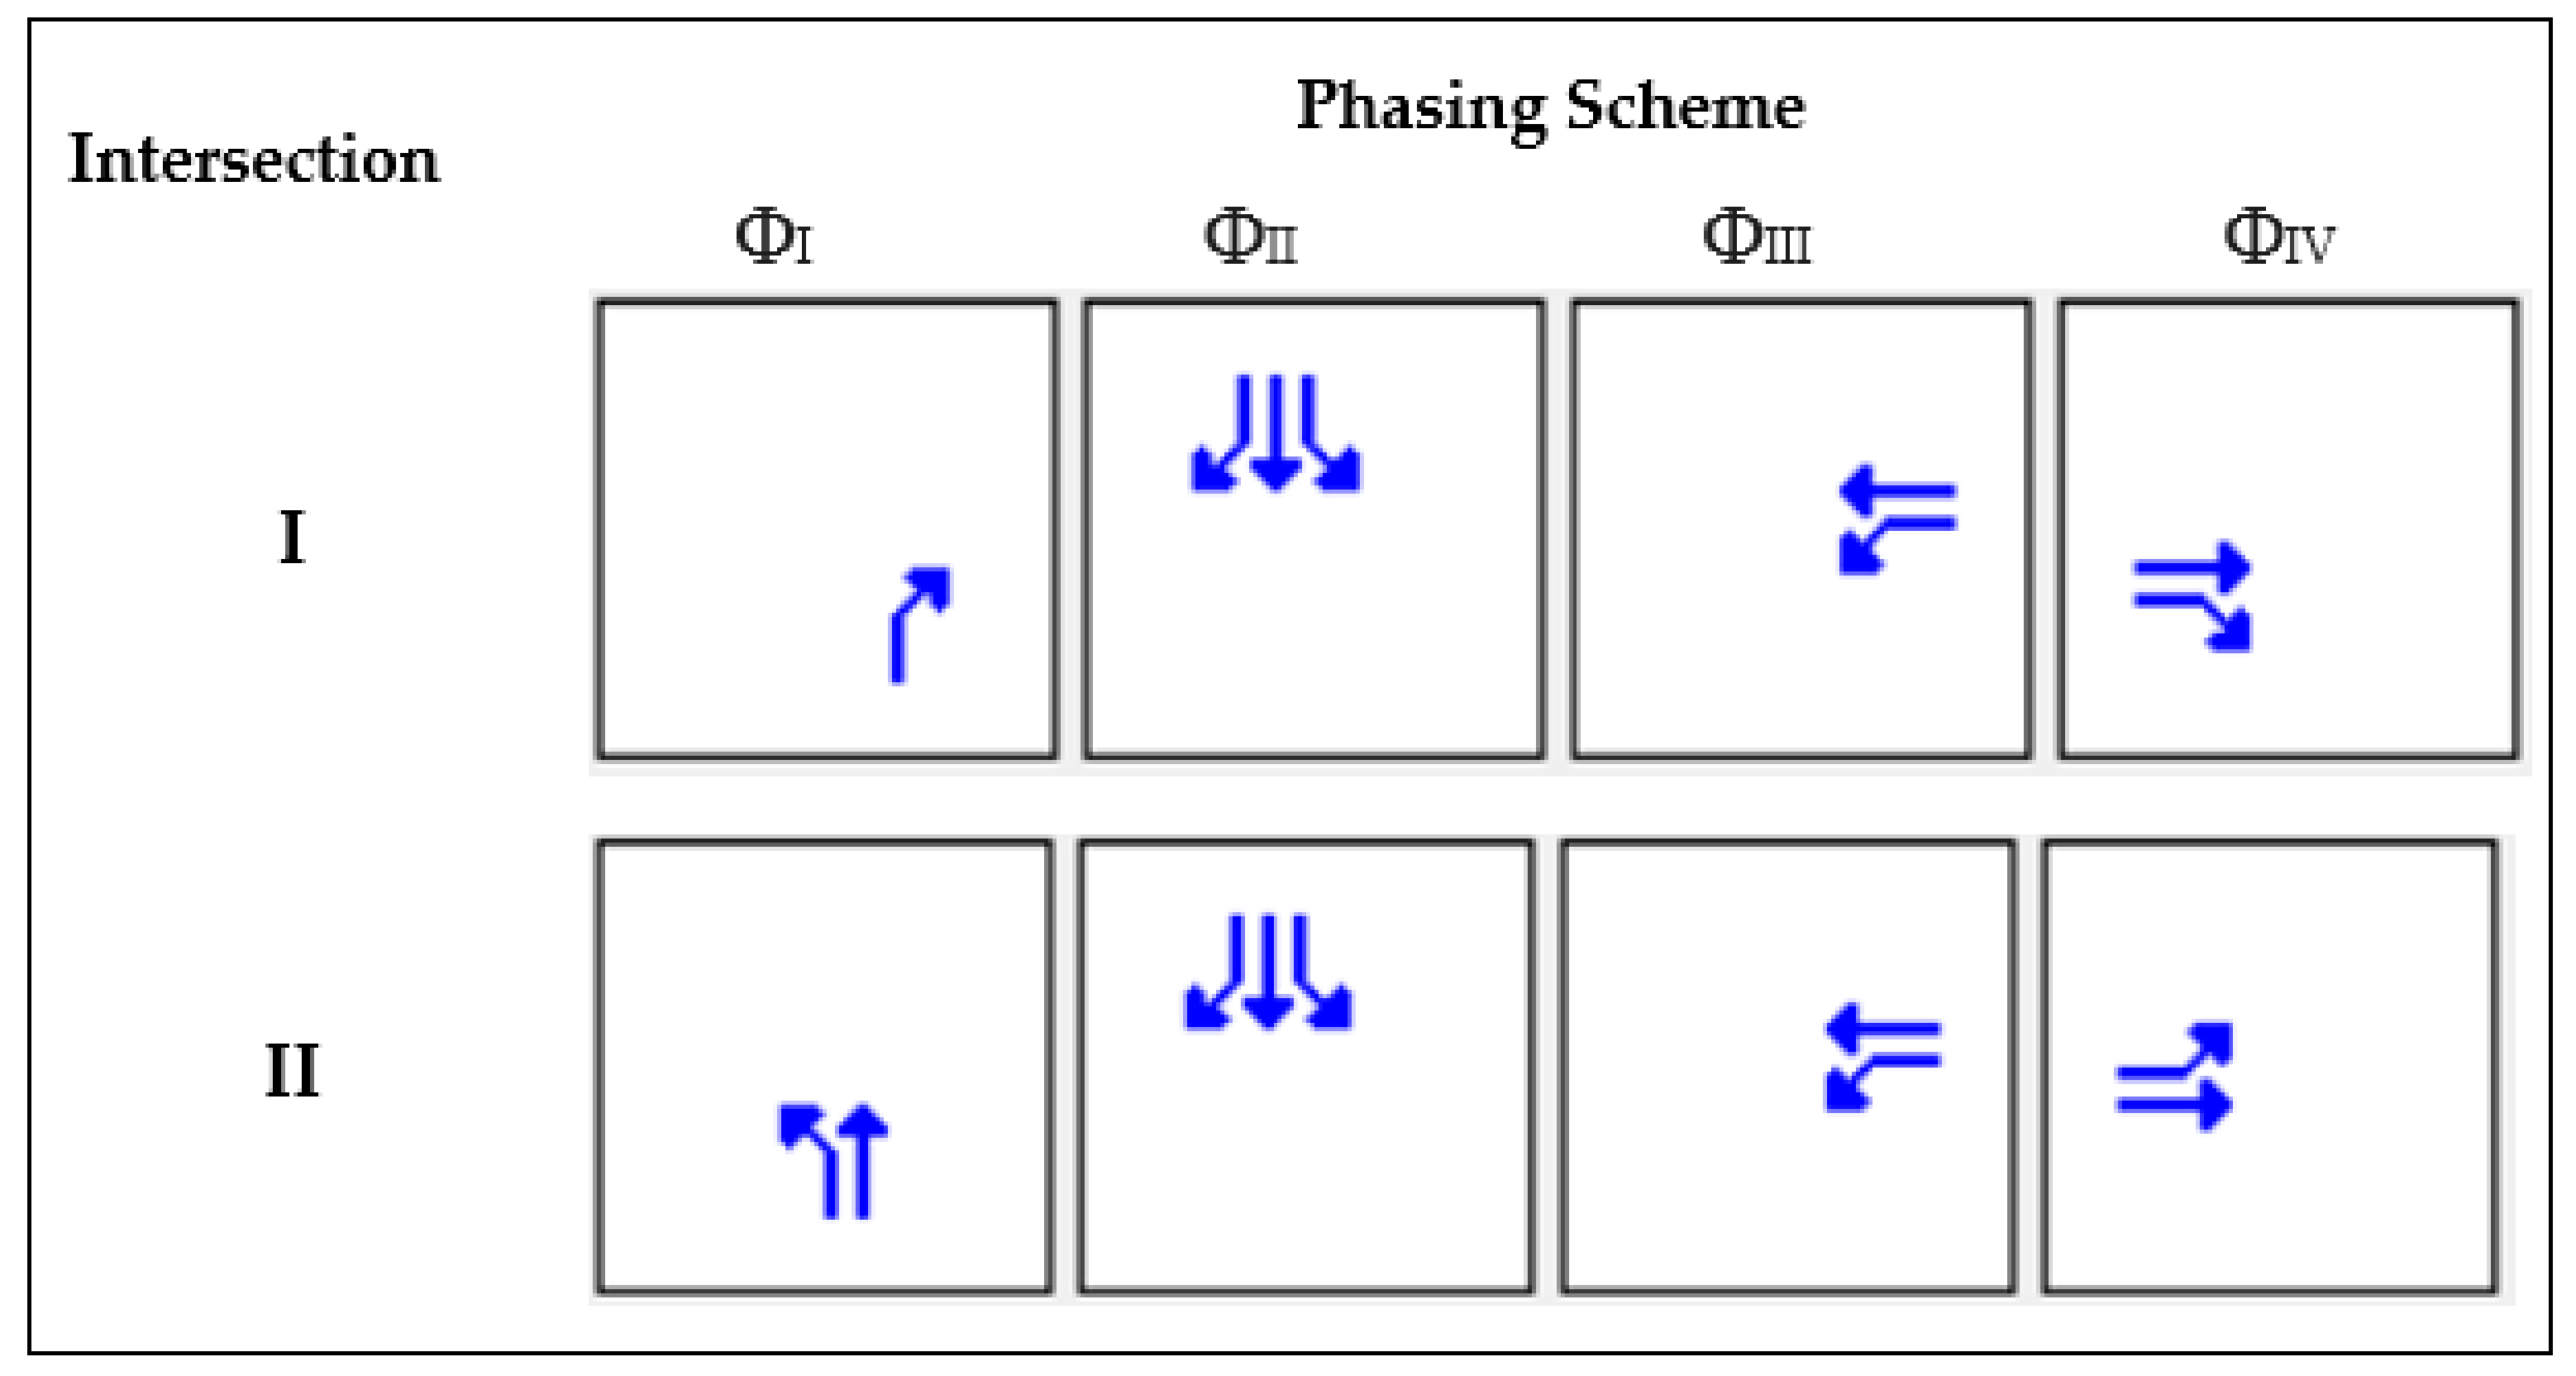
2.1. Signal Control Strategies

Controlling traffic signals at intersections needs a system for managing the duration of different phases of traffic signals in order to decrease the total waiting and total delay, and to maximize the flow efficiently. There are many methods proposed in the existing literature to overcome the problems associated with poor traffic management [34]. For example, a fixed time control method can be applied by using a fixed cycle length and fixed split of the green time duration for all the time plans of the signal. This method is appropriate for signalized intersection with stable and regular traffic arrivals. However, the traffic system is not a fixed system; it is changing from one time period to another, so the fixed traffic signal time method cannot efficiently fit actual dynamic traffic conditions. Real-time traffic-responsive control was introduced to overcome the difficulties of the fixed method [35]. This method uses some sensing technologies that collect the data of traffic at each approach. The concept here is that the traffic signal control managing is based on a specific control strategy according to actual-time traffic data. This method is appropriate and efficient for the conditions where traffic is not stable. In recent years, with advances in vehicle communication technologies, autonomous driving has become very popular for pro-active traffic management [36].

2.2. Delay at Signalized Intersections

Among all the performance measures, delay is most frequently used to evaluate the operational performance of signalized intersections [37]. Intersection level of service (LOS), a criterion used to indicate operating conditions, is established using average delay per vehicle. Beckmann et al. were the pioneers first to present an intersection delay equation based on queuing theory [38]. Webster et al. later on, extended their work to estimate delay and signal timings based on the rational assumption [39]. The assumption made for deriving delay formulae was that queue discharge rate increases until it attains a maximum value (termed as saturation flow rate) when the signal becomes green, and it remains stable until the entire queue is dissipated or the green phase is exhausted. This assumption made it easy to calculate lane group capacity, which is the product green to cycle time ratio (g/C) and the corresponding saturation flow rate. The formulae developed by Webster et al. is given by Equation (1).
d = C ( 1 λ ) 2 2 1 λ x + x 2 2 q 1 x 0.65 ( C q 2 ) 1 3   × x 2 + 5 λ .  
where d is the average delay per vehicle in seconds, C is the cycle length or cycle time, λ is the proportion of cycle length which is effectively green (g/C), x is the degree of saturation, and q is the arrival rate in vehicle per second at the intersection. It may be noted from Equation (1) that total delay is composed of three terms. The first term (d1) is delay due to uniform vehicle arrivals, second term (d2) is the delay component due to random vehicle arrivals. In contrast, the third component (d3) is delay component in oversaturated flow condition, and can reasonably be replaced by 0.9, as suggested by one previous research study [40]. For the undersaturated flow condition, this component can be assumed zero. Webster formula provides delay estimates based on traffic flow phase-related valuation, while Akçelik later proposed movement-related model for delay estimation [41]. The delay equation proposed by Akçelik has been widely used as objective function for signal timing plan optimization is presented below in Equation (2):
D = q C   x   ( 1 u ) 2 2   x   1 y   +   N o x
where D indicate the total delay (sec/veh.), qC is the average number of vehicles arriving per cycle (veh./sec), c is same as λ in Webster formula and represent green-time ratio (g/C), y indicate flow ratio (q/s), s is the saturation flow rate, No is the average overflow queue (number of vehicles waiting to cross the intersection), and x is the degree of saturation. The term No rises continuously till average arrival flow rate descends below capacity, and is predicted for both under-saturated and oversaturated conditions using relation given by Akçelik in his study [41]. After determining the total vehicle delay (D), consequently average vehicle delay was calculated using Equation (3):
d = i = 1 m D i i = 1 m q i )
where d is the average vehicle delay (s/veh.), D is the total delay, q is the arrival flow (veh./s), and m is the total number of lanes at intersection.
Delay can be classified as uniform or random. However, methods based on the random delay concept are more rational and have been adopted by several previous studies [42,43]. Intersection delay can also be classified as stopped delay, approach delay, travel time delay, time in queue delay, and control delay. A stopped time delay may be defined as the time spent in the queue from the instant a vehicle is stopped by signal control and wait to pass through the intersection when the signal is green. Approach delay is the summation of stopped-time delay plus the time lost in deceleration while approaching the intersection and time lost for acceleration to gain the desired speed. A travel time delay may be defined as the difference in drivers’ perceived travel time through an intersection and actual time spent while crossing the intersection. Time in queue delay is the total time lost from the instant a vehicle joins the queue until it clears the stop bar at an intersection. While control delay is the delay caused by either stop sign or traffic signal. These different delay measures may be significantly different from each other depending upon prevailing conditions at the intersection. Figure 1 presents schematic for different delay measures for single vehicles traversing an intersection.

2.3. Previous Studies

During the past few decades, numerous studies have been conducted to address different issues prevailing to traffic signals cycle length. Most of these studies were aimed to minimize the delay at intersections by optimizing cycle length [39,44,45,46,47]. The most popular models used for signal time setting are Australian road research board (ARRB) and transport research laboratory (TRRL) models. The optimum cycle length from TRRL is calculated using the following relation:
c 0 = 1.5 L + 5 1 Y
where; c0 is the optimal cycle length, L is the total lost time at the intersection, and Y is the summation of critical lane flow ratios. The highway capacity manual (HCM) also proposed a cycle length model and corresponding delay model [48]. However, the cycle length from the HCM model is based on expected saturation and thus does not provide a minimum delay. HCM cycle length is given by:
c 0 = L 1 [ m i n C S , R S / R S ] , .  
where 𝐶 is the cycle length (sec); 𝐿 is total lost time per cycle, CS is the summation of the critical phase traffic-volumes (veh. /h); and RS is the reference sum flow rate, and can be found by relation (1710*PHF*fa). PHF in the above relation indicates the peak-hour factor, and fa indicates the area type adjustment factor, and its value is 0.9 for central business district (CBD) and 1.0 otherwise. Researches illustrated that there were some deficiencies in these analytical methods, and some novel algorithms and AI-based techniques should be utilized to solve equations that were proposed for the delay. Most of the existing traffic control schemes deploy fixed time program are based on historical traffic information without considering real-time traffic information [49]. Accurate short-term traffic sate prediction have been reported to have numerous applications for intelligent traffic control [50,51].
Numerous research studies have focused on minimizing delay through signalized intersections by rationally optimizing the cycle length. Studies prior to 2000, mainly concentrated on utilizing linear programming, and fuzzy logic [52,53], because of limited computational efficiency and powerful simulation tools. For example, Yu et al. and Mihaita et al. adopted a nonlinear programming procedure to address the signal timing optimization problem. With advent of advanced artificial intelligence methods and deep learning, researchers in recent years are more inclined to use these methods to mimic and control at signalized intersections. In conventional traffic control paradigm, traffic conditions are influenced by series of sequential actions, thus reinforcement learning (RL) has been widely opted since 1990s. El-Tantawy et al. presented a brief summary of evolution of RL methods for traffic light control during 1997 to 2010 [54]. Recently, several studies have explored the efficiency of RL and DRL for flow optimization through signalized intersections [55,56,57]. Lertworawanich et al. suggested novel methodology to optimize signal timing plan for oversaturated network. Maximum capacity, delay, and overflow at intersection were chosen as optimization objectives. Bargegol et al. proposed a novel method based on the kinematic wave theory to optimize the signal timing plan at the signalized intersection [31]. The study conducted that the proposed algorithm was more efficient in reducing delays and enhance the level of service for signalized intersections. Some of the widely used approaches for multi-objective signal timing optimization are; GA, simulated annealing (SA), and DE.
Recently, GA and ACO (ant colony optimization) have been investigated in several previous studies to optimize cycle length and other traffic performance measures [58,59,60,61]. Foy et al. used GA to identify minimum delay estimates by optimizing the cycle length under multiple scenarios [62]. Five GA traffic runs were executed for 60 GA generations with different initial populations. The authors found that the population was converging to optimum fitness between 20th to 30th generations. The average minimum waiting time found was around 40 s. It was concluded that GA could produce a rational traffic signal timing plan, and it can enhance existing traffic control techniques. Similarly, for optimizing traffic performance of real-time traffic signal control, Singh et al. used GA. Traffic emulator in JAVA was generated to represent dynamic traffic conditions. The traffic emulator was programmed to perform surveillance periodically at fixed intervals, and send the output data to GA, which provided green time extensions for each phase and optimized cycle length. Factors considered for GA were weights assigned to each road, total stops at each incoming lane, fixed cycle timings, and fixed maximum and minimum green timings. Their results showed that system application appeared to very useful. Under the given constraints, the developed model was shown to perform better than conventional fixed timed signals. Rahbari et al. in their study, attempted to reduce traffic congestion using GA [63]. The researchers developed binary-coded GA for a specified initial population, followed by the generation of a new population through mutation and cross-over, and finally, members with optimal fitness values were selected as a solution set. Putha et al. solved traffic signals coordination problem in oversaturated network by utilizing ACO [64]. ACO is based on swarm intelligence. The researchers found that ACO provide more reliable solutions compared to GA, particularly at large number of trials. Renfrew and Yu also proposed ACO to reduce vehicle waiting time at signalized intersection [60]. ACO outperformed fully actuated control signal, particularly under high traffic demand.
DE and AIS (artificial immune system) are some other heuristic search optimization techniques that have been recently used successfully for traffic engineering applications [65,66,67,68,69]. AIS is inspired by human biological immune system. Liu et al. proposed a bacterial foraging optimization (BFO) algorithm based on DE to obtain optimized estimates of delay at signalized intersections [70]. The competition and collaboration formed the basis for optimization in BFO. DE was used to update the bacteria located in the chemotax process to enhance convergence precision. The authors found that delay estimates from DE-based BFO were reduced by 28.3% from fixed time signals and 5.6% from GA delay values. DEBFO was also found to converge faster than GA, and its results were validated. Korkmaz et al. studied three types of differential evolution delay estimation models (DEDEM): linear, exponential, and quadratic [67]. Their results showed that the quadratic model yielded robust outcomes. The researchers further found that proposed DEDEM was capable of predicting the vehicle delay more closely in terms of relative errors between simulated and estimated values. It was concluded that the quadratic form of the DEDEM model can be used as an alternative estimation model for the delay. Ceylan also applied the DE algorithm for the optimal design of signal-controlled road intersections [71]. Results from his study showed that the DE is better than GA and Harmony-Search (HS)-based models in terms of the network performance. Yunrui also examined traffic signal control with DE. The authors found that the DE was more efficient to decide system parameters, and had a good model performance in terms of reduction of the delay and the queue length [72]. Louati et al. utilized immune network algorithm (INA) to optimize delay, queue, and throughput at signalized intersections under different traffic scenarios [69]. The authors found that proposed INA outperform conventional pre-timed and adaptive traffic control, and validated the results on microscopic traffic simulation platform VISSIM. Trabelsi et al. also investigated the performance of AIS for detecting and controlling the anomalous traffic conditions at signalized intersections [73]. Simulation results demonstrated the pertinence and robustness of proposed AIS approach.

3. Study Area and Data Description

The data utilized in this study were collected from two signalized intersections in the city of Dhahran, Eastern Province, KSA. The province has witnessed a rapid increase in motorization since the oil boom in early 1970, particularly during recent years, with the number of registered motor vehicles increasing from 2.9 million in 2011 to 5.2 million in 2017 [74]. The city of Dhahran has an area of about 100 km2, with a total population of approximately 0.3 million [75]. A significant proportion of the city’s population is dominated by expatriates belonging to diverse driving and ethnic, cultural backgrounds producing heterogeneous road user populations. The city hosts Saudi ARAMCO (Arabian American Oil Company, the world’s largest oil processing facility), academic institutions, and commercial activities, which are the primary sources of traffic productions/attractions in the area.
Intersection-I is located at the junction of Faisal Bin Fahd road and Dhahran Techno Valley road near the US consulate, while Intersection-II is stationed at the junction of Faisal Bin Fahd road with King Saud road (as shown in Figure 2). Both the intersections are located in mixed residential and commercial zones. In addition, both are four-leg intersections having at least two lanes from each approach. Traffic flow at these intersections is controlled and regulated by fixed/pre-timed signals. Two types of data were mainly acquired i.e., traffic volume data and signals cycle lengths, green splits, including the phasing sequence. Standard sated procedures were opted in collecting the field data. Traffic volume data were collected manually using a mechanical counting board for two hours during evening peak periods from 3:30 pm to 5:30 pm. Signal control data for both intersections were also collected manually. Cycle length for Intersection-I was 220 s, while Intersection-II had a cycle length of 160 s. Besides, traffic volume and phasing, data on vehicle queues and saturation flow was also collected. Figure 3 show the phasing scheme of traffic movements at both intersections in the study area. Intersections traffic and signal control data collected from the field is shown in Table 1. Average vehicle delay was 102.5 and 86.5 (s/veh.) for Intersection I and II respectively in existing condition, both of which correspond to congested regime conditions.

4. Methodology

The word “optimization” came from the same root “optimal” which indicate best. Thus, optimization may be defined as the process of achieving the best possible solution under given constraints. A typical optimization problem can be mathematically formulated as:
m i n i m i z e / m a x i m i z e f x   s u b j e c t   t o g   i x   0 ; i   =   1 , 2 , 3 , n   h   i x = 0 ; i   =   1 , 2 , 3 , n .  
where f(x) is the output/objective function to be optimized, gi(x) denote set of inequality constraints, hi(x) represent equality constraints. Constraints are limits within which the variables may be varied. The variables x1, x2, x3…., xn € Rn (solution space) are the control or decision variables. By convention, optimization means a minimization problem, however it can also be designed as maximization problem by negating the sign of objective function. Optimization problem given above could be considered as decision problem that involves finding the best vector x of all control variables from the solution space.
In this study GA and DE optimization techniques were employed to minimize the average vehicle delay (objective function) through isolated signalized intersections as a function of several input variables (i.e., traffic demand, existing phasing scheme, g/C ratio, saturation flow etc.), and constraints conditions (cycle length and individual green splits). Green splits in each phase (g1, g2, g3, and g4) were decision or control variables. The primary objective was to minimize average vehicle delay in response to approaching traffic demand by selecting best possible combinations of signal timings plan. GA and DE optimization program for current study were developed on MATLAB interface (version R2018b). The following sections provide a brief summary of architecture and working principle of both algorithms, step-wise respective algorithms procedures for current optimization problem, and constraints conditions for obtaining optimized objective function.

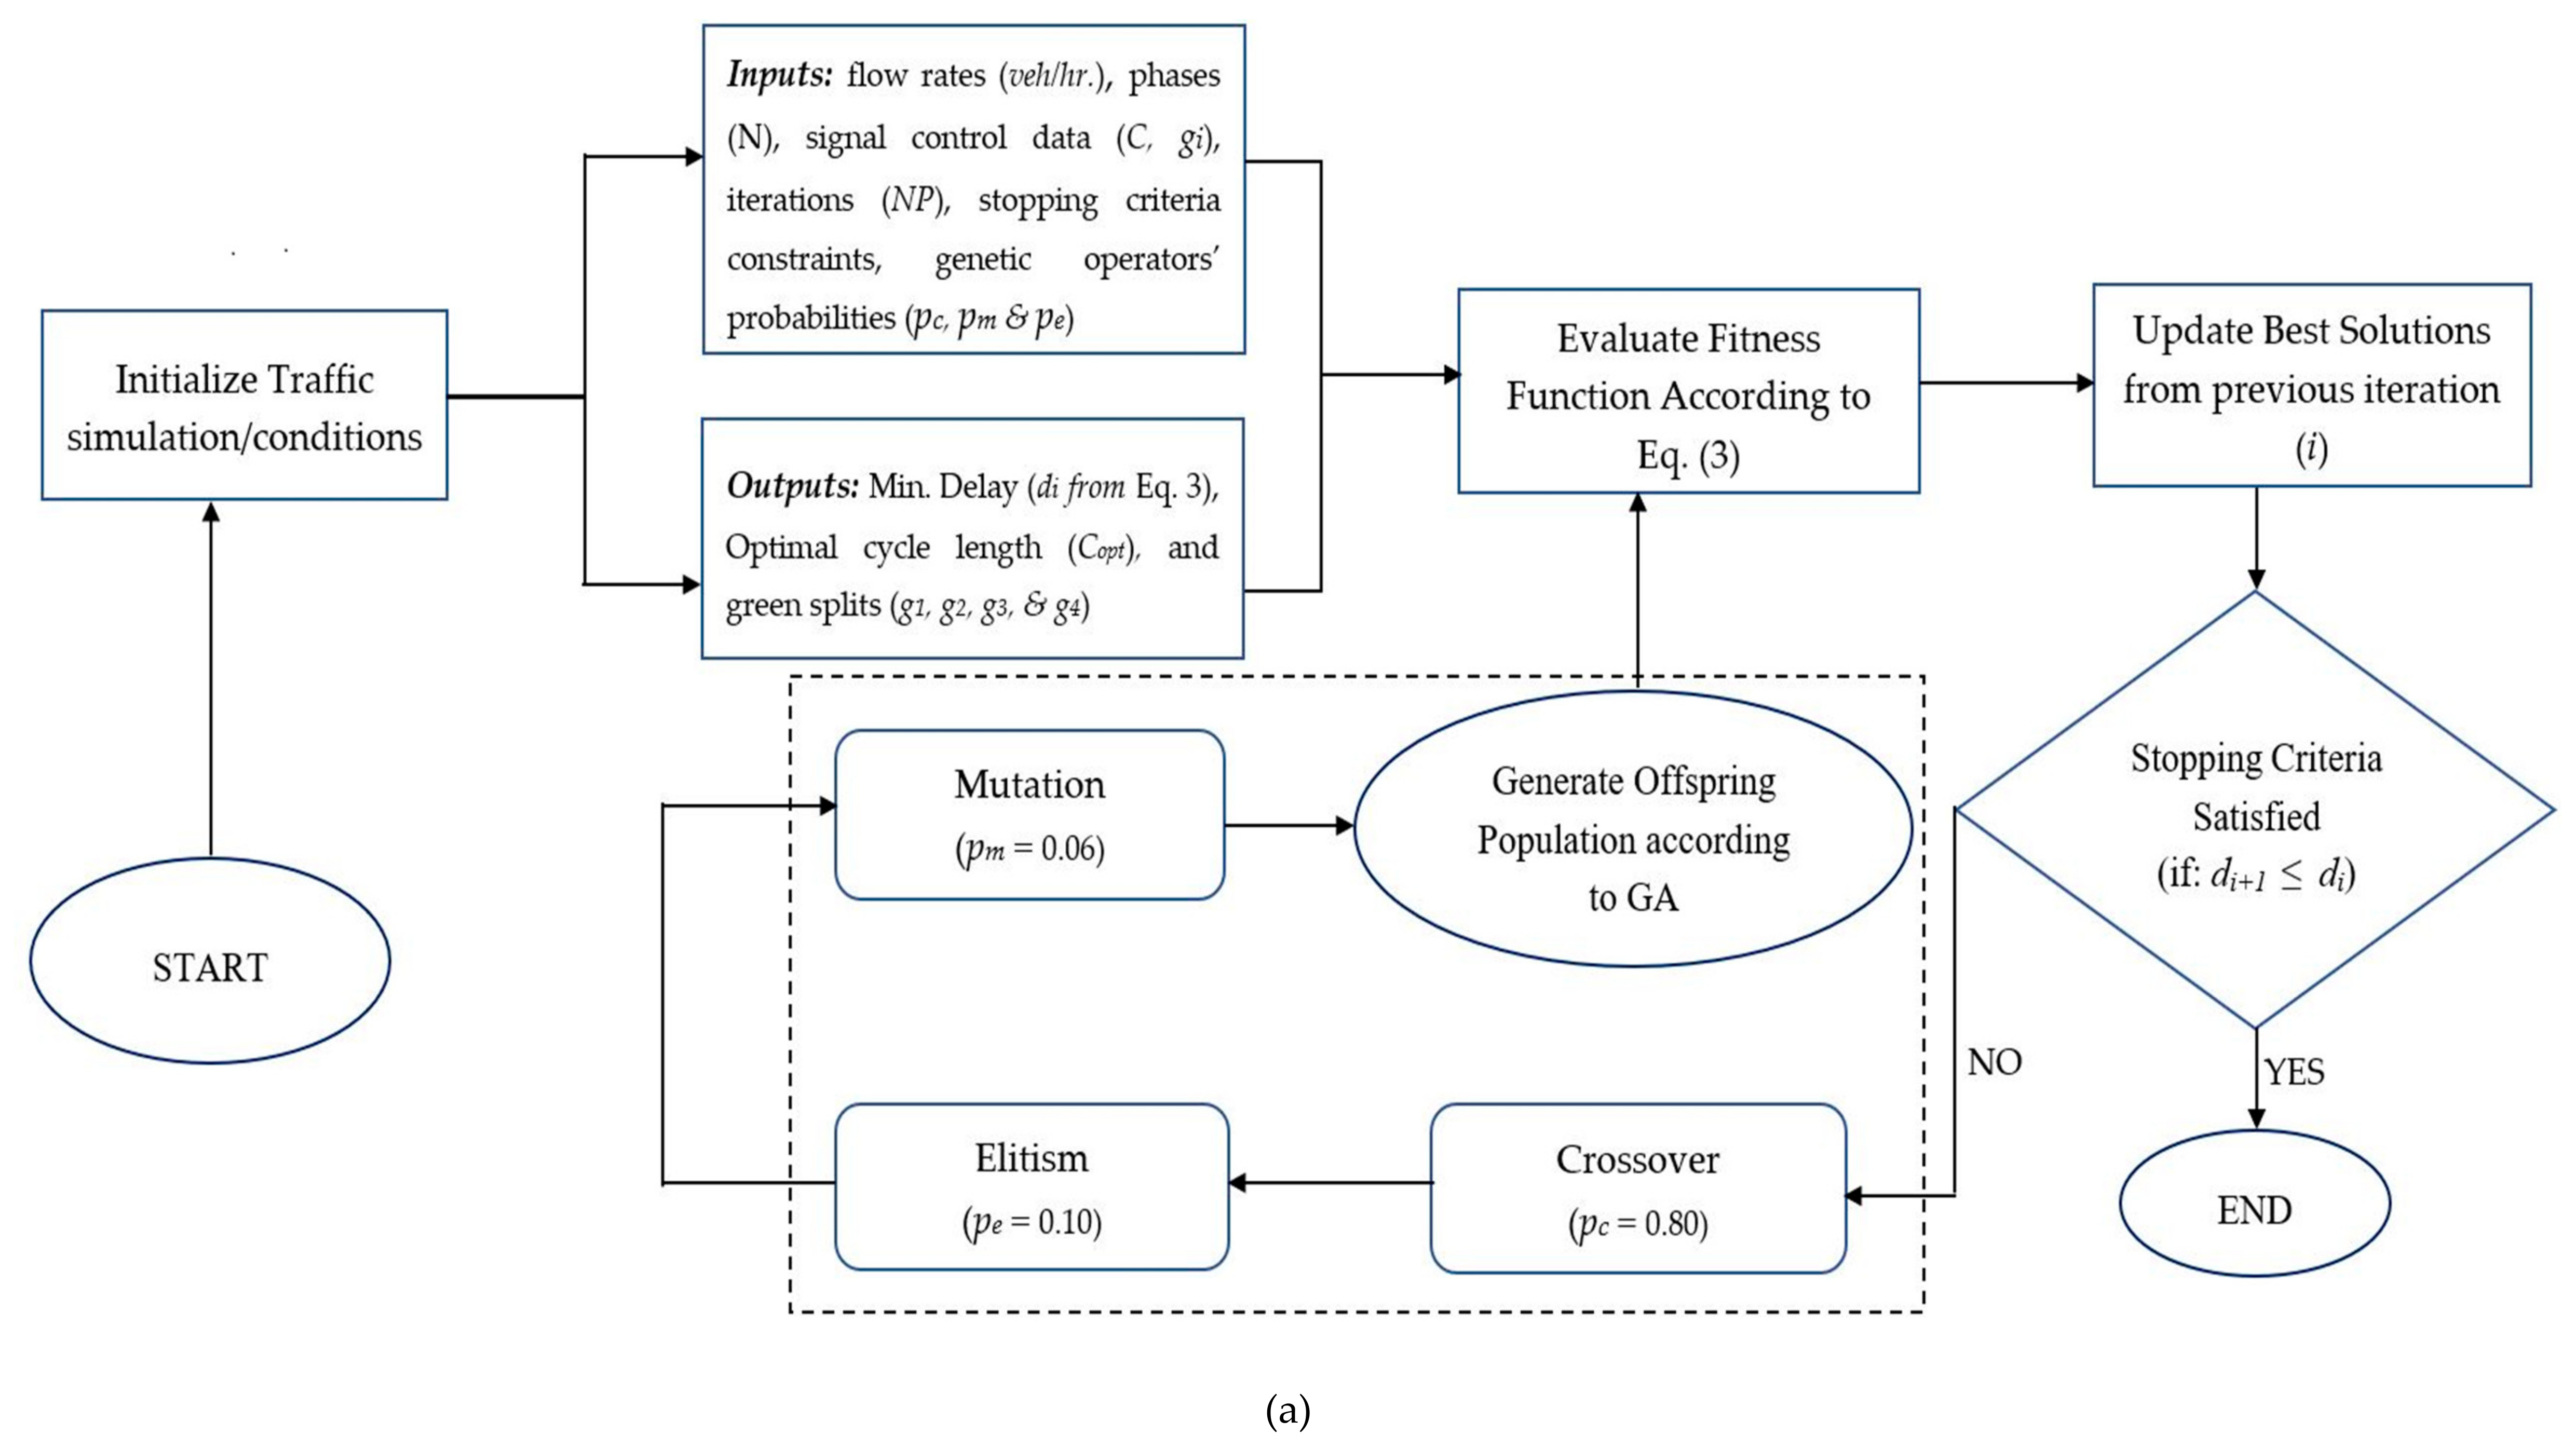
4.1. Genetic Algorithm (GA)

GA is a robust machine learning search method that is based on the process of natural selection for finding the optimal solution of the objective function [76]. A random population of solutions is initialized, which converges to a nearly optimal solution over a set of iterations or generations. The intrinsic characteristics of GA to mimic nature’s evolutionary theory is based on “survival of fittest,” [77]. In GA algorithm and other search optimization methods, the solution of the problem is stored by genes or chromosomes or genes in a population. While the population indicates the boundary or area of interest within which the number of genes or chromosomes can be determined. Fitness function is the rule of GA to select the gene with a fit solution. Every solution in the process is screened by the fitness function to calculate the fitness of the gene. The fitness of genes so obtained is then used for a relative ranking process that lists the genes according to their fitness. Ranking of genes allows the algorithm to select the best individual for next stage iteration by eliminating the genes having unfit solutions [78]. The population of genes in offspring is maintained the same as the parent population during reproduction. Transition to the next population generation may utilize either random selection or tournament selection procedure. In random selection, individual genes have equal chances of selection with no reference to fitness at all. While for the tournament, a group of “n” individual genes are first randomly selected to take part in a tournament, with genes having the best fitness values continued to preceding generation [79]. Next iteration offspring population is generated through the application of evolutionary operators such as cross-over, mutation, and elitism. The objective of these evolutionary operators is to ensure a better solution to the next population generation. The evolutionary operators are alternatively applied until the stopping criterion is satisfied.

4.2. Differential Evolution (DE)

Differential evolution (DE), like GA, is a population-based optimization evolutionary algorithm characterized by its simplicity, robustness, and fast convergence to the objective function. In recent years, DE has been successfully used for signalized intersection management [66,80]. DE is capable of solving non-differentiable and non-linear optimization problems more efficiently [81]. The search mechanism of DE algorithm is reinforced by a differential mutation operator, which utilizes vectors difference generated by the set of vectors of the original parent population. The resulting vector difference is combined with a randomly selected new individual to yield a new mutant population. This new mutant population is recombined with the individual from the parent population producing a new offspring population. The fitness function evaluates each solution from offspring and corresponding parent solutions, and the best solutions are carried to the next generation. There are several selection variants DE optimization algorithm [82]. However, widely used in existing literature are: DE/Rand; which represent traditional DE version that is based on base vector random selection with uniform probability; and DE/Best; that select base vector of best individuals for the next-generation population. In general, the production of successive offspring population from the parent population is achieved through the application of the same genetic operators i.e., cross-over, mutation, and elitism, just like in GA. Similarly, the process is repeated until either of the stopping criteria is reached.

4.3. Algorithm Procedure and Parmeters Setting

In general, a typical GA and DE follows a sequence of decisions summarized in the following steps. Figure 4 shows the schematic flowchart for the sequential decisions faced during the execution of both algorithms molded in terms of current optimization problem.
Step 1—Problem Encoding: It is the process of representing a solution in the form of bits that communicate essential information. Each bit in the string indicates characteristics of the solution just like each gene-associated chromosome control particular characteristic of an individual. Binary encoding is mostly used as the encoding method. Other encoding methods that have been used include, permutation encoding and value encoding.
Step 2—Initialization/Generation of Initial Population: It refers to the random generation of a population of potential/candidate individuals that belong to the solution of the optimization problem.
Step 3—Evaluation of Fitness Function: Individual candidate solutions are decoded and evaluated based on pre-defined quality criteria, commonly referred to as fitness or objective function.
Step 4—Selection for reproduction: These candidate solutions are then ranked according to their fitness values, and prepared for an application of evolutionary operators for next stage iteration.
Step 5—Cross-over: It is a genetic operator that varies programming of parent chromosomes aiming to improve the solution quality of the offspring population. It is a form of sexual reproduction with two strings randomly picked from the mating pool to yield superior offspring. Cross-over could be done single point or multiple points to identify points for the exchange of genetic materials at these points.
Step 6—Mutation: It is again a genetic operator inspired by a biological mutation that maintains genetic diversity from one population to the next. Mutation represents a small random tweak or distortion in parent chromosomes with a very low probability to diversify the search in global space. Mutation could be done through different approaches, such as bit-flip, random resetting, scramble, and inversion mutation methods.
Step 7—Elitism: It represents a genetic operator that copies a small proportion parent chromosome having the best fit value to next-generation, thus ensuring maximum fitness value does not drop from one iteration to the next.
Step 8—Testing for stopping criterion: Once a new generation is produced, the global best is updated. This criterion then decides on the termination of the algorithm. If convergence to objective function at a fixed number of generations/iterations is satisfied, otherwise, the procedure is repeated from step 3 onward.
Table 2 summarizes the sequential stages of GA and DE algorithms along with values for individual parameters used in this study. Values for different parameters for both algorithms were kept the same to avoid any bias while comparing optimized delay estimates from both methods. It is worth to note, that value for parameters “selection parameters and alpha (α)” are not shown for DE since it does not require these parameters. Table 3 presents optimization objective functions, control/decision variables, and constraints. The constraint limits were deemed desirable and recommended by a previous research study [66].

5. Results and Discussions

5.1. Convergence of GA and DE

Figure 5 plots convergence to minimum objective function for GA and DE against number of generation/iterations. The objective function represents the minimum average vehicle delay (given in units of s/veh.) through the intersection. To comply with the central limit theorem, the convergence curves shown in Figure 5 indicate the mean rating of the best candidate solutions in the population at each iteration for 30 executions set for both algorithms [82]. Analyzing the convergence pattern from the plots (Figure 5), it is worth to note that both the curves converge rapidly to smaller and smaller values of the objective function. Both the curves become flat onwards after the objective function reaches a steady value as the number of iterations is increased. It can be observed from the plots that DE converges much faster than GA. However, GA solution quality from GA is slightly better as both the algorithms ultimately proceed to complete the fixed number of iterations. The fact that DE outperforms GA in terms of convergence to fitness function is consistent with several previous studies [83,84]. For Intersection-I (shown in Figure 5a), DE graph converged to objective function value of 78.6 at about 80 population generations, while GA reached a minimum objective function value of 64.3 at nearly 150 iterations. Similarly, for Intersection-II (Figure 5b), it may be noted that again DE convergence is much faster (60 population generations) compared to GA (200 population generations) to the minimum objective function. The minimum function fitness value for this case was 55.9 using GA and 72.8 with DE. Further, the MATLAB program/code execution took an average between 0.25 to 0.40 s and 0.8 to 1 s for DE and GA, respectively.

5.2. Optimization of Cycle Length and Green Splits

Table 4 presents optimized signal cycle lengths and corresponding green splits for each bound. Green splits were the input decision variables for both algorithms and were programmed and controlled to have values between 8 to 45 s, as recommended by a previous study [66]. The objective was to select the best possible combination of green splits in response approaching traffic volume to minimize the objective function i.e., average vehicle delay at the intersection. It may be noted from Table 4 that the optimized green splits distribution from both GA and DE are intuitively based on the proportion of traffic volume from the respective approach. Intersection clearance interval consisting of “yellow and all red” was the same from existing conditions to ensure safety and smooth operations at intersections. There was a 15 to 42% reduction in green splits from an existing pashing scheme using GA for both intersections, whereas DE yielded percent difference ranging between 26 to 52%. Although percent decrease in individual green splits was more pronounced from DE, overall, reduction in average vehicle delay was less compared to GA.

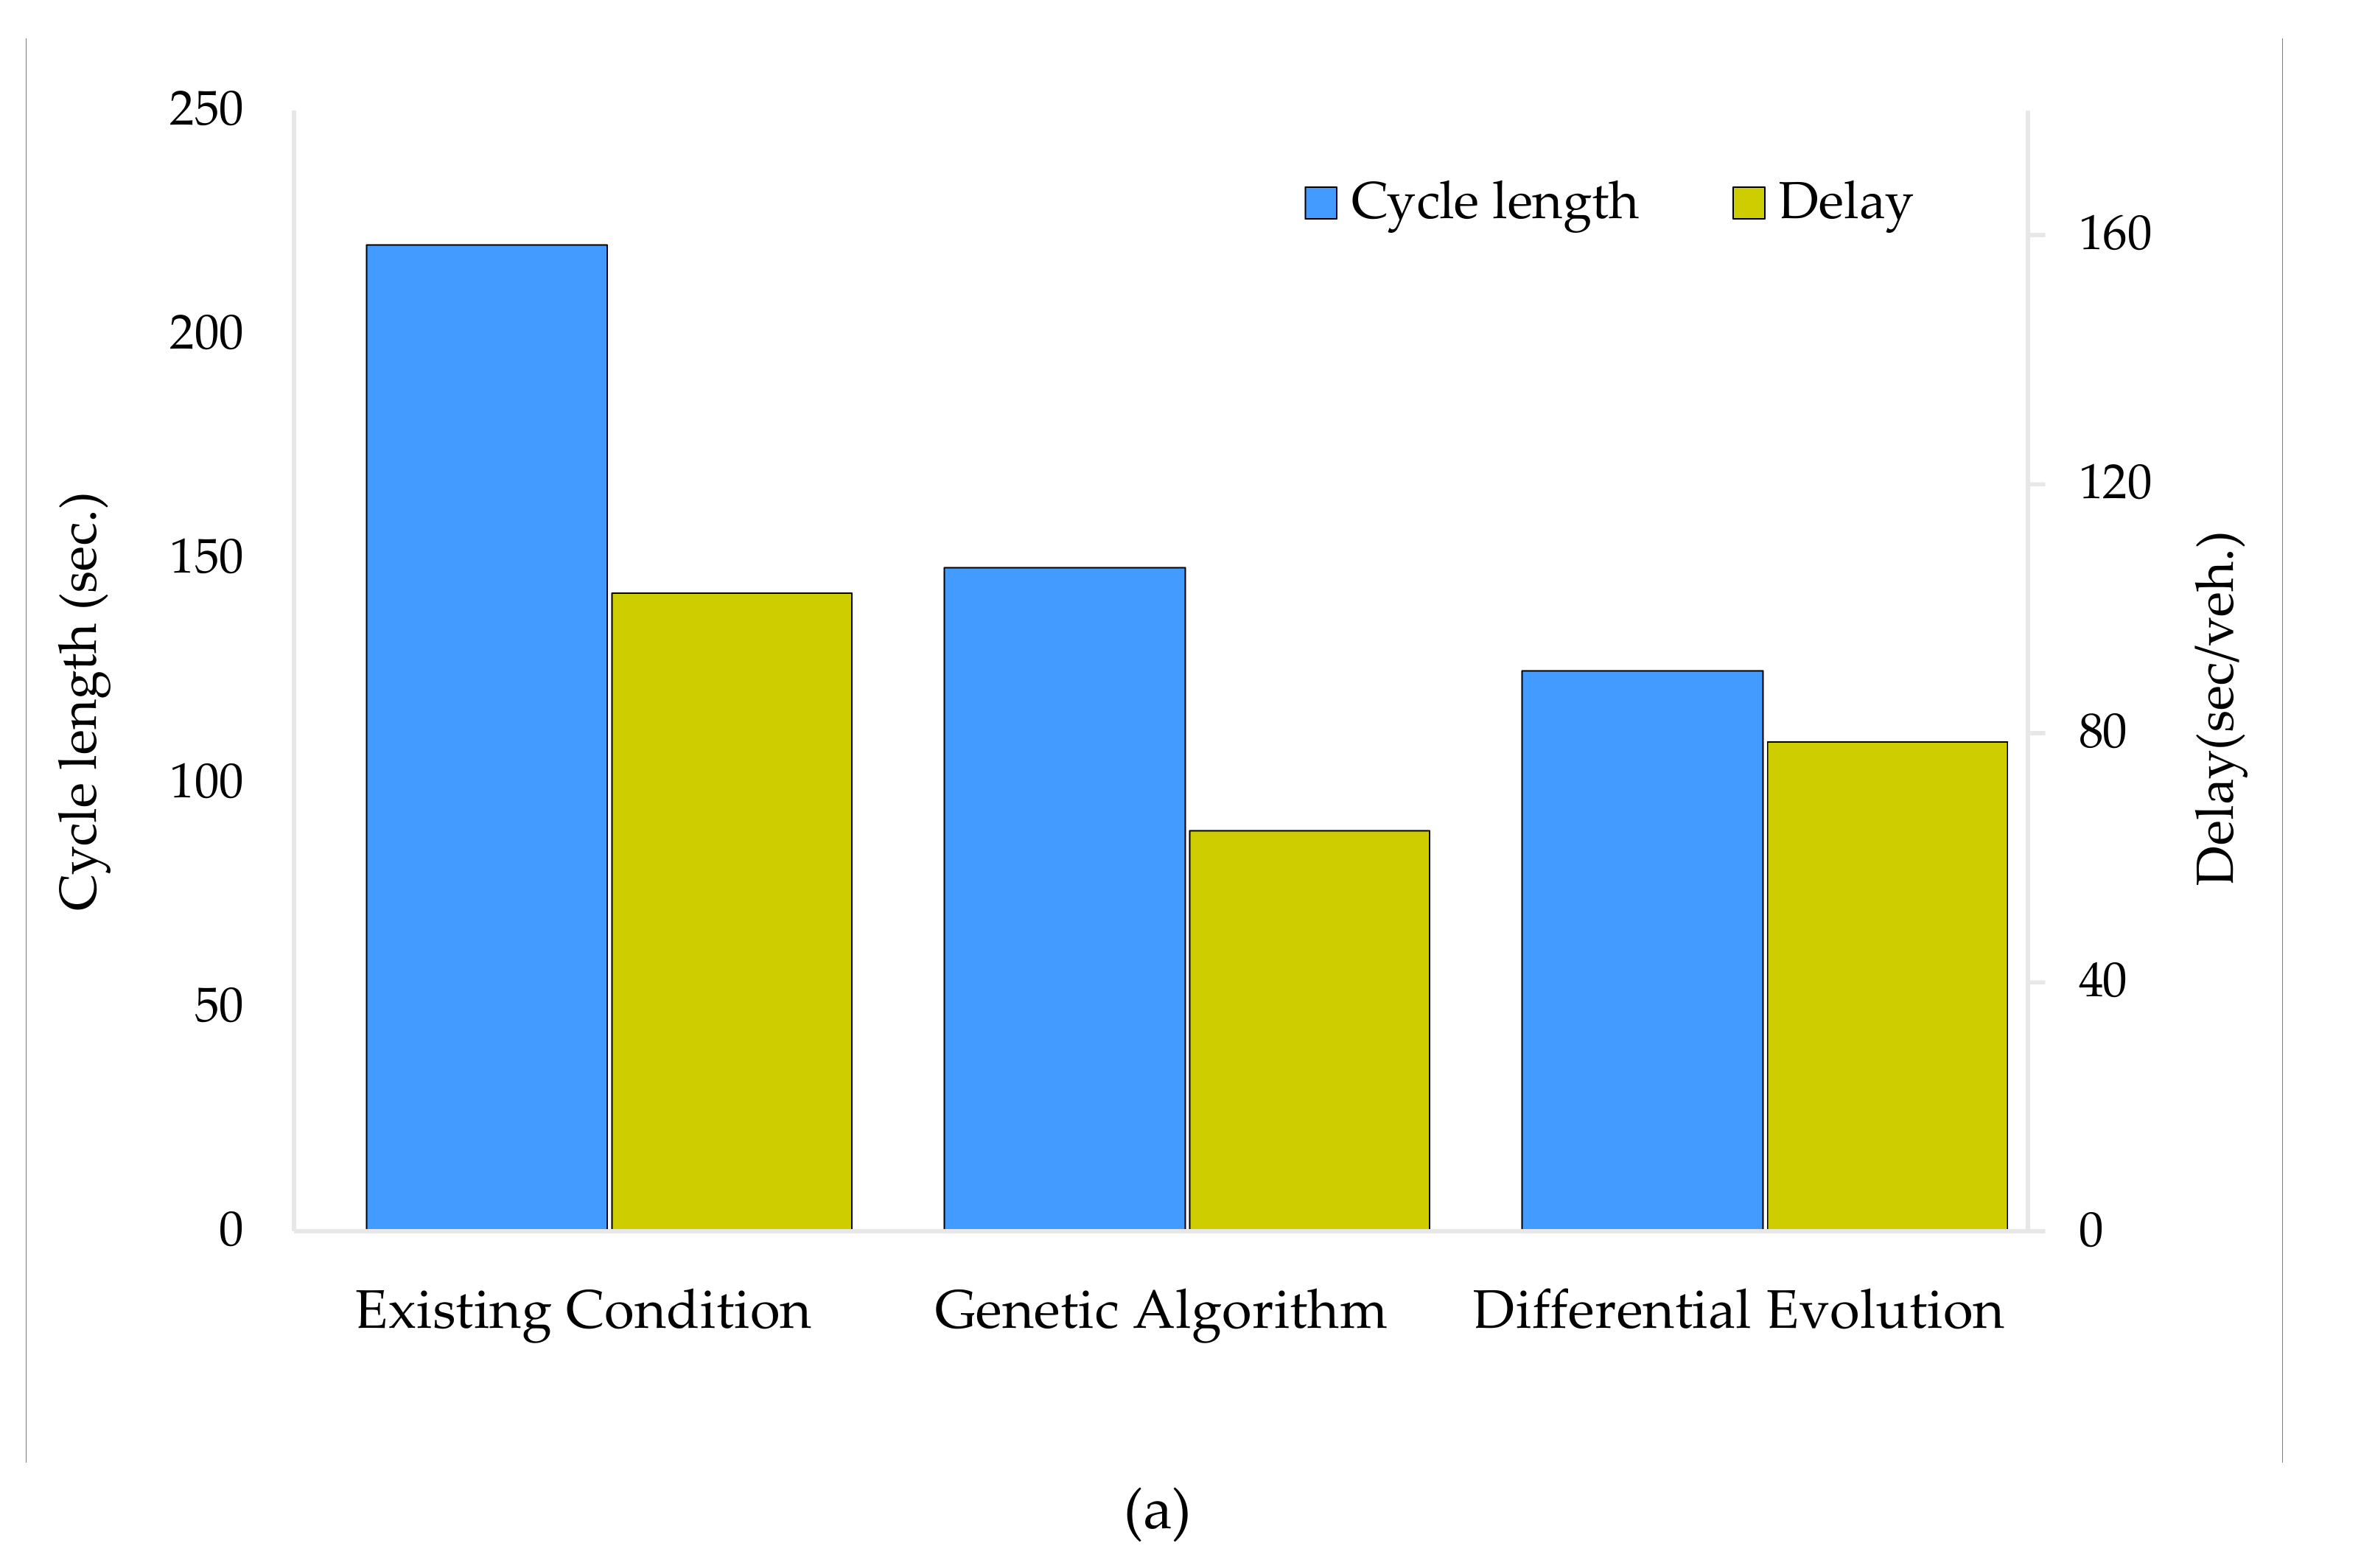
5.3. Delay Comparsion with Existing Condition

Figure 6 provides a comparison of average vehicle delay for existing conditions as well as the optimum delay estimates obtained from GA and DE at both intersections. Intersection-I had an existing cycle length of hefty 220 s with corresponding average vehicle delay through intersection being 102.5 s/veh. Signal control at this intersection is very poorly designed, and during rush hours, vehicles have to wait in long queues waiting to pass the intersection. Unless some preventive measures are adopted, in the near future, it is likely that the current prevailing level of service (LOS) D and E operating conditions could rapidly turn to breakdown LOS conditions, particularly during peak periods. This will cause chaos in the vicinity of the intersection. Optimization using GA estimated a cycle length of 148, having a reasonable average delay value of 64.3 s. While DE yielded an optimized signal cycle length of 125 s for Intersection-I with slightly high average vehicle delay value of about 78 s. Intersection-II had slightly better operating conditions having an existing cycle length of 160 s and associated delay of 86.5 s/veh. Again, reduction in optimized cycle length from DE (92 s) was more pronounced compared to GA (105 s). However, GA was found more efficient and robust, yielding significantly low estimates for optimum/minimum delay (55.9 s/veh.) than DE (72.8 s/veh.) algorithm.
Table 5 presents the percentage reduction in cycle length and average vehicle delay for GA and DE algorithms. Optimized cycle length from GA was approximately 32% of existing cycle length at Intersection-I and about 34% of original cycle length at Intersection-II. DE, on the other hand, provided a cycle length reduction of a little over 40% for both intersections. Comparing the percent reduction in average vehicle delay, GA was capable of achieving a decrease of approximately 37% and 35% at Intersection-I and Intersection-II, respectively. While using DE, average vehicle delay was reduced by 23% at Intersection-I, and around 16% at Intersection-II.

5.4. Methods Validation

To assess the performance, and validate the adequacy and of proposed methods (GA and DE), TRANSYT 7F was used. TRNASYT 7F is the state-of-the-art macroscopic, deterministic simulation and optimization software tool, widely used for the analysis of signalized intersections. The software offers detailed information on various measures of effectiveness (MOEs) for signalized intersection like total vehicle delay, average delay, emissions, number of stops, etc. In TRANSYT 7F, a step-wise multi-cycle hill-climbing search optimization approach was employed to find global optimum in solution space. Figure 7 plots average vehicle delay as a function of cycle length for GA, DE, and using TRANSYT 7F. The relationship plotted in Figure 7 is well-intuitive since a traffic light with shorter cycle length in unable to provide desired green splits on individual approaches to clear entire vehicle queues in a single cycle. Thus, the resulting average vehicle delay increases. In contrast, an excessively large cycle length provides relatively longer green splits for one or all approaches, which again increases average delay for vehicles waiting idly in queues in other directions. This general pattern of cycle length vs. delay is consistent with previous studies [85,86]. Figure 7a,b present cycle lengths vs. average vehicle relationship for Intersection-I and Intersection-II, respectively. It is evident (from Figure 7) that GA and TRANSYT 7F curves closely follow a similar pattern of relationship, while the cycle length-delay curve for DE is slightly off. To be specific, GA provides a minimum delay of 64.3 (s/veh.) at an optimized cycle length of 148 s for Intersection-I, whereas TRANSYT 7F offers a minimum delay of 68.5 (s/veh.) that correspond to cycle length of 164 s. However, DE curve indicates a delay of 78.6 (s/veh.) for a relatively shorter optimized cycle length of 125 s. Similarly, for Intersection-II, the optimum delay values are 55.9 (s/veh.) associated with a cycle length of 125 s, and 65.1 (s/veh.) corresponding with a cycle length of 120 s for GA and TRANSYT 7F respectively. While delay estimate for DE has a comparatively high value of 72.8 corresponding to cycle length of approximately 90 s for Intersection-II.
It is evident from the above discussion and results in Figure 7 that both GA and DE algorithms are powerful tools for the analysis of signalized intersections. Simulation and optimization results from TRANSYT further reinforce and demonstrate the robustness of the proposed methods. Although GA and TRNASYT 7F have a very similar pattern of cycle length-delay relationship, however, global optimum (minimum) delay estimates obtained GA among all scenarios.

6. Conclusions and Outlook

This study aimed to optimize delay and achieve intelligent traffic control at isolated signalized intersections through application of meta-heuristic search optimization methods. A critical analysis of existing literature on the specific topic revealed that most of these studies have focused on lane-based homogenous traffic conditions. However, real-time traffic is usually heterogeneous, having non-linear, stochastic, and intricate characteristics. Thus, we proposed a couple of meta-heuristic-based including GA and DE methods for efficient traffic control at signalized intersections. Traffic volume and phasing scheme data were collected for two isolated signalized intersections in the study area, the city of Dhahran, KSA. Average vehicle delay through the intersection was chosen as the primary performance index. Optimum delay estimated were obtained by optimizing the signal timing plan (cycle length and corresponding green splits) in response to existing traffic demand. Both GA and DE yielded rational signal timing plans. The results indicated that both methods effectively reduced the average travel time delay ranging from 15 to 35% compared to existing conditions. Although DE converged much faster to the objective function, GA slightly outperforms DE in terms of solution quality i.e., minimum delay value. To assess the validity of proposed methods, cycle length and delay curves were compared with outputs from state-of-the-art signals traffic simulation and optimization package, TRANSYT 7F. Validation results demonstrated the adequacy of the proposed methods. Again, the average adaptive traffic signal timings from GA follow optimized outputs timings from TRANSYT 7F more closely. To conclude, findings from the current study suggest that traffic control at signalized intersections should be based on adaptive heuristics approaches rather than conventional fixed and actuated signals to ensure more efficient and sustainable operations.
The findings of this study could serve as essential guidance for policy and decision-makers, and other concerned, particularly in the study area to initiate concrete steps to improve the miserable traffic situations. This study could be extended in the future from various perspectives. Recently network optimizations have become very popular, so future studies could focus on network-wide optimization problems. Further, the current study did not consider the impact on non-motorized modes, which would be interesting to explore in the forthcoming studies. Lastly, studies could utilize multi-objective heuristic modeling to concurrently consider different performance measures such as number of stops, energy consumption, and emissions.

Author Contributions

Conceptualization, A.J. and M.T.R.; methodology, A.J. and I.U.; software, A.J. and M.Z.; validation, A.J., M.T.R., and M.Z.; formal analysis, A.J. and H.M.A.-A.; investigation, A.J. and M.T.R.; resources, H.M.A.-A. and M.T.R.; data curation, A.J. and I.U.; writing—original draft preparation, A.J.; writing—review and editing, M.T.R. and M.Z.; visualization, A.J. and I.U.; supervision, H.M.A.-A. and M.T.R.; project administration, M.T.R. All authors have read and agreed to the published version of the manuscript.

Funding

APC for the article were funded by the Deanship of Scientific Research (DSR), King Fahd University of Petroleum & Minerals (KFUPM), Saudi Arabia.

Acknowledgments

The authors appreciate and acknowledge the support provided by King Fahd University of Petroleum and Minerals (KFUPM) by providing all the essential resources to conduct this study.

Conflicts of Interest

The authors declare no conflict of interest.

References

  1. Liu, S.; Triantis, K.P.; Sarangi, S. A framework for evaluating the dynamic impacts of a congestion pricing policy for a transportation socioeconomic system. Transp. Res. Part A Policy Pract. 2010, 44, 596–608. [Google Scholar] [CrossRef]
  2. Huang, Z.; Xia, J.; Li, F.; Li, Z.; Li, Q. A Peak Traffic Congestion Prediction Method Based on Bus Driving Time. Entropy 2019, 21, 709. [Google Scholar] [CrossRef] [Green Version]
  3. Zheng, Y.; Capra, L.; Wolfson, O.; Yang, H. Urban Computing: Concepts, Methodologies, and Applications. ACM Trans. Intell. Syst. Technol. 2014, 5, 1–55. [Google Scholar] [CrossRef]
  4. Economist, T. The Cost of Traffic Jams; The Economist: London, UK, 2014. [Google Scholar]
  5. Scorecard, U.M. 2015 Urban Mobility Scorecard; The Texas A&M Transportation Institute: Houston, TX, USA; Inrix: Kirkland, WA, USA, 2015; Volume 9. [Google Scholar]
  6. Di Battista, T.; Fortuna, F.; Maturo, F. Environmental monitoring through functional biodiversity tools. Ecol. Indic. 2016, 60, 237–247. [Google Scholar] [CrossRef]
  7. Schrank, D.; Lomax, T.; Eisele, B. 2012 Urban Mobility Report; The Texas A&M University System: College Station, TX, USA, 2012. [Google Scholar]
  8. D’Adamo, I.; Falcone, P.M.; Gastaldi, M.; Morone, P. RES-T trajectories and an integrated SWOT-AHP analysis for biomethane. Policy implications to support a green revolution in European transport. Energy Policy 2020, 3, 111220. [Google Scholar] [CrossRef]
  9. Levy, J.I.; Buonocore, J.J.; Stackelberg, K. von The Public Health Costs of Traffic Congestion a Health Risk Assessment. Environ. Health 2010, 9, 1–12. [Google Scholar] [CrossRef] [Green Version]
  10. Aljoufie, M. Spatial analysis of the potential demand for public transport in the city of Jeddah, Saudi Arabia. Urban Transp. XX 2014, 1, 113–123. [Google Scholar]
  11. Sibai, A. Al Bottleneck Traffic Creates a Heavy Loss of SR 81 Billion; The Saudi Gazette: Riyadh, Saudi Arabia, 2011. [Google Scholar]
  12. Gately, D.; Al-Yousef, N.; Al-Sheikh, H.M.H. The rapid growth of OPEC′ s domestic oil consumption. Energy Policy 2013, 62, 844–859. [Google Scholar] [CrossRef]
  13. Commerce, U.D. Of Export.gov: Saudi Arabia–Automotiv. The Saudi Gazette report; Saudi Gazette: Riyadh, Saudi Arabia, 2018. [Google Scholar]
  14. Dano, U.L.; AlQahtany, A.M. Issues undermining public transport utilization in Dammam city, Saudi Arabia: An expert-based analysis. J. Sustain. Sci. Manag. 2019, 14, 155–169. [Google Scholar]
  15. Mazloumi, E.; Moridpour, S.; Mohsenian, H. Delay function for signalized intersections in traffic assignment models. J. Urban Plan. Dev. 2010, 136, 67–74. [Google Scholar] [CrossRef]
  16. Zegeer, C.V.; Bushell, M. Pedestrian crash trends and potential countermeasures from around the world. Accid. Anal. Prev. 2012, 44, 3–11. [Google Scholar] [CrossRef] [PubMed]
  17. Jamal, A.; Rahman, M.T.; Al-ahmadi, H.M. The Dilemma of Road Safety in the Eastern Province of Saudi Arabia: Consequences and Prevention Strategies. Int. J. Environ. Res. Public Helath 2019, 17, 1–23. [Google Scholar] [CrossRef] [PubMed] [Green Version]
  18. Caruso, G.; Gattone, A.S. Waste Management Analysis in Developing Countries through Unsupervised Classification of Mixed Data. Soc. Sci. 2019, 8, 186. [Google Scholar] [CrossRef] [Green Version]
  19. Lämmer, S.; Helbing, D. Self-control of traffic lights and vehicle flows in urban road networks. J. Stat. Mech. Theory Exp. 2008, 2008, P04019. [Google Scholar] [CrossRef] [Green Version]
  20. Ma, W.; Yang, X.; Pu, W.; Liu, Y. Signal timing optimization models for two-stage midblock pedestrian crossing. Transp. Res. Rec. 2010, 2198, 133–144. [Google Scholar] [CrossRef]
  21. Lan, C.-J. New optimal cycle length formulation for pretimed signals at isolated intersections. J. Transp. Eng. 2004, 130, 637–647. [Google Scholar] [CrossRef]
  22. Han, L.D.; Li, J.-M. Short or long—Which is better? Probabilistic approach to cycle length optimization. Transp. Res. Rec. 2007, 2035, 150–157. [Google Scholar] [CrossRef]
  23. Chang, T.-H.; Lin, J.-T. Optimal signal timing for an oversaturated intersection. Transp. Res. Part B Methodol. 2000, 34, 471–491. [Google Scholar] [CrossRef]
  24. Zhao, L.; Peng, X.; Li, L.; Li, Z. A fast signal timing algorithm for individual oversaturated intersections. IEEE Trans. Intell. Transp. Syst. 2010, 12, 280–283. [Google Scholar] [CrossRef]
  25. Ma, D.; Nakamura, H. Cycle length optimization at isolated signalized intersections from the viewpoint of emission. In Traffic and Transportation Studies; ASCE: Nagoya, Japan, 2010; pp. 275–284. [Google Scholar]
  26. Li, X.; Li, G.; Pang, S.-S.; Yang, X.; Tian, J. Signal timing of intersections using integrated optimization of traffic quality, emissions and fuel consumption: A note. Trans. Res. Part D Trans. Environ. 2004, 9, 401–407. [Google Scholar] [CrossRef]
  27. Olivera, A.C.; García-Nieto, J.M.; Alba, E. Reducing vehicle emissions and fuel consumption in the city by using particle swarm optimization. Appl. Intell. 2015, 42, 389–405. [Google Scholar] [CrossRef]
  28. XIAO-GUANG, Y.; Jing, Z.; Tao, W. Optimal cycle calculation method of signal control at roundabout. China J. Highw. Transp. 2008, 6, 90–95. [Google Scholar]
  29. Park, B.B.; Rouphail, N.M.; Sacks, J. Assessment of stochastic signal optimization method using microsimulation. Trans. Res. Rec. 2001, 1748, 40–45. [Google Scholar] [CrossRef] [Green Version]
  30. Tan, M.K.; Chuo, H.S.E.; Chin, R.K.Y.; Yeo, K.B.; Teo, K.T.K. Optimization of traffic network signal timing using decentralized genetic algorithm. In Proceedings of the 2017 IEEE 2nd International Conference on Automatic Control and Intelligent Systems (I2CACIS), Kota Kinabalu, Malaysia, 21–21 October 2017; pp. 62–67. [Google Scholar]
  31. Nesmachnow, S.; Massobrio, R.; Arreche, E.; Mumford, C.; Olivera, A.C.; Vidal, P.J.; Tchernykh, A. Traffic lights synchronization for Bus Rapid Transit using a parallel evolutionary algorithm. Int. J. Transp. Sci. Technol. 2019, 8, 53–67. [Google Scholar] [CrossRef]
  32. Tan, T.; Bao, F.; Deng, Y.; Jin, A.; Dai, Q.; Wang, J. Cooperative deep reinforcement learning for large-scale traffic grid signal control. IEEE Trans. Cybern. 2019. [Google Scholar] [CrossRef]
  33. Han, K.; Liu, H.; Gayah, V.V.; Friesz, T.L.; Yao, T. A robust optimization approach for dynamic traffic signal control with emission considerations. Transp. Res. Part C Emerg. Technol. 2016, 70, 3–26. [Google Scholar] [CrossRef] [Green Version]
  34. Zhu, S.; Guo, K.; Guo, Y.; Tao, H.; Shi, Q. An adaptive signal control method with optimal detector locations. Sustainability 2019, 11, 727. [Google Scholar] [CrossRef] [Green Version]
  35. Lian, P.; Wu, Y.; Li, Z.; Keel, J.; Guo, J.; Kang, Y. An Improved Transit Signal Priority Strategy for Real-World Signal Controllers that Considers the Number of Bus Arrivals. Sustainability 2019, 12, 1–22. [Google Scholar] [CrossRef] [Green Version]
  36. Irfanullah, J.A.; Subhan, F. Public perception of autonomous car: A case study for Pakistan. Adv. Transp. Stud. 2019, 49, 145–154. [Google Scholar]
  37. Ban, X.; Herring, R.; Hao, P.; Bayen, A.M. Delay pattern estimation for signalized intersections using sampled travel times. Transp. Res. Rec. 2009, 2130, 109–119. [Google Scholar] [CrossRef] [Green Version]
  38. Beckmann, M.; McGuire, C.B.; Winsten, C.B. Studies in the Economics of Transportation; Yale University Press: California, USA, 1956. [Google Scholar]
  39. Webster, F.V. Traffic Signal settings; Road Research Lab Tech Papers: London, UK, 1958. [Google Scholar]
  40. Saha, A.; Chandra, S.; Ghosh, I. Delay at Signalized Intersections under Mixed Traffic Conditions. J. Transp. Eng. Part A Syst. ASCE 2017, 143, 401704. [Google Scholar] [CrossRef]
  41. Akcelik, R. Traffic Signals: Capacity and Timing Analysis; Research Report ARR No. 123; Australian Road Research Board: Victoria, Australia, 1981; ISBN 0869100157. [Google Scholar]
  42. Dion, F.; Rakha, H.; Kang, Y.-S. Comparison of delay estimates at under-saturated and over-saturated pre-timed signalized intersections. Transp. Res. Part B Methodol. 2004, 38, 99–122. [Google Scholar] [CrossRef]
  43. Martín, S.; Romana, M.G.; Santos, M. Fuzzy model of vehicle delay to determine the level of service of two-lane roads. Expert Syst. Appl. 2016, 54, 48–60. [Google Scholar] [CrossRef]
  44. Wu, Y.; Lu, J.; Chen, H.; Yang, H. Development of an optimization traffic signal cycle length model for signalized intersections in China. Math. Probl. Eng. 2015, 2015. [Google Scholar] [CrossRef] [Green Version]
  45. Akçelik, R. Time-Dependent Expressions for Delay, Stop Rate and Queue Length at Traffic Signals; Internal Report AIR 367-1; Australian Road Research Board: Vermont South, Victoria, Australia, 1980. [Google Scholar]
  46. Day, C.M.; Bullock, D.M.; Sturdevant, J.R. Cycle-length performance measures: Revisiting and extending fundamentals. Transp. Res. Rec. 2009, 2128, 48–57. [Google Scholar] [CrossRef]
  47. Li, H.; Wang, D.; Qu, Z. Research on the optimal method of cycle length for signalized intersection. In Applications of Advanced Technologies in Transportation Engineering (2004); ACES Library: Urbana, IL, USA, 2004; pp. 371–376. [Google Scholar]
  48. Manual, H.C. Highway Capacity Manual; National Academy of Sciences: Washington, DC, USA, 2000. [Google Scholar]
  49. Liang, X.; Du, X.; Wang, G.; Han, Z. A Deep Reinforcement Learning Network for Traffic Light Cycle Control. IEEE Trans. Veh. Technol. 2019, 68, 1243–1253. [Google Scholar] [CrossRef] [Green Version]
  50. Zahid, M.; Chen, Y.; Jamal, A. Freeway Short-Term Travel Speed Prediction Based on Data Collection Time-Horizons: A Fast Forest Quantile Regression Approach. Sustainability 2020, 12, 646. [Google Scholar] [CrossRef] [Green Version]
  51. Zahid, M.; Chen, Y.; Jamal, A.; Memon, Q.M. Short Term Traffic State Prediction via Hyperparameter Optimization Based Classifiers. Sensors 2020, 20, 685. [Google Scholar] [CrossRef] [Green Version]
  52. Pandit, K.; Ghosal, D.; Zhang, H.M.; Chuah, C. Adaptive Traffic Signal Control with Vehicular Ad hoc Networks. IEEE Trans. Veh. Technol. 2013, 62, 1459–1471. [Google Scholar] [CrossRef] [Green Version]
  53. Chiu, S.; Chand, S. Adaptive Traffic Signal Control Using Fuzzy Logic. In Proceeding of the First IEEE Regional Conference on Aerospace Control Systems, Detroit, MI, USA, 29 June–1 July 1992; pp. 122–126. [Google Scholar]
  54. El-Tantawy, S.; Abdulhai, B.; Abdelgawad, H. Design of Reinforcement Learning Parameters for Seamless Application of Adaptive Traffic Signal Control. J. Intell. Transp. Syst. 2014, 18, 227–245. [Google Scholar] [CrossRef]
  55. Wei, H.; Zheng, G.; Yao, H.; Li, Z. Intellilight: A reinforcement learning approach for intelligent traffic light control. In Proceedings of the 24th ACM SIGKDD International Conference on Knowledge Discovery & Data Mining; ACM: New York, NY, USA, 2018; pp. 2496–2505. [Google Scholar]
  56. Tang, F.; Mao, B.; Fadlullah, Z.M.; Kato, N.; Akashi, O.; Inoue, T.; Mizutani, K. On removing routing protocol from future wireless networks: A real-time deep learning approach for intelligent traffic control. IEEE Wirel. Commun. 2017, 25, 154–160. [Google Scholar] [CrossRef]
  57. Li, L.; Lv, Y.; Wang, F.-Y. Traffic signal timing via deep reinforcement learning. IEEE/CAA J. Autom. Sin. 2016, 3, 247–254. [Google Scholar]
  58. Park, B.; Messer, C.J.; Urbanik, T. Traffic signal optimization program for oversaturated conditions: Genetic algorithm approach. Transp. Res. Rec. 1999, 1683, 133–142. [Google Scholar] [CrossRef]
  59. Tamimi, A.; AbuNaser, M.; Tawalbeh, A.A.; Saleh, K. Intelligent Traffic Light Based On Genetic Algorithm. In Proceedings of the 2019 IEEE Jordan International Joint Conference on Electrical Engineering and Information Technology (JEEIT), Amman, Jordan, 9–11 April 2019; pp. 851–854. [Google Scholar]
  60. Yu, H.; Ma, R.; Zhang, H.M. Optimal traffic signal control under dynamic user equilibrium and link constraints in a general network. Transp. Res. Part B Methodol. 2018, 110, 302–325. [Google Scholar] [CrossRef]
  61. Sama, M.; Pellegrini, P.; D’Ariano, A.; Rodriguez, J.; Pacciarelli, D. Ant colony optimization for the real-time train routing selection problem. Transp. Res. Part B Methodol. 2016, 85, 89–108. [Google Scholar] [CrossRef]
  62. Foy, M.D.; Benekohal, R.F. Signal timing determination using genetic algorithms. Transp. Res. Rec. 1993, 1365, 108–115. [Google Scholar]
  63. Tech, J.I.; Eng, S.; Rahbari, D.; Tl, R. Help the Genetic Algorithm to Minimize the Urban Traffic on Intersections. J. Inf. Technol. Softw. Eng. 2014, 4, 1–9. [Google Scholar]
  64. Putha, R.; Quadrifoglio, L.; Zechman, E. Comparing Ant Colony Optimization and Genetic Algorithm Approaches for Solving Traffic Signal Coordination under Oversaturation Conditions. Comput. Civ. Infrastruct. Eng. 2012, 27, 14–28. [Google Scholar] [CrossRef]
  65. Akgüngör, A.P.; Korkmaz, E. Analysis and Modelling of the Relationship between Stopped and Control Delays by Differential Evolution Algorithm. Open Civ. Eng. J. 2016, 25, 10. [Google Scholar] [CrossRef] [Green Version]
  66. Cakici, Z.; Murat, Y.S. A Differential Evolution Algorithm-Based Traffic Control Model for Signalized Intersections. Adv. Civ. Eng. 2019, 2019. [Google Scholar] [CrossRef]
  67. Korkmaz, E.; Akgüngör, A.P. Delay estimation models for signalized intersections using differential evolution algorithm. J. Eng. Res. 2017, 5, 16–29. [Google Scholar]
  68. Schmidt, B.; Al-Fuqaha, A.; Gupta, A.; Kountanis, D. Optimizing an artificial immune system algorithm in support of flow-Based internet traffic classification. Appl. Soft Comput. 2017, 54, 1–22. [Google Scholar] [CrossRef]
  69. Louati, A.; Darmoul, S.; Elkosantini, S.; ben Said, L. An artificial immune network to control interrupted flow at a signalized intersection. Inf. Sci. 2018, 433, 70–95. [Google Scholar] [CrossRef]
  70. Chuo, H.S.E.; Tan, M.K.; Chong, A.C.H.; Chin, R.K.Y.; Teo, K.T.K. Evolvable traffic signal control for intersection congestion alleviation with enhanced particle swarm optimisation. In Proceedings of the 2017 IEEE 2nd International Conference on Automatic Control and Intelligent Systems (I2CACIS), Kota Kinabalu, Malaysia, 21 October 2017; pp. 92–97. [Google Scholar]
  71. Ceylan, H. Optimal Design of Signal Controlled Road Networks Using Differential Evolution Optimization Algorithm. Math. Probl. Eng. 2013, 2013, 696374. [Google Scholar] [CrossRef]
  72. Bi, Y.; Srinivasan, D.; Lu, X.; Sun, Z.; Zeng, W. Type-2 fuzzy multi-intersection traffic signal control with differential evolution optimization. Expert Syst. Appl. 2014, 41, 7338–7349. [Google Scholar] [CrossRef]
  73. Trabelsi, B.; Elkosantini, S.; Darmoul, S. Traffic Control at Intersections Using Artificial Immune System Approach. In 9th International Conforence Modeling. Optimzation Simulation; The open Archive HAL: Bordeaux, France, 2012. [Google Scholar]
  74. Traffic, G.D. Vehicles Registered in the Kingdom By Region; General Authority for Statistics: Riyadh, Saudi Arabia, 2018. [Google Scholar]
  75. Ministery of Interior (MOI) Statistical Yearbook; MOI: Al Olaya, Saudi Arabia, 2019.
  76. Kramer, O. Genetic Algorithm Essentials; Springer: Berlin, Germany, 2017; Volume 679, ISBN 331952156X. [Google Scholar]
  77. Bala, A. A Review on Genetic Algorithm and Its Applications. Int. J. Comput. Algorithm 2017, 2, 415–423. [Google Scholar]
  78. Davis, L. Handbook of Genetic Algorithms; Elsevier: Santa Fe, NM, USA, 1996; pp. 1–6. [Google Scholar]
  79. Chambers, L.D. Practical Handbook of Genetic Algorithms: Complex Coding Systems; CRC Press: Boca Raton, FL, USA, 2019; Volume 3, ISBN 0429525575. [Google Scholar]
  80. Doğan, E.; Akgüngör, A.P. Optimizing a fuzzy logic traffic signal controller via the differential evolution algorithm under different traffic scenarios. Simulation 2016, 92, 1013–1023. [Google Scholar] [CrossRef]
  81. Ganesan, T.; Vasant, P.; Elamvazuthi, I. Advances in Metaheuristics: Applications in Engineering Systems; CRC Press: Boca Raton, FL, USA, 2016; ISBN 1315297647. [Google Scholar]
  82. Leal, S.S.; de Almeida, P.E.M.; Chung, E. Active control for traffic lights in regions and corridors: An approach based on evolutionary computation. Transp. Res. Procedia 2017, 25, 1769–1780. [Google Scholar] [CrossRef]
  83. Srideviponmalar, P.; Jawahar Senthil Kumar, V.; Harikrishnan, R. Hybrid Genetic Algorithm–Differential Evolution Approach for Localization in WSN BT—Intelligent Engineering Informatics; Bhateja, V., Coello Coello, C.A., Satapathy, S.C., Pattnaik, P.K., Eds.; Springer: Singapore, 2018; pp. 263–271. [Google Scholar]
  84. Zhang, M.; Geng, H.; Luo, W.; Huang, L.; Wang, X. A Hybrid of Differential Evolution and Genetic Algorithm for Constrained Multiobjective Optimization Problems BT—Simulated Evolution and Learning; Wang, T.-D., Li, X., Chen, S.-H., Wang, X., Abbass, H., Iba, H., Chen, G.-L., Yao, X., Eds.; Springer: Berlin Germany, 2006; pp. 318–327. [Google Scholar]
  85. Chang, H.-J.; Park, G.-T. A study on traffic signal control at signalized intersections in vehicular ad hoc networks. Ad. Hoc. Netw. 2013, 11, 2115–2124. [Google Scholar] [CrossRef]
  86. Zakariya, A.Y.; Rabia, S.I. Estimating the minimum delay optimal cycle length based on a time-dependent delay formula. Alexandria Eng. J. 2016, 55, 2509–2514. [Google Scholar] [CrossRef] [Green Version]
Figure 1. Schematic for illustration of different delay measures.
Sustainability 12 01896 g001
Figure 2. Study area (from Google map).
Sustainability 12 01896 g002
Figure 3. Phasing plan for movements at intersections.
Sustainability 12 01896 g003
Figure 4. Flowchart for sequential stages of proposed algorithms: (a) genetic algorithm; (b) differential evolution.
Sustainability 12 01896 g004aSustainability 12 01896 g004b
Figure 5. Comparison for convergence pattern for GA and DE: (a) intersection-I; (b) intersection-II.
Sustainability 12 01896 g005aSustainability 12 01896 g005b
Figure 6. Comparison of cycle length and average delay: (a) Intersection-I; (b) Intersection-II.
Sustainability 12 01896 g006aSustainability 12 01896 g006b
Figure 7. Comparison of cycle length vs. delay curves: (a) Intersection-I; (b) Intersection-II.
Sustainability 12 01896 g007
Table 1. Traffic volume and signal control data collected from intersections.
Parameter Description IntersectionNorth Bound (NB)South Bound (SB)West Bound (WB)East Bound (EB)
Flow rates (veh/hr.) ThroughLeftRightThroughLeftRightThroughLeftRightThroughLeftRight
1--192598182403366400320-112
26582-647352132052-1555530-
Phasing sequence green splits (s) GreenAll RedYellowGreenAll RedYellowGreenAll RedYellowGreenAll RedYellow
11523602375235023
21523252345235523
Table 2. Algorithms parameters description.
Method Sequential Steps Parameter DescriptionGenetic Algorithm Differential Evolution
InitializationPopulation Size100100
No. of generations500500
Selection parameter0.70-
Cross overCrossover Probability0.800.80
Alpha (α)0.50-
MutationMutation Probability0.060.06
ElitismElitism percentage0.100.10
Evolutionary operatorsSelectionTournament Random
RecombinationUniformUniform
MutationGaussianDifferential
Table 3. Algorithms objective function, constraints, and decision variables.
Optimization Problem InputFunction/Constraints DescriptionRemarks
Objective function min d =   i = 1 m D i / i = 1 m q i ) Average vehicle delay
Set of constraints8 ≤ gi ≤ 45Range for Green split for on each phase
60 ≤ Copt ≤ 180Range for optimal intersection cycle length
Decision variableg1Green split for phase I
g2Green split for phase II
g3Green split for phase III
g4Green split for phase IV
Table 4. Optimized cycle lengths and green splits by GA and DE.
Phase DirectionIntersectionNorth Bound (NB)South Bound (SB)West Bound (WB)East Bound (EB)Clearance Interval All BoundsIntersection Cycle Length
Splits Green split I (% Difference)Green split II (% Difference)Green split III (% Difference)Green split IV (% Difference)Yellow + All Red 4 * (3 + 2)-
Genetic Algorithm112 (20)41 (15)45 (33.33)30 (40)20148
Differential Evolution111 (26.67)32 (46.67)37 (47.14)25 (50)20125
Genetic Algorithm210 (33.33)16 (36)27 (40)32 (41.82)20 105
Differential Evolution210 (33.33)13 (52)20 (44.44)29 (52.72)2092
Note: Values in parenthesis indicate percent difference from existing conditions.
Table 5. Percent difference in cycle length and average vehicle delay.
MethodIntersectionPercentage Difference in Intersection Cycle Length (sec)Percentage Difference in Average Delay (sec/veh.)
BeforeAfterDifference (%)BeforeAfterDifference (%)
Genetic Algorithm122014832.73102.564.337.25
Differential Evolution122012543.18102.578.623.32
Genetic Algorithm216010534.3886.555.935.38
Differential Evolution21609242.586.572.815.84

