1. Introduction
The World Health Organization (WHO) reported 1.35 million deaths on roads in 2016 worldwide [
1]. To date, road traffic fatality is the eighth leading cause of death globally. In order to further reduce the number of road traffic crashes, identifying the most dangerous road locations is a fundamental step to formulate effective policy interventions. The “hot spot” (also called black-site and black spot) and “hot zone” methodology are two popular methods employed by road safety administrations and researchers to identify hazardous road locations. A hot spot generally refers to a dangerous road location where the actual crash rate is higher than the critical crash rate [
2,
3,
4], whereas a hot zone refers to a dangerous road location made of two or more continuous segments that contain an actual crash rate higher than a threshold value [
2,
5,
6,
7]. There is a rich literature that examines the spatial statistics of identifying hot spots and hot zones of traffic crashes [
6,
7,
8,
9,
10,
11,
12,
13]. However, the application of suitable identification methods is largely dependent on the spatial context. Essentially, roads in urban and rural regions can display different distinctive patterns of hot spots and hot zones [
2,
3,
5,
14], possibly due to variations in road geometries (e.g., length of road segments, number of intersections and road signage) and other factors like road user behavior. For instance, urban roads are generally shorter and have denser road intersections, which are more likely to give rise to hot spots. On the contrary, rural roads and highways have longer road sections and fewer junctions which may lead to hot zones. To develop appropriate corrective measures and curb traffic fatalities and causalities, local context should be duly considered [
15]. Therefore, further investigation is needed on comparing hot spot and hot zone analysis to identify hazardous roads in different spatial contexts (i.e., urban cores, urban fringes, suburbs and rural regions), so that appropriate road safety measures targeting dangerous road locations can be put forward.
Road safety issues, primarily traffic fatalities, have been particularly serious in low- and middle-income countries, which often bear the greatest burden of road traffic fatalities and injuries. The Global South, which comprises of the less developed countries from Southeast Asia, Africa and Latin America, is still facing challenging road safety issues. As pinpointed by WHO [
1], the road traffic death rates per capita are the highest in Africa (26.6 per 100,000 population) and Southeast Asia (20.7 per 100,000 population). When looking into the countries of the Association of Southeast Asian Nations (ASEAN), Indonesia has the second lowest estimated fatality rate of 12.2 per 100,000 people in 2016 (
Table 1). In Thailand, for example, the fatality rate in 2016 was 32.2 per 100,000 people; in Myanmar, it was 19.9 per 100,000 people [
1]. Notwithstanding, Indonesia has one of the highest traffic fatality rates for the motorized 2- and 3-wheelers [
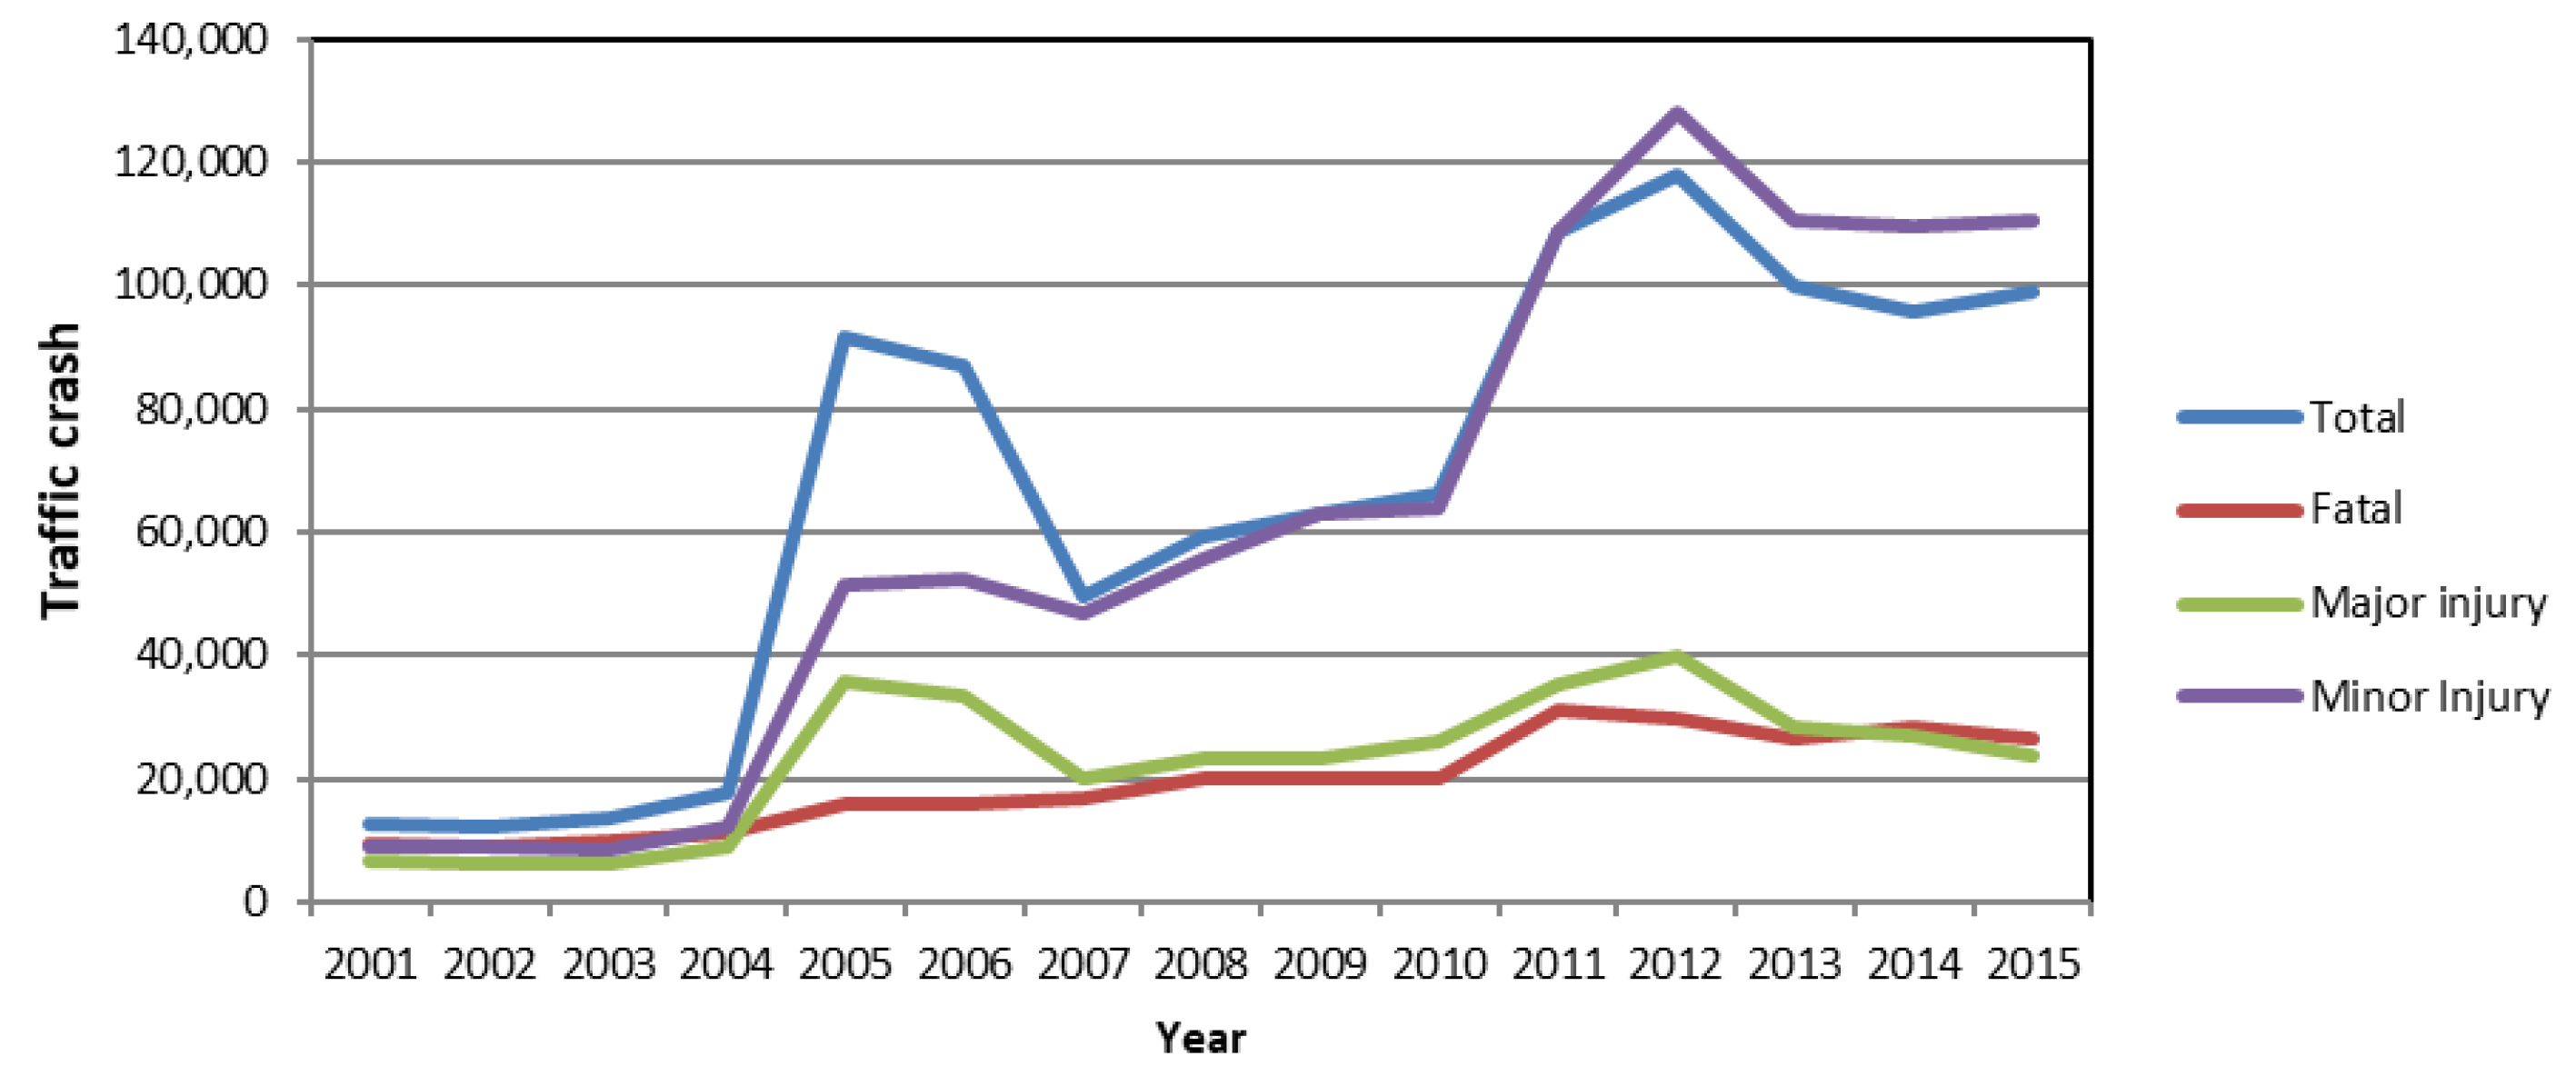
16]. In addition, the total number of traffic crashes in Indonesia has been increasing consistently since 2001 (
Figure 1). The situation has become alarming with 31,726 deaths on roads recorded in 2016, an increase of 91% when compared to the figure in 2007. Reducing the number of traffic crashes is therefore a priority in Indonesia. This paper attempts to identify the hot spots and hot zones of traffic crashes on two major roads of Aceh province and suggest some countermeasures that can be implemented in dealing with the two different types of road locations. By doing so, this paper provides new knowledge on traffic safety in the Indonesian context, which will be of major reference to other developing countries in the Global South. Indeed, very little research currently exists on this topic in South East Asian countries primarily because of data limitations. Most of the research on identifying and comparing hazardous road locations often comes from US, Europe or Australia, and is not always applicable in the South-East Asian context.
In early 2007, the Ministry of Transportation implemented a program called the ‘Decade of Action for Road Safety’. The program included actions to strengthen road safety management and improve road infrastructure. It also included mass awareness campaigns to improve drivers’ behavior on roads and to incite them to improve the maintenance of their vehicles. The drop in the number of accidents in the country in 2007, as shown on the graph, might be associated to this new program. A new series of actions were renewed in 2010 to promote the program, although it does not seem to be associated to a drop in the number of accidents after the second series of actions.
2. Literature Review
Spatial analysis and the configuration of road traffic crashes have been investigated for over two decades. The two commonly used methodologies include hot spot and hot zone analyses. A hot spot refers to a dangerous road location where the actual crash rate is higher than the critical crash rate [
2,
3,
4]. A hot spot is mainly a “point” at one specific location such as a road intersection, or a small but distinctive geographical feature such as a basic spatial unit (BSU). Therefore, a BSU is a hot spot if the expected crash rate of the BSU is significantly higher than the critical crash rate. Other researchers suggest different parameters to define a hot spot location, including the expected number of crashes, rather than the actual number, by using the Empirical Bayes and Full Bayes [
8,
9,
10]. The major weakness of the hot spot methodology is that hot spots can be numerous and are independent events without considering network contiguity. Although the hot spot methodology allows easier comparison across road segments, the case of actual crash rate exceeding the critical value can be a result of randomness rather than the “systematic” occurrence of traffic crashes, leading to the so-called “false-positive” scenarios [
2,
11]. This can be problematic when developing road safety measures with limited resources in selected priority areas for road safety improvement.
Conversely, the hot zone methodology mainly identifies dangerous road locations of two or more continuous road segments (i.e., BSUs) that contain an actual crash rate higher than a threshold value for each spatial unit [
2,
5,
6,
7]. The spatial analysis of hot zones takes into account the contiguity of the entire road network, therefore considering the spatial dependence between the BSUs. Various spatial statistics of local (i.e., Kernel Density Estimation, K-function, Local Moran’s I, Local Getis and Ord G and spatial autocorrelation) and global measures (i.e., Quadrant methods and K-functions) are used to illustrate the clustering pattern of road traffic crashes [
12]. In relation, some studies suggest using Empirical Bayes and Full Bayes methods to reduce the regression-to-mean (RTM) bias [
13]. Although there is no consensus on the best approach to detect hot zones, the use of local statistical measures can generally generate better results, as global measures only capture the average spatial pattern in an entire region [
3]. Spatial autocorrelation using the link-attribute approach is particularly beneficial in the hot zone analysis, because this allows to identify contiguous BSUs that are specifically with higher crash intensity [
19]. The methodology contains three fundamental steps including (i) geo-validation of traffic crashes, (ii) line segmentation of road network into BSUs and (iii) hot zone detection [
2].
When comparing the hot spot and hot zone methodologies, the practical value of the two analyses may vary. As highlighted by Moons et al. [
5], hot spots can be complementary in road safety analysis given they can lie within or outside hot zones. Moreover, the results from Loo [
2] suggests that the hot zone methodology can be a better approach in identifying dangerous road locations or segments in suburban and rural regions, whereas the hot spot methodology can perform better in urban areas with higher density of roads and a larger number of junctions. In traffic crash analysis, many empirical findings indicate that the spatial pattern of traffic collisions can vary according to a wide range of factors. The distribution of hot spots or hot zones can, for example, vary based on temporal change [
20], road types (e.g., highways and urban roads) [
21], land uses [
13] and pedestrians or other vulnerable groups [
22]. Putting the spatial context into the perspectives of hotspot and hot zone identification is therefore conducive to formulating geographical-specific and effective road safety measures.
The spatial variations depicted above imply that the associated measures to tackle a single hot spot or a continuous hot zone would be different. However, this has not been thoroughly investigated in literature. Loo et al. [
23] investigated the hot spots and hot zones relating to the rural-urban divide in China and suggested that further traffic inspections in urban environments and segregation of lanes to reduce vehicular-pedestrian conflicts are essential. In the rural areas, hazardous hot zones may require additional lighting facilities, and visible warning signs should be installed. Many studies have analyzed the spatial pattern of hot spots and associated countermeasures to reduce the dangerousness of these locations, in both the urban and rural contexts. These countermeasures, listed in
Table 2, are largely consolidated from well-established road safety plans from more developed countries, in an urban context [
24,
25,
26,
27,
28] as well as in a rural context [
25,
26,
29,
30,
31,
32]. For example, urban hot spots are usually tackled by traffic engineering measures in intersections (i.e., clear road signs, signalized control, engineering-based approaches and speed reduction) and stricter speed enforcement. Road safety campaigns are conducted for the high-risk groups (i.e., motorcyclists and young drivers). For rural areas, road safety measures tend to display some differences. Engineering measures on rural roads mainly include visibility enhancement and clear signage as well as visual aid on speed limit and speed reduction. Enforcement is also put forward in regulating certain aggressive driving behavior such as overtaking and speeding. In terms of education, efforts are made to provide information to rural communities where the residents are exposed to higher risks on roads due to poorer infrastructure and a lack of traffic signals at intersections. Some of the countermeasures listed in the table below may also be applicable in both urban and rural contexts.
3. Methodology
3.1. Study Area
The study area is Aceh province in northern Sumatra of Indonesia. In the province, the number of road traffic accidents has been increasing since 2012 (
Table 3). The province of Aceh represents 3.2% of the terrestrial extent of Indonesia and, in 2015, its population accounted for about 2% of the total population in Indonesia. In 2015, 98,970 road traffic crashes were reported on Indonesian roads, out of which 1.7% (1684 crashes) were reported in Aceh.
The Vienna Convention defines a fatal accident as ‘an accident in which a person died of their injuries at the scene or within thirty days’ [
33]. The same threshold is used to classify as a fatal crash in Indonesia. In total, four categories are used to classify road crashes in the country, based on the severity level (i.e., fatal injury, serious injury, minor injury and property damage only). According to a government regulation from 1993, a fatal accident is one in which a victim died, either on the spot or due to injuries sustained within 30 days of the accident. A serious injury is one in which the casualty suffered serious injuries and was admitted to a hospital and received treatment for over 30 days; and a minor injury is one in which the casualty required medical treatment or was admitted to a hospital and received a treatment for less than 30 days. While the trend of major injuries in Indonesia has been decreasing, the number of fatalities and minor injuries in Aceh have been increasing continuously between 2012 and 2015. Only the number of major injuries recorded in the province has been decreasing since 2013. Crashes with only property damage are also recorded by the relevant traffic agency, but they were excluded from this analysis, as the major objective is to identify areas that can cause casualties and loss of lives because these are the major negative social externality of transport.
The road network of the province mainly consists of national roads, provincial roads, district roads and village roads. National roads, which include highways, are the busiest roads with the most important number of road traffic accidents. The two main highways in Aceh cross the province from North to South and run alongside the East coast (“East road” thereafter) and the West coast (“West road” thereafter). These two highways are part of the national roads and are the focus of this study. In total, these highways have a total length combined of 1053 km and cut across 15 districts located in urban, rural and urban-rural environments. As shown in
Table 4, the East road and West road sections crossing the different districts are most predominantly located in the urban environment. In five districts only, Aceh Besar (on both East and West roads), Aceh Jaya and Aceh Selatan, Nagan Raya and Subulussalam, roads are crossing in a longer rural section. Districts crossed by the East road have a larger urban extent than districts crossed by the West road. In two districts, Banda Aceh and Langsa, the highways do not cross into rural environment.
3.2. Data Collection and Preparation
3.2.1. Geovalidation of Traffic Crashes
Traffic crash information from 2012 to 2015 was obtained from the Departments of Transportation and Traffic Police in Aceh. The authors do not have access to information beyond 2015. Information included, for each accident, the spatial coordinates and a series of attributes characterizing the accident (including the number of persons involved in the accident categorized per severity, the weather and light conditions or condition of the road). This information was quality checked, geo-validated and mapped into the Geographic Information System (GIS). In the province, the traffic police collect crash location information by recording the GPS coordinates of the crash at its emplacement. Overall, there was very few deviations of the data from the road network. Minor deviations could arise from the high tree cover preventing the GPS to pick up a reception and therefore require the police officer to move out of the tree cover. In this case, each point record (i.e., crash) was manually snapped to the nearest line segment of the road. In total, 2035 road traffic crashes in the East side of the island (East road hereafter) and 409 road traffic crashes in the West side of the island (West road hereafter) were analyzed. Four-year crash data were used in this analysis, as focusing on a single year was not reliable due to randomness. Aggregating 4-year data allows a more robust analysis and provided more creditable results.
3.2.2. Network Segmentation
The second step for both hot spot and hot zone methodologies is to conduct road segmentation, which essentially divides the entire road network into smaller BSUs [
4,
5,
6]. The network distance for the two main highways in Aceh province is 1053 km. The length of the BSUs can vary and is context-specific [
3], but 100-meter long segments are commonly used [
2,
4,
7,
34]. In this study, the roads were cut into 200-meter long BSUs because this segment size was best reflective of the local context and of changes in the environment of highways without a lot of intersections. Essentially, using different lixel lengths (e.g., shorter lengths in urban areas and longer in rural areas) for hot zones can yield more promising results [
35]. Overall, the general rule of thumb is that the BSUs should be long enough to allow for the identification of hot spots and short enough to reflect changes in the environment that may influence road safety [
2]. In total, the East road was split into 2330 segments and the West road was split into 2936 segments.
3.2.3. Hot Spot and Hot Zone Identification
The geo-validated traffic crashes are then assigned to the divided road segments. Each spatial unit (BSU) has a record of the number of traffic crashes. One important note is that double-counting issue may arise when assigning the traffic crashes on the road segments (e.g., a crash happens right between two BSUs). If this is the case, the crash will be assigned to the road segment with a smaller x coordinate, which follows the same methodology as in Loo [
2] and Loo and Yao [
19]. Then, the principles of classifying the BSU(s) as hot spots or hot zones are as follows. It is noted that the generation of hot spots, hot zones and hot clusters is based on the locations of empirical traffic crashes (see
Section 3.2.1). This research does not apply the traffic conflict technique for analysis, as the major objective is to examine the spatial patterns of actual traffic crashes over the province, instead of an observation of potential traffic crashes in specific road sections or junctions.
- (a)
Identification of hot spots: To determine whether a BSU represents a hot spot, the national definition and methodology of traffic hotspots are applied, as suggested by the Department of Transportation in Indonesia [
36]: a location in which three or more traffic crashes occurred in a year (HS3+). The hot spots (i.e., BSUs that contained 3 or more traffic crashes) are then used to identify road hazardous locations and analyzed geographically by district and by land use.
- (b)
Identification of hot zones: A hot zone consists of two or more contiguous road segments (i.e., BSUs) that contain an actual crash rate higher than a threshold value. To allow a consistent comparison with the hot spot methodology, the critical threshold value is also set as three or more traffic crashes per 200-meter (HZ3+). In other words, if each of the consecutive BSUs has three or more traffic crashes, a hot zone appears. In the previous studies, the identification of hot zones is executed as separate steps in the GIS software. In this study, a python-based add-in (i.e., Hotzone Generation addin), as developed by Grubenmann et al. [
37], was used to automate and speed up the spatial process of hot zones identification. This tool uses the three-step hot zone methodology, as described in Loo [
2], to identify hazardous road locations composed of at least two contiguous road segments.
- (c)
Identification of hot clusters: The hot-cluster approach detects dangerous road segments in a way similar to the traditional hot zone methodology (i.e., continuous road segments with the actual crash rate higher than the critical crash rate). It partly eases the constraints of line segmentation, as in the traditional hot zone methodology, and addresses the shortest network distance between points. It follows the concept of hierarchical clustering in which two nearest clusters (i.e., two points) are combined to form a new cluster (detailed methodology see [
38]). This is a data-driven method without parameter specifications; and it does not require a pre-defined length of road segments (i.e., window size) or specification of crash densities in advance. In the analysis, the traditional hierarchical clustering technique was further defined and developed into the network-constrained hierarchical clustering. All potential road clusters are produced simultaneously to allow switching between parameters. The nearest distance was calculated based on the shortest network distance. To remediate the long manual processing time, this paper uses a Python-based add-in developed by Grubenmann et al. [
38]. The parameters used were: a minimum length of 200 m and the default value (0.03) for the minimum density (which is equivalent to a minimum three or more traffic crashes per BSU). No maximum length or maximum separation point were defined.
4. Results
4.1. Spatial Distribution of Hot Spots, Hot Zones and Hot Clusters
Table 5 summarizes the results of the hot spots, hot zones and hot clusters. Overall, the identification of hot spots using the official terminology of Indonesia detected 236 hot spots (HS3+) in total on the East and West roads between 2012 and 2015 (
Figure 2). More than 95% of them were located on the East road. On the West road, hot spots were found in four out of the eight districts. The district of Aceh Selatan, where the road crosses in rural areas predominantly (46%) records the highest number of hot spots. Half of the six in this district are located in urban environment, two in urban-rural environment and one in rural environment. The three other districts, Aceh Besar, Aceh Jaya and Subulussalam each record only one hot spot, located in urban environment in Aceh Besar and Subulussalam, and in rural environment in Aceh Jaya. On the East road, with the exception of Pidie, all the other districts recorded some hot spots. The districts of Lhokseumawe and Aceh Utara recorded the highest number of hot spots recorded (59 and 56 respectively). In all the districts of the East road (except in Pidie), hot spots were mostly recorded in urban areas. On the East road, the maximum number of traffic crashes per BSU for hot spots located in urban environment was 10. In urban-rural environment, a maximum of 8 traffic crashes per BSU was identified. The figure stood at 9 for the rural environment.
To identify the hot zones, the minimum threshold value of three crashes was used and the BSU length was 200 meters. In total, 99 hot zones (HZ3+) were identified in all districts of the East road over the 2012–2015 periods. Only the district of Pidie did not record any hot zones in on the East Road. On the West road, no hot zones were identified in any districts. The districts of Lhokseumawe and Aceh Utara, on the East road, recorded the highest number of hot zones (42 and 29, respectively). Districts with a large number of hot spots and hot zones are those with a larger traffic volume, higher crash density and population density. These districts (including Lhokseumawe, Bireun, Pidie and Aceh Utara) are on the East road and are the most densely populated and with higher crash density (except Banda Aceh). The longest hot zones (Max (n)) consisted of 8 contiguous BSU, representing a 1.6 km long segment. The maximum crash rate for an individual BSU, for the two threshold values, was 11.
In terms of spatial distribution, the hot clusters showed a similar pattern to the identification of hot zones. No hot clusters were found on the West road. Though, the number of hot clusters found on the East road was much smaller that the number of hot zones. In total, only three districts were identified with hot clusters: Lhokseumawe, Bireun and Aceh Utara. The longest hot cluster was 1.104 km long and contained 39 traffic crashes. The distribution of the hot clusters, hot zones and hot spots in the different districts shows that they were located primarily in urban environments (over 60%).
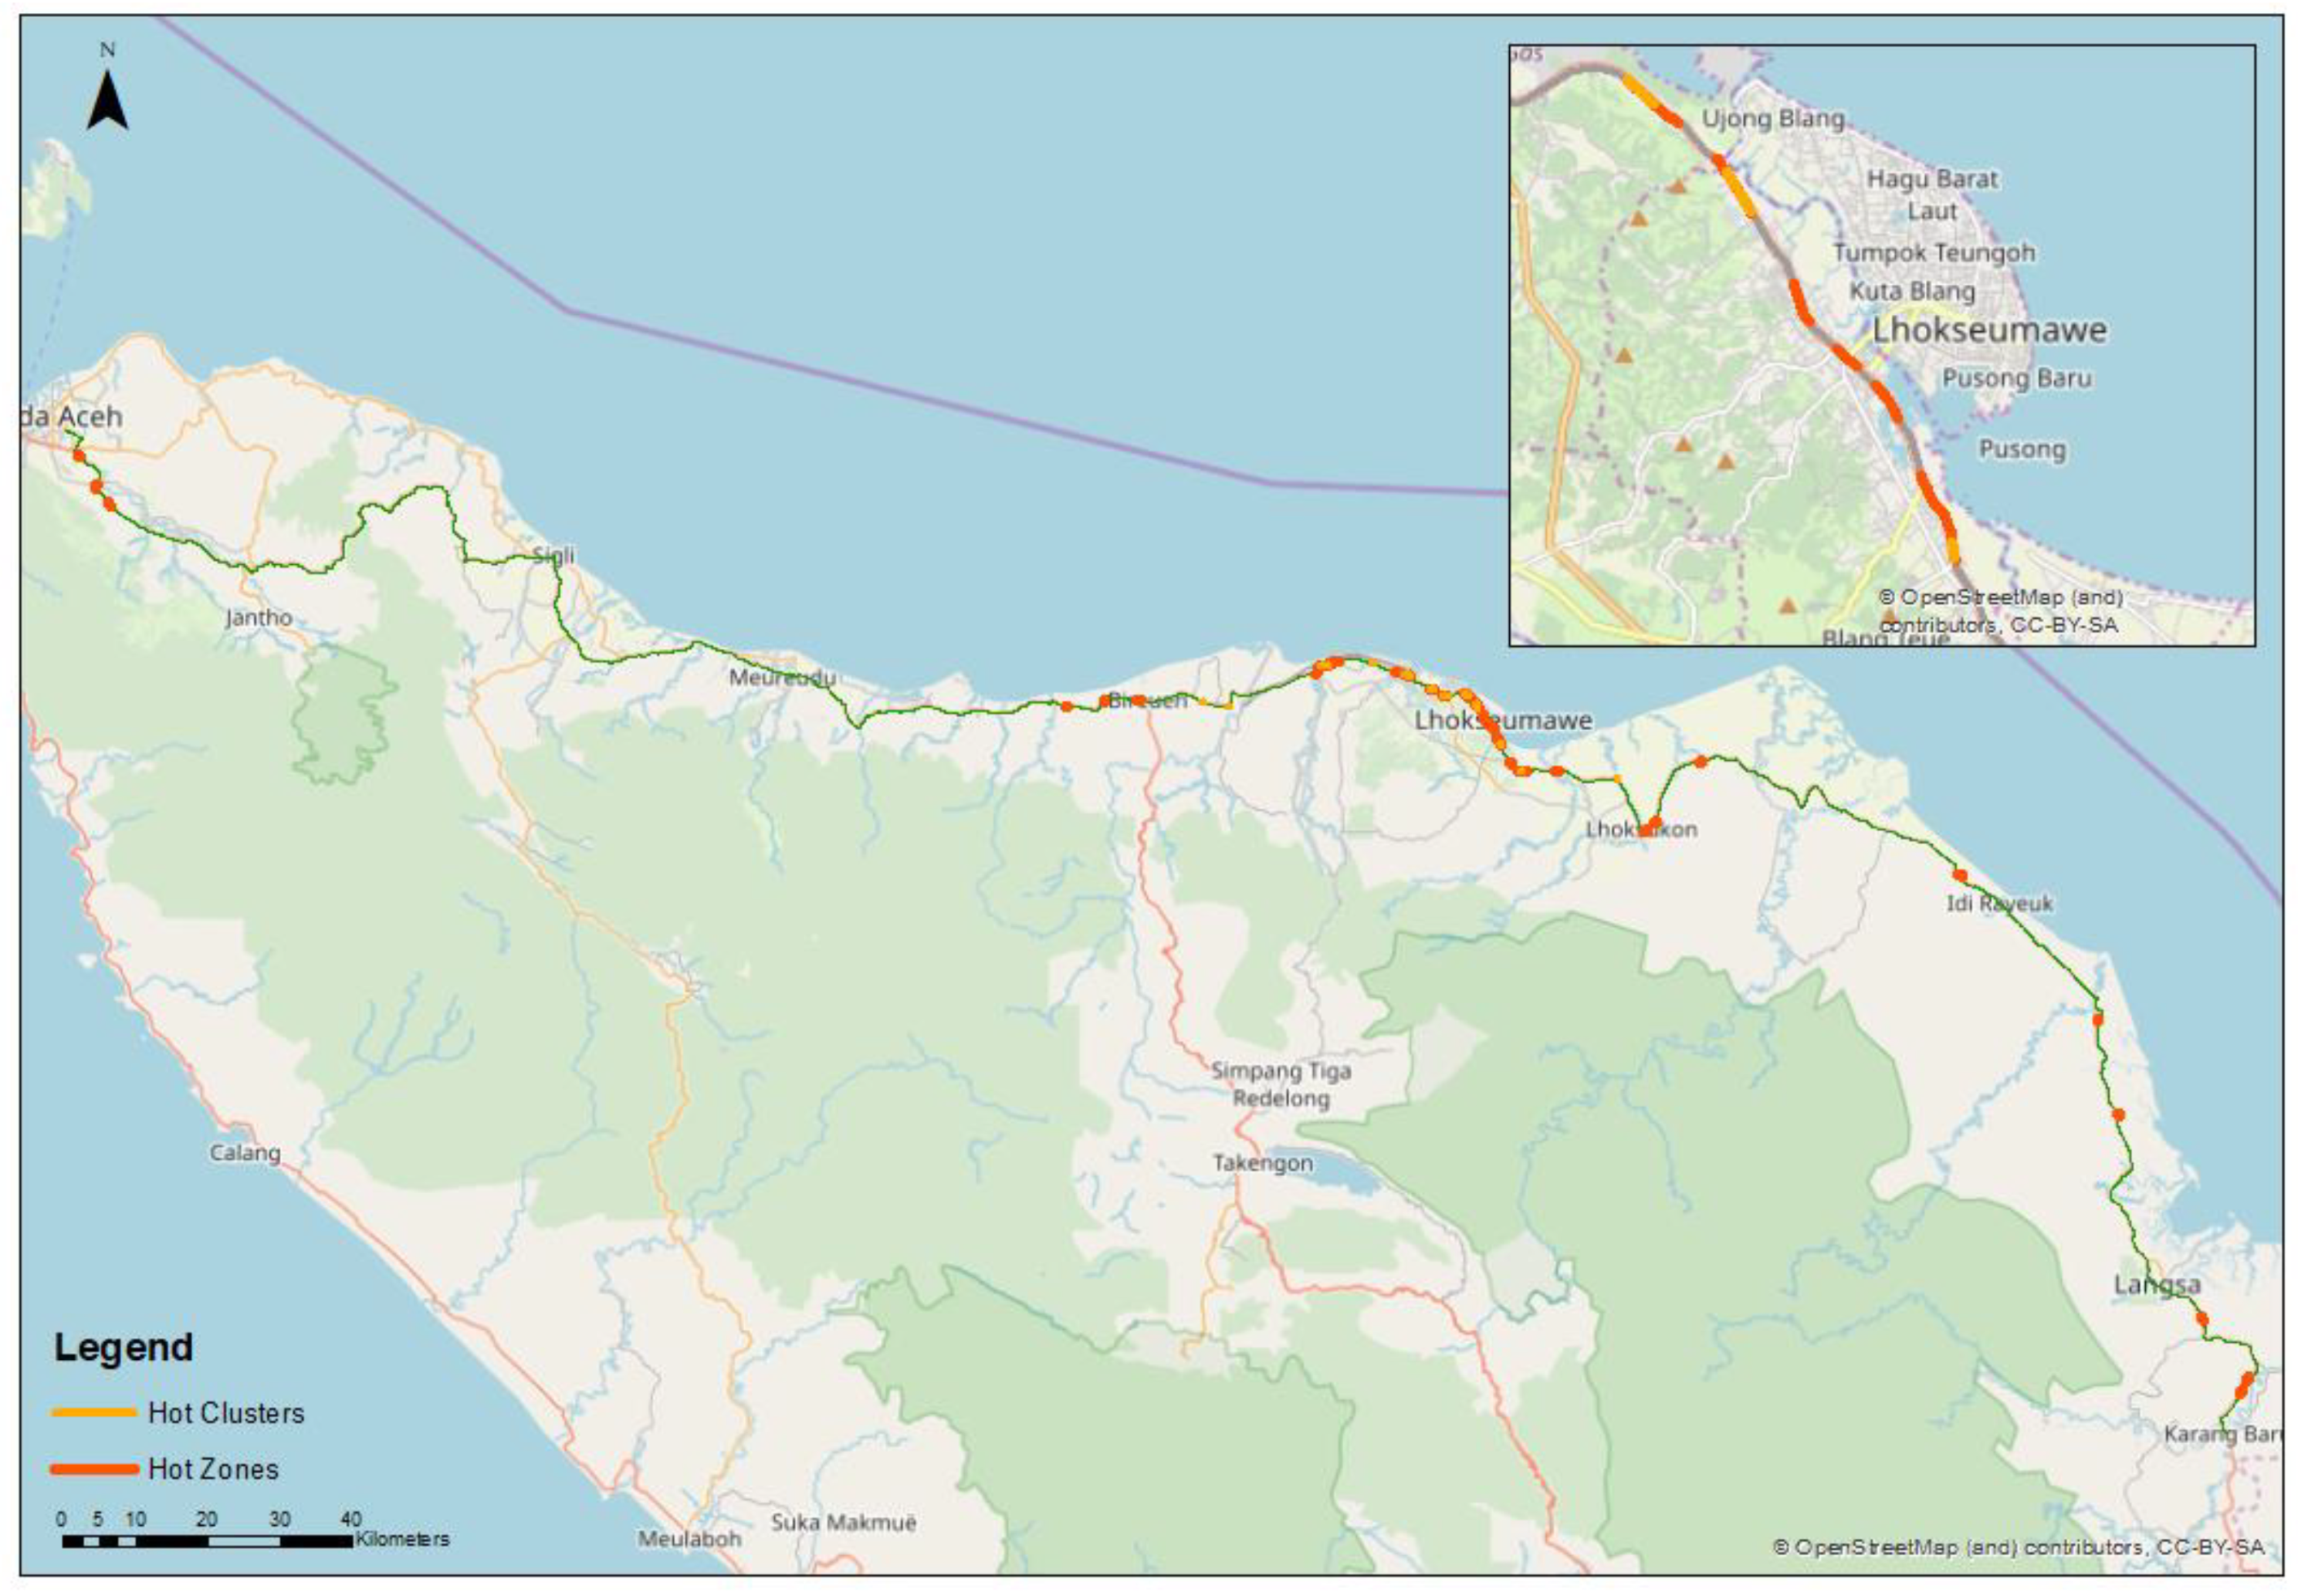
Figure 3 shows a summary of all the hot zones and hot clusters identified on the East road and zooms in into the district of Lhokseumawe in order to show the distribution of hot zones and hot clusters in this district.
The identification of hot spots, hot zones and hot clusters on both roads shows that these events were more located in the East road than in the West road, and dominantly recorded in an urban environment (
Table 6). On the West road, the number of hot spots was higher in rural areas than in the urban and rural areas. No hot zone or hot cluster was recorded on this road. On the East road, the localization of hot spots located outside of hot zones and hot clusters did not seem to follow any particular pattern. Indeed, they were distributed in all three land use types (urban, rural and urban-rural), and in areas with high traffic density and populated areas as well as in less populated areas outside of the city centers. When comparing the figures of hot spots, hot zones and hot clusters on the East road, 43.3% of the urban hot spots (84 out of 194) are overlapping with the hot zones in urban areas. The corresponding figures for the urban-rural divide and rural areas are 42.8% (6 out of 14) and 21.1% (4 out of 19), respectively. This suggests that the traditional hot spot analysis tend not to be an ideal approach to detect the continuous dangerous locations. On the East road, areas where hot spots and hot zones overlapped are characterized with high urban densities and higher activity that can be associated with high traffic density, population density, as well as a higher number of intersections and many activities that result in the presence of a high pedestrian population (for example schools, supermarkets, etc.). These areas, identified as dangerous locations take into consideration a larger number of factors, including the environmental context, than in areas where hot zones and hot spots are isolated and not overlapping.
4.2. The Spatial Features of the 20 Most Dangerous Hot Zones
A closer look at the 20 most dangerous hot zones in terms of both concentration of crashes and total fatalities shows that 12 out of the 20 hot zones were located in the district of Lhokseumawe (
Table 7). This highlights the need to prioritize this district and set up appropriate countermeasures. In addition, all but two hot zones were located in the urban environment. The two other hot zones were located in urban-rural environment in the district of Aceh Utara and in rural environment in the district of Aceh Besar. To understand how the hot zones rank in terms of severity level, each severity level was weighted (fatality = 1.15, major injury = 1.05 and minor injury = 0.95) and the total of weighted road safety burden was calculated. The hot zones that rank highest in terms of number of crashes also rank high in terms of severity level. However, three hot zones in Lhokseumawe which rank 9, 12 and 13 in terms of number of crashes appear to have a higher severity weighted than other hot zones ranking higher in terms of number of crashes. This means that while these hot zones recorded a smaller number of traffic crashes, these tend to be more serious.
5. Discussion
The findings show that the majority of the hot spots, hot zones and hot clusters are found on the East road, and more particularly in the districts of Banda Aceh, Aceh Besar, Aceh Utara and Lhokseumawe. These districts account for a higher number of traffic road crashes than districts crossed by the West road. Traffic crash density was also higher, on average, in the Eastern districts. Lhokseumawe was the district with the highest crash density. In terms of population density, districts in the East presented higher densities. Based on the literature from the Indonesian Central Agency of Statistics [
18], Banda Aceh was the district with the highest density, and Lhokseumawe was the second highest. Overall, the more the highway crossing the different districts is located in an urban environment, the higher the crash density and the population density are (e.g., Banda Aceh, Lhokseumawe or Langsa). Conversely, when the highway crosses into districts with lower urban extent, the crash density decreases, and in some districts both the crash density and population density decrease. When looking at the relationship between traffic flow and hot zones (
Figure 4), two third of the hot zones are distributed in areas with an annual average daily traffic (AADT) value under 18,000 a day, and only one third of the hot zones are distributed in areas with very important traffic, with an AADT value ranging from 39,000 to 83,000 vehicles a day. In addition, only five of the top 20 hot zones identified were located in areas with high AADT (<25,000 vehicles), showing that the dangerous sections are not systematically located in traffic dense areas.
The identification of hot spots on a road network enables to understand where urgent measures should be put in place first at certain identified parts (i.e., point locations) of a road. The analysis found that the number of hot spots identified was significantly higher on the East road than on the West road. This is partly due to the higher traffic density, associated with higher population densities in the East road districts, which result in higher crash rates on the East road. In addition, the hot spots were located predominantly in an urban environment on both roads. While the hot spots analysis and the subsequent implementation of hot spot countermeasures is now commonly used in many countries to improve road safety, in some instances, it is necessary to move beyond these specific point locations, and to take into consideration the broader landscape and look at the spatial dependence of different segments of a road. This is where the concept of hot zones comes in. While the hot zone methodology is getting more advanced, just knowing where these hot zones are located is not enough. In order to address the dangerousness of certain sections of the road (hot zones), the development of appropriate countermeasures is necessary. The analysis of hot zones on the two main highways of the province identified hot zones on the East road only. No hot zones were detected on the West road. On the East road, hot zones were located primarily in urban environment and concentrated in certain districts. Lhoksemawe and Aceh Timur recorded the highest number of hot zones. Most of these hot zones overlapped with the most important hot spots. This is important as the identification of hot zones thereby support and complement the hot spots identification.
When looking at each hot zone individually and analyzing the environmental characteristics, some commonalities emerged. For instance, most of the top 20 hot zones where sections of the road that contained many intersections. Some of these hot zones contained markets, which means that these sections were likely to have many pedestrians walking in these areas during market hours. Other hot zones included some access roads to the railway station. This also meant that these areas were likely to have a lot of traffic and many pedestrians going to and from the train station. Some hot zones also recorded shopping centers implying a likely intense traffic during the weekends, and schools, meaning important road traffic, motorcycles and pedestrians during term time. Some of these hot zones also recorded sharp curve in some areas, which can lead to road crashes in these areas. In the other 79 hot zones identified on the East road, commonalities across the hot zones included: relatively high number of intersections in the hot zones, presence of schools, universities, hospitals, shopping centers, markets and housing along the road sections.
Based on the common characteristics of hot zones that emerged from
Table 7, the next table presents a series of countermeasures that could be developed in the hot zones, as well as in the hot cluster sections. It does so by reviewing some of the hot spot countermeasures, that road safety experts and practitioners in Indonesia and overseas in Europe and Asia, have put in place and identifies some gaps that hot zone countermeasures can fill. These measures are classified into three main categories—engineering, education and enforcement (
Table 8).
In an urban environment, suggested countermeasures proposed on the highways of Aceh province include enhancing road users’ awareness ahead of intersections, sharp curves, or stops by adding additional signs before these events. Other measures, in terms of enforcement, would include stricter monitoring on use of helmet, seat belt and cell phone, and stronger enforcement on related fines. In terms of education, it is encouraged to develop periodic communication campaigns for the public in terms of important safety aspects of highways, such as good practices on roads and main reasons of road crashes. In a rural environment, some suggested countermeasures would focus on reducing wildlife crossing on highways by installing more frequent bridges for wildlife to cross overusing the bridge. This could also include improving fencing in areas frequently crossed by wildlife and better designing wildlife corridors to direct them towards wildlife crossing bridges. Other measures would include adding sufficient lights before, at and after intersections and sharp curves as some places in rural environments tend to be poorly lighted. Finally, ensuring a stronger enforcement of speed related regulations in rural areas is also recommended in order to decrease speed related crashes in these environments.
6. Conclusions
In this paper, the hot spot and a hot zone analyses are undertaken within an Indonesian context. The results are analyzed to understand how the hot spots and hot zones overlap. The 20 most dangerous hot zones in terms of concentration of crashes are selected and studied in more depth. Appropriate hot zone countermeasures are then proposed to ameliorate the road safety hazards of these areas.
This study is one of the few research papers which focused on quantitative spatial analysis on road safety in the Global South. The lack of sufficient high-quality data on these roads still enabled this research team to analyze and map these data, and produce some results, which, it is hoped will provide decision-makers with the necessary information to put in place appropriate measures to reduce traffic fatality rates on these roads. There are a few limitations in this study. First, only 4-year traffic crash data are available (potentially relating to issues in terms of quality of location data or underreporting). Second, only road crashes on highways were recorded, and analyzing the patterns of crashes on other road types (i.e., arterial roads and intersections) will be expected to produce more fruitful results. Notwithstanding, the results can serve as a useful reference for relevant measures in other parts of Indonesia, as well as in the broad region. With the fatality rate of three persons killed on road every hour, mapping and understanding where and why road traffic crashes occur should be a key priority in Indonesia. The use of the hot zone methodology complements the official black site methodology. A closer look at the most dangerous hot zones allows the road safety administration to better understand some common characteristics, which could explain their dangerousness.
The analysis reveals an important urban-rural gap. Sections of the highways located in urban areas recorded a significantly higher number of road traffic crashes than in rural areas. Higher traffic volumes in urban areas, combined with more complicated road traffic conditions (road geometry and design, and intersections) than in rural areas, contributed to more hot zones in urban areas than in rural areas. Indeed, 90% of the hot zones were located in urban areas. Given the rapid urbanization of the Global South, this finding is of significant strategic importance to national road safety administrations. The development of countermeasures should consider the dangerousness and features of hot zones. In urban areas, characterized with high crash rates, proposed countermeasures include implementing more frequent speed controls and traffic patrols to encourage road users to comply with traffic regulations. This should go in line with strengthening the public’s awareness about traffic rules, though for example mass campaigns. On some dangerous sections of the East road, characterized with high traffic volume, introducing segregated lanes for motor vehicles, bicycles, and pedestrians, as well as installing multiple bumps over short distances, can enhance the safety of all users. In rural areas, road safety measures should target areas identified with high crash rates. While sections of the highways in rural areas record less daily traffic volumes, medical services tend to be less accessible. Therefore, improving the presence of medical and emergency services in rural areas with high crash rates could help save more lives.
Future work could include focusing on traffic crashes at intersections under different settings, including for example the characteristics of crashes occurring on curves at the end of straight roads. This will help inform better road infrastructure design to address road safety problems before they occur. Secondly, investigating the long term effects of both hot spot and hot zone countermeasures and understand their individual impact and joint impact on improving road safety (when both measures are taken on a same segment, versus taken on different segments) could help better understand how to best develop certain type of measures in certain given contexts.
Author Contributions
Conceptualization, R.S., K.H.T. and B.P.Y.L.; methodology, R.S., K.H.T. and B.P.Y.L.; software, R.S. and K.H.T.; validation, R.S.; formal analysis, R.S.; investigation, R.S. and K.H.T.; data curation, R.S.; writing—original draft preparation, R.S.; writing—review and editing, R.S., K.H.T., M.C. and B.P.Y.L.; visualization, R.S.; supervision, B.P.Y.L; project administration, K.H.T. All authors have read and agreed to the published version of the manuscript.
Funding
This research received no external funding.
Conflicts of Interest
The authors declare no conflict of interest.
References
- World Health Organization (WHO). Global Status Report on Road Safety 2018; World Health Organization: Geneva, Switzerland, 2018; Licence: CC BYNC-SA 3.0 IGO. [Google Scholar]
- Loo, B.P.Y. The identification of Hazardous Road Locations: A comparison of the blacksite and hot zone methodologies in Hong Kong. Int. J. Sustain. Transp. 2009, 3, 187–202. [Google Scholar] [CrossRef]
- Ouni, F.; Belloumi, M. Pattern of road traffic crash hot zones versus probable hot zones in Tunisia: A geospatial analysis. Accid. Anal. Prev. 2019, 128, 185–196. [Google Scholar] [CrossRef]
- Flahaut, B.; Mouchart, M.; San Martin, E.; Thomas, I. The local spatial autocorrelation and the kernel method for identifying black zones: A comparative approach. Accid. Anal. Prev. 2003, 35, 991–1004. [Google Scholar] [CrossRef]
- Moons, E.; Brijs, T.; Wets, G. Identifying Hazardous Road Locations: Hot Spots versus Hot Zones. In Transactions on Computational Science VI. Lecture Notes in Computer Science; Gavrilova, M.L., Tan, C.J.K., Eds.; Springer: Berlin/Heidelberg, Germany, 2009; Volume 5730. [Google Scholar]
- Flahaut, B. Impact of infrastructure and local environment on road unsafety: Logistic modelling with spatial autocorrelation. Accid. Anal. Prev. 2004, 36, 1055–1066. [Google Scholar] [CrossRef] [PubMed]
- Loo, B.P.Y.; Yao, S. The identification of traffic crash hot zones under the link-attribute and event-based approaches in a network-constrained environment. Comput. Environ. Urban Syst. 2013, 41, 249–261. [Google Scholar] [CrossRef]
- El-Basyouny, K.; Sayed, T. Safety performance functions using traffic conflicts. Saf. Sci. 2013, 51, 160–164. [Google Scholar] [CrossRef]
- Huang, H.; Chin, H.C.; Haque, M.M. Empirical evaluation of alternative approaches in identifying crash of hot spots: Naïve ranking, empirical bayes, full bayes methods. Transp. Res. Rec. 2009, 2103, 32–41. [Google Scholar] [CrossRef]
- Miranda-Moreno, L.F.; Fu, L. Traffic safety study: Empirical Bayes or Full Bayes? Transportation Research Board. In Proceedings of the 86th Annual Meeting Transportation Research Board, Washington, DC, USA, 21–25 January 2017. [Google Scholar]
- Miranda-Moreno, L.F.; Labbe, A.; Fu, L. Bayesian multiple testing procedures for hotspot identification. Accid. Anal. Prev. 2007, 39, 1192–1201. [Google Scholar] [CrossRef]
- Yao, S.; Loo, B.P.Y.; Yang, B.Z. Traffic collisions in space: Four decades of advancement in applied GIS. Ann. GIS 2016, 22, 1–14. [Google Scholar] [CrossRef]
- Yang, B.; Loo, B.P.Y. Land use and traffic collisions: A link-attribute analysis using Empirical Bayes method. Accid. Anal. Prev. 2016, 95, 236–249. [Google Scholar] [CrossRef]
- Erdogan, S.; Yilmaz, I.; Baybura, T.; and Gullu, M. Geographical information systems aided traffic accident analysis system case study: City of Afyonkarahisar. Accid. Anal. Prev. 2008, 40, 174–181. [Google Scholar] [CrossRef] [PubMed]
- De Leur, P.; Sayed, T. Development of a Road Safety Risk Index. Transp. Res. Rec. 2002, 1784, 33–42. [Google Scholar] [CrossRef]
- Association of Southeast Asian Nations (ASEAN). ASEAN Regional Road Safety Strategy; ASEAN: Jakarta, Indonesia, 2016. [Google Scholar]
- World Health Organization (WHO). Death on the Roads. Available online: https://extranet.who.int/roadsafety/death-on-the-roads/#country_or_area/IDN (accessed on 16 September 2019).
- Indonesia Central Agency on Statistics (2018), Statistics Indonesia. Available online: http://www.bps.go.id/linkTableDinamis/view/id/1134 (accessed on 18 September 2019).
- Loo, B.P.Y.; Yao, S. Geographic Information Systems. In Injury Research: The methods, and Approaches; Li, G., Baker, S., Eds.; Springer: New York, NY, USA, 2012. [Google Scholar]
- Scott, M.C.; Roy, S.S.; Prasad, S. Spatial patterns of off-the-system traffic crashes in Miami-Dade County, Florida, during 2005–2010. Traffic Inj. Prev. 2016, 17, 729–735. [Google Scholar] [CrossRef]
- Yeo, H.; Jang, K.; Skabardonis, A.; Kang, S. Impact of traffic states on freeway crash involvement rates. Accid. Anal. Prev. 2013, 50, 713–723. [Google Scholar] [CrossRef] [PubMed]
- Medury, A.; Grembek, O. Dynamic programmic-based hot spot identification approach for pedestrian crashes. Accid. Anal. Prev. 2016, 93, 198–206. [Google Scholar] [CrossRef] [PubMed]
- Loo, B.P.Y.; Cheung, W.; Yao, S. The Rural-Urban Divide in Road Safety: The Case of China. Open Transp. J. 2011, 5, 9–20. [Google Scholar] [CrossRef][Green Version]
- Department of Infrastructure, Regional Development and Cities. National Road Safety Action Plan 2018–2020. Canberra: Department of Infrastructure, Regional Development and Cities; Department of Infrastructure, Regional Development and Cities: Canberra, Australia, 2018. [Google Scholar]
- Department of Transport (DoT). Intersection Safety Strategies; Federal Highway Administration: Washington, DC, USA, 2015. [Google Scholar]
- Loo, B.P.Y.; Hung, W.; Lo, H.; Wong, S. Road Safety Strategies: A Comparative Framework and Case Studies. Transp. Rev. 2005, 25, 613–639. [Google Scholar] [CrossRef]
- New Zealand Transport Agency. Transport Agency (NZTA) High-Risk Intersection Guide; New Zealand Transport Agency: Wellington, New Zealand, 2013. [Google Scholar]
- World Health Organization (WHO). Save Lives: A Road Safety Technical Package; World Health Organization: Geneva, Switzerland, 2017. [Google Scholar]
- Gacia, S.; Kiec, M. Speed management for local and regional rural roads. Transp. Res. Procedia 2016, 14, 4170–4179. [Google Scholar] [CrossRef]
- Martinez, A.; Mántaras, D.A.; Luque, P. Reducing posted speed and perceptual countermeasures to improve safety in road stretches with a high concentration of accidents. Saf. Sci. 2013, 60, 160–168. [Google Scholar]
- Ritcher, T.; Ruhl, S.; Ortlepp, J.; Bakaba, E. Causes, consequences and countermeasures of overtaking accidents on two-lane rural roads. Transp. Res. Procedia 2017, 25, 1989–2001. [Google Scholar]
- Sagberg, F. Characteristics of fatal road crashes involving unlicensed drivers or riders: Implications for countermeasures. Accid. Anal. Prev. 2018, 117, 270–275. [Google Scholar] [CrossRef] [PubMed]
- United Nations Treaty Collection. Vienna Convention on Road Traffic 1968. Available online: https://treaties.un.org (accessed on 22 September 2019).
- Elvik, R. Road Safety Management by Objectives: A Critical Analysis of the Norwegian Approach. Accid. Anal. Prev. 2008, 40, 1115–1122. [Google Scholar] [CrossRef] [PubMed]
- Klessig, H.; Suryaprakash, V.; Blume, O.; Fehske, A.; Fettweis, G. A framework enabling spatial analysis of mobile traffic hot spots. IEEE Wirel. Commun. Lett. 2014, 3, 537–540. [Google Scholar] [CrossRef]
- Department of Transport of Indonesia. 2015. Available online: http://hubdat.dephub.go.id/ (accessed on 20 September 2019).
- Grubenmann, T.; Tsoi, K.H.; Loo, B.P.Y. Hotzone Generation Add-in for ArcGIS. Available online: http://arcg.is/1T0bKv (accessed on 18 September 2019).
- Grubenmann, T.; Tsoi, K.H.; Loo, B.P.Y. Hot Clusters Generation Add-in for ArcGIS. Available online: http://arcg.is/0rHGGH (accessed on 18 September 2019).
© 2020 by the authors. Licensee MDPI, Basel, Switzerland. This article is an open access article distributed under the terms and conditions of the Creative Commons Attribution (CC BY) license (http://creativecommons.org/licenses/by/4.0/).


