Dockless E-Scooter: A Green Solution for Mobility? Comparative Case Study between Dockless E-Scooters, Displaced Transport, and Personal E-Scooters

 , and
, and
Abstract
1. Introduction
1.1. Dockless E-Scooter, a Product-Service System
1.2. Case Study
- The e-scooter used by our provider is a different model from the one used in Raleigh: materials are quite similar, but quantities are different.
- The municipal legislation in Raleigh forbids e-scooters to remain in the street during the night which means that all e-scooters, even the fully charged ones, must be collected every day causing additional trips.
- The city of Raleigh is significantly more spread out than the Brussels Capital Region, which generates longer trips for collection and deployment of the fleet.
- The modes of transportation displaced by the e-scooter are different in Raleigh as the importance of car trips is greater in Raleigh, and in the US in general.
- Electricity mix for charging is different from North Carolina to Belgium.
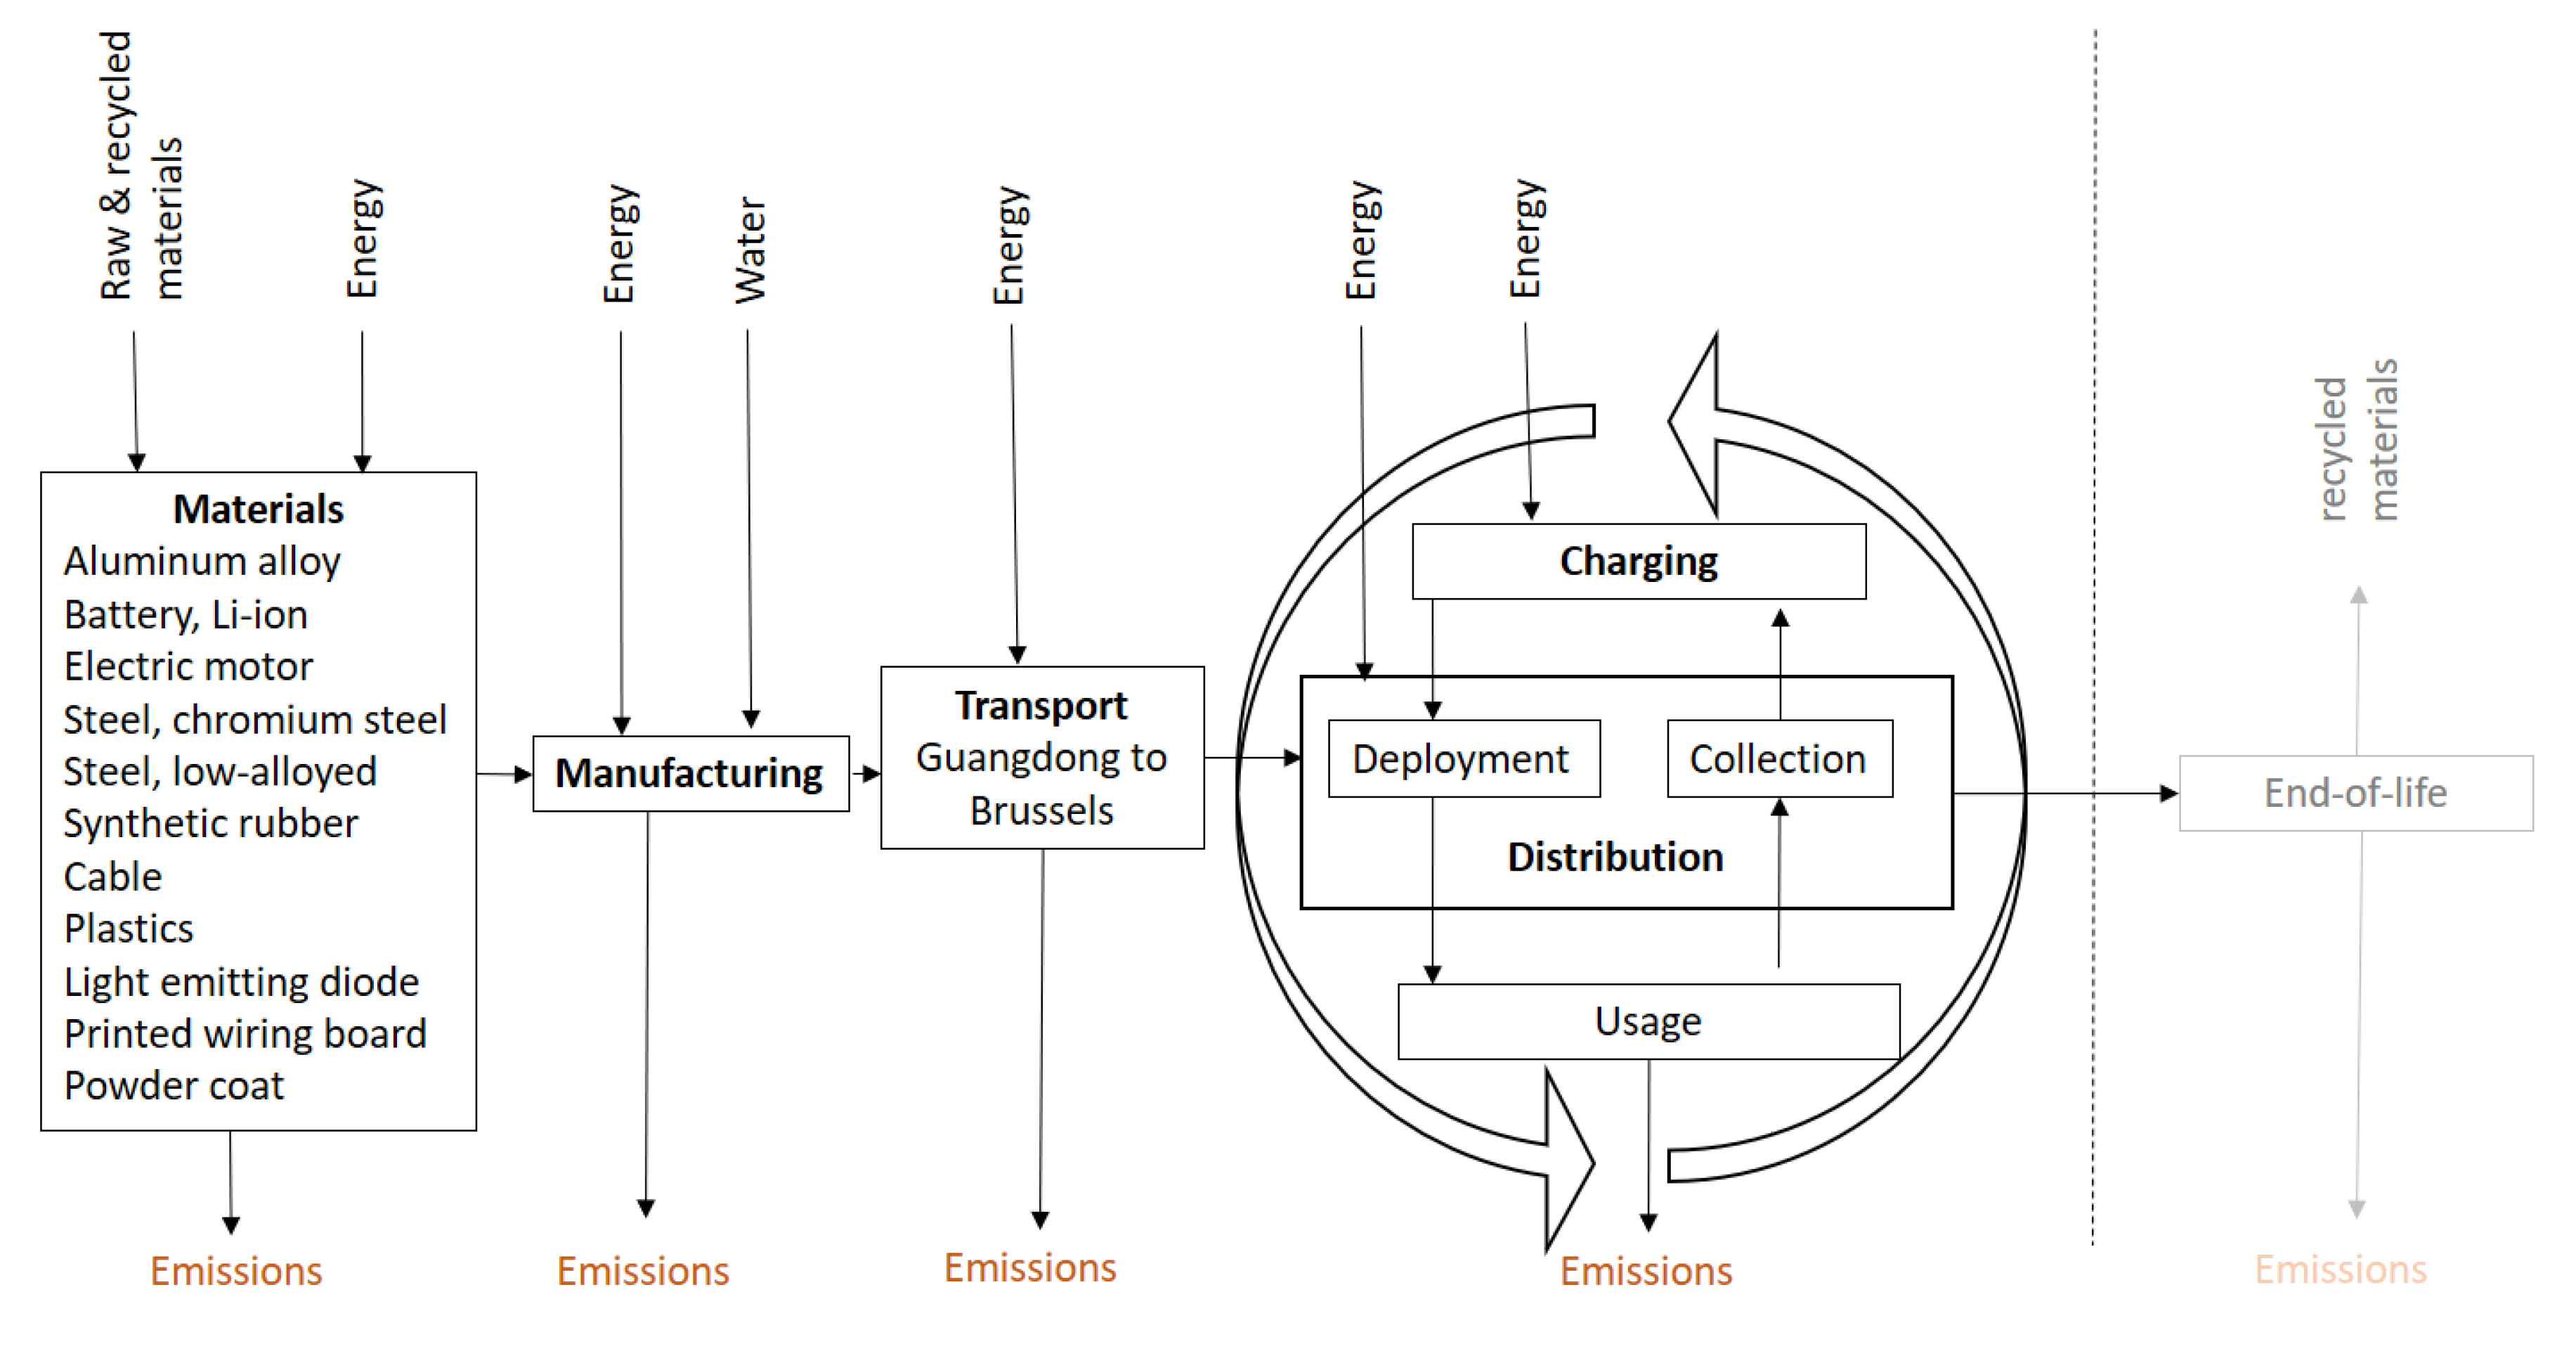
2. Materials and Methods
2.1. Goal and Scope
2.2. Inventory Data for the E-scooter
2.3. Inventory Data for the Displaced Modal Shares
2.4. Inventory Data for the Personal E-scooter
3. Results and Discussion
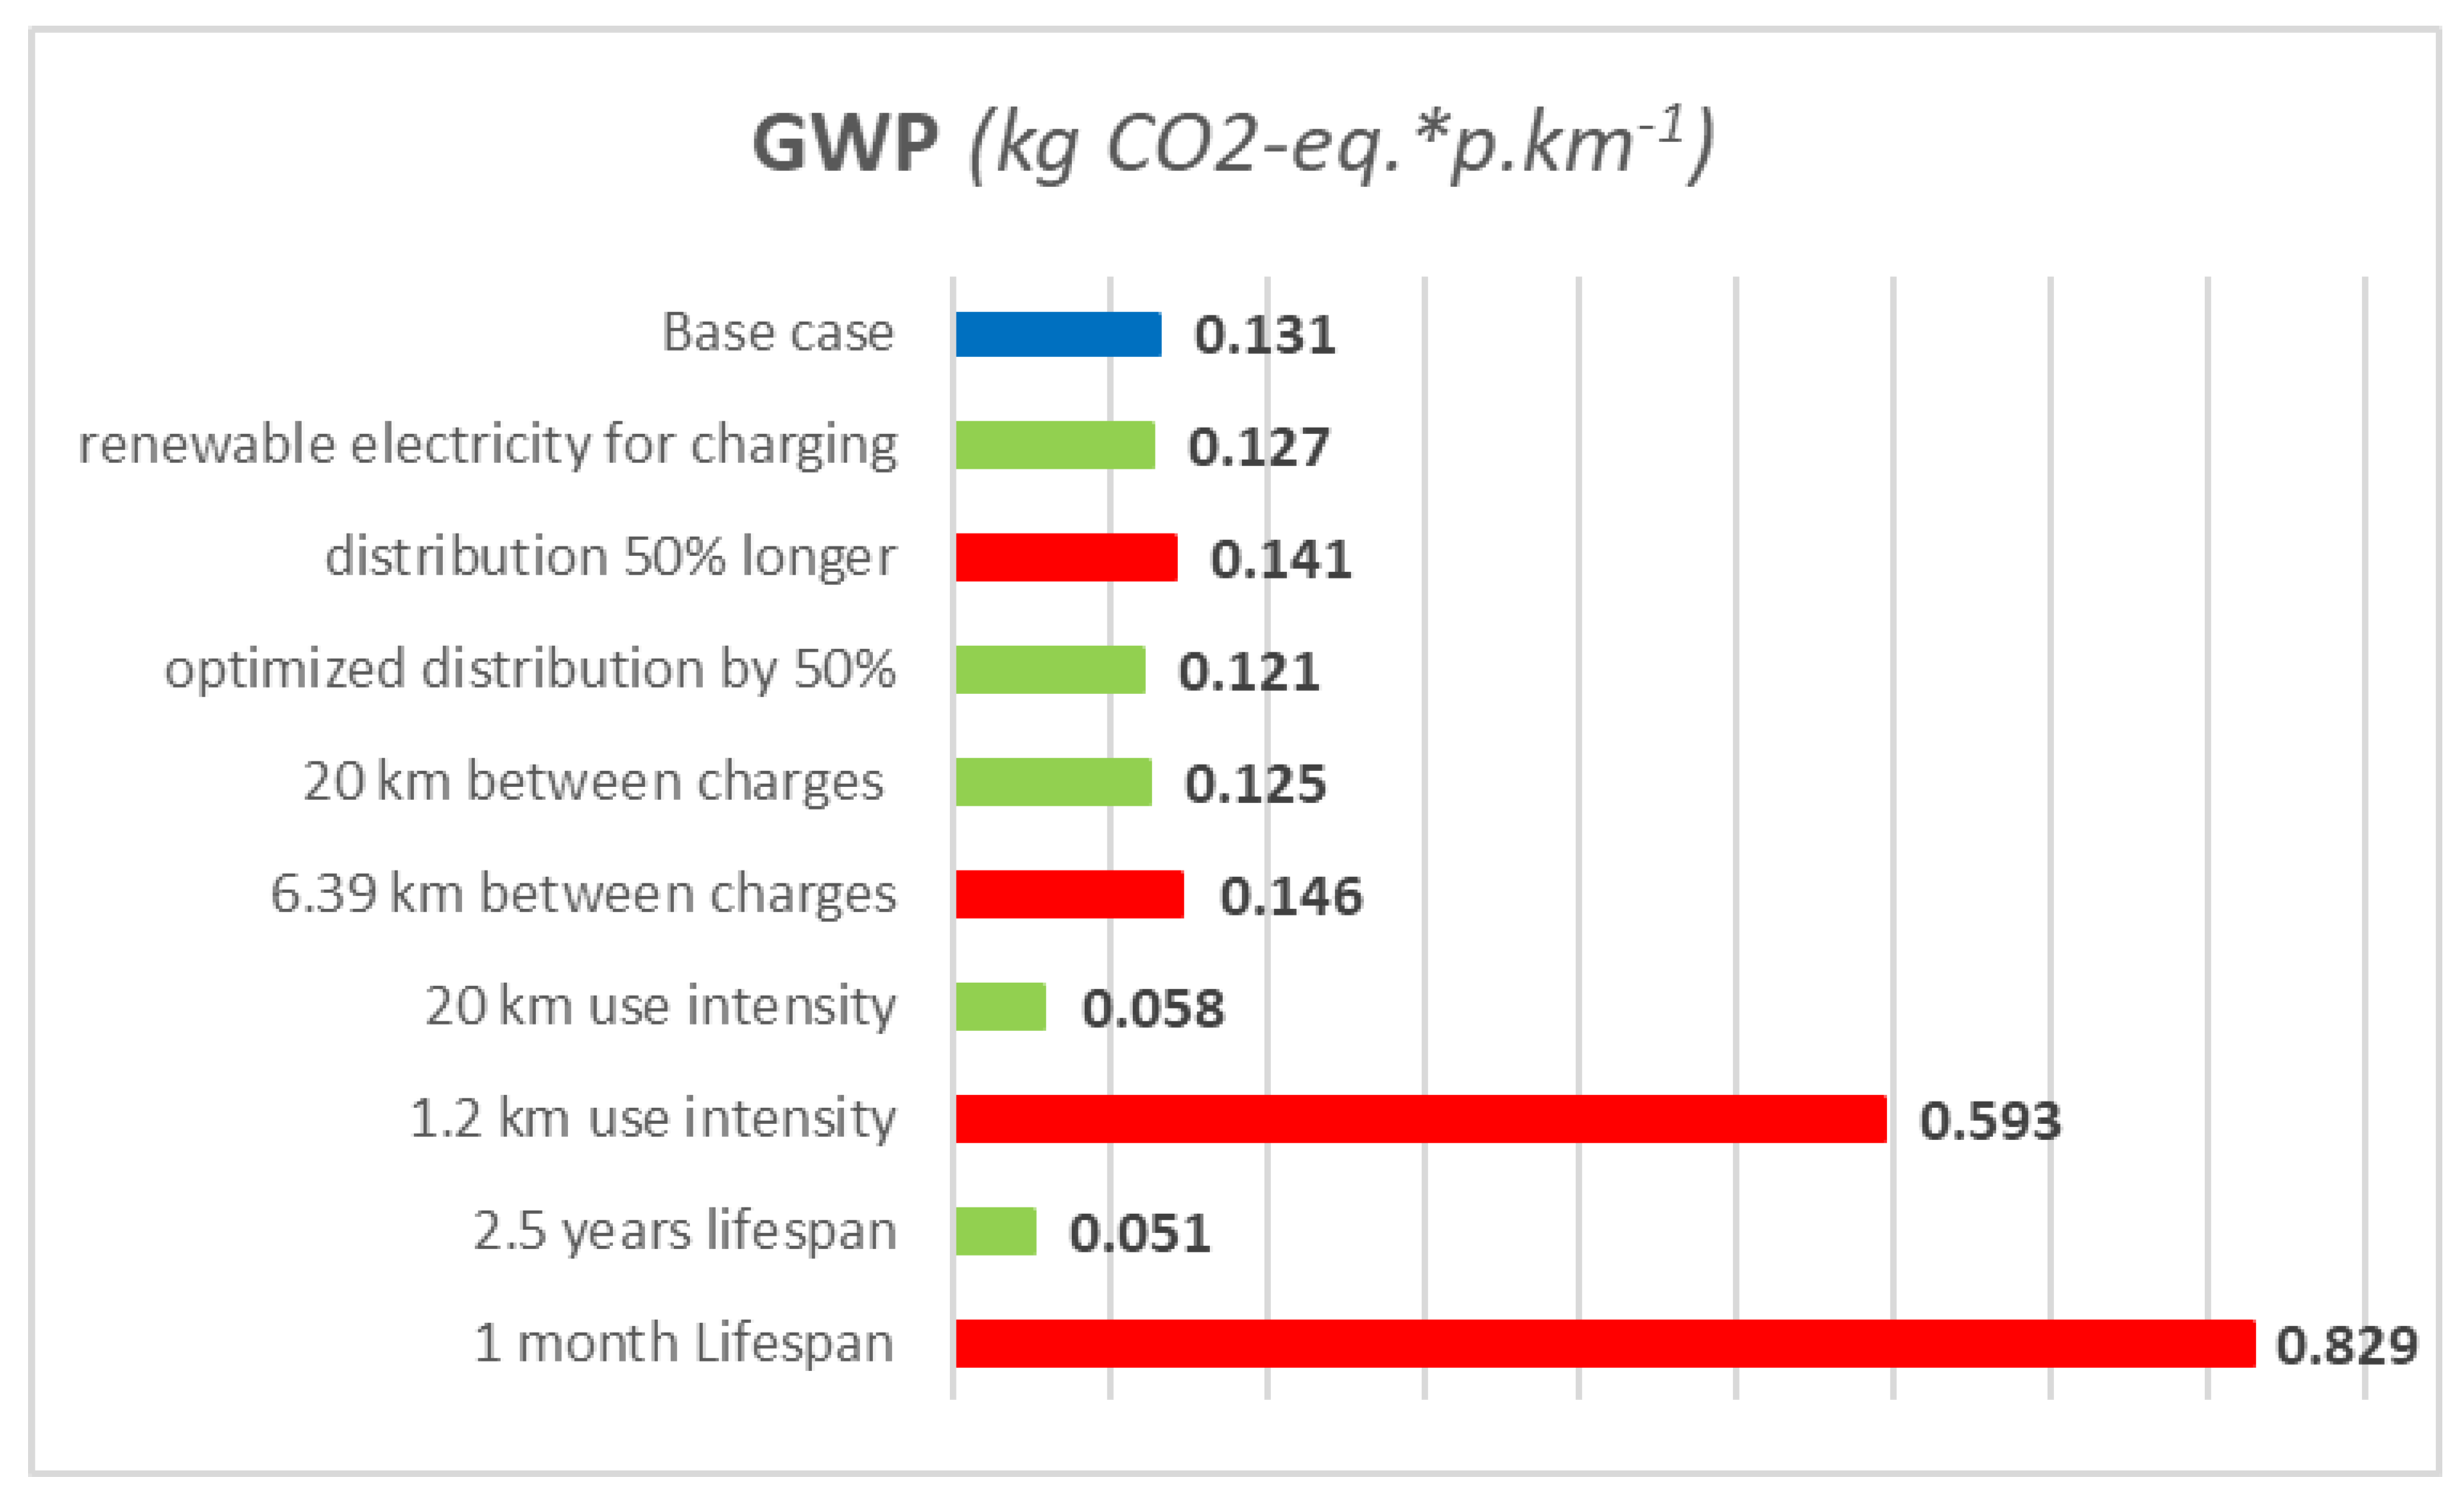
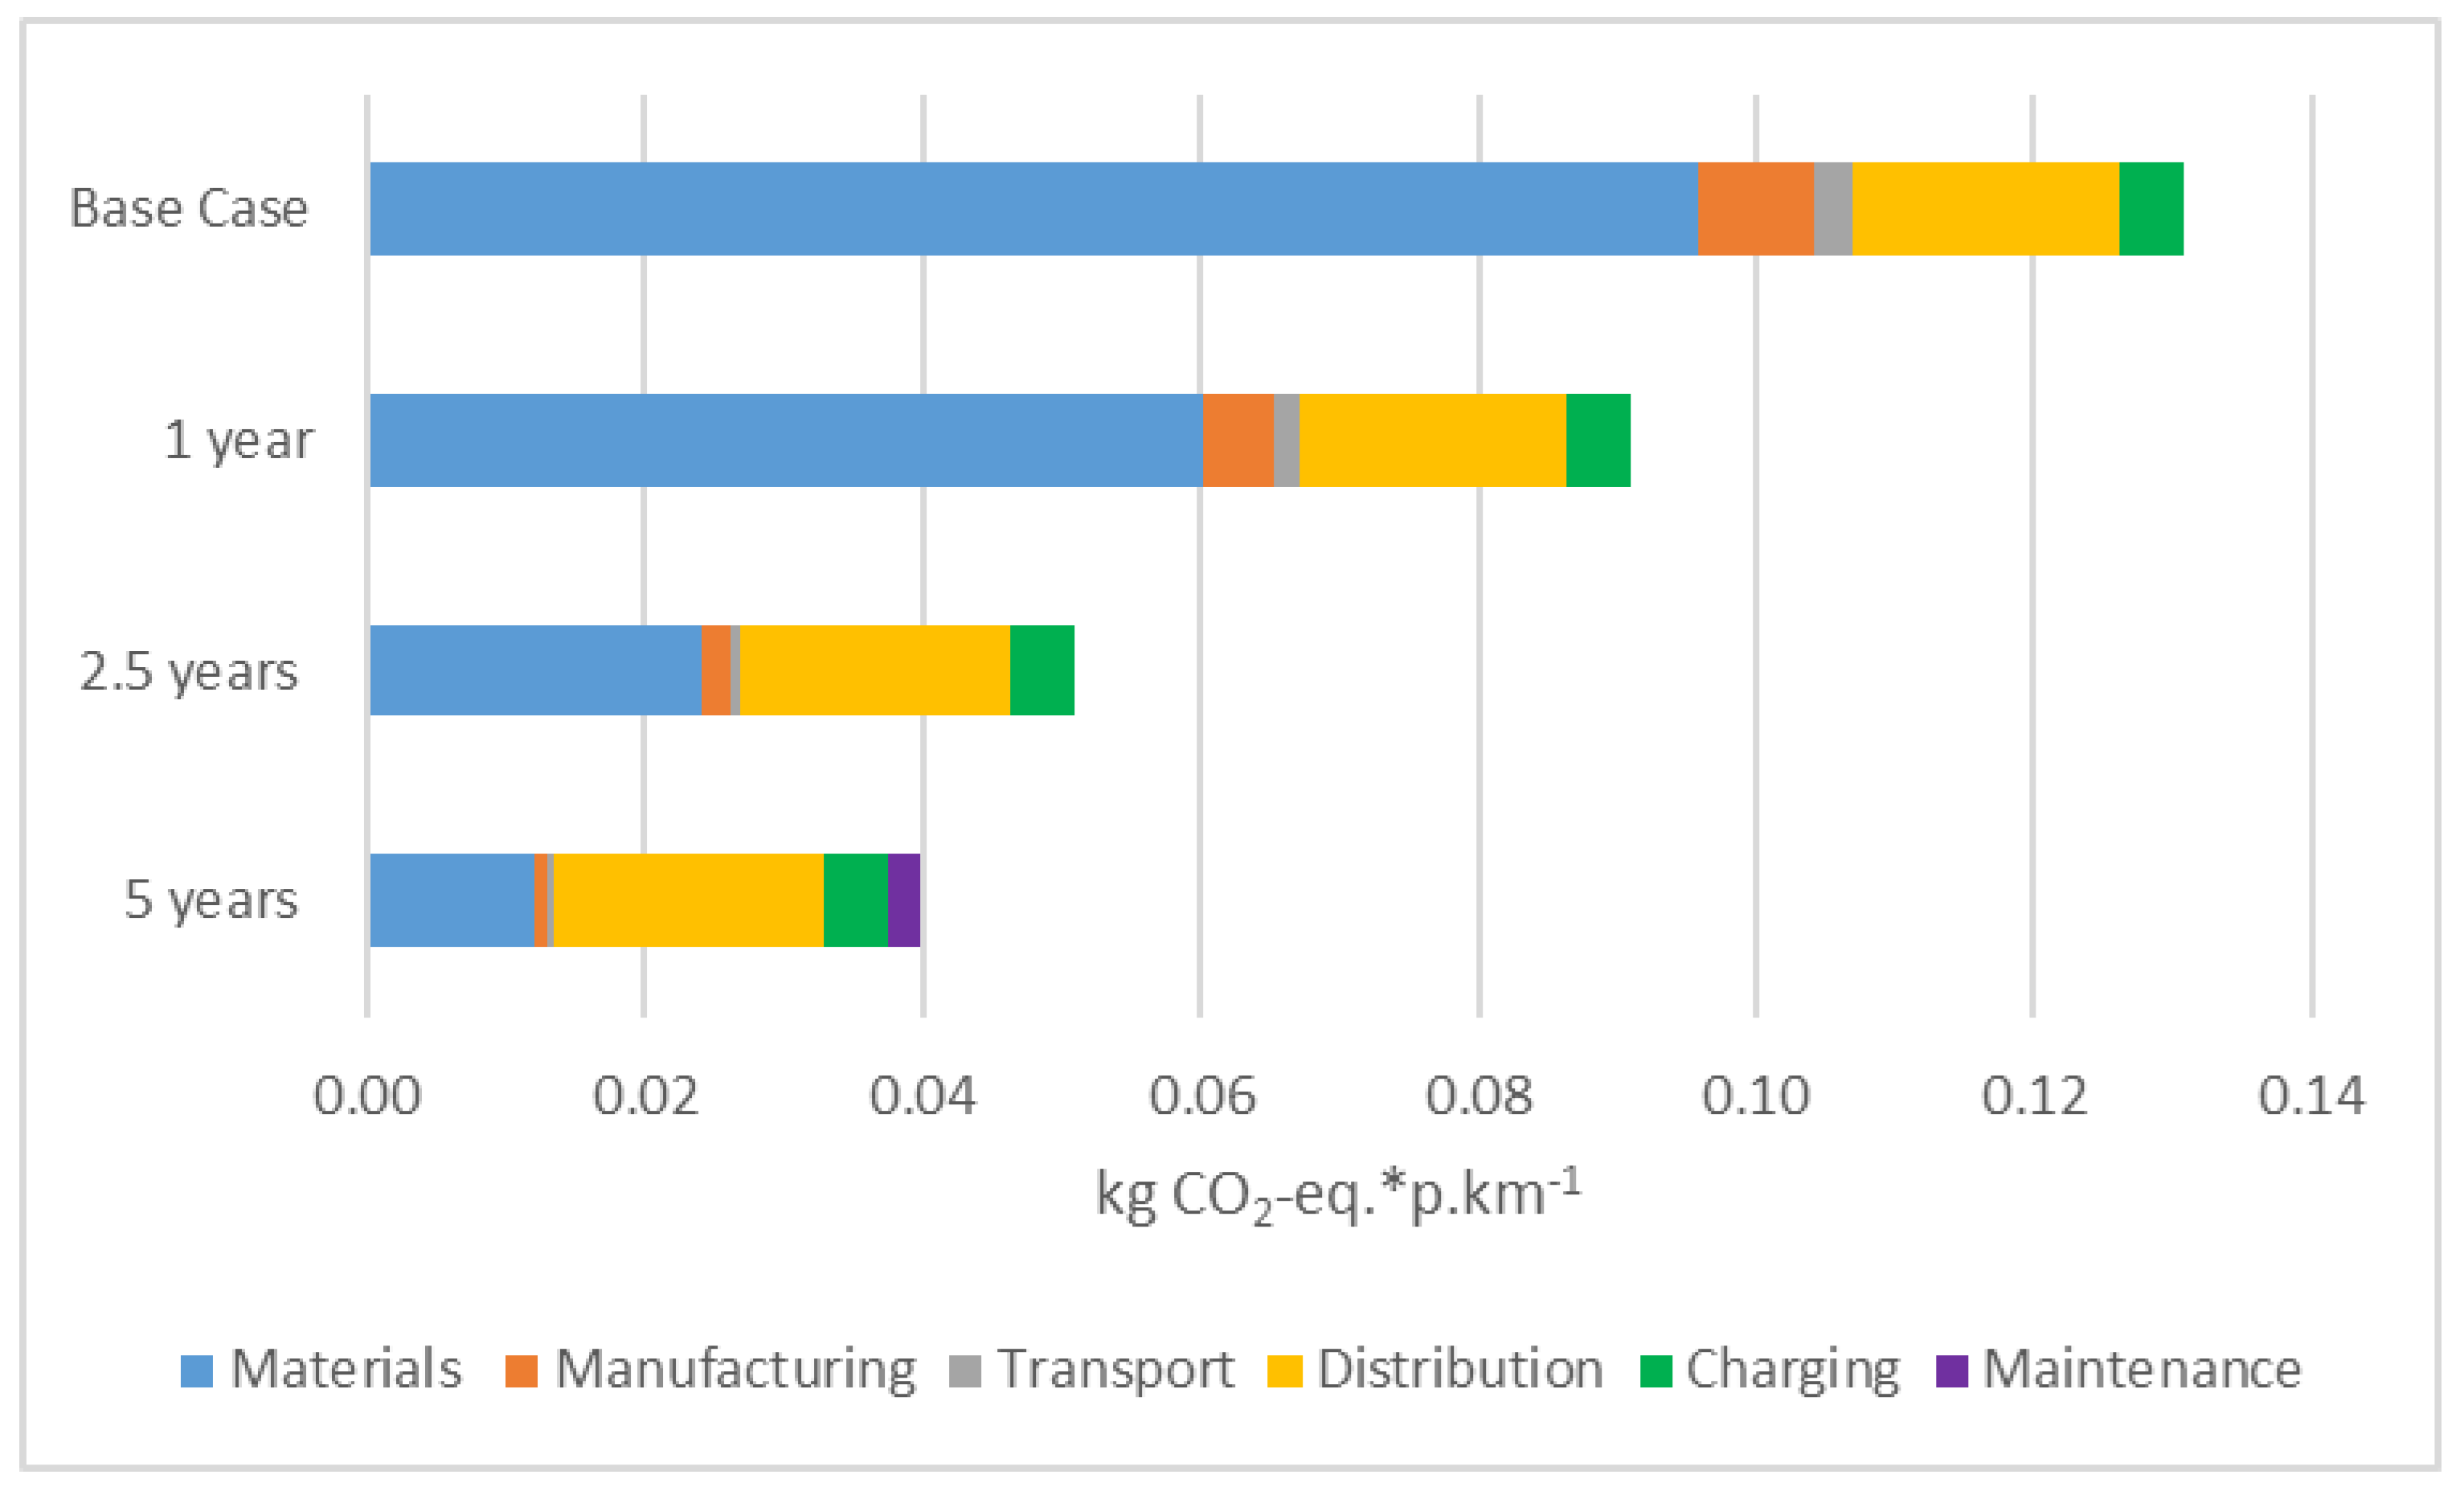
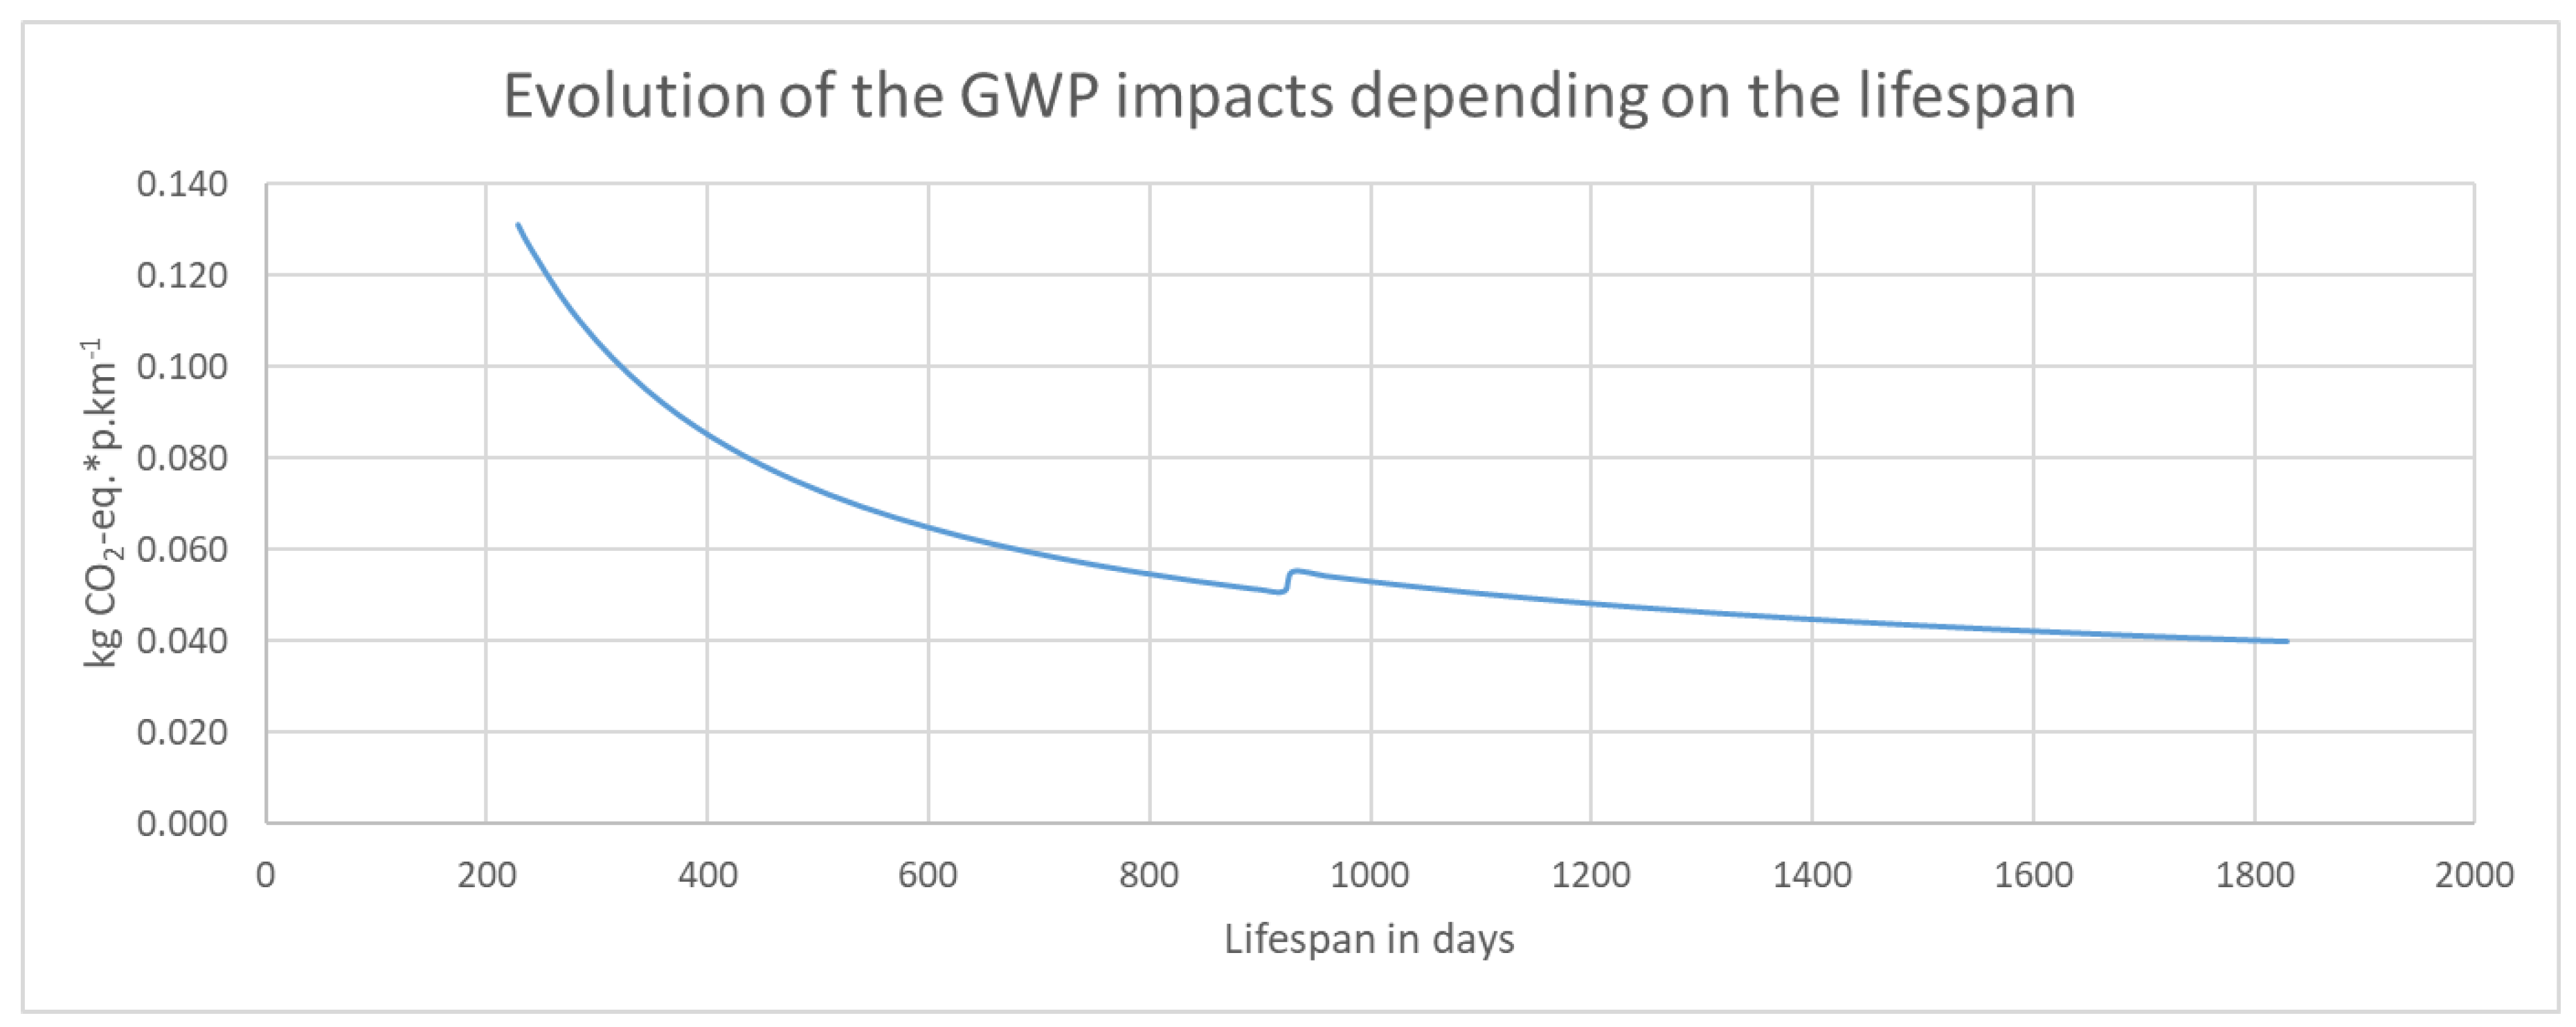
3.1. Sensitivity Analysis
3.2. Contribution Analysis in a Prolonged Lifetime Scenario
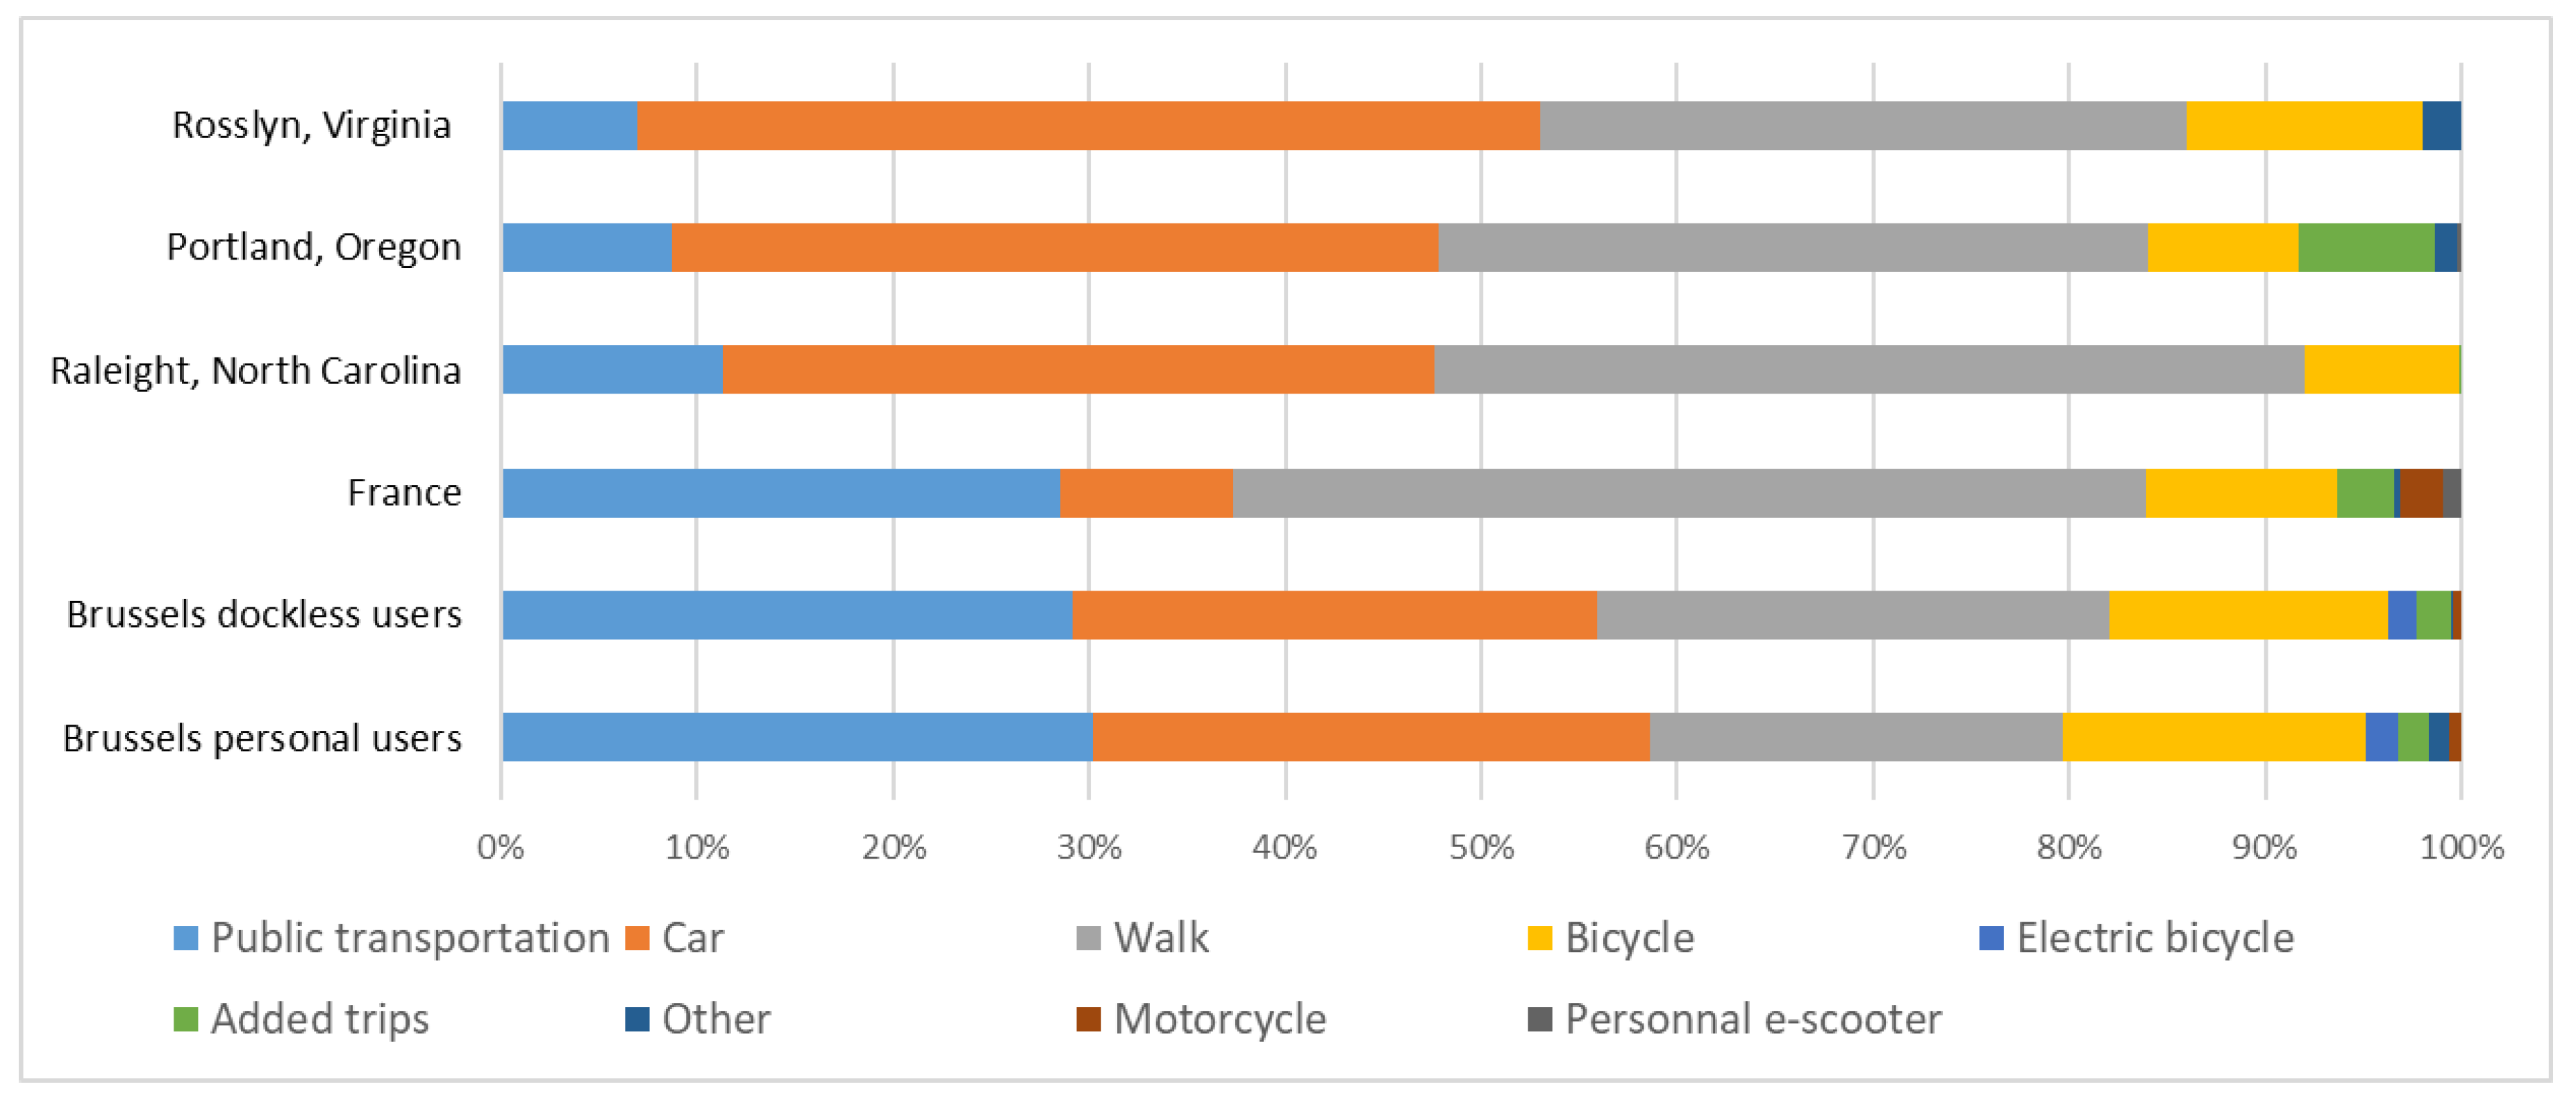
3.3. Comparison with the Displaced Modes of Transport
3.3.1. Brussels Displaced Modal Share
3.3.2. Other Displaced Modal Shares
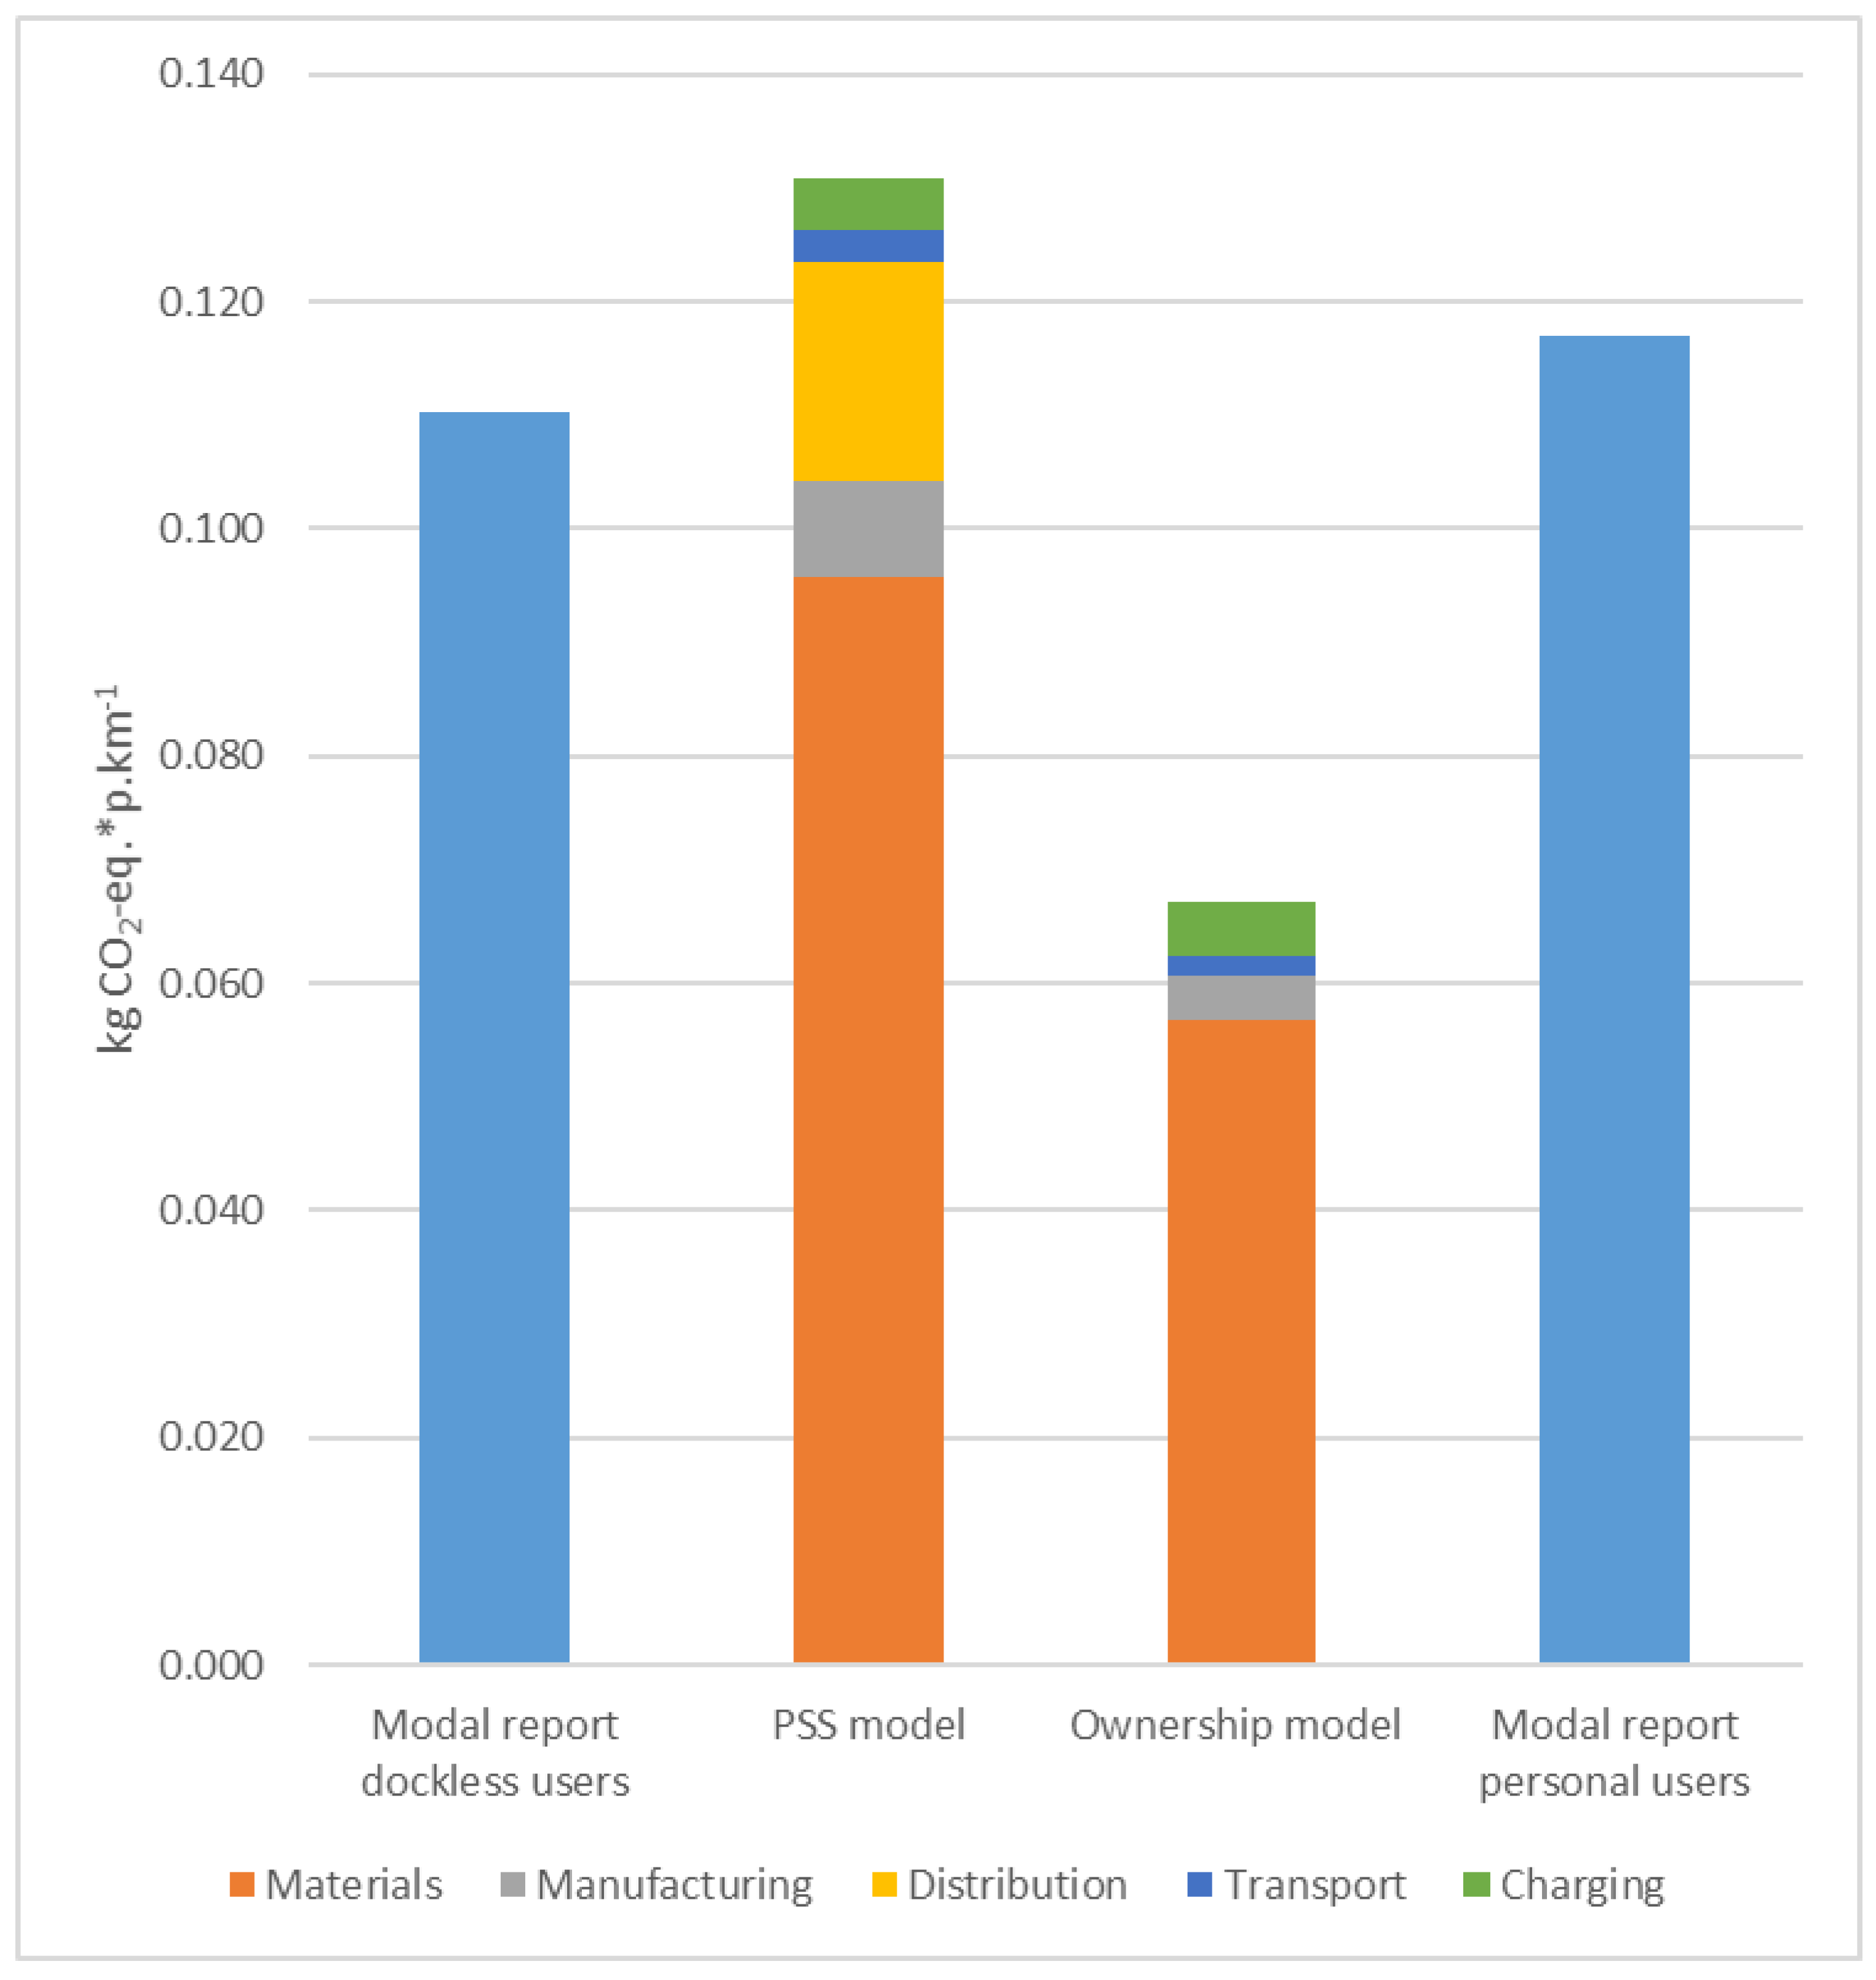
3.4. Comparison between the PSS and an Ownership Model
4. Conclusions
Supplementary Materials
Author Contributions
Funding
Conflicts of Interest
References
- Navigant Total GHG Emissions Worldwide: 53.7 Gt CO2eq. 2017. Available online: https://guidehouse.com/-/media/www/site/downloads/energy/2019/asn_navigant_emissionsflowchart.pdf (accessed on 21 November 2019).
- Mombeek, V.; Degraeve, I. Rapport d’Activités 2018; Bruxelles Environnement: Bruxelles, Belgium, 2019; p. 81. [Google Scholar]
- Tier The 7 Myths about E-Scooter. Available online: https://www.tier.app/wp-content/uploads/The-7-Myths-about-E-Scooters-1.pdf (accessed on 25 November 2019).
- SPRB Bruxelles Mobilité Enquête sur l’usage des Trottinettes Électriques à Bruxelles; Brussels Regional Public Service: Bruxelles, Belgium, 2019; p. 60.
- Pero, F.D.; Delogu, M.; Pierini, M. Life Cycle Assessment in the automotive sector: A comparative case study of Internal Combustion Engine (ICE) and electric car. Procedia Struct. Integr. 2018, 12, 521–537. [Google Scholar] [CrossRef]
- Cox, B.L.; Mutel, C.L. The environmental and cost performance of current and future motorcycles|Elsevier Enhanced Reader. Appl. Energy 2018, 212, 1013–1024. [Google Scholar] [CrossRef]
- Elliot, T.; McLaren, S.J.; Sims, R. Potential environmental impacts of electric bicycles replacing other trnasport modes in Wellington, New Zealand. Sustain. Prod. Consum. 2018, 16, 227–236. [Google Scholar] [CrossRef]
- Oversharing Shared Scooters Don’t Last Long. Available online: https://oversharing.substack.com/p/shared-scooters-dont-last-long (accessed on 21 November 2019).
- Trivedi, T.K.; Liu, C.; Antonio, A.L.M.; Wheaton, N.; Kreger, V.; Yap, A.; Schriger, D.; Elmore, J.G. Injuries Associated with Standing Electric Scooter Use. JAMA Netw. Open 2019, 2, e187381. [Google Scholar] [CrossRef]
- Schlaff, C.D.; Sack, K.D.; Elliott, R.-J.; Rosner, M.K. Early Experience with Electric Scooter Injuries Requiring Neurosurgical Evaluation in District of Columbia: A Case Series. World Neurosurg. 2019, 132, 202–207. [Google Scholar] [CrossRef]
- Brownson, A.B.; Fagan, P.V.; Dickson, S.; Civil, I.D. Electric scooter injuries at Auckland City Hospital. N. Z. Med. J. 2019, 132, 62–72. [Google Scholar]
- Kobayashi, L.M.; Williams, E.; Brown, C.V.; Emigh, B.J.; Bansal, V.; Badiee, J.; Checchi, K.D.; Castillo, E.M.; Doucet, J. The e-merging e-pidemic of e-scooters. Trauma Surg. Acute Care Open 2019, 4, e000337. [Google Scholar] [CrossRef]
- Badeau, A.; Carman, C.; Newman, M.; Steenblik, J.; Carlson, M.; Madsen, T. Emergency department visits for electric scooter-related injuries after introduction of an urban rental program. Am. J. Emerg. Med. 2019, 37, 1531–1533. [Google Scholar] [CrossRef]
- Trivedi, B.; Kesterke, M.J.; Bhattacharjee, R.; Weber, W.; Mynar, K.; Reddy, L.V. Craniofacial Injuries Seen With the Introduction of Bicycle-Share Electric Scooters in an Urban Setting. J. Oral Maxillofac. Surg. 2019, 77, 2292–2297. [Google Scholar] [CrossRef]
- James, O.; Swiderski, J.I.; Hicks, J.; Teoman, D.; Buehler, R. Pedestrians and e-scooters: An initial look at e-scooter parking and perceptions by riders and non-riders. Sustainability 2019, 11, 5591. [Google Scholar] [CrossRef]
- Hollingsworth, J.; Copeland, B.; Johnson, J.X. Are e-scooters polluters? The environmental impacts of shared dockless electric scooters. Environ. Res. Lett. 2019, 14, 084031. [Google Scholar] [CrossRef]
- Stahel, W.R.; Giarini, O. The Limits to Certainty: Facing Risks in the New Service Economy/by Orio Giarini and Walter; Stahel, R., Ed.; Kluwer Academic: Dordrecht, The Netherlands; Boston, MA, USA, 1989; ISBN 978-0-7923-0468-5. [Google Scholar]
- Annarelli, A.; Battistella, C.; Nonino, F. Product service system: A conceptual framework from a systematic review. J. Clean. Prod. 2016, 139, 1011–1032. [Google Scholar] [CrossRef]
- Goedkoop, M.J.; van Halen, C.J.G.; te Riele, H.; Rommens, P. Product Service Systems, Ecological and Economic Basics; Weley: Hoboken, NY, USA, 1999; p. 133. [Google Scholar]
- Li, A.Q.; Kumar, M.; Claes, B.; Found, P. The state-of-the-art of the theory on Product-Service Systems. Int. J. Prod. Econ. 2019, 107491. [Google Scholar] [CrossRef]
- Mont, O.K. Clarifying the concept of product-service system. J. Clean. Prod. 2002, 10, 237–245. [Google Scholar] [CrossRef]
- Bocken, N.M.P.; Mugge, R.; Bom, C.A.; Lemstra, H.-J. Pay-per-use business models as a driver for sustainable consumption: Evidence from the case of HOMIE. J. Clean. Prod. 2018, 198, 498–510. [Google Scholar] [CrossRef]
- Baines, T.S.; Lightfoot, H.W.; Evans, S.; Neely, A.; Greenough, R.; Peppard, J.; Roy, R.; Shehab, E.; Braganza, A.; Tiwari, A.; et al. State-of-the-art in product-service systems. Proc. Inst. Mech. Eng. Part B J. Eng. Manuf. 2007, 221, 1543–1552. [Google Scholar] [CrossRef]
- Tukker, A. Product services for a resource-efficient and circular economy—A review. J. Clean. Prod. 2015, 97, 76–91. [Google Scholar] [CrossRef]
- Geissdoerfer, M.; Vladimirova, D.; Evans, S. Sustainable business model innovation: A review. J. Clean. Prod. 2018, 198, 401–416. [Google Scholar] [CrossRef]
- Tukker, A. Eight types of product—Service system: Eight ways to sustainability? Experiences from SusProNet. Bus. Strategy Environ. 2004, 13, 246–260. [Google Scholar] [CrossRef]
- Barquet, A.P.; Seidel, J.; Seliger, G.; Kohl, H. Sustainability Factors for PSS Business Models. Procedia CIRP 2016, 47, 436–441. [Google Scholar] [CrossRef]
- Kjaer, L.L.; Pigosso, D.C.A.; McAloone, T.C.; Birkved, M. Guidelines for evaluating the environmental performance of Product/Service-Systems through life cycle assessment. J. Clean. Prod. 2018, 190, 666–678. [Google Scholar] [CrossRef]
- Nurhadi, L.; Borén, S.; Ny, H.; Larsson, T. Competitiveness and sustainability effects of cars and their business models in Swedish small town regions. J. Clean. Prod. 2017, 140, 333–348. [Google Scholar] [CrossRef]
- Sousa-Zomer, T.T.; de Cantú, V.Z.; Cauchick Miguel, P.A. Product-Service Systems as sustainable alternatives to mobility: A comparative analysis of two bike-sharing systems. Braz. J. Oper. Prod. Manag. 2016, 13, 264. [Google Scholar] [CrossRef][Green Version]
- Teles, F.; Magri, R.T.G.; Ordoñez, R.E.C.; Anholon, R.; Costa, S.L.; Santa-Eulalia, L.A. Sustainability measurement of product-service systems: Brazilian case studies about electric car-sharing. Int. J. Sustain. Dev. World Ecol. 2018, 25, 722–729. [Google Scholar] [CrossRef]
- Zheng, F.; Gu, F.; Zhang, W.; Guo, J. Is bicycle sharing an environmental practice? Evidence from a life cycle assessment based on behavioral surveys. Sustainability 2019, 11, 1550. [Google Scholar] [CrossRef]
- La Grande Hécatombe des Trottinettes Électriques à Bruxelles. Available online: https://www.rtbf.be/info/regions/detail_la-grande-hecatombe-des-trottinettes-electriques-a-bruxelles?id=10291864 (accessed on 2 December 2019).
- Dal Lago, M.; Corti, D.; Wellsandt, S. Reinterpreting the LCA Standard Procedure for PSS. In Proceedings of the 9th CIRP IPSS Conference—Circular Perspectives on PSS, Copenhagen, Denmark, 19–21 June 2017; Procedia CIRP 64. Volume 64, pp. 73–78. [Google Scholar]
- Chou, C.-J.; Chen, C.-W.; Conley, C. An approach to assessing sustainable product-service systems. J. Clean. Prod. 2015, 86, 277–284. [Google Scholar] [CrossRef]
- PRé Consultants What’s new in SimaPro 8.5. 2018. Available online: https://www.pre-sustainability.com/download/manuals/SimaPro85WhatIsNew.pdf (accessed on 21 November 2019).
- Moreno Ruiz, E.; Valsasina, L.; Fitzgerald, D.; Brunner, F.; Vadenbo, C.; Bourgault, G.; Symeonidis, A.; Wernet, G. Documentation of Changes Implemented in the Ecoinvent Database v3.4; Ecoinvent: Zürich, Switzerland, 2017; p. 42. [Google Scholar]
- Huijbregts, M.; Steinmann, Z.; Elshout, P.M.F.; Stam, G.; Verones, F.; Vieira, M.D.M.; Hollander, A.; Zijp, M.; van Zelm, R. ReCiPe 2016 A Harmonized Life Cycle Impact Assessment Method at Midpoint and Endpoint Level Report I: Characterization; National Institute for Public Health and the Environment: Bilthoven, The Netherlands, 2016; p. 191. [Google Scholar]
- Lebrun, K.; Hubert, M.; Huynen, P.; Patriarche, G. Les Pratiques de Déplacement à Bruxelles: Analyses Approfondis; Cahiers de l’Observatoire de la Mobilité de la Région de Bruxelles-Capitale; Bruxelles Mobilité: Bruxelles, Belgium, 2014; p. 112. [Google Scholar]
- Kesteloot, L.; Verstraeten, F.; Humbert, E.; Org, P. Observatoire du Vélo en Région de Bruxelles Capitale Comptages et Analyse des Données. 2018. Available online: https://provelo.cdn.prismic.io/provelo%2Fb3a50823-cc98-4c08-8ceb-d0ffe8df97d1_obs_rbc_2018_rapport.pdf (accessed on 21 November 2019).
- Hollingsworth, J.; Copeland, B.; Johnson, J.X. Are e-scooters polluters? The environmental impacts of shared dockless electric scooters—Appendices. Environ. Res. Lett. 2019, 14, 084031. [Google Scholar] [CrossRef]
- Xiaomi United States. Available online: https://www.mi.com/us/supports (accessed on 25 November 2019).
- 6t-Bureau de Recherche Usages et Usagers des Trottinettes Électriques en Free-Floating en France; Ademe: Angers, France, 2019; p. 158.
- Portland Bureau of Transportation 2018 E-SCOOTER PILOT User Survey Results; PBOT: Portland, OR, USA, 2018.


| Mode of Transportation Displaced | Dockless Users n = 757 | Personal Users n = 329 |
|---|---|---|
| Public transportation | 29.2% | 30.2% |
| Car | 26.7% | 28.4% |
| Walking | 26.1% | 21.1% |
| Bicycle | 14.2% | 15.5% |
| Electric bicycle | 1.5% | 1.6% |
| Additional trips | 1.8% | 1.5% |
| Other | 0.1% | 1.1% |
| Motorcycle | 0.4% | 0.6% |
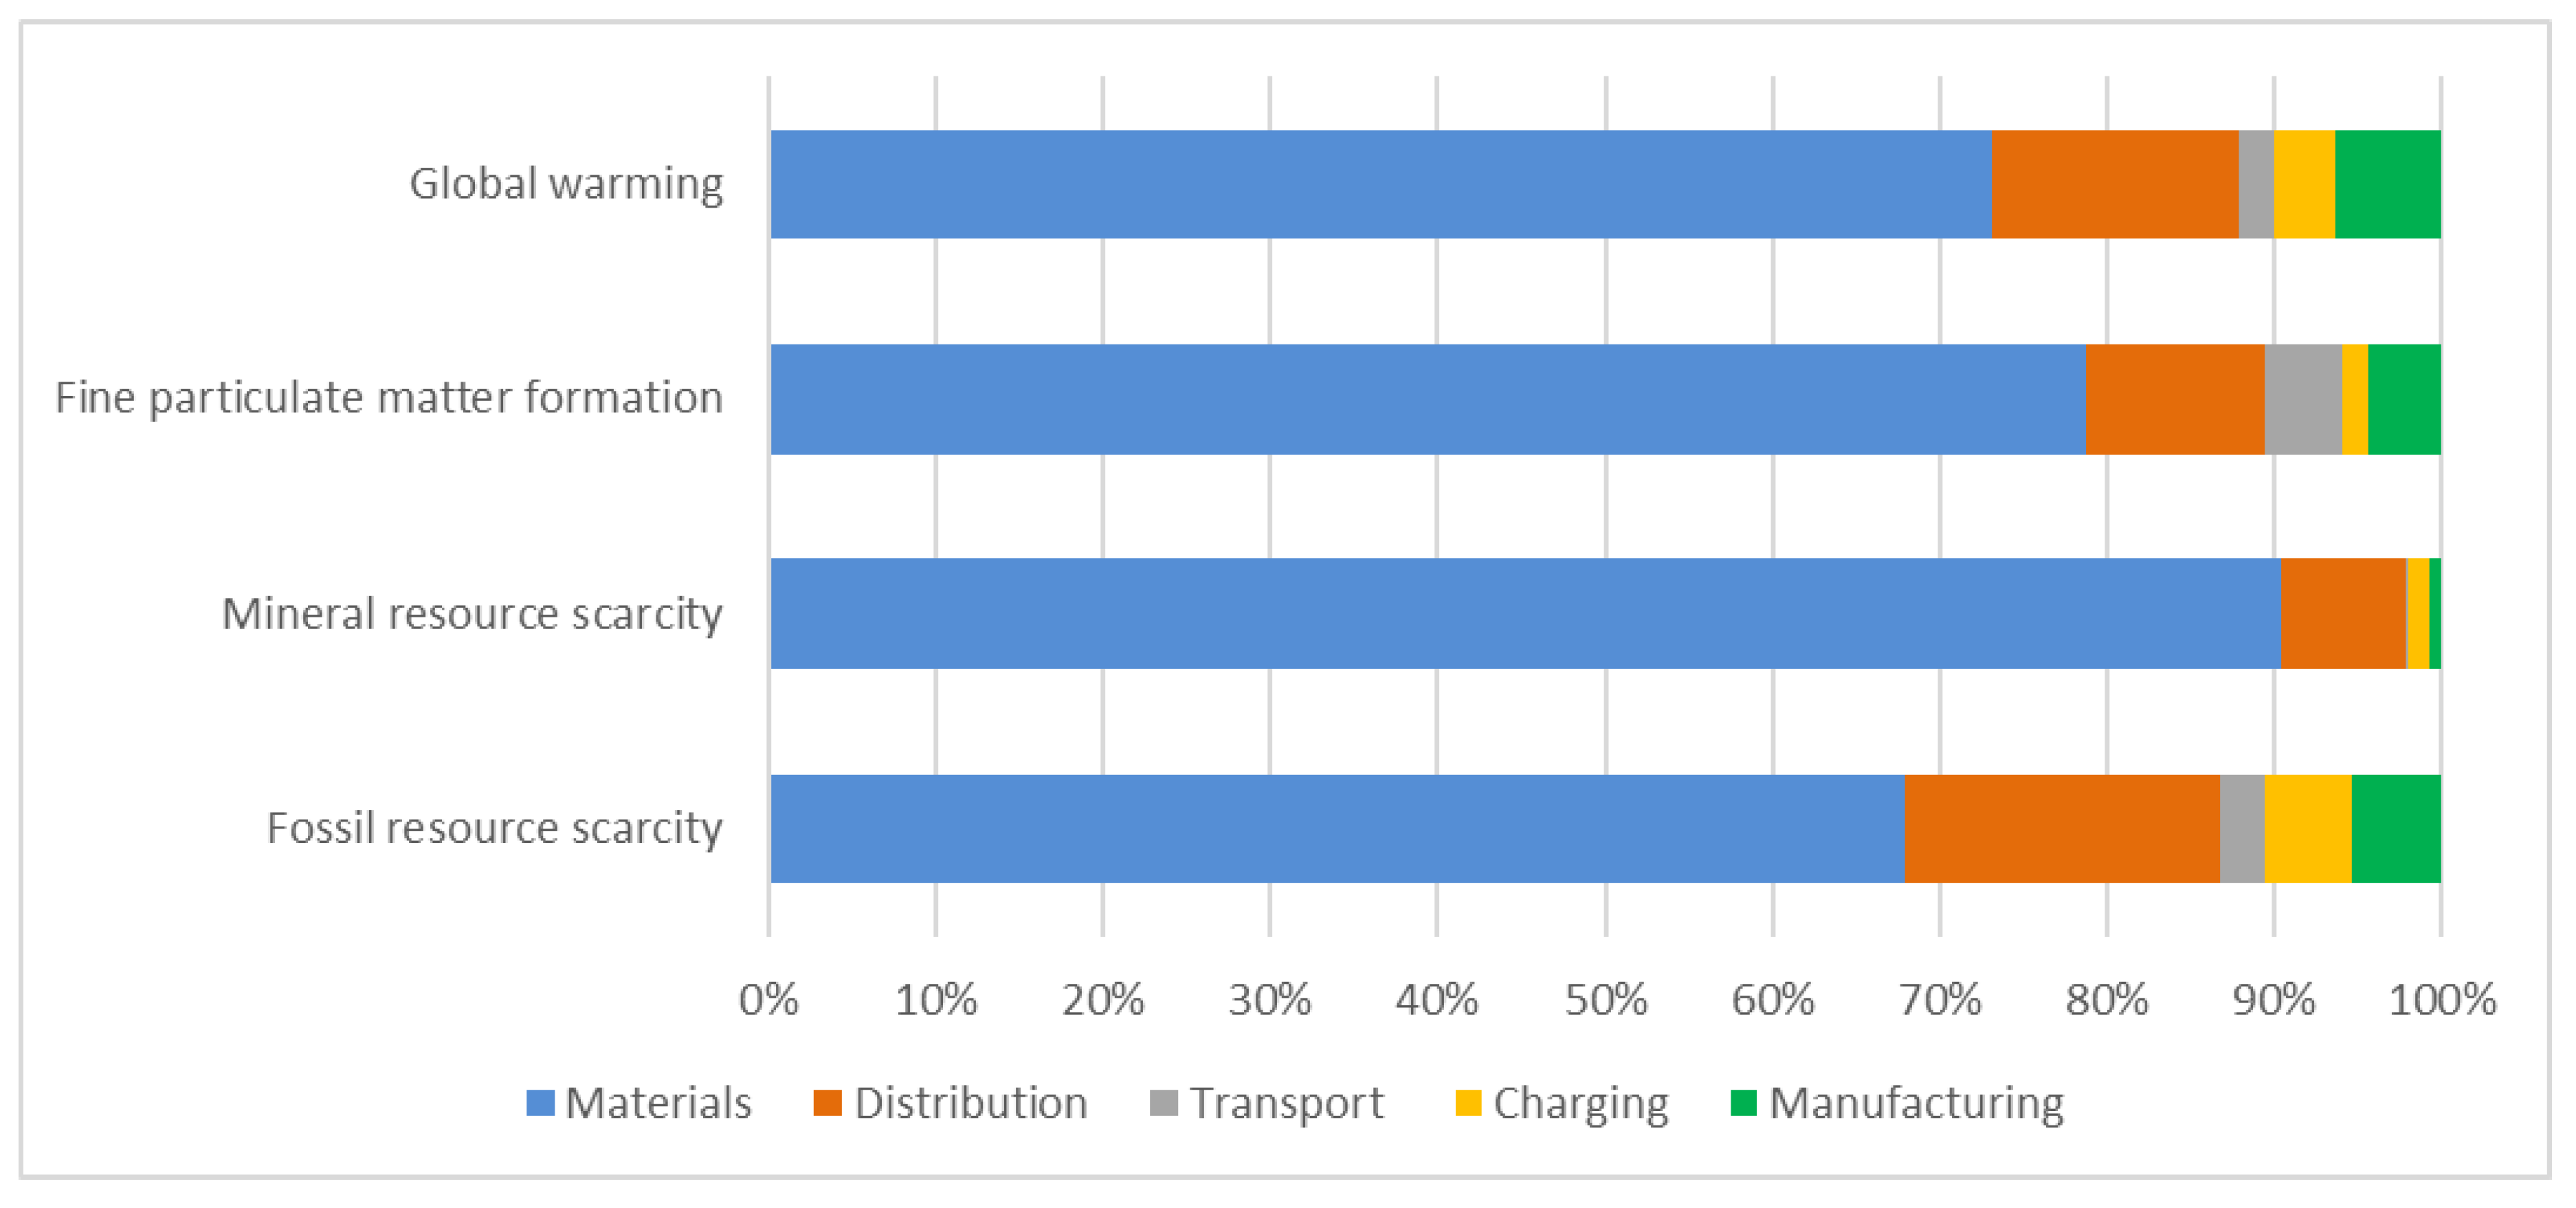
| Impact Category | Total | Materials | Manufacturing | Transport | Distribution | Charging |
|---|---|---|---|---|---|---|
| Global warming (kg CO2 eq.*p∙km–1) | 0.131 | 0.096 | 0.008 | 0.003 | 0.019 | 0.005 |
| Fine particulate matter formation (kg PM2.5 eq.*p∙km−1) | 2.96 × 10⁻⁴ | 2.33 × 10⁻⁴ | 1.29 × 10⁻⁵ | 1.38 × 10⁻⁵ | 3.15 × 10⁻⁵ | 4.54 × 10⁻⁶ |
| Mineral resource scarcity (kg Cu eq.*p∙km−1) | 1.97 × 10⁻³ | 1.78 × 10⁻³ | 1.39 × 10⁻⁵ | 3.46 × 10⁻⁶ | 1.49 × 10⁻⁴ | 2.41 × 10⁻⁵ |
| Fossil resource scarcity (kg oil eq.*p∙km−1) | 3.16 × 10⁻² | 2.15 × 10⁻² | 1.71 × 10⁻³ | 8.77 × 10⁻⁴ | 5.94 × 10⁻³ | 1.61 × 10⁻³ |
| Impact Category | Unit | Base Case | Modal Share | 1 Year | 2.5 Years | 5 Years |
|---|---|---|---|---|---|---|
| Global warming | kg CO2 eq. | 0.131 | 0.110 | 0.091 | 0.051 | 0.040 |
| Fine particulate matter formation | kg PM2.5 eq. | 2.96 × 10⁻⁴ | 1.44 × 10⁻⁴ | 1.99 × 10⁻⁴ | 1.01 × 10⁻⁴ | 7.6 × 10⁻⁵ |
| Mineral resource scarcity | kg Cu eq. | 1.97 × 10⁻³ | 5.76 × 10⁻⁴ | 1.30 × 10⁻³ | 6.24 × 10⁻⁴ | 4.66 × 10⁻⁴ |
| Fossil resource scarcity | kg oil eq. | 3.16 × 10⁻² | 3.43 × 10⁻² | 2.26 × 10⁻² | 1.36 × 10⁻² | 1.12 × 10⁻² |
© 2020 by the authors. Licensee MDPI, Basel, Switzerland. This article is an open access article distributed under the terms and conditions of the Creative Commons Attribution (CC BY) license (http://creativecommons.org/licenses/by/4.0/).
Share and Cite
Moreau, H.; de Jamblinne de Meux, L.; Zeller, V.; D’Ans, P.; Ruwet, C.; Achten, W.M.J. Dockless E-Scooter: A Green Solution for Mobility? Comparative Case Study between Dockless E-Scooters, Displaced Transport, and Personal E-Scooters. Sustainability 2020, 12, 1803. https://doi.org/10.3390/su12051803
Moreau H, de Jamblinne de Meux L, Zeller V, D’Ans P, Ruwet C, Achten WMJ. Dockless E-Scooter: A Green Solution for Mobility? Comparative Case Study between Dockless E-Scooters, Displaced Transport, and Personal E-Scooters. Sustainability. 2020; 12(5):1803. https://doi.org/10.3390/su12051803
Chicago/Turabian StyleMoreau, Hélie, Loïc de Jamblinne de Meux, Vanessa Zeller, Pierre D’Ans, Coline Ruwet, and Wouter M.J. Achten. 2020. "Dockless E-Scooter: A Green Solution for Mobility? Comparative Case Study between Dockless E-Scooters, Displaced Transport, and Personal E-Scooters" Sustainability 12, no. 5: 1803. https://doi.org/10.3390/su12051803
APA StyleMoreau, H., de Jamblinne de Meux, L., Zeller, V., D’Ans, P., Ruwet, C., & Achten, W. M. J. (2020). Dockless E-Scooter: A Green Solution for Mobility? Comparative Case Study between Dockless E-Scooters, Displaced Transport, and Personal E-Scooters. Sustainability, 12(5), 1803. https://doi.org/10.3390/su12051803