Article

A Contribution to a UHS-Based Seismic Risk Assessment in Croatia—A Case Study for the City of Osijek

by
Gordana Pavić
1,
Marijana Hadzima-Nyarko
1,* and
Borko Bulajić
2
1
Faculty of Civil Engineering and Architecture Osijek, Josip Juraj Strossmayer University of Osijek, Vladimira Preloga 3, 31000 Osijek, Croatia
2
Faculty of Technical Sciences, University of Novi Sad, Trg Dositeja Obradovića 6, 106 314 Novi Sad, Serbia
*
Author to whom correspondence should be addressed.
Sustainability 2020, 12(5), 1796; https://doi.org/10.3390/su12051796
Submission received: 18 December 2019 / Revised: 6 February 2020 / Accepted: 19 February 2020 / Published: 27 February 2020
(This article belongs to the Special Issue Seismic Vulnerability Assessment at Urban Scale)

Abstract

:
Due to increases in the number of inhabitants and their concentrations in densely populated areas, there is a growing need in modern society to be cautious towards the impact of catastrophic natural events. An earthquake is a particularly major example of this. Knowledge of the seismic vulnerability of buildings in Europe and around the world has deepened and expanded over the last 20 years, as a result of the many devastating earthquakes. In this study, a review of seismic risk assessment methods in Croatia was presented with respect to the hazard, exposure, and vulnerability of buildings in the fourth largest city (Osijek) in Croatia. The proposed algorithm for a detailed risk assessment was applied to a database and is currently in its initial stage.

1. Introduction

Every year, the number of disasters around the world increases, causing more damage and deaths. Earthquakes, floods, landslides, and other natural disasters cause irreparable damage, often endangering the lives of people, cultures, material resources, and the environment [1,2]. Recently, the number of natural disasters has been on the rise, with earthquakes, in particular. Their consequences have become more severe, including damage to buildings, infrastructure, technology, and whole societies [3,4,5,6].
Earthquakes cause more harm and affect more victims in a short period of time than any other natural force. The devastating power of seismic events exposes certain weaknesses in urban environments, as seen in recent earthquake-related disasters in Kobe (M = 7.3, 1995 Japan), Izmit (M = 7.6, 1999 Turkey), Boumerds (M = 6.7, 2003 Algeria), Kashmir (M = 7.6, 2005 Pakistan), Sichuan (M = 7.9, 2008 China), and Haiti (M = 7.0, 2010 Haiti).
In order to reduce the impact of earthquakes on engineering structures, a logical approach and an assessment of earthquakes’ effects on buildings—and more importantly, on people—is needed. With this aim, various methods were developed to estimate earthquake risk as accurately as possible [7,8,9]. An earthquake’s risk is measured in its potential damage to buildings and other structures, as well as the number of people expected to be injured or killed in the area under observation. The first step in the seismic risk assessment process is to estimate the earthquake hazard (earthquakes with probable intensity in a given geographical area). Then, based on the available data from the exposure model, evaluate the damage using one of the existing vulnerability assessment methods in order to estimate the losses. These losses can be assessed in a material form, through the damage of the building stock or non-structural elements of buildings, or in the form of casualties or injuries during the earthquake [10,11]. The last step is to analyze uncertainties, costs, decision-making criteria, etc. The ultimate goal of studying earthquakes and their impact on people and buildings is to create a safer environment, in case an earthquake occurs.
The basic elements of the earthquake risk assessment process are shown in Figure 1.
Croatia is located on a Mediterranean-trans-Asian belt that is seismically active. Two earthquake zones stand out: the coastal area and the northwestern continental part. The coastal area spreads from the border with Slovenia to Senj, with interruptions near Šibenik and Split, all the way to Dubrovnik and its surroundings (a very strong seismic area).
The first recorded earthquake in Croatia occurred in 361 AD when the town of Cissa on the island of Pag completely collapsed into the sea. The second major historical earthquake occurred in 1667, and it completely demolished the city of Dubrovnik. According to descriptions of these two earthquakes, it can be concluded that the intensity was X-XII degrees on the Mercalli-Cancani-Sieberg (MCS) scale. In the recent history of Croatia, the most important earthquake occurred in 1996 in Ston, and its intensity was as high as IX degrees, according to the MCS scale.
According to the National Protection and Rescue Directorate of Croatia (2013), 56.22% of Croatian territory, inhabited by more than 30% (1,633,529) of the total current population, is characterized as a zone with a high risk of earthquakes occurrence.
The first study published to include a seismic risk assessment in Croatia was done for the City of Zagreb in 1992 [12]. A seismological map published in 1987 for a return period equal to 500 years was used to determine the size of the earthquake hazard according to the regulations at the time. Risk assessment was made for the VIII° of the MSK-64 (Medvedev-Sponheuer-Karnik) scale, while a maximum acceleration of 2.0 m/s2 (or 0.2 g) was estimated for the entire area using an earthquake duration of 15 seconds and a narrower city area with a population of about 700,000, without taking into account differences in local ground properties. The above-mentioned population estimate can today be considered questionable due to increases in the number of buildings and people in the capital since 1990.
Earthquake risk assessments should be of particular interest to the national authorities as they implement new policies (assessments of capabilities, capacities, implementation of strategies, etc.). A key obstacle to reliable earthquake risk assessments in Croatia is the lack of a database of the buildings.
Two key elements of a reliable risk assessment are seismic hazard analysis and building vulnerability analysis. Both of these can bring uncertainty into the final risk estimates. For example, deep geological formations beneath sites are not usually considered in the creation of seismic hazard maps, which can lead to underestimated hazard levels in certain cases, as we have discussed further on.
Although a greater focus has been placed on seismic hazards and vulnerability assessment in the scientific articles researched so far, very little attention has been paid to seismic exposure and the relationship it has with assessing seismic vulnerability. Widespread uncertainty in seismic risk assessment accumulates from the input and modeling techniques used. Even if the scale of uncertainty caused by seismic hazard components has been studied well, the total uncertainty will increase according to the seismic vulnerability component. However, insufficient attention is given to the uncertainty caused by the components of seismic exposure. Key building data has not been well defined for accurate vulnerability assessment, and, in this article, the most relevant parameters of buildings have been emphasized.

2. Proposed Methodology

The introduction highlights the need to create a reliable estimating model of earthquake losses that will cover all possible scenarios that arise during and after an earthquake. To contribute to the improvement of seismic risk assessment for civil engineering structures, we proposed an algorithm shown in Figure 2. The basic concept of the algorithm is seismic hazard evaluation, vulnerability assessment of civil engineering structures, and earthquake risk assessment. In order to carry out a seismic hazard evaluation, it is necessary to have the required documentation of the local ground, seismicity of the area and other parameters that affect the foreseen movement of the ground surface, the state of the building, and the possible earthquake-induced damage.
The seismic hazard evaluation has to be focused on the creation of the design earthquake spectra that would be more reliable than the ones that are currently proposed by EC8, as well as on the creation of the reliable artificial strong-motion time histories that shall be used as seismic input in the case of nonlinear structural analyses. Here, the major focus should be also on the definition of the design ground types and deep geology types and on the effects of the deep geology and local soil (shallow geology) on surface ground motion. Furthermore, one of the focuses of future investigations should be the influence of the local ground type and deep geological site surroundings on the temporal and spatial distribution of the vibration-induced damages in civil engineering structures.
Although in recent years, several different approaches have been developed in the world in order to estimate the seismic risk for whole countries or larger cities, all of those approaches are examples of very detailed studies that require large number of data (in particular, a detailed building database), which are not available in all countries, including Croatia. Therefore, the creation of a database for a representative urban area would be an essential contribution because it is assumed that the dominant building typologies are similar in other cities of the country.
A better estimation of seismic vulnerability and risk of masonry structures correlates with improved safety of people worldwide, as the majority of the world population still inhabits masonry structures. Moreover, defining low and high-risk building zones would contribute to urban planning and town planning decision-making.
Based on the data of masonry structures damaged during historical earthquakes, as well as on results of experimental and/or analytical testing of new masonry materials and various seismic protection technologies for masonry structures and related publications, the vulnerability curves for different types of masonry structures should be developed.
Choosing a method of seismic assessment should take into consideration the (un)availability of input parameters of the building database, as well as due to the advantages and disadvantages of certain methods. The types of methods, advantages, and disadvantages of individual methods and the chosen vulnerability method for the proposed methodology are presented in Chapter 4.
Based on the assessment of vulnerability and on the estimation of the level of hazard, the earthquake loss estimation can be carried out. In this part of the methodology, the following will be taken into account: probabilistic evaluation of seismic hazard and creation of uniform hazard spectra (UHS) spectra, risk assessment of buildings constructed in compliance with older codes (for the seismic-resistant design), and risk assessment for buildings constructed in compliance with Eurocode 8.

3. The Seismic Hazard Evaluation

Probabilistic seismic hazard assessment (abbreviated as PSHA) is used to estimate the probabilities of experiencing a certain value of the selected ground motion parameter and considers contributions of all plausible earthquakes that can occur in an analyzed area during the estimated life period of the analyzed building.
Firstly, all possible seismic sources in the vicinity of the analyzed site should be defined. After defining the geometry of the source zones and their average hypocentral depths, it is necessary to define the expected rates of occurrence for earthquakes of different magnitudes for all seismic events for which it is reasonable to expect that they will occur during a certain time period. The rates of occurrence are defined based on the data on past earthquakes, usually by the least square regression analyses. The data on the seismicity of Croatia and of a wider region, including the neighboring countries, can be found, respectively, in the Croatian Earthquake Catalog [13,14] and the BSHAP2 catalog (Harmonization of Seismic Hazard Maps in the Western Balkan Countries Project) [15].
The territory of Croatia is characterized by large variations in seismicity. In fact, there are high seismicity regions, such as the southeast and northwest parts of Croatia, and other areas that are characterized by a rare occurrence of important seismic events, such as the Eastern part of Croatia, i.e., the Pannonian Basin, where the city of Osijek is located [16].
After the seismic source zones are defined, the next step in a PSHA analysis is to predict the severity of strong motion at certain distances from the hypocenter, i.e., to define the so-called attenuation equations. The attenuation equations can be used to predict values of various ground motion parameters, like macroseismic intensity, peak ground acceleration (PGA), response spectra, and strong motion duration. Such equations represent functions of the earthquake size, source-to-site distance, and sometimes also some other factors, which affect ground motion at the analyzed site (mechanism of the earthquake source, path effects for seismic waves, deep geology, local soil characteristics, etc). For the creation of a regional attenuation equation, a series of real ground motion time histories (recorded in that region) are needed. By using a sufficiently large number of such regional data, it is possible to derive the regional attenuation equation.
Finally, to estimate the seismic hazard at the analyzed site, in a PSHA analysis, the attenuation equations are used to estimate the ground motion, and contributions from all considered seismic source zones are integrated over all possible magnitudes and all possible distances within the boundaries of the source zones, and then summed up.
In the first seismic design code that was implemented in ex-SFRY (Socialist Federal Republic of Yugoslavia) in 1964 [17], the 1950 Seismic Zoning Map was used. The 1950 map was compiled based on the largest macro-seismic intensities that were observed at the time. In 1982, a temporary seismic zoning map, also compiled based on the largest observed intensities, was used together with a new seismic design code [18]. In 1990, a new seismic zoning map for the return period equal to 500 years was added to the new design code [19]. This map was the first that was compiled by using a PSHA approach, with the seismic hazard still expressed through the seismic intensity degrees and estimated by considering the average ground conditions. Values from the 1990 map were used for the design of buildings that belonged to classes I and II, i.e., for residential buildings, schools, hotels, museums, movie theaters, etc. [19].
Recently, new seismic hazard maps have been compiled for Croatia [20], also based on the PSHA approach, with the seismic hazard now being represented by PGA (peak ground acceleration) values. These maps were intended for use in the earthquake-resistant design along with Eurocode 8 [21](EC8) spectra. Hence, these maps were adopted in the Croatian National Annex to EC8 [22]. In compliance with EC8, the two maps have been compiled, one for the PGA values with the return period equal to 95 years, i.e., with the 10% probability of exceedance in 10 years, and the second for the PGA values with the return period equal to 475 years, i.e., with the 10% probability of exceedance in 50 years. The 95 years map corresponds to the EC8 so-called “damage limitation” requirement, while the 475 years map corresponds to the “no-collapse” requirement. Both maps represent seismic action for the ground type A, defined in EC8 as the “rock or similar geological formations (including at most 5 m of a weaker material at the surface) with the average shear wave velocity in the top 30 m greater than 800 m/s”.
In EC8 Article 3.2.2.2, elastic response spectra represent the pseudo absolute acceleration for a natural vibration period, T, between 0 and 4 sec, and with viscous damping. Spectral acceleration is equal to the PGA for T = 0. The whole spectrum is to be multiplied by the so-called soil factor, S, which depends on the spectrum type (Type 1 and Type 2) and ground type (A, B, C, D, or E) [22]. In EC8, spectral acceleration also depends on the earthquake magnitude “that contribute most to the seismic hazard defined for the purpose of probabilistic hazard assessment”, i.e., on whether or not this magnitude is equal to more than 5.5 (Type 1 spectra) or smaller than 5.5 (Type 2 spectra).
Table 1 shows seismic intensity degrees for the five most populated cities in Croatia, which were shown in 1950, 1982, and 1990 seismic zoning maps. Table 2 shows the PGA values corresponding to the 1990 maps for the return periods equal to 100 and 500 years, as well as the PGA values shown in most recent seismic hazard maps. For the 1990 maps, the PGA values were estimated by using an empirical equation (log10(acc) vs. I (°MCS)) developed for the north-western Balkans [23]. The table shows ranges that represent empirical PGA estimates for a median minus one and median plus one standard deviation. Moreover, Table 2 also shows the PGA values from the newest maps, which are multiplied by the largest S factor. For the city of Osijek, we used the value for Type 2 spectra and ground type D, S = 1.8, while for the other four cities, we used the values for Type 1 spectra and ground type E, S = 1.4.
PGA estimates derived from the corresponding seismic intensities are in fair agreement with the values that are obtained from the newest hazard maps. For the city of Osijek, these values are in exceptionally good agreement.
Here, we should note that none of the newest maps consider the features of the deeper geological formations beneath the sites, while the intensity degrees shown on all previous maps correspond to an average ground type and average deeper geological conditions.
The ground types that are given in EC8 represent only the characteristics of local soil, or more precisely, only the 30 m of the stratigraphic profile. Still, different response spectra may be defined in the National Annex if creators of the Annex wish to take into account the deep geology.
However, several regional seismic microzonation and strong ground motion studies [24,25,26,27,28,29,30] have shown that the deep geology, i.e., the geological characteristics up to depths of hundreds of meters or even a few kilometers [31], strongly influence seismic waves with both the shorter and longer oscillation periods. These studies show that even if the shallow geology description takes into account more than 30 m of the local soil depth (e.g., in the case we use the Seed’s et al. [32] classification), empirical predictions may still be biased, so the deeper geology conditions need to be considered. It is important to note that the mentioned studies show that PGA amplitudes are not so sensitive to strong distant earthquakes, e.g., like those occurring in the Vrancea region in Romania [33,34]. This is due to the fact that the short-period waves attenuate fast, and, when they propagate starting from distant sources, their final contribution is going to be smaller than the contribution given by local events, even in the case of very strong (and very distant) events. Hence, almost everywhere in Croatia, the PGA values will be vastly dominated by local seismicity. However, it is expected that the long and intermediate period waves may be dominated by the contribution from larger and more distant earthquakes. What is even more important, the long and intermediate period spectral amplitudes are strongly influenced by the presence of deep geological sediments, just like those that are present in the Pannonian Basin [24,29]. For the more reliable definition of seismic action for the city of Osijek, for example, future seismic studies should include careful interpretation of deep geological site characteristics and their effect on the spectral shapes. In other words, even though PGA estimates seem to be adequately defined, the EC8 approach neglects to consider the deeper geological variations surrounding the site, which strongly affect the longer period spectral amplitudes. Hence, there is a need to formulate the microzonation maps, which will also consider the deep site geology.
Until the 1970s, only the attenuation equations for PGA values and macroseismic intensities existed, and hence the PSHA analyses were able to produce results only for these two ground motion measures, taking into account also the probabilities of occurrence of earthquakes and the spatial geometry of earthquake sources. However, since the mid-1970s (i.e., after the first creation of empirical equations for direct scaling of spectral amplitudes), it has been possible to carry out seismic microzoning for large cities based on more comprehensive methods that also consider the frequency-dependent attenuation of strong-motion amplitudes and the simultaneous effects of the site deep geology and soil conditions [35]. If one uses the empirical equations for prediction of various spectral amplitudes, then by applying the exact same procedure as for estimation of the PGA values, the PSHA estimate can be found for each ordinate of the response spectrum, and the so-called uniform hazard spectra (UHS) can be calculated. Expectations of all UHS amplitudes will then have the same probability of exceedance in t years. Several recent studies of seismic microzonation in the region of north-western Balkans [25,26,27,28,29,30], which considered frequency-dependent attenuation equations and took also into account the deep geology effects, have confirmed the merits of the UHS approach. The comparison between the UHS-based and standard seismic microzonation studies is presented in Figure 3.

4. Exposure

4.1. Review of Existing Building Taxonomies

On the global scale, various databases of building inventory have been developed based on various approaches and with different levels of data accuracy and reliability. As opposed to the significant efforts conducted in the field of hazard assessment, not much attention has been given to exposure models despite their importance.
A widely accepted qualitative definition of earthquake exposure is the tendency of an element category to be at risk of being harmed by potential earthquakes.
For the large-scale assessments, to demonstrate unambiguously the assignment of a vulnerability model to an individual building, most commonly specific risk-oriented taxonomies are applied [36]. The most prominent taxonomies are PAGER (the abbreviation for “prompt assessment of global earthquakes for response”) [37], HAZUS (hazard-US) taxonomy [38], developed originally to describe the USA building stock, RESIS-II building (reducción de Riesgo sísmico en Guatemala, El Salvador y Nicaragua project) [39], EMS-98 (European macroseismic scale 1998) [40], which has been used for seismic risk assessment not only in a few European countries but also in Turkey and in several Central Asian countries.
The application of risk-oriented taxonomies is appropriate for developing exposure models that are based on either an expert judgment [41], a combination of data compiled by authorities (e.g., census data), or a field data collection [42], where each of the inspected buildings is assigned one of the predefined group of building classes in compliance with the surveyor’s personal judgment.
In HAZUS [38], the main parameters for the classification of buildings are the basic load-bearing system, building height, and criteria of the used design codes. Sixteen types of structures are identified according to the basic structural system and seismic design criteria. Types of structures are increased to thirty-six when the number of floors is considered. The building height is considered in three groups: (1) low-rise buildings (for buildings with up to 3 floors), (2) mid-rise buildings (4 to 7 floors), and (3) high-rise buildings (up to 20 floors). Types of structures are further increased to a hundred and thirty-two separate typologies when the consideration of the engineering design level is considered (pre-code, low-code, moderate-code, or high-code). Although it was developed specifically for the US, HAZUS has been used with and without local adaptations widely globally (e.g., Venezuela, India, Canada, etc.).
In PAGER [37], global building typologies are classified by using sixteen main building types defined by primary structural material and lateral load resisting system, expanding to eighty-seven subtypes when more specific building descriptions are available (i.e., height, diaphragm type, specific material types, construction techniques, and ductility level).
The RESIS-II building classification scheme was developed specifically for use in Central America [39]. The basis of this classification is HAZUS structural types, but with a reduced number of typologies that consider differences in height. The design level is not considered for any structural typology, consistent with the extent of building regulations in the region [43].
The EMS-98 system is fairly simplistic, and its European focus leads to greater attention given to masonry and reinforced concrete (RC) building types, with a number of more detailed options given for each. All steel and all timber structures are grouped together with no differentiation for any characteristics other than the primary structural material.
On the other hand, more recently, so-called faceted taxonomies were introduced to provide a more standardized description of analyzed buildings based on a more comprehensive set of basic attributes [36]. However, according to Pittore et al. [36], these taxonomies cannot be used directly for risk-related exposure models. According to the GEM (global earthquake model), single structures are described in detail from the functional and structural points of view. Different levels of detail for 13 attributes describe a class of buildings (or an individual building): direction, position, plan shape, structural irregularity, exterior walls, floor type, roof type, occupancy, year of construction, height, lateral load-bearing system, the material of the lateral load-bearing system, foundation, and occupancy.
The lack of a database on buildings is a key obstacle to reliable earthquake risk assessments in Croatia. This lack of data on current building stock was also pointed out in the project NERA (abbreviation for “network of European research infrastructures for earthquake risk assessment and mitigation”) [44]. Croatia represents one of the six countries in Europe (including Iceland, Switzerland, Serbia, Bosnia, Herzegovina, Montenegro) that are identified for such an analysis. Based on results of the project NERA that collected available data on the existing building stock in European countries, the classification and representation of dwelling types for urban areas in Croatia (Figure 4) were obtained through a review of the Google street view application (blue columns in the chart) and questionnaires completed by Croatian researchers (orange columns in the chart). From Figure 4, one can distinguish two basic building attributes that will serve for the proposed building taxonomy. The first being material of the lateral load-bearing system (masonry, reinforced concrete (RC), timber, and other), and the second being the construction age, which is related to the seismic codes (to be further discussed in this paper), which is also directly related to the engineering design level.
Table 3 shows the number of dwellings according to the year of construction in the whole Croatia based on Census 2011 [45]. Other details on the existing building stock, which could be used for a more precise description of their exposure in case of earthquakes (number of floors, material, structural system, etc.), are currently not available in the state statistical databases.
Characteristics of building structures in the region, as well as the construction practices, may change over time, but some of the main characteristics stay the same for each period due to the similarity of the materials, construction techniques, and quality of construction. That means that for each type of buildings throughout Croatia, we could differentiate a distinctive conclusion on their seismic resistance and behavior during an earthquake [46].
Until 1920, masonry buildings had wooden floor structures. These buildings were built in most cases between 1860 and 1920, and they are currently part of the old town centers in Croatia. These buildings are not designed with the main goal to cope with severe horizontal ground motions (e.g., earthquakes). Such buildings are classified as historical heritage. The first semi-prefabricated RC floors were applied after 1930, and monolithic RC floors after 1964. Also, after the earthquake in Skopje in 1963, masonry buildings all over former SFRY were built systematically with horizontal tie-beams and with vertical tie-columns in order to obtain confined masonry [4].
Also, after the 1963 Skopje earthquake, the load-bearing system in reinforced concrete structures (RC frames and RC shear walls) were built with respect to the provisions of the seismic regulations introduced in 1964 (i.e., after the 1963 Skopje earthquake) and in 1981 (i.e., after the 1979 Montenegro (coast) earthquake).
Eurocodes were gradually introduced between 1992 and 1998 as voluntary norms for structural design. In that period, they maintained a pre-standards status (ENV label) due to difficulties that came up with the harmonization of new standards with old national legislation. In 1998, the final version was introduced, with the label of European standard (EN label), but the final implementation started in 2005 by the introduction of the technical regulations for concrete structures (NN 101/05) [47]. In 2011, Eurocodes finally became mandatory norms in official use, although the pre-standards could be also applied until the end of 2012. Therefore, during those two years (2011 and 2012), there was an overlap between the implementation of ENV and EN.
Table 4 shows seismic codes for Croatia and classifications of dwellings by construction age and common construction type.

4.2. Predominant Building Typologies for the City of Osijek

The proposed exposure model will include building characteristics that can be obtained through field survey inspection. It will also include parameters relevant to certain seismic vulnerability methods. Based on the up to date building database of the city of Osijek, basic characterization of buildings, as well as obtained statistical analysis of those characteristics, is performed. According to Census 2011 [45], there are 51,123 dwellings in Osijek (Table 5). However, the number of buildings and basic structural types are not included in the Census data. Using the database compiled so far, predominant building typologies can be determined.
A very important step to assess the earthquake’s impact on the built area is the knowledge of the structure of the building, its structural system, the material from which it was built, the response of the building in the earthquakes that occurred in that area, and engineering standards or regulations that were valid during construction.
Building inventory is a database of buildings and their typology, which defines their exposure to specific dangers and gives input on pre-calculated losses of those buildings. As a rule, the inventory requires particular building data: the purpose of the building, year of construction, height, utilization, value, location of the building, etc.
Building databases of the selected area are compilations based on several different methods that include:
-
gathering the data from the archives of some public institutions or companies, such as hospitals, schools, kindergartens, etc.
-
going to the site and analyzing the buildings.
Throughout the history of the city, the building construction was changed depending on the development of the building’s technology, knowledge of ground characteristics, urban insights on the regulation of urban space, the application of urban protection measures, and the needs for building space. Knowledge of the period of construction of a certain group of buildings, the basic characteristics of the construction, and the manner of application of the relevant regulations (if they existed) is important for a rough assessment of the seismic resistance and the expected effects of the earthquake on buildings. Examples of typical types of buildings in the city of Osijek are shown in Figure 5.
Within some of the city districts, basic data on the type of construction (masonry, reinforced concrete, etc.) have been collected along with the year or period of construction, the level of the earthquake forces for which it is designed, the height (number of floors), regularity in the layout/height, horizontal and vertical bearing elements, etc. The above-mentioned data are systematized.
The database described in the paper [48] is further extended with the data on buildings. Based on a total of 1100 buildings, the slightly changed results would be presented. By analyzing the collected database, it can be seen that 97% of the buildings are masonry buildings, while only 3% of the buildings are reinforced concrete. Percentages of certain classes of structural systems are presented in Figure 6.
The structural systems for the buildings in the city of Osijek are classified as follows [48]:
-
unreinforced masonry structures (URM), flexible floors (old bricks)
-
unreinforced masonry structures, rigid floors
-
confined masonry structures
-
reinforced-concrete frame structures (RC)
-
shear walls, built without taking into consideration earthquake-resistant design.
For the buildings in the database, the following results were obtained on the year of construction (see Figure 7): 16% of the buildings were built before the 1940s, 32% were built between 1940 and 1970, 33% were built in the period from 1970 to 1978, and 19% in period between 1987 and 2006.
Another valuable piece of information that can be obtained is related to the number of stories/heights since it directly affects the fundamental vibration period—the most important dynamic characteristic of the structure. The following results were obtained regarding the number of stories of buildings in the database (Figure 8): 77% of the total buildings in the database are low-rise buildings, 16% of buildings are mid-rise, while only 7% of the buildings are high-rise. Since most of the buildings are masonry buildings, the low-rise buildings are with either one or two stories, mid-rise buildings are those with three to five stories, while high-rise buildings are those with more than six stories.

5. Seismic Vulnerability Assessment for Civil Engineering Structures

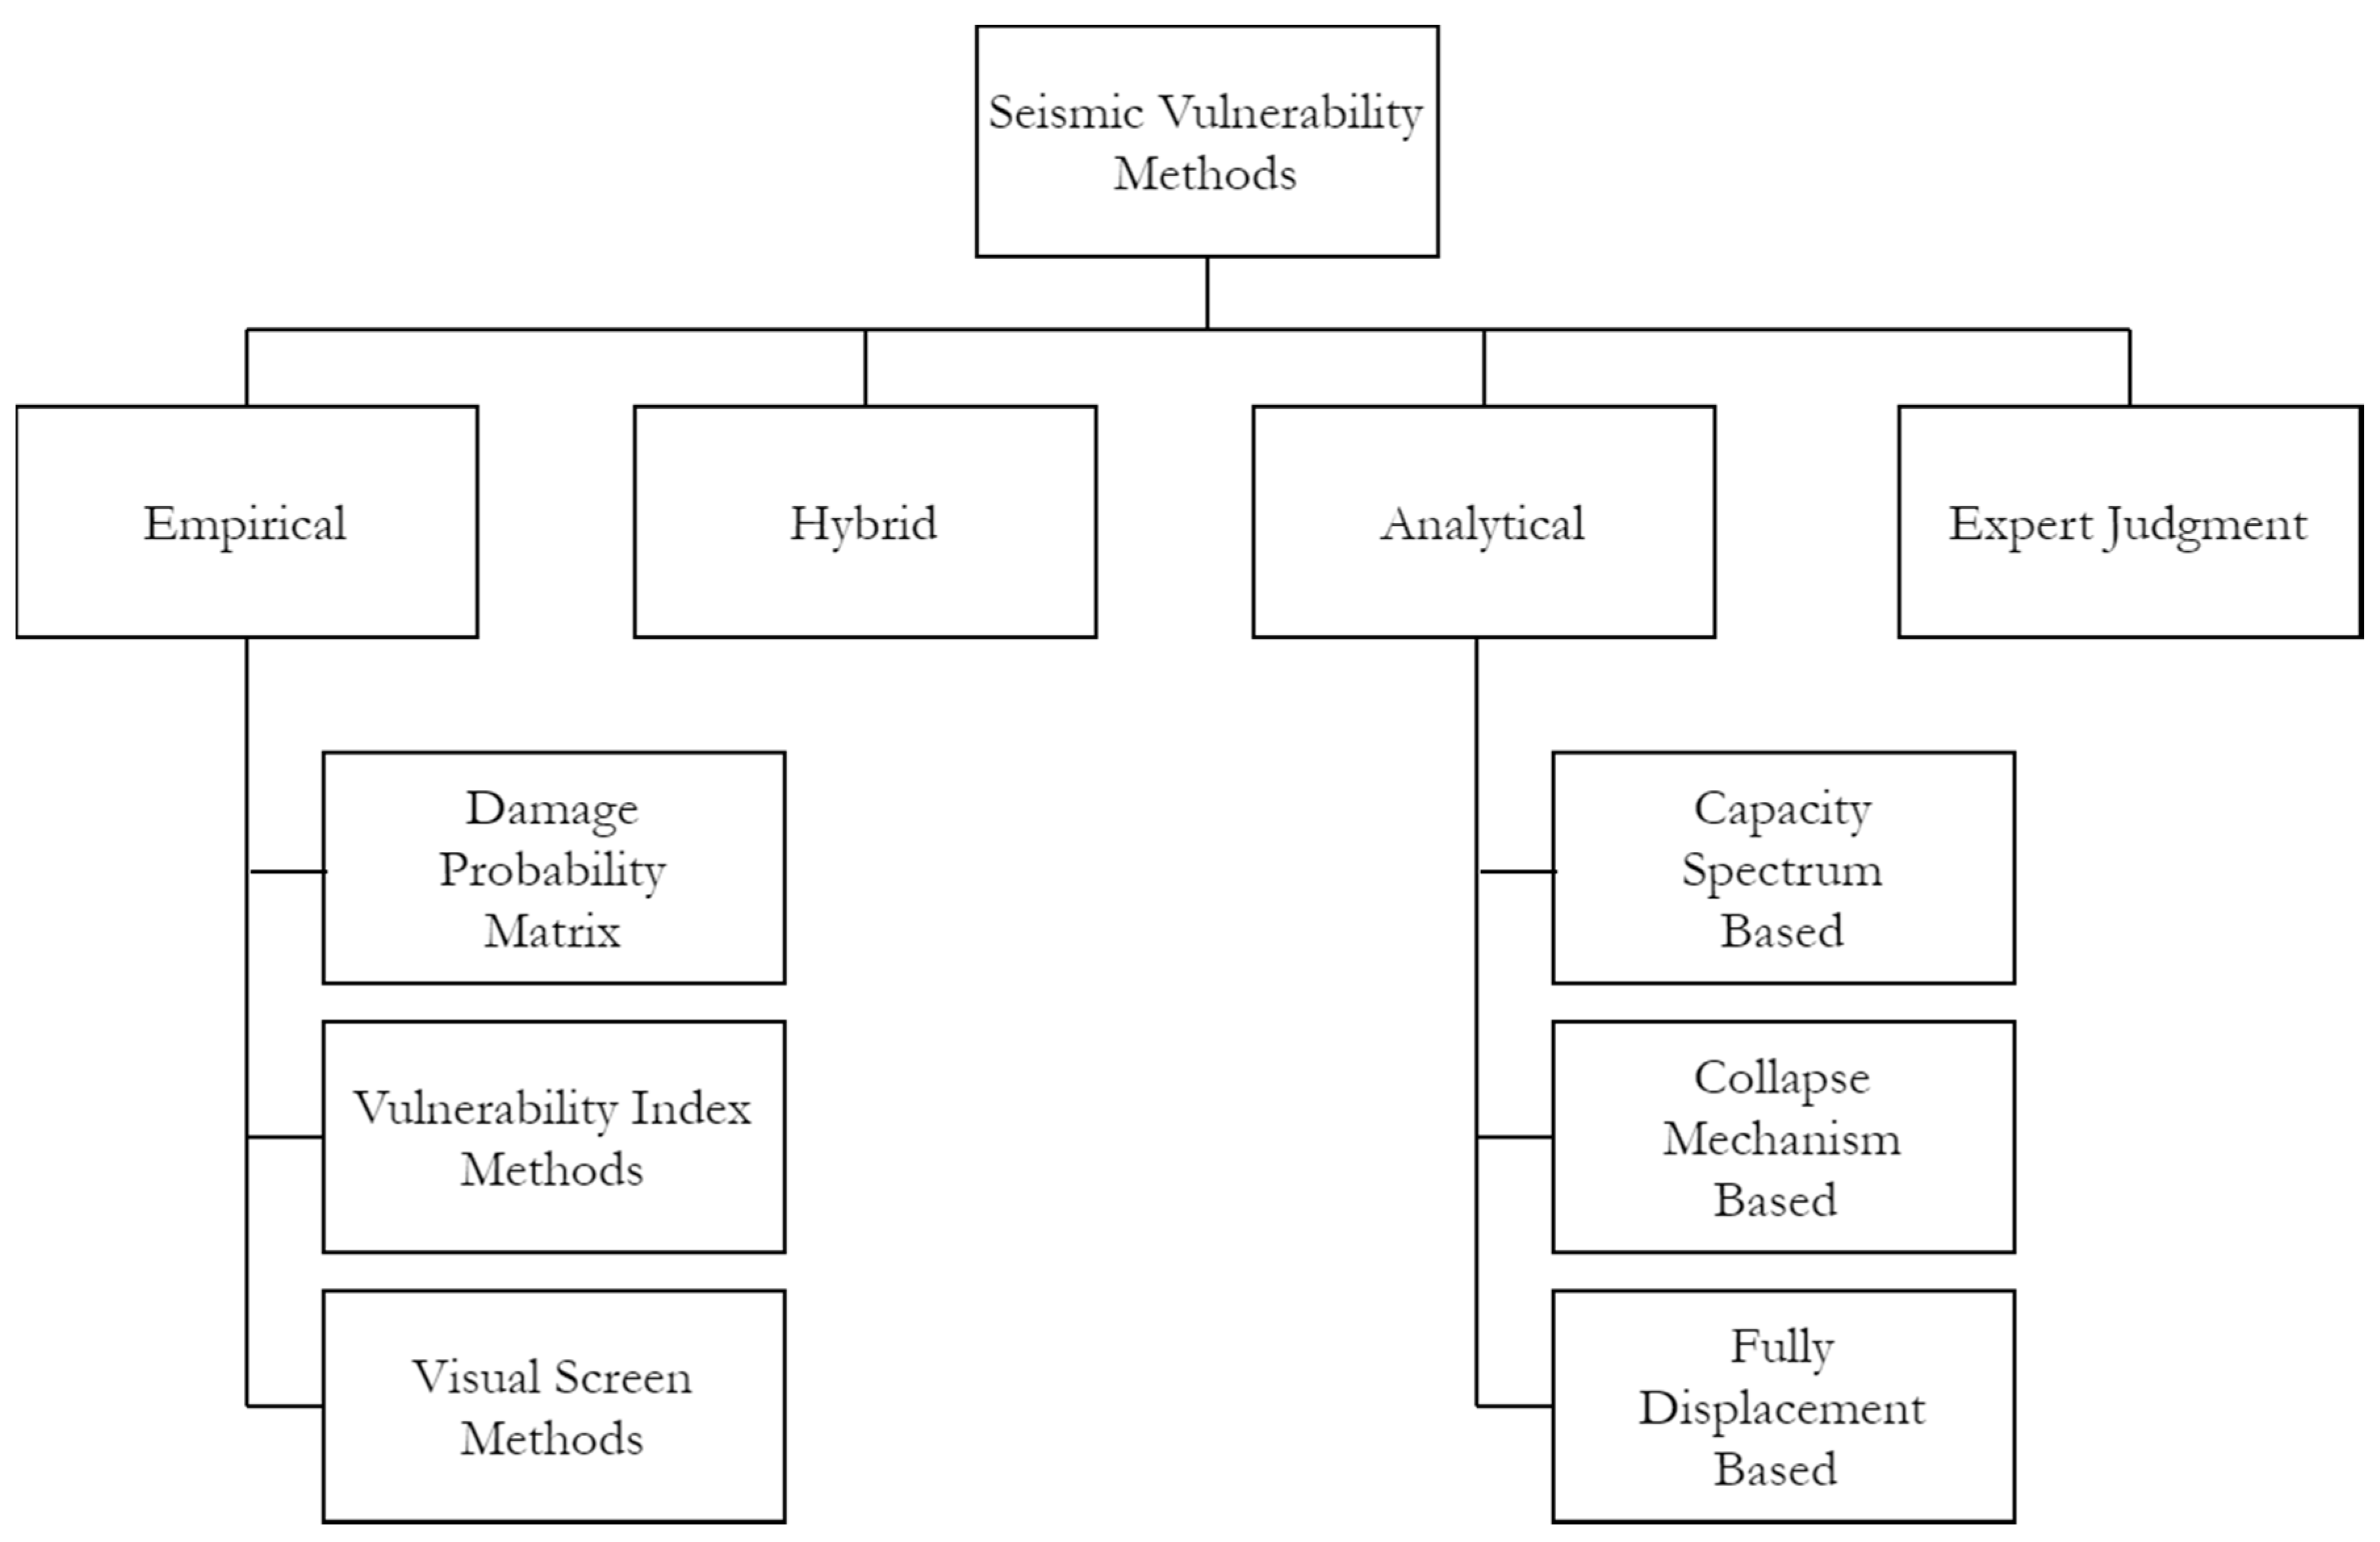
5.1. Existing Seismic Vulnerability Assessment Methods

The concept of seismic vulnerability can be defined as a lack of structural safety when exposed to an earthquake, i.e., as the structural response (in terms of predicted damage) to the effect of the earthquake. Assessing earthquake vulnerability represents a quantitative assessment of the damage and failure of the structure, which is reflected in certain measures, affecting the public interest (the number of injured and killed persons, repair costs). It can be defined as the ratio of the expected loss and the maximum possible loss, with the values going from 0 (no damage) to 1 (total damage).
There are several reasons (situations) that require the use of the concept of earthquake vulnerability, and the main ones are [49]:
-
vulnerability as one of the main factors in the seismic risk analysis,
-
vulnerability as a major factor in the development of earthquake scenarios,
-
the basis for establishing a risk reduction strategy for buildings or the classification of risk elements,
-
base data for the creation of intensity scales (e.g., EMS-98 scale [40], which refers explicitly to seismic exposure).
Methods that can be used to define function/damage probability curves for earthquake risk assessment are generally classified as empirical, analytical, expert judgment, or hybrid (Figure 9). Many researchers briefly explained every method [43,44,45,46,47,48,49,50,51,52], and here the advantages and disadvantages of a certain method have been highlighted. Empirical methods are based on observations of real damages and post-earthquake surveys. The empirical methods rely on the knowledge of the previous characteristics of buildings during certain seismic events and on the possibility of extracting statistical functions that relate the likelihood of damage to a building at a given location, with the expected intensity of shaking. In order to reliably produce such functions, large datasets are needed that will cover the full range of performances of a particular building typology to the full range of considered possible seismic intensities.
Many scientists have addressed the issue of earthquake damage assessment and made suggestions for damage probability matrices (DPMs). In 1973, Whitman et al. [53] presented various buildings with a certain level of damage (structural and non-structural) as a function of intensity and suggested the form of damage probability matrices. In 1982, Braga et al. [54] proposed one of the earliest versions of the damage probability matrices for Europe based on observed damages in Italy following the Irpinia earthquake in 1980. They applied the binomial distribution to calculate damage for earthquakes of different intensities. According to this method, also called ‘direct’, buildings are divided into three types (A, B, C), and, for each type, the matrix of damage probability is estimated according to the MSK scale.
In Japan, in 1968, the first index-based method for low rise RC buildings was developed by Shiga et al. [55]. The method was developed using the 1968 Tokachioki earthquake damage data to calculate the relationship between easily available structural information (wall or column areas) and observed damage.
Then, in 1984, Benedetti and Petrini [56] developed a similar empirical approach to determine relationships applicable to Italian unreinforced masonry, based on the evaluation of eleven parameters and combined with some weighting according to their relative importance. The damage factor related to the PGA values was assigned from the function library according to the overall score.
It is not possible to develop seismic vulnerability functions with this method, which is known as a prioritization scheme and is used as a first-level screening to highlight the most vulnerable structures. This initial approach to index assessment aims to give preference to vulnerable structures for detailed assessments of seismic vulnerability.
Analytical methods are used for a single building when it is evaluated in numerical terms (ultimate force, displacement capacity, etc.) [43]. The reliability of the obtained results depends on the capabilities of the computational model to predict the behavior of a real structure and on the number of parameters that are necessary to be defined. Structural models, idealized to a greater or lesser extent, always include assumptions that can lead to noticeable differences in results. The use of different modeling techniques, inputs, and methods for assigning characteristics to a model makes a difference in analytical modeling. For example, simpler models are faster to build and solve but rely on more assumptions, while more complex models require more computational effort and deeper engineering expertise but deliver more accurate results.

5.2. Experiences Obtained by Provided Seismic Vulnerability Assessment Methods in Croatia

Analyzing the city as a whole is a demanding task. It is difficult to work with a large number of buildings and different types of structures, especially in European regions, where urbanization has spread over several centuries. Finding out about the behavior of older buildings is often impossible. It is difficult to assess the concept and quality of the building materials used at the time of their construction. It is even more difficult to try to model the behavior of an old building without knowing the laws of behavior and principles that have been followed in the steps of its construction. The phase of earthquake diagnostic or vulnerability assessment is the phase in which structures that are not related to behavior models and that do not fully or completely obey construction and disposition rules are evaluated.
In any empirical or analytical research, a number of uncertainties must be considered, and this requires expert opinion and the decision of a team of experts. The choice between the empirical and the analytical approach or the use of the combined approach will, therefore, ultimately depend on the decision of the experts conducting the damage assessment of the buildings of an urban area.
Empirical methods based on the actual damage observations and on the post-earthquake surveys applied in the territory of the City of Osijek in Croatia are presented in papers by Antičević et al. [57], Ivandić et al. [58], Hadzima-Nyarko et al. [8,59].
Analytical methods applied in the territory of the City of Osijek, and based on the structural models and results of dynamic or static analyses, are presented in the works of Galista and Hadzima-Nyarko [60], Hadzima-Nyarko et al. [61], and Pavić et al. [62].
The problem of estimation of earthquake-induced structural damage can also be solved by calculating the so-called damage ratio (DR). A relatively simple and rapid analysis of potential earthquake damage based on the coefficient of damage, as a numerically expressed value indicating the level of structural damage, was proposed by Morić et al. [63,64] and Hadzima-Nyarko et al. [65,66].
Based on these studies conducted so far, we came to understand the advantages and disadvantages, i.e., the limitations of empirical and analytical methods (Table 6).
The above-specified methods have been so far applied to individual parts of the city. The next step is to make it for the entire city or the largest urban settlements. Also, based on the experience gained to date, certain methods will be slightly modified for the study area.

6. Results

6.1. Selected Characteristics of Buildings for the Database

Based on the study of the literature on damage methods [43], the aim was to select the relevant characteristics of buildings for the database. To understand the most important (used) construction features of seismic vulnerability assessment and, therefore, the data that should be a priority in the data collection phase, a three-part systematic review of relevant literature groups was conducted and presented in [43], and, accordingly, it was concluded that the following parameters of buildings are the most important (Figure 9):
-
number of stories
-
material type
-
lateral load resistant type
-
elevation irregularity
-
plan irregularity
-
ground type
-
changes in vertical strength and/or stiffness (e.g., soft stories)
-
short column (applicable to RC frame structures only).
The parameters shown in Figure 10 are grouped into three areas that identify the different levels of significance of the parameters needed to evaluate the vulnerability of buildings. In the green area, the most useful parameters are those that are most affected by the good response of the building to earthquake activity. Based on the knowledge of these parameters, an experienced assessor can ad hoc estimate possible damage. In the area marked as moderately useful (in the pink area), are geometric and structural characteristics and other data, which are useful for determining more precise building behavior, identifying other properties, or for final analyses and evaluations. Their knowledge and inclusion in the analysis deepens, improves, and specifies the results of vulnerability calculation. In the third group (blue area), the parameters of minor importance on the earthquake response of the structure are classified, but knowledge of these parameters and budgeting can provide results for the purpose of targeted or specific earthquake vulnerability assessments.
A database whose properties are described in Section 4.2 is under development for the city of Osijek. The following building parameters in the database were selected as the most important, and they were already collected:
-
structural system
-
year of construction
-
state of preservation
-
the regularity of the floor plan
-
regularity along with the height
-
number of stories
-
story height and total building height
-
the material used for the construction of the walls and the type of the floor structure
-
position within the block
-
building size
-
floor area and gross floor area of the building
-
ground type
-
purpose of the building.
Additional information was also collected so that each building could be displayed in a Geographic information system (GIS) environment:
-
cadastral parcel number
-
street name and house number.
Based on these requirements, a mobile application, developed by EM2 LLC (www.em2.solutions), was created for the Android operating system (Figure 11). The mobile application was designed with flexibility and ease of use in order to simplify and speed up data entry in the field with the use of mobile phones or tablets. The mobile application consists of several screens for data input pertinent to creating a building stock database. While in the field, all of the data entered by the users are stored in a central database on a server. The application was also designed to work in offline mode, thereby enabling the user to enter data in areas where internet access is poor and/or non-existent. In such a scenario, data is stored locally on the mobile device and then synchronized to the central database on the server when the device comes “online”.
Users of the application are assigned to one of two roles: standard user or administrator. Upon installation of the application on a mobile device, the user is required to register and is automatically assigned a "standard user" role. A standard user can only view and edit his/her building data entered into the database. The administrator can access the central database and edit/modify all the data through the mobile application or through a web application.

6.2. Provided Seismic Vulnerability Assessments Based on the Selected Building Characteristics

It was concluded that most empirical methods could be implemented if the aforementioned parameters are collected. Two methods will demonstrate the application of the selected parameters. The first method is the macroseismic method developed by Giovinazzi and Lagomarsino [67,68,69]. The second method is the visual screening method, which identifies the highest priority buildings, i.e., buildings for which a more detailed method is to be implemented later (as described in Section 4).
The macroseismic method is also called ‘indirect’ since the relationship between the seismic action and the structural response is defined by the vulnerability index. The vulnerability index in a specific area is obtained based on a combination of data collected by observation in situ and from different building typologies. The mean damage grade µD is related to the macroseismic intensity I and depends on two parameters: the ductility index Q and the vulnerability index VI [69]:
μ D = 2.5 [ 1 + t a n h ( I + 6.25 × V I 13.1 Q ) ]    
where I is the degree of macroseismic intensity; Q is the ductility index used to fit the damage surveys data and controls the slope of the vulnerability curves; and VI is the vulnerability index, for which the typological vulnerability index (i.e., the most plausible value for the specific building type, VI) is computed as the centroid of the membership function. According to [69], the proposed value is 2.3 for residential buildings.
The vulnerability index of every building involves other factors: the regional vulnerability modifier and the behavior modifier. The calculated vulnerability index for every building for two levels of intensity—VII and VIII—were connected with the most probable damage state (Table 7) and presented in Figure 12.
In the case of intensity level VII (Figure 12a), “Substantial to heavy” could damage 18% of the buildings in the block under consideration. “Moderate” damage state is possible for most buildings, and 15% of buildings can reach the “Slight” damage state. At this earthquake intensity, fewer buildings can remain undamaged. At the level of intensity VIII (Figure 12b), very few buildings would be damaged by “Moderate” or “Slight” damage state. Most buildings (72%) would suffer “Substantial to heavy” damage, and as many as 18% would suffer "Very heavy" damage. In the observed block of buildings at this earthquake intensity, no buildings would be absent damage.
The second method used the numerical scoring system and is related to the earthquake-resistant design requirements of the National Building Code of Canada [71]. This method is a screening procedure with the aim to rank buildings in order to find those that should be evaluated in more detail.
The final result, i.e., the so-called seismic priority index (SPI) was calculated using two factors: structural index (SI), related to failure or possible damage to the building, and non-structural index (NSI), related to failure or damage to the building’s non-structural components [71]:
SPI = SI + NSI
The structural index (SI), which is based on the following components: ground motion (seismicity and local soil conditions), structural behavior (the type of structure and structural irregularities), and importance of the building, can be calculated as [71]:
SI = A · B · C · D · E
where A represents the seismicity; B the local soil conditions; C the type of structure; D irregularities; while E represents the importance of the analyzed building.
The non-structural index (NSI), which is based on hazards corresponding to life-safety or hazards corresponding to vital post-disaster operations in buildings, building importance, and local soil conditions, can be calculated as follows [71]:
NSI = B · E · F
where B-local ground conditions; E-building importance; F = max (F1, F2), where F1-hazards corresponding to life-safety and F2-hazards corresponding to vital operations.
The following criteria are proposed for the purpose of ranking buildings:
  • SPI = 0–10 indicates low priority
  • SPI = 10–20 indicates a medium priority
  • SPI = 20–30 indicates a high priority
  • SPI > 30 potentially hazardous
The seismic priority index (SPI) was calculated for each building for the same building block and presented in Figure 13.
The obtained results showed that for the intensity of earthquake VII, only 3% of the observed buildings could be considered as potentially dangerous. Most buildings have an SPI > 20, indicating a high priority, 28% indicate a medium priority, and a smaller number low priority (Figure 13a). For the intensity of earthquake VIII (Figure 13b) with respect to the calculated SPI, approximately similar percentages of the total observed number of buildings were obtained. The number of low priority buildings remained the same, and the proportion of buildings with SPI > 30 increased by 5%. This increase led to a decrease in the percentage of total buildings with a medium priority of 3% and of buildings with low priority by 2%.
As it could be seen from Figure 12 and Figure 13, a direct comparison of the results of two different seismic assessment methods was not possible because the macroseismic method yields mean damage grades to calculate the degree of damage to a building, while the screening procedure gave priority points on the basis of which buildings are ranked in priority building groups for further more detailed evaluation.
Also, based on the provided vulnerability assessment methods, it could be seen that the selected characteristics of buildings were quite sufficient for two completely different methods. We considered this extremely important because it is very difficult, once building data is collected, to add new features, subsequently depending on the vulnerability assessment method.

7. Conclusions

Knowledge about seismic vulnerability of buildings at the European and world level in the past twenty years has been deepened and expanded due to many devastating earthquakes.
Most of the territory of Croatia is characterized by a high degree of seismicity. The eastern part of the country where the city of Osijek is located is characterized by the rare occurrence of stronger seismic events. The specific characteristics of deep geological deposits on which the city lies, and which are not usually taken into account when designing seismic hazard maps, can introduce uncertainty into the ultimate effects of an earthquake on buildings and people in the city, even in the case of low-intensity earthquakes.
The paper discussed issues related to a more reliable assessment of seismic risk, with an emphasis on the relatedness and impact of seismic exposure on it.
The uncertainties that arise in seismic risk assessment arise from the inputs data used and modeling techniques. Therefore, an estimation algorithm was proposed in the paper, and the building data from the Osijek city exposure model was used in its application.
The proposed algorithm was elaborated through three phases: seismic hazard evaluation, vulnerability assessment of civil engineering structures, and risk assessment.
The results in the first phase were uniform hazard spectra for the targeted area. In the second phase, an exposure model was developed, and the characteristic typologies were adopted. With one of the empirical or analytical methods, the degree of damage was calculated.
Based on the estimation of the level of hazard and the vulnerability assessment in the third step after comparing design forces according to different building codes, the damage to buildings and human losses was calculated.
In the article, characteristics of buildings were presented, as well as the parameters relevant to certain seismic vulnerability assessment methods, which were selected for the exposure model of city Osijek. Adopted structural systems were presented too, as well as an analysis of their percentage representation in a sample of 1100 buildings for which data in the database have been collected so far. An analysis of the representation of collected buildings in the base with respect to year of construction and number of stories was also presented.
With the macroseismic and visual screening method, we demonstrated the application of the selected parameters for the exposure model, on the example of a characteristic block of buildings from the Osijek city base.
According to the macroseismic method, the most probable interval of mean damage was obtained as 1.5–2.5 for the intensity of earthquake VII, and 2.5–3.5 for the intensity of earthquake VIII. The mean damage grade obtained was associated with the most probable damage state defined as "Moderate" with respect to “Substantial to heavy”.
According to the visual screening method, for both earthquake intensities taken into account, the highest number of buildings was assigned to the “high priority” group for further detailed assessment.
The aim of the proposed methodology, the developed exposure model, and this paper was to contribute to the improvement of seismic risk assessment for civil engineering structures in Croatia and wider.
However, the results from the city of the Osijek case study could be used also for other cities in Croatia, as well as for many cities in neighboring countries due to similar hazard levels and similar building typologies.

Author Contributions

Methodology, Formal Analysis, and Investigation: M.H.-N., G.P., B.B.; Writing—Original Draft Preparation: M.H.-N., G.P., B.B.; Final Writing—Review and Editing: M.H.-N., G.P., B.B. All authors have read and agreed to the published version of the manuscript.

Funding

This research received no external funding.

Conflicts of Interest

The authors declare no conflict of interest.

References

  1. Nikoo, M.; Ramezani, F.; Hadzima-Nyarko, M.; Nyarko, E.K.; Nikoo, M. Flood-routing modeling with neural network optimized by social-based algorithm. Nat. Hazards 2016, 82, 1–24. [Google Scholar] [CrossRef]
  2. Alizadeh, M.; Alizadeh, E.; Asadollahpour Kotenaee, S.; Shahabi, H.; Beiranvand Pour, A.; Panahi, M.; Bin Ahmad, B.; Saro, L. Social Vulnerability Assessment Using Artificial Neural Network (ANN) Model for Earthquake Hazard in Tabriz City, Iran. Sustainability 2018, 10, 3376. [Google Scholar] [CrossRef] [Green Version]
  3. Zhai, Y.; Chen, S.; Ouyang, Q. GIS-Based Seismic Hazard Prediction System for Urban Earthquake Disaster Prevention Planning. Sustainability 2019, 11, 2620. [Google Scholar] [CrossRef] [Green Version]
  4. Akamatsu, T.; Yamamoto, K. Suitability Analysis for the Emergency Shelters Allocation after an Earthquake in Japan. Geosciences 2019, 9, 336. [Google Scholar] [CrossRef] [Green Version]
  5. Ajmar, A.; Annunziato, A.; Boccardo, P.; Giulio Tonolo, F.; Wania, A. Tsunami Modeling and Satellite-Based Emergency Mapping: Workflow Integration Opportunities. Geosciences 2019, 9, 314. [Google Scholar] [CrossRef] [Green Version]
  6. Chian, S.C.; Wilkinson, S.M.; Whittle, J.K.; Mulyani, R.; Alarcon, J.E.; Pomonis, A.; Saito, K.; Fraser, S.; Goda, K.; Macabuag, J.; et al. Lessons Learnt From the 2009 Padang Indonesia, 2011 Tohoku ¯Japan and 2016 Muisne Ecuador Earthquakes. Front. Built Environ. 2019, 5, 73. [Google Scholar] [CrossRef]
  7. Işık, E. Consistency of the rapid assessment method for reinforced concrete buildings. Earthq. Struct. 2016, 11, 873–885. [Google Scholar] [CrossRef]
  8. Hadzima-Nyarko, M.; Pavić, G.; Lešić, M. Seismic vulnerability of old confined masonry buildings in Osijek, Croatia. Earthq. Struct. 2016, 11, 629–648. [Google Scholar] [CrossRef]
  9. Bilgin, H.; Huta, E. Earthquake performance assessment of low and mid-rise buildings: Emphasis on URM buildings in Albania. Earthq. Struct. 2018, 14, 599–614. [Google Scholar]
  10. Banica, A.; Rosu, L.; Muntele, I.; Grozavu, A. Towards Urban Resilience: A Multi-Criteria Analysis of Seismic Vulnerability in Iasi City (Romania). Sustainability 2017, 9, 270. [Google Scholar] [CrossRef] [Green Version]
  11. Chieffo, N.; Formisano, A. Geo-Hazard-Based Approach for the Estimation of Seismic Vulnerability and Damage Scenarios of the Old City of Senerchia (Avellino, Italy). Geosciences 2019, 9, 59. [Google Scholar] [CrossRef] [Green Version]
  12. Aničić, D. Forecast of damage to the housing stock and the number of victims of a possible future earthquake in Zagreb (in Croatian). Civil. Zaštit. 1992, 1, 135–143. [Google Scholar]
  13. Herak, M.; Herak, D.; Markušić, S. Revision of the earthquake catalogue and seismicity of Croatia. 1908–1992. Terra Nova 1996, 8, 86–94. [Google Scholar] [CrossRef]
  14. Herak, D.; Herak, M.; Tomljenović, B. Seismicity and focal mechanisms in North-Western Croatia. Tectonophysics 2009, 465, 212–220. [Google Scholar] [CrossRef]
  15. Markušić, S.; Gülerce, Z.; Kuka, N.; Duni, L.; Ivančić, I.; Radovanović, S.; Glavatović, B.; Milutinović, Z.; Akkar, S.; Kovačević, S.; et al. An Updated and Unified Earthquake Catalogue for the Western Balkan Region. B Earthq. Eng. 2016, 14, 321–343. [Google Scholar] [CrossRef]
  16. Markušić, S.; Herak, M. Seismic Zoning of Croatia. Nat. Hazards 1999, 18, 269–285. [Google Scholar] [CrossRef]
  17. Official Gazette of SFRY. Temporary Technical Regulations for Construction in Seismic Areas; SFRY Official Gazette No. 39/64; Newspaper-publishing institution “Official Gazette of SFRY”: Belgrade, SFRY, 1964.
  18. Official Gazette of SFRY. Book of Rules on Technical Norms for Construction of High-Rise Buildings in Seismic Regions; Official Gazette of SFRY No. 31/81, Addendum No. 49/82; Newspaper-publishing institution “Official Gazette of SFRY”: Belgrade, SFRY, 1982.
  19. Official Gazette of SFRY. Book of Rules on Technical Norms for Construction of High-Rise Buildings in seismic Regions; Official Gazette of SFRY No. 31/81, Addendums No. 49/82, 29/83, 21/88, 52/90; Newspaper-publishing institution “Official Gazette of SFRY”: Belgrade, SFRY, 1990.
  20. Herak, M.; Allegretti, I.; Herak, D.; Ivančić, I.; Kuk, V.; Marić, K.; Markušić, S.; Sović, I. Republic of Croatia, Map of Seismic Areas (In Croatian). 2011. Available online: http://seizkarta.gfz.hr (accessed on 15 November 2019).
  21. CEN: Eurocode 8. Design of Structures for Earthquake Resistance—Part 1: General Rules, Seismic Actions and Rules for Buildings; Comité Européen de normalization: Brussels, Belgium, 2004. [Google Scholar]
  22. Hrvatski Zavod za Norme: HRN EN 1998-1:2011/NA:2011. Eurocode 8: Design of Structures for Earthquake Resistance—Part 1: General Rules, Seismic Actions and Rules for Buildings—National Annex; Hrvatski Zavod za Norme: Zagreb, Croatia, 2011. [Google Scholar]
  23. Trifunac, M.D.; Lee, V.W.; Živčić, M.; Manić, M.I. On the correlation of Mercalli-Cancani-Sieberg intensity scale in Yugoslavia with the peaks of recorded strong earthquake ground motion. Eur. Earthq. Eng. 1991, 5, 27–33. [Google Scholar]
  24. Bulajić, B.Đ.; Manić, M.I.; Lađinović, Đ. Effects of shallow and deep geology on seismic hazard estimates—A case study of pseudo-acceleration response spectra for the north-western Balkans. Nat. Hazards 2013, 69, 573–588. [Google Scholar] [CrossRef]
  25. Lee, V.W.; Manić, M.I.; Bulajić, B.Đ.; Herak, D.; Herak, M.; Trifunac, M.D. Microzonation of Banja Luka for performance-based earthquake-resistant design. Soil Dyn. Earthq. Eng. 2015, 78, 71–88. [Google Scholar] [CrossRef]
  26. Manić, M.I.; Bulajić, B.Ð.; Trifunac, M.D. A note on peak accelerations computed from sliding of objects during the 1969 Banja Luka earthquakes in former Yugoslavia. Soil Dyn. Earthq. Eng. 2015, 77, 164–176. [Google Scholar] [CrossRef]
  27. Lee, V.W.; Trifunac, M.D.; Bulajić, B.Đ.; Manić, M.I.; Herak, D.; Herak, M.; Dimov, G. Seismic microzoning in Skopje, Macedonia. Soil Dyn. Earthq. Eng. 2017, 98, 166–182. [Google Scholar] [CrossRef] [Green Version]
  28. Lee, V.W.; Trifunac, M.D.; Bulajić, B.Đ.; Manić, M.I.; Herak, D.; Herak, M.; Dimov, G.; Gičev, V. Seismic microzoning of Štip in Macedonia. Soil Dyn. Earthq. Eng. 2017, 98, 54–66. [Google Scholar] [CrossRef] [Green Version]
  29. Lee, V.W.; Trifunac, M.D.; Bulajić, B.Đ.; Manić, M.I.; Herak, D.; Herak, M. Seismic microzoning of Belgrade. Soil Dyn. Earthq. Eng. 2017, 97, 395–412. [Google Scholar] [CrossRef]
  30. Bulajić, B.Đ.; Bajić, S.; Stojnić, N. The effects of geological surroundings on earthquake-induced snow avalanche prone areas in the Kopaonik region. Cold Reg. Sci. Technol. 2018, 149, 29–45. [Google Scholar] [CrossRef]
  31. Trifunac, M.D.; Brady, A.G. On the Correlation of Seismic Intensity Scales with the Peaks of Recorded Strong Ground Motion. B Seismol. Soc. Am. 1975, 65, 139–162. [Google Scholar]
  32. Seed, H.B.; Idriss, I.M.; Kiefer, F.W. Characteristics of Rock Motions during Earthquakes, Earthquake Engineering Research Center; Report No. EERC 68-5, September 1968; College of Engineering, University of California: Berkeley, CA, USA, 1968. [Google Scholar]
  33. Lee, V.W.; Trifunac, M.D.; Bulajić, B.Đ.; Manić, M.I. Preliminary empirical scaling of pseudo relative velocity spectra in Serbia from the Vrancea earthquakes. Soil Dyn. Earthq. Eng. 2016, 86, 41–54. [Google Scholar] [CrossRef]
  34. Lee, V.W.; Trifunac, M.D.; Bulajić, B.Đ.; Manić, M.I. A preliminary empirical model for frequency-dependent attenuation of Fourier amplitude spectra in Serbia from the Vrancea earthquakes. Soil Dyn. Earthq. Eng. 2016, 83, 167–179. [Google Scholar] [CrossRef]
  35. Todorovska, M.I.; Gupta, I.D.; Gupta, V.K.; Lee, V.W.; Trifunac, M.D. Selected Topics in Probabilistic Seismic Hazard Analysis; Dept. of Civil Eng. Report No. CE 95-08; Univ. of Southern California: Los Angeles, CA, USA, 1995. [Google Scholar]
  36. Pittore, M.; Haas, M.; Megalooikonomou, K.G. Risk-Oriented, Bottom-Up Modeling of Building Portfolios with Faceted Taxonomies. Front. Built. Environ. 2018, 4, 41. [Google Scholar] [CrossRef]
  37. Jaiswal, K.; Wald, D.; Porter, K. A global building inventory for earthquake loss estimation and risk management. Earthq. Spect. 2010, 26, 731–748. [Google Scholar] [CrossRef]
  38. Kircher, C.A.; Whitman, R.V.; Holmes, W.T. HAZUS earthquake loss estimation methods. Nat. Hazards Rev. 2006, 7, 45–59. [Google Scholar] [CrossRef]
  39. Lang, D.H.; Molina, S.; Crempien, J.; Erduran, E. Earthquake Risk Reduction in Guatemala, El Salvador, and Nicaragua with Regional Cooperation to Honduras, Costa Rica, and Panama: Mapping of Typical Buildings; NORSAR: Kjeller, Norway, 2009. [Google Scholar]
  40. European Macroseismic Scale (EMS-98); Grünthal, G.M.; Roger, M.W.; Schwarz, J.; Stucchi, M. (Eds.) Cahiers du Centre Européen de Géodynamique et de Séismologie; European Centre for Geodynamics and Seismology: Walferdange, Luxembourg, 1998; Volume 15. [Google Scholar]
  41. Tyagunov, S.; Stempniewski, L.; Grünthal, G.; Wahlström, R.; Zschau, J. Vulnerability and risk assessment for earthquake-prone cities. In Proceedings of the 13th World Conference on Earthquake Engineering (13 WCEE), Vancouver, BC, Canada, 1–6 August 2004; pp. 1–6. [Google Scholar]
  42. Abrahamczyk, L.; Schwarz, J.; Langhammer, T.; Genes, M.C.; BikŸe, M.; KaŸin, S. Seismic risk assessment and mitigation in the Antakya-Maras region (SERAMAR): Empirical studies on the basis of EMS-98. Earthq. Spect. 2013, 29, 683–704. [Google Scholar] [CrossRef]
  43. Stone, H. Exposure and Vulnerability for Seismic Risk Evaluations. Ph.D. Thesis, Department of Civil, Environmental, and Geomatic Engineering, University College London, London, UK, 2017. [Google Scholar]
  44. NERA (Network of European Research Infrastructures for Earthquake Risk Assessment and Mitigation). Report D7.2 State of the Knowledge of Building Inventory Data in Europe, EUCENTRE; NERA: White Plains, NY, USA, 2011. [Google Scholar]
  45. Croatian Bureau of Statistics. Census of Population, Households and Dwellings 2011, Population by Citizenship, Ethnicity, Religion and Mother Tongue; Statistical Reports; Croatian Bureau of Statistics: Zagreb, Croatia, 2013. [Google Scholar]
  46. Kalman Šipoš, T.; Hadzima-Nyarko, M. Seismic risk of Croatian cities based on building’s vulnerability. Tehnicki Vjesnik 2018, 25, 1088–1094. [Google Scholar]
  47. Technical Regulation for Concrete Structures (NN 101/05); Newspaper-publishing institution “Official Gazette”: Zagreb, Croatia, 2005.
  48. Pavić, G.; Bulajić, B.; Hadzima-Nyarko, M. The Vulnerability of Buildings from the Osijek Database. Front. Built Environ. 2019, 5, 66. [Google Scholar] [CrossRef] [Green Version]
  49. Sandi, H.; Pomonis, A.; Francis, S.; Georgescu, E.S.; Mohindra, R.; Borcia, J.S. Seismic Vulnerability Assessment. Methodological Elements and Applications to the Case of Romania. In Proceedings of the International Symposium on Strong Vrancea Earthquakes and Risk Mitigation, Bucharest, Romania, 4–6 October 2007. [Google Scholar]
  50. Porter, K.A. Seismic Vulnerability. In Earthquake Engineering Handbook; Chen, W.F., Scawthorn, C., Eds.; CRC Press LLC.: Boca Raton, FL, USA, 2003. [Google Scholar]
  51. Rossetto, T.; Elnashai, A. A new analytical procedure for the derivation of displacement-based vulnerability curves for populations of RC structures. Eng. Struct. 2005, 27, 397–409. [Google Scholar] [CrossRef]
  52. Kwon, O.-S.; Elnashai, A. The effect of material and ground motion uncertainty on the seismic vulnerability curves of RC structure. Eng. Struct. 2006, 28, 289–303. [Google Scholar] [CrossRef]
  53. Whitman, R.V.; Reed, J.W.; Hong, S.T. Earthquake Damage Probability Matrices. In Proceedings of the Fifth World Conference on Earthquake Engineering, International Association for Earthquake Engineering, Rome, Italy, 25–29 June 1973; pp. 2531–2540. [Google Scholar]
  54. Braga, F.; Dolce, M.; Liberatore, D. A Statistical Study on Damaged Buildings and an Ensuing Review of the MSK-76 Scale. In Proceedings of the Seventh European Conference on Earthquake Engineering, Athens, Greece, 20–25 September 1982. [Google Scholar]
  55. Shiga, T.; Shibata, A.; Takahashi, T. Earthquake Damage and the Amount of Walls in Reinforced Concrete Buildings; Tobuku District Symposium: Tokyo, Japan, 1968. [Google Scholar]
  56. Benedetti, D.; Petrini, V. Sulla Vulnerabilità Di Edifici in Muratura: Proposta Di Un Metodo Di Valutazione. L’industria delle Costruzioni 1984, 149, 66–74. [Google Scholar]
  57. Antičević, A.; Hadzima-Nyarko, M.; Rabi, A. Seismic vulnerability of kindergarten buildings in the city of Osijek. In Proceedings of the 4th Conference—International Scientific Symposium, Economy of Eastern Croatia-Vision and Development, Osijek, Croatia, 21–23 May 2015. [Google Scholar]
  58. Ivandić, N.; Hadzima-Nyarko, M.; Štefić, T. Seismic vulnerability of primary schools in the city Osijek. In Proceedings of the 4th Conference—International Scientific Symposium, Economy of Eastern Croatia-Vision and Development, Osijek, Croatia, 21–23 May 2015. [Google Scholar]
  59. Hadzima-Nyarko, M.; Lešić, M.; Morić, D. Seismic Vulnerability Assessment for Residential Buildings in Osijek, Croatia. In Proceedings of the 16th World Conference of Earthquake Engineering, Santiago, Chile, 9–13 January 2017. [Google Scholar]
  60. Galista, M.; Hadzima-Nyarko, M. Assessing seismic risk in Retfala Nova. Electron. J. Faculty Civil Eng. 2015, 6, 50–61. [Google Scholar]
  61. Hadzima-Nyarko, M.; Nikić, D.; Pavić, G. Seismic Vulnerability Assessment of Reinforced Concrete Frame Structure by Finite Element Analysis. Acta Phys. Polonica A 2019, 135, 845–848. [Google Scholar] [CrossRef]
  62. Pavić, G.; Hadzima-Nyarko, M.; Plaščak, I.; Pavić, S. Seismic Vulnerability Assessment of Historical Unreinforced Masonry Buildings in Osijek using Capacity Spectrum Method. Acta Phys. Polonica A 2019, 135, 1138–1141. [Google Scholar] [CrossRef]
  63. Morić, D.; Hadzima, M.; Ivanušić, D. Seismic Damage Analysis of Reinforce Concrete Structures. Tehnicki Vjesnik 2002, 9, 13–26. [Google Scholar]
  64. Morić, D.; Hadzima, M.; Ivanušić, D. Seismic Damage Model for Regular Structures. Int. J. Eng. Model. 2003, 14, 29–44. [Google Scholar]
  65. Hadzima-Nyarko, M.; Mišetić, V.; Morić, D. Seismic vulnerability assessment of an old historical masonry building in Osijek, Croatia, using Damage Index. J. Cult. Herit. 2017, 28, 140–150. [Google Scholar] [CrossRef]
  66. Hadzima-Nyarko, M.; Morić, D. Spectral Functions of Damage Index (DI) for Masonry Buildings with Flexible Floors. Tehnicki Vjesnik 2008, 25, 181–187. [Google Scholar]
  67. Giovinazzi, S.; Lagomarsino, S. A macroseismic method for the vulnerability assessment of buildings. In Proceedings of the 13th World Conference on Earthquake Engineering, Vancouver, BC, Canada, 1–6 August 2004. Paper No. 896. [Google Scholar]
  68. Lagomarsino, S.; Giovinazzi, S. Macroseismic and mechanical models for the vulnerability and damage assessment of current buildings. Bull. Earthq. Eng. 2006, 4, 415–443. [Google Scholar] [CrossRef]
  69. Giovinazzi, S. The Vulnerability Assessment and the Damage Scenario in Seismic Risk Analysis. Ph.D. Thesis, Department of Civil Engineering of the Technical University Carolo-Wilhelmina at Braunschweig and Faculty of Engineering Department of Civil Engineering of University of the Florence, Florence, Italy, 2005. [Google Scholar]
  70. Lantada, N.; Irizarry, J.; Barbat, A.H.; Roca, A.; Susagna, T.; Pujada, L.G. Seismic hazard and risk scenarios for Barcelona, Spain, using the Risk-UE Vulnerability index method. Bull. Earthq. Eng. 2010, 8, 201–229. [Google Scholar] [CrossRef] [Green Version]
  71. Rainer, J.H.; Allen, D.E.; Jablonski, A.M. Manual for Screening of Buildings for Seismic Investigation; Institute for Research in Construction National Research Council: Otawa, Canada, 1993. [Google Scholar]
Figure 1. The process of earthquake risk assessment.
Sustainability 12 01796 g001
Figure 2. Main parts of the proposed methodology for the assessment of seismic risk for Croatian cities.
Sustainability 12 01796 g002
Figure 3. Key differences between the uniform hazard spectra (UHS)-based and standard seismic microzonation studies.
Sustainability 12 01796 g003
Figure 4. Percentage of dwellings in urban areas in Croatia according to project NERA (Network of European Research Infrastructures for Earthquake Risk Assessment and Mitigation) obtained by questionnaire response ( Sustainability 12 01796 i001
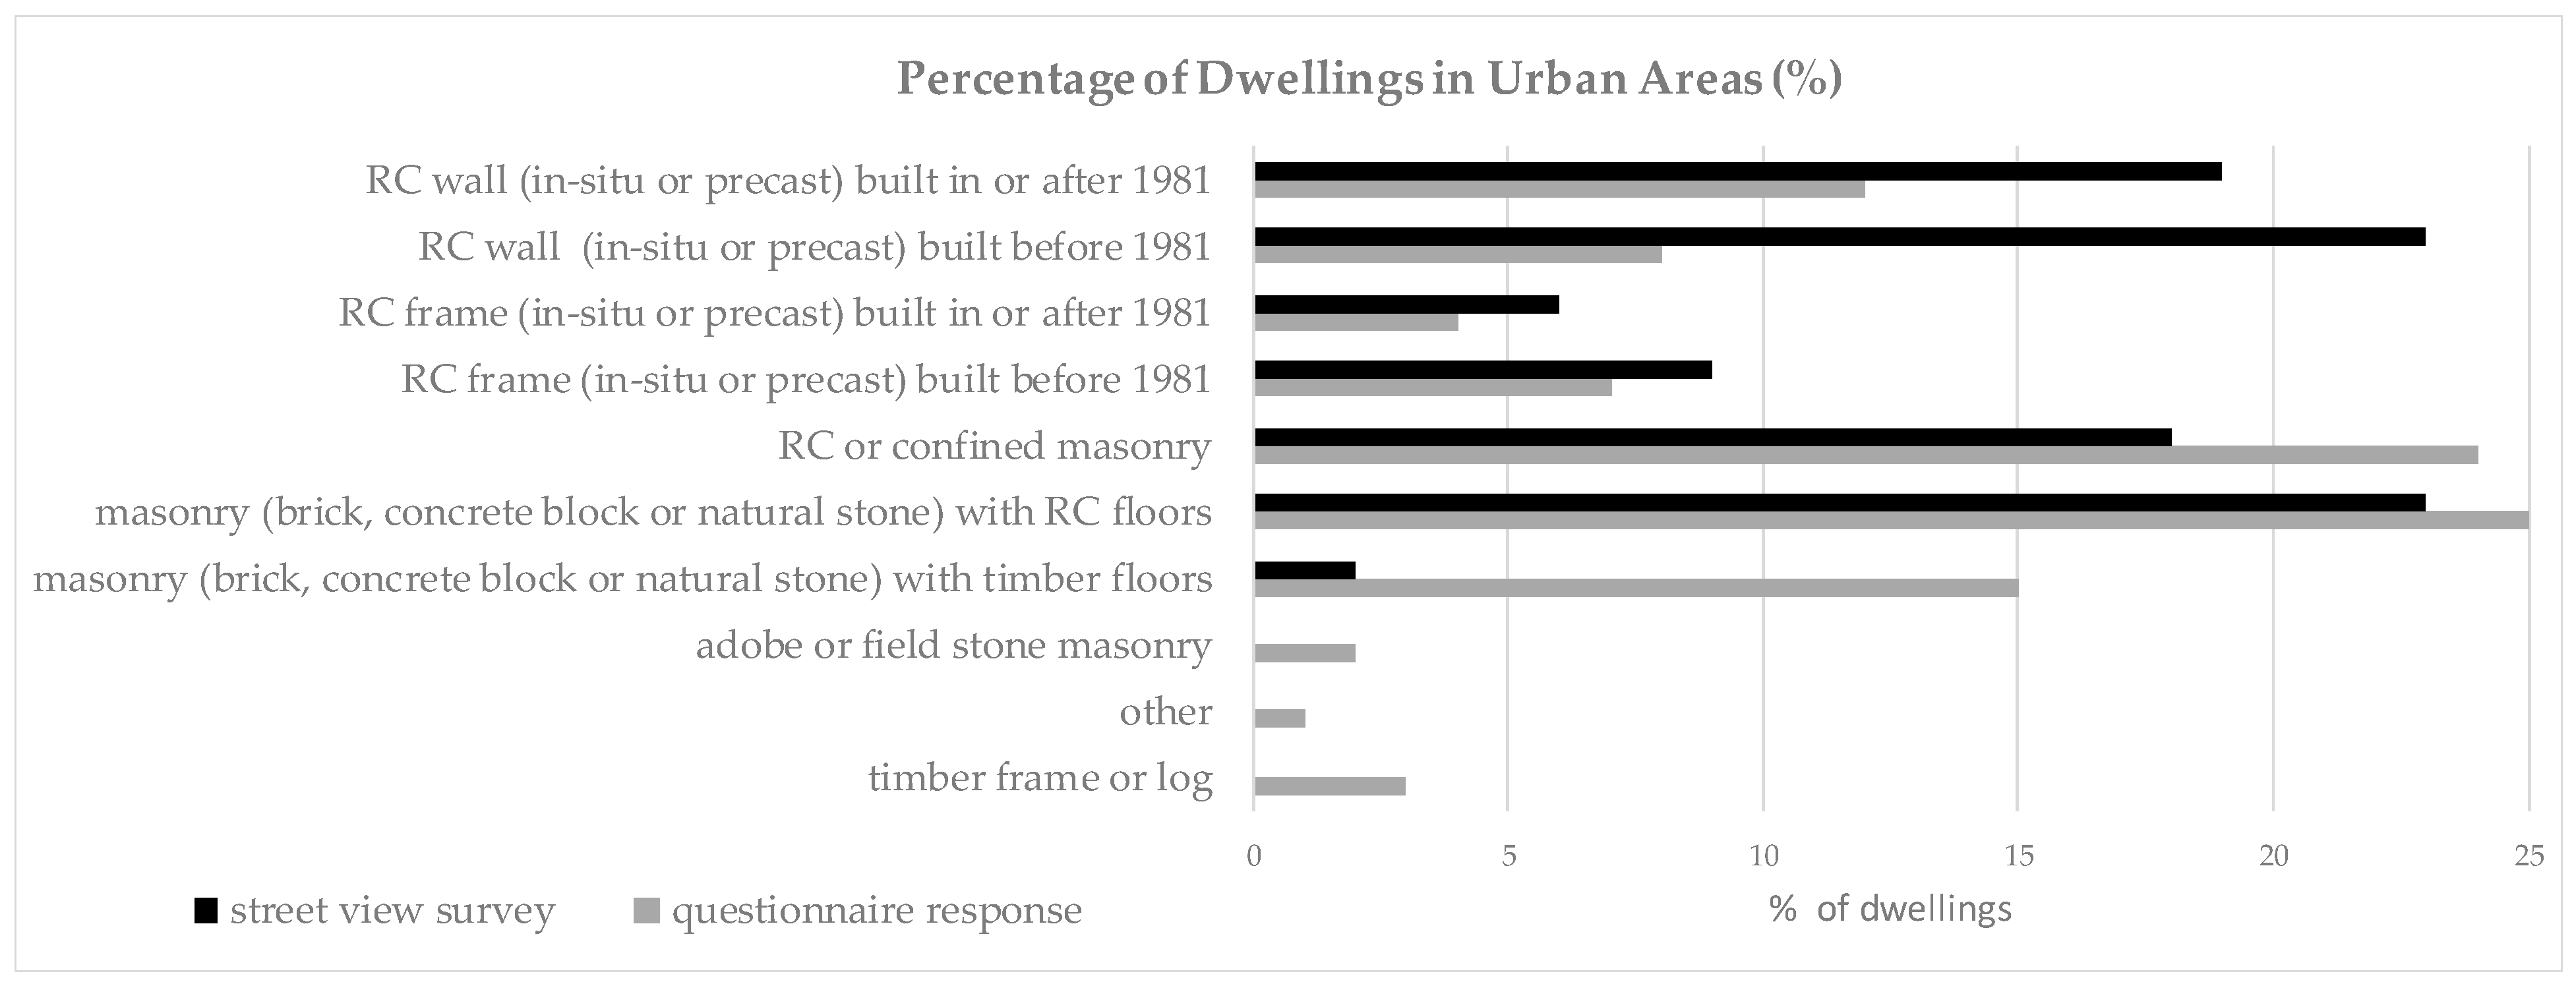
) and street view survey ( Sustainability 12 01796 i002) (redrawn from [44]).
Sustainability 12 01796 g004
Figure 5. Typical examples of (a) older masonry buildings (with wooden floors), (b) confined masonry, (c) reinforced concrete (RC) frames, and (d) newer RC frames.
Sustainability 12 01796 g005
Figure 6. Percentages of the structural systems in the database of buildings in Osijek.
Sustainability 12 01796 g006
Figure 7. Percentages of buildings according to the year of construction.
Sustainability 12 01796 g007
Figure 8. The number of stories of the buildings in the database.
Sustainability 12 01796 g008
Figure 9. Classification of seismic vulnerability methods.
Sustainability 12 01796 g009
Figure 10. The proportion of the vulnerability index methods that prioritize different building parameters (redrawn from [43]).
Sustainability 12 01796 g010
Figure 11. The android application for database creation developed by EM2 LLC.
Sustainability 12 01796 g011
Figure 12. Most probable damage states obtained for intensities: (a) VII, (b) VIII.
Sustainability 12 01796 g012
Figure 13. The seismic priority index (SPI) obtained for intensities: (a) VII, (b) VIII.
Sustainability 12 01796 g013
Table 1. Seismic intensity degrees for the five most populated cities in Croatia, as given in 1950 [17], 1982 [18], and 1990 [18] seismic zoning maps.
City Name195019821990
50 yrs.100 yrs.200 yrs.500 yrs.1000 yrs.10,000 yrs.
ZagrebVIII–IXVIIIVIIVII–VIIIVIIIVIII–IXIXIX
RijekaIXVIIVIVII–VIIIVIIIVIIIVIII–IXIX
SplitVIIVIVIIVIIVIIVIIIVIIIVIII
OsijekVIIIVIIVIVIIVIIVIIIVIIIVIII
ZadarIXVIIIVIVIIVIIVIIIVIIIVIII
Table 2. PGA (peak ground acceleration) values corresponding to the 1990 maps [19] for the return periods equal to 100 and 500 years, as well as the PGA values shown in most recent official seismic hazard maps for Croatia [8,9].
City Name19902011
100 yrs.500 yrs.Tr = 95 yrs.Tr = 475 yrs.
RockSoilRockSoil
Zagreb0.081–0.1990.159–0.3880.12–0.140.168–0.1960.22–0.260.308–0.364
Rijeka0.081–0.1990.159–0.1990.10.140.18–0.200.252–0.28
Split0.081–0.1020.159–0.1990.120.1680.220.308
Osijek0.081–0.1020.159–0.1990.04–0.060.072–0.1080.10–0.120.18–0.216
Zadar0.081–0.1020.159–0.1990.080.1120.180.252
Table 3. The number of dwellings, according to the year of construction [45].
Period of ConstructionNumberPercentage (%)
built before 1919112,2177.5
built between 1919–1945 84,9635.7
built between 1946–1960 138,8589.3
built between 1961–1970 288,56319.3
built between 1971–1980 325,20321.7
built between 1981–1990 247,08416.5
built between 1991–2000 129,6878.7
built between 2001–2005 70,4634.7
built from 200673,0724.9
unknown24,6401.6
unfinished18080.1
total 1,496,558100
Table 4. Classification of dwellings by the age of construction, a common type of construction, and seismic codes for Croatia.
Age Distributionbefore 19481948–19641964–19811981–20052005–20122010–Today
Seismic regulation (design standards)--1st earthquake design regulation 1Regulation 1981 [18]Pre-standards Eurocode 8 [22]
The common type of constructionStone and brick masonry buildings with wooden floorsBrick masonry with reinforced concrete floorsMasonry with RC floors (houses), confined masonry (residential buildings), and pre-code RC framesReinforced concrete buildings,
confined masonry buildings
1—after the 1963 Skopje earthquake.
Table 5. Number and area of the dwellings for the city of Osijek [45].
Number of DwellingsArea in m2
Osjecko-Baranjska County138,25211,054,777
Osijek51,1233,853,094
Table 6. Limitations of empirical and analytical methods.
MethodDisadvantages
Empirical- specific to particular seismo—tectonic, geotechnical, and built environments
- errors in classification of building damages
- intensity—uncertainty caused by subjectivity and discrete scale
- lack of data for larger, rarer earthquakes
- available databases capturing earthquake damage data may be incomplete or of poor quality
- unable to account for specific structural details and the strengthening of buildings
- Damage probability matrices (—based primarily on the observations of damages during past earthquakes may sometimes not be applicable for the prediction of damages during future seismic events.
- practices of building construction often change significantly after disastrous earthquakes—the performance of new buildings cannot be then represented by existing probability matrices
- vulnerability classes are defined for different building typologies based only on the material used in construction and on the structural system (and in part on the particularities of earthquake-resistant design) while neglecting the height range (number of stories)
Analytical- the significant computational effort is needed while there are limitations in modeling capabilities
- involve assumptions that can cause significant discrepancies in results
- variation in results, depending on the use of different modeling techniques, input data, and ways to assign characteristics to the model
Table 7. Mean damage grades, most probable damage states vs. EMS-98 damage grades [70].
Mean Damage Grade IntervalsMost Probable Damage StateEMS-98 Damage Grade
0–0.5NoneD0
0.5–1.5Slight D1 (Grade 1)
1.5–2.5Moderate D2 (Grade 2)
2.5–3.5Substantial to heavyD3 (Grade 3)
3.5–4.5Very heavyD4 (Grade 4)
4.5–5.0DestructionD5 (Grade 5)

