Article

Community Acceptance of Wind Energy Developments: Experience from Wind Energy Scarce Regions in Europe

by
Merethe Dotterud Leiren
1,*,
Stine Aakre
1,
Kristin Linnerud
1,
Tom Erik Julsrud
1,
Maria-Rosaria Di Nucci
2 and
Michael Krug
2
1
CICERO Center for International Climate Research, 0349 Oslo, Norway
2
Environmental Policy Research Centre, Freie Universität Berlin, D-14195 Berlin, Germany
*
Author to whom correspondence should be addressed.
Sustainability 2020, 12(5), 1754; https://doi.org/10.3390/su12051754
Submission received: 3 February 2020 / Revised: 22 February 2020 / Accepted: 24 February 2020 / Published: 26 February 2020

Abstract

:
Renewable energy plays an important role in the transition to a low emission society, yet in many regions energy projects have resulted in increasing societal polarization. Based on a comprehensive literature review and a survey among stakeholders from specific regions in Germany, Italy, Latvia, Norway, Poland and Spain with little prior experience with wind energy, we highlight six categories of factors that shape community acceptance of onshore wind energy development: technical characteristics of wind energy projects, environmental impacts, economic impacts, societal impacts, contextual factors and individual characteristics. We identify key similarities in acceptance-related patterns of wind energy development across the selected regions, but also important differences, highlighting the very context-specific nature of community acceptance. The findings contribute to improving the understanding of the forces, factors and relationships at play between policy frameworks and perceptions of wind energy under different conditions. We conclude by proposing policy recommendations regarding measures to increase the positive impacts and reduce the negative impacts of wind energy projects, and to strengthen existing drivers and reduce barriers to community acceptance of wind energy development.

1. Introduction

The transition towards a low-carbon society is dependent on further electrification based on renewable energy. However, in many regions, energy projects have resulted in rising societal polarization. Onshore wind energy development is one such area, where debates about the development of energy projects are animated. Implementation at a local level has sometimes proved to be more challenging than expected. Mapping lead times for projects in the EU in the period 2007-2008, a study found that more than 20% of wind energy projects were delayed and nearly 20% seriously threatened due to appeals from local communities [1]. An extensive literature gives insights into why such conflicts arise, pointing to factors such as the technical characteristics of projects [2,3], environmental [4,5,6], economic [5,6,7,8,9] and societal [10,11,12,13] impacts, as well as contextual factors [14,15,16,17] and specific individual characteristics (e.g., values, preferences and beliefs) [7,8,18,19,20]. While there is considerable knowledge about the general acceptance of wind energy technology and policies [21], there is still a need for more systematic knowledge of the relative importance of the different social acceptance factors in shaping community acceptance of specific wind energy projects.
This article provides novel insights into the factors influencing community acceptance and contributes to improving the understanding of the forces, factors and relationships at play between policy frameworks and perceptions of wind energy under different conditions. We systematically explore community acceptance of wind energy development in European regions or countries, which vary in terms of their technical, regulatory and socio-economic conditions for wind energy, but have in common the fact that wind energy development rates have been comparatively low so far, despite satisfactory wind harvest conditions.
Our research addresses the following questions: How important are different acceptance factors in shaping community acceptance? Is there variance across regions and countries in terms of the significance of these factors for community acceptance of onshore wind energy? Drawing on a comprehensive literature review and an analytical framework to study the social acceptance of wind energy development, we developed a survey, where stakeholders in the selected regions were asked to assess the importance of different acceptance factors in shaping community acceptance. Combining information on how frequently a given acceptance factor is reported by the regions with stakeholders’ evaluations of the level of impact of each factor provides novel insights into the overall criticality of each acceptance factor in shaping community acceptance of wind energy projects across the regions, including important similarities and differences in the drivers of and barriers to community acceptance.
The remainder of this paper is structured as follows. In Section 2, we present the literature review and analytical framework for studying community acceptance of specific wind energy projects. In Section 3, we discuss the selection of regions in this study and present the stakeholder survey and data collection. In Section 4, we present the results, followed by a discussion of the main findings in in Section 5. In Section 6 we offer concluding remarks and policy advice.

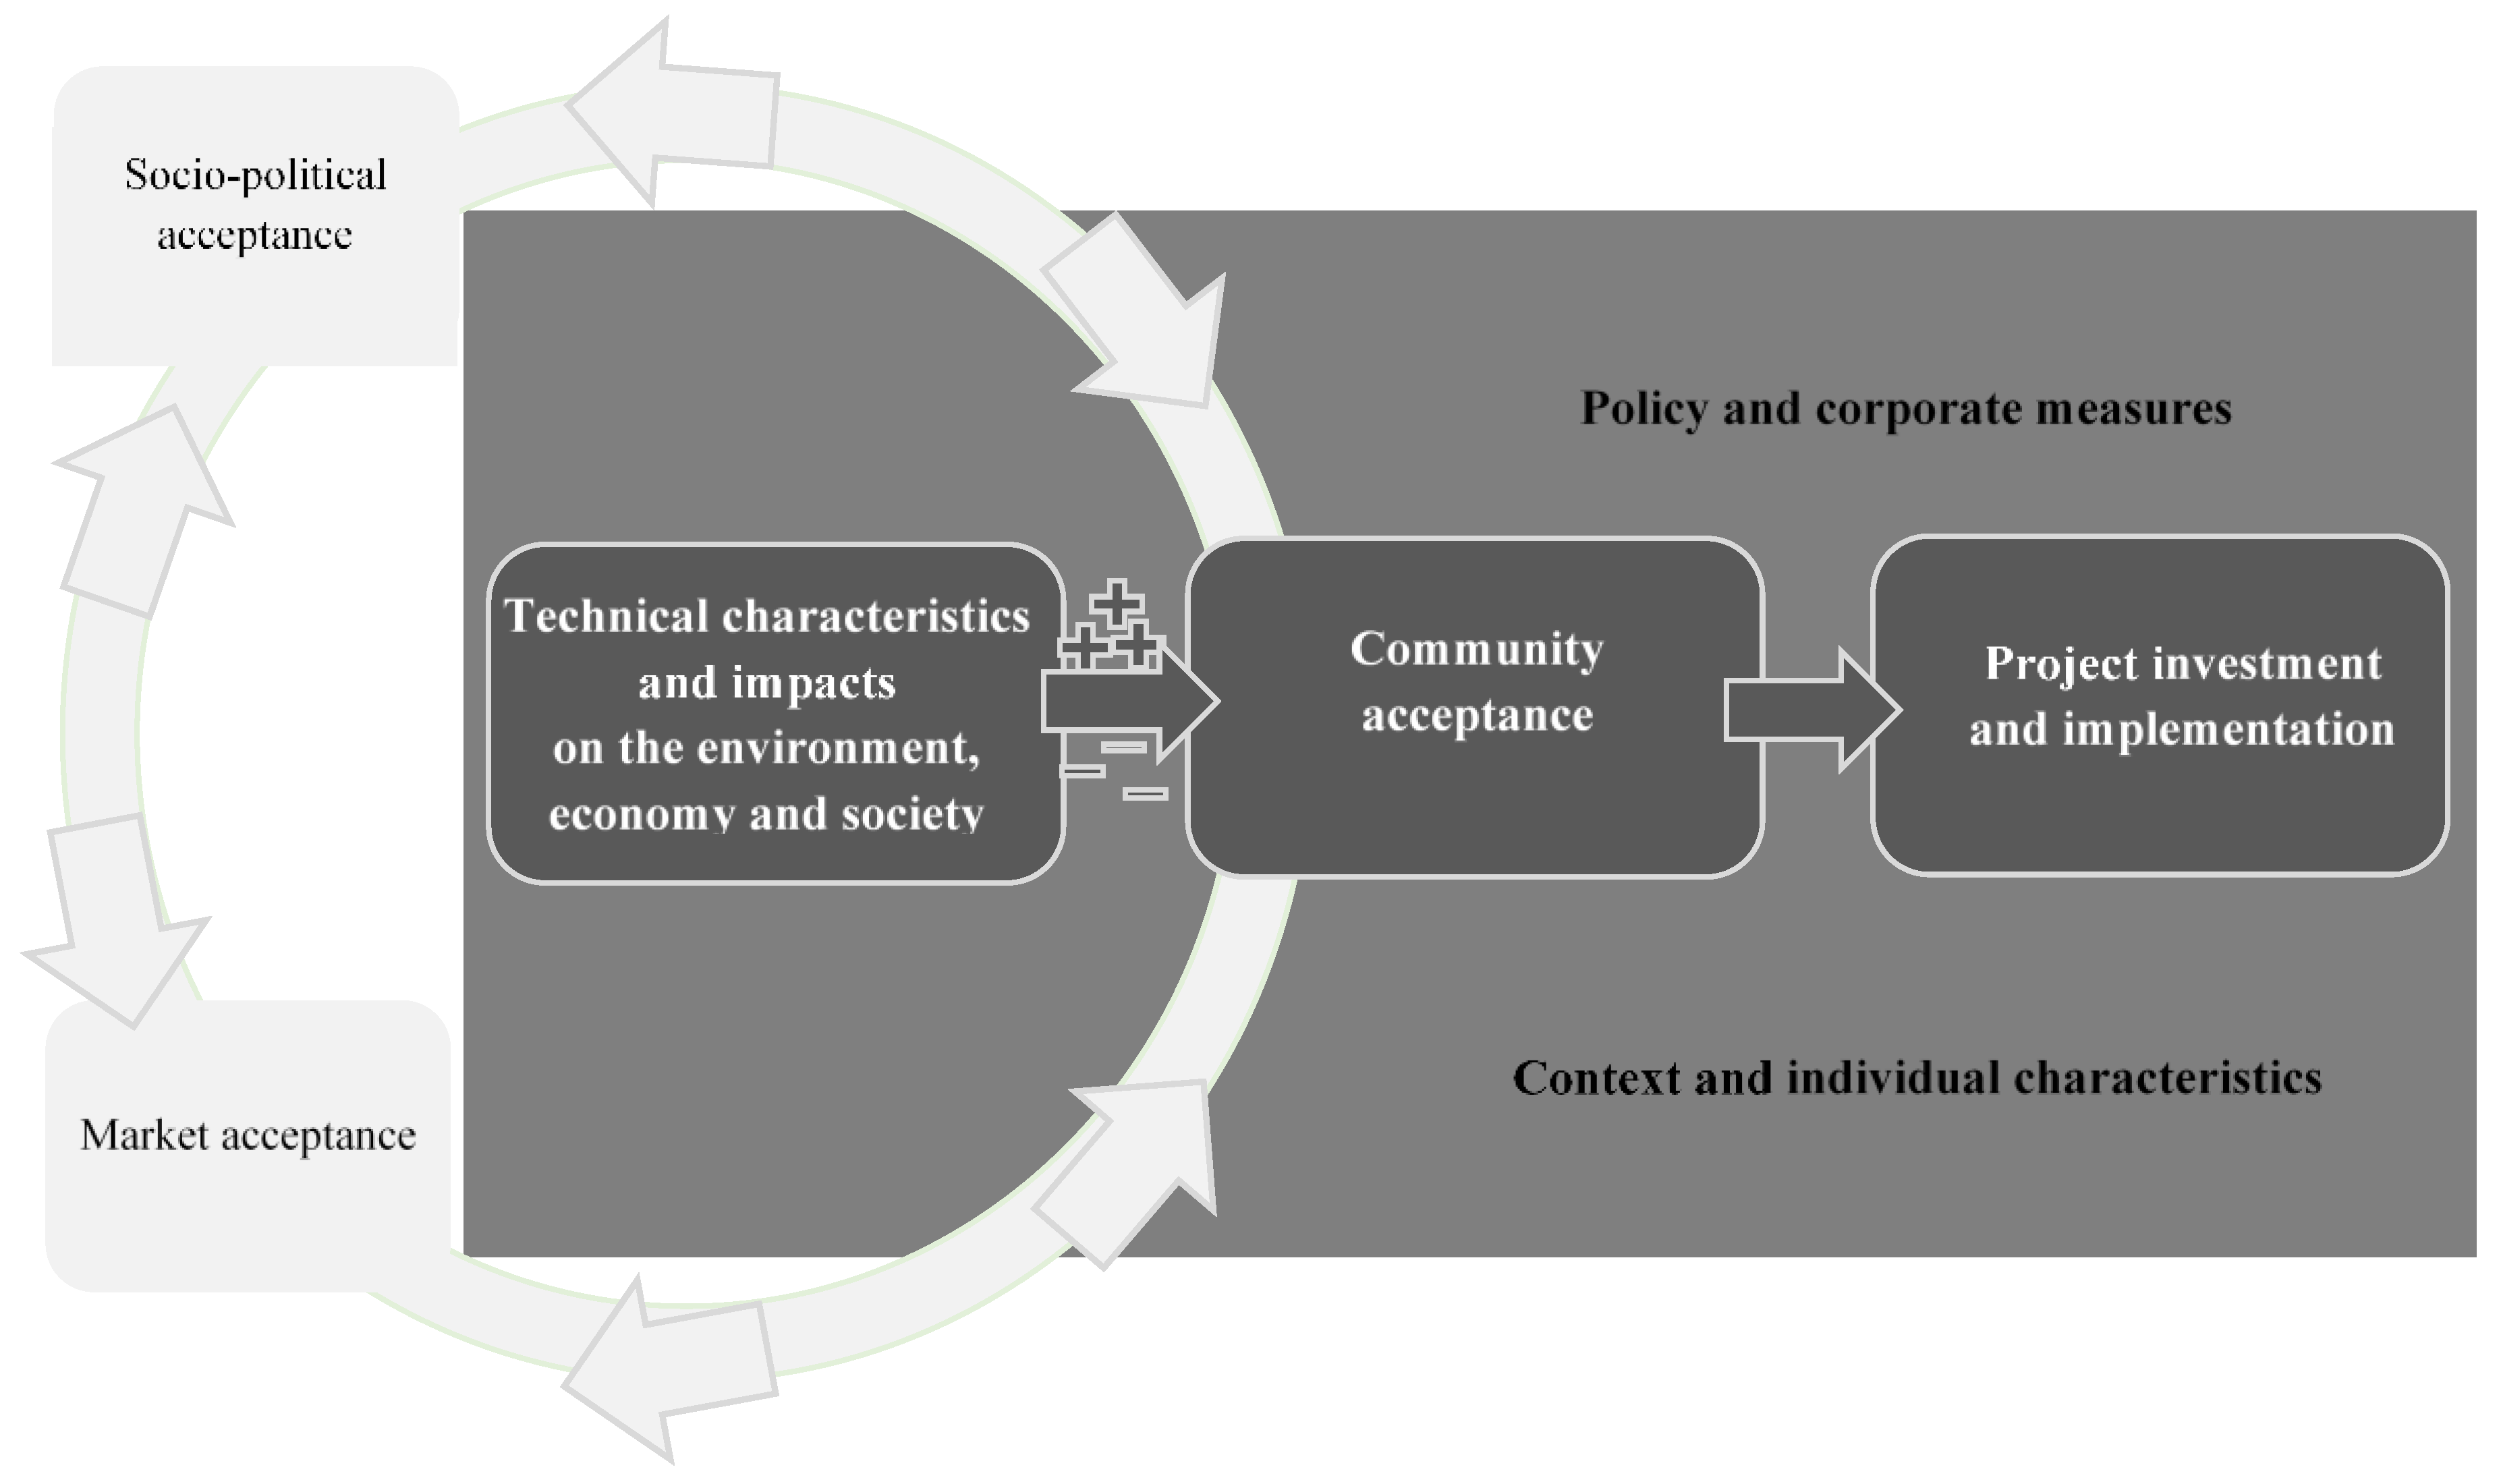
2. Literature Review and Analytical Framework

Broadly speaking, social acceptance may be defined as ‘a favourable or positive response (including attitude, intention, behaviour and—where appropriate—use) relating to a proposed or in situ technology or socio-technical system by members of a given social unit (country or region, community or town and household, organization)’ [22]. However, while there might be a national interest in favor of wind energy [23], this does not necessarily mean that there is local support in favor of specific wind energy projects [5], as attitudes toward wind energy in general are different from attitudes to specific wind energy projects [17]. We focus on community acceptance of specific wind energy projects, that is the acceptance of specific wind energy projects at a local level by local stakeholders. An extensive literature shows that such acceptance (as an outcome) is produced within a large, complex and dynamic process [9,21,24,25,26].
To assess differences and similarities in acceptance-related patterns of wind energy development, we first carried out a comprehensive literature review. The literature review focuses on the key peer-reviewed contributions published in scientific journals, primarily from the period 2007 to the present. The relevant literature was identified through several key word searches (e.g., “wind energy” or similar, “social acceptance” or similar) in Scopus, Web of Science, and Google Scholar. The articles represent a broad range of themes, variables, disciplines and methodologies.
There are, in particular, six categories of factors that stand out in the literature as contributing to shaping community acceptance of specific wind energy projects: (1) technical characteristics of the project, (2) environmental impacts, (3) societal impacts, (4) economic impacts, (5) contextual factors and (6) individual characteristics. Policy and corporate measures modify how the relevant impacts are perceived. Examples of such measures include activities aimed at increasing transparency (e.g., sharing of project relevant information) and inclusiveness (e.g., involving all relevant stakeholders) to enhance the perceived procedural justice, and the establishment of a benefit-sharing scheme (e.g., a community fund, local contracting and local ownership) to enhance perceived distributional justice.
The technical characteristics of wind energy projects, including the size of modern projects (e.g., the number of turbines and turbine height), the visibility of wind turbines, the distance of wind turbines from residential areas, and the need for grid infrastructure improvement and other infrastructure improvement (e.g., transport and communications infrastructure) will influence the type and scope of impacts on the environment, economy and society, and consequently social acceptance [2,3] (For impacts of wind turbines on the grid, especially concerning power quality, see [27]). The capacities of wind turbines have witnessed a significant growth in the last decade; these plants have increased reliability and their acoustic interference has been improved [27]. Nonetheless, the size of modern wind turbines is perceived as a major barrier.
Environmental impacts, including impacts on the physical environment (e.g., landscape, protected areas, increased traffic), biodiversity and wildlife and greenhouse gas emissions (GHG) are important in determining social acceptance. The potential of wind energy to reduce GHG emissions is an argument often used by those in favor of the technology [28,29,30]. However, scholars also argue that concern for climate change alone does not fully explain support for wind energy development [31]. The impact of wind energy development on species and ecosystems has been the subject of several studies, especially the potential impacts on birds and bats [4]. Concerns about impacts on wildlife and nature conservation play a role in shaping community acceptance of wind energy [5,6]. Obviously, studies on how people perceive and value the climate and nature impacts of wind energy development should be complemented by how natural scientists and economists measure and assess the same impacts, not least because both proponents of and opponents to wind energy may disguise their real motives behind a climate or nature rationale. An example of the latter is given by Krug and Ohlhorst [32], who find that the actual motives for opposing a project may be masked by nature/species protection rationales, as these issues may have more legal relevance in the planning and authorization procedures. This phenomenon has also been described as an “environmentification of arguments” [33].
As with the introduction of any new technology, concerns have been raised regarding societal impacts, and the fact that wind energy development could adversely affect human health and well-being and quality of life, for example due to wind turbine noise, and the extent to which acoustic pollution is associated with health issues such as learning, sleep and cognitive disruptions as well as stress and anxiety. Knopper and Ollson [10] (p. 1) have reviewed the existing literature on the potential health effects and concluded that ‘no peer reviewed scientific journal articles demonstrate a causal link between people living in proximity to modern wind turbines, the noise (audible, low frequency noise, or infrasound) they emit and resulting physiological health effects’. Researchers suggest that such annoyance is related to individual characteristics, rather than the actual noise from wind turbines [34,35]. However, such annoyance or the perceived effect may still affect social acceptance.
Economic impacts, including impacts on the tourism and agricultural sectors, on local profits and income generation (e.g., jobs, tax, local added value generation), on individuals’ economy (e.g., electricity prices, income to landowners, property values) affect social acceptance, as does the extent to which economic costs and benefits are perceived as being fairly distributed between actors within the community and between communities hosting wind energy projects and other communities. Support for wind energy is largely associated with perceived economic benefits, including ripple effects on local employment and economic activity [5,6]. Wind energy projects may also have negative impacts on the economy, for example in cases where recreational tourism is affected. This could negatively affect acceptance [5,7,8], although wind energy can also create new forms of tourism [36]. Many countries try to solve issues related to fair distribution by encouraging or facilitating the participation of more residents on the ownership side. Research shows that local ownership increases local acceptance of wind energy projects [37,38,39,40,41,42], while increased ownership by multinational companies negatively affects acceptance [9]. Interestingly, an announced change of ownership, from national to local or vice versa, may adversely affect peoples’ attitudes, implying a preference for status quo [43].
Contextual factors shape how the environmental, societal and economic impacts of wind energy development are perceived and valued, and hence social acceptance. Factors include national or regional energy market characteristics, the planning and permitting process (e.g., opportunities for informal/formal participation and consultation, information about projects and the transparency of the permitting process, trust in processes and information), governance and regulatory frameworks (e.g., national/regional/local targets, plans and policies), and trust in key actors (national/regional/local decision-makers, investors). Research shows that attitudes to wind energy are more positive if the electricity produced is used nationally and contributes to industrial development than if it is exported [14,15]. Research shows that people are concerned with a fair process. People want to be invited to participate, be heard and taken seriously, and to have access to accurate information [16]. The stage at which people are included in the process is also important. It may trigger opposition if people are only invited to participate after a plan has been announced [17].
Individual characteristics (e.g., socio-cultural values, sense of place, self-identity, place attachment, the discourse on wind energy in the public sphere/media, the political climate for wind energy development) are also important for social acceptance. Pasqualetti [8] finds that one reason for opposition is concern that wind energy brings about a weakening of the cultural roots and lifestyles that people have established, including immutability (an expectation of “landscape permanence”), and place identity (see also [7,18]). Other studies show that direct knowledge and familiarity with wind energy makes people more positively tuned [19,20]. However, the positive effect of experience can be replaced by skepticism if people feel that wind energy development has reached a saturation point where they live. An interesting finding is that people seem more concerned with wind energy development located in their recreational areas (e.g., where they have a cottage or go hiking), than where they live [44].
Although the existing literature provides insights into which factors may affect social acceptance in general, there is a lack of systematic knowledge of the relationship between local contexts and which acceptance factors ultimately shape community acceptance of specific wind energy projects. To explore the salience of the different acceptance factors in shaping community acceptance of specific wind energy projects, we developed an analytical framework (documented in [25]), depicted in Figure 1 below. Specifically, we explore the relative importance of the six main categories of acceptance factors identified in the literature on social acceptance (technical characteristics (1), impacts on the environment (2), economy (3) and society (4), context (5) and individual characteristics (6)) in shaping community acceptance in selected regions in six European countries. Figure 1 shows that the technical characteristics of wind energy projects and the (potential/perceived/anticipated/feared) impacts of wind energy projects on the environment, economy and society affect community acceptance, which again is one important condition for project investment and implementation. The context and individual characteristics, and policy and corporate measures, shape how the technical characteristics and impacts on the environment, economy and society are perceived and valued.

3. Materials and Methods

3.1. Case Selection

The majority of the EU Member States are well on track to meeting the renewable energy targets laid down in the Renewable Energy Directive (RED). However, for a number of Member States, the achievement of these targets has faced difficulties due to a steeper slope of the trajectory and persistent market barriers. This applies in particular to the development of wind energy. For example, there are several countries and regions within the EU where wind energy deployment rates have been comparatively low so far, despite satisfactory wind harvest conditions [45]. The article considers the case of selected regions in Germany, Spain, Italy, Latvia, Poland and Norway. These countries have been selected because they represent a variety of realities ranging from ample wind energy penetration to very scarce penetration and different socio-economic and cultural conditions and cover the experience of northern as well as southern regions and of two central Eastern European countries. We focused on so-called wind energy scarce regions (WESR), defined as regions with considerably lower than EU average wind energy penetration levels. The selected regions are Saxony and Thuringia in Germany, the Balearic Islands in Spain, Latium and Abruzzo in Italy, most of Latvia, the Warmian-Masurian province in Poland and mid-Norway.
The cumulative capacity of on-shore and off-shore wind energy reached 178.8 GW in EU-28 in 2018, and wind energy met 14% of the annual electricity demand [46]. Latvia and Poland are among those countries with fairly low wind gross electricity penetration levels as compared to the EU average [46]. The same applies to Norway, a member of the European Economic Area. Italy has a penetration level below the EU average, with peaks in some regions like Sicily, Apulia, Sardinia and in general in the South, whilst in the selected regions of Latium and Abruzzo wind energy is largely underdeveloped. Although Germany and Spain have the largest cumulative installed wind energy capacity in Europe and above EU average penetration rates, there are regions even in those two countries which have witnessed low wind energy penetration levels so far, despite satisfactory wind harvest conditions (notably the selected regions Saxony and Thuringia in Germany and the Balearic Islands in Spain).
The number of wind turbines and the total installed capacity (MW) varies significantly between the selected regions. In 2018, the installed capacity reached 1205 and 1573 MW, while the number of turbines was 892 and 863, respectively, in Saxony and Thuringia [47]. In the Balearic Islands, there is only one wind energy project, the Es Mila wind farm, with a total installed capacity of less than 4 MW (four turbines). In 2018, installed capacity was 1695 MW and the number of turbines was 610 in Norway [48]. In Abruzzo, total installed capacity is 264 MW and the number of wind energy plants is 47. In Latium, the total installed capacity is 71 MW and the number of wind energy plants is 69 [49]. In Latvia, the total installed capacity amounted to 66 MW in 2018 [46], while, in the Warmian-Masurian province, total installed capacity was 354 MW and the number of installations was 43 in 2016 [50].
In terms of the share of renewable energy in gross final energy consumption, Norway ranks the highest with 71% renewables in 2017, followed by Latvia (39%), Italy (18%), Spain (17.5%), Germany (15.5%), and Poland (11%) [51]. In Norway, opponents of wind energy point to the fact that Norwegian nature should not be destroyed when the electricity generation is already fully renewable (98% of the electricity production is from renewable energy sources). This is in contrast to, for example, Poland, which is highly dependent on coal and where concerns regarding the social welfare effects of phasing out coal are prevailing. Safeguarding coal interests is therefore more important than climate policy [52]. Both high shares of renewables (e.g., Norway) as well as high shares of fossil fuels (e.g. Poland) may contribute to form opposition to wind energy.

3.2. The Stakeholder Survey

To explore differences and similarities in acceptance-related patterns of wind energy development, we developed a survey which was distributed to stakeholders in the regions covered in this study. The design of the survey is based on work on two fronts. First, we categorized the barriers and drivers identified in the literature on social acceptance in an analytical framework to study community acceptance of specific wind energy projects. The survey included a set of statements designed to capture stakeholders’ evaluation of the extent to which specific acceptance factors constituted a barrier or driver of community acceptance of wind energy development in their region. Second, to ensure that the survey covered factors relevant to community acceptance in the specific regions in the six European countries covered, we relied on activities initiated in the WinWind project in each of the countries. Within the framework of six country desks, market actors, but also authorities, energy agencies, civil society groups and municipalities, engaged in discussing acceptance problems and in searching for practical solutions. The activities carried out yielded important insights into general and region-specific barriers to acceptance.
The acceptance factors covered in the survey are listed in Table 1 below.
Stakeholders were asked to evaluate the level of impact of barriers or drivers in their regions, using a scale from -3 to 3, where the values reflect the assessments described in Table 2 below. The respondents had the option to answer that they view the factor as ‘not relevant’ in the region. They were also given the opportunity to describe factors that prevent or enable wind energy development that were not covered in the survey and solutions that could help promote a socially inclusive uptake of wind energy.
By combining information about stakeholders’ evaluations of the level of impact of each factor with the frequency with which each factor was evaluated as a barrier or driver of community acceptance in the regions, we were able to assess the overall criticality of each factor in shaping community acceptance of wind energy development across the regions covered in this study.

3.3. Data Collection

The stakeholder consultations were carried out between May and July 2019. A total of 181 replies were received. Sixty questionnaires were rejected because they were incomplete or because the stakeholders were situated outside the key case regions (in Germany). This gave a net sample of 121 informants.
The list of included stakeholders is not a representative sample of the population, but a selection of stakeholders with specific knowledge about local barriers and drivers of community acceptance in the selected regions. They include representatives from the public administration at local, regional and national levels, politicians at local, regional and national levels, regulators, energy agencies, national electricity producers, regional electricity producers and distributors, local electricity producers and cooperatives, grid companies, project planners/developers, sub-contractors to wind energy developers, renewable energy/wind energy associations, environmental non-governmental organizations (NGOs), other NGOs, researchers and consultants, and others (e.g., farmers and local citizens). The invitations were distributed among both supporters and opponents of wind energy. Some of the stakeholders do not have a particular position in the region but have been invited as they still may have an opinion about the development of wind energy in the region.
The respondents’ affiliation is displayed in Figure 2 and Table 3 below. A total of 35% of the stakeholders work in national, regional and local public administrations. In the Warmian-Masurian province and the Balearic Islands, these stakeholders are all at the local level. In Norway and Latvia there are also several NGO representatives included in the panel, both environmental NGOs and other NGOs. In Germany, more than half of the stakeholders were project planners or developers.

4. Results

The surveys carried out in the six countries were not intended to be statistically representative, but as an additional consultation of stakeholders, which was intended to tie in with the discussion content of the activities in the country desks of the project WinWind. When interpreting the data, certain methodological limitations need to be taken into account. First, the number of responses is comparatively low, which makes it difficult to derive statistically robust correlations. However, our ambition was rather to consult stakeholders and to draw tentative conclusions regarding similarities and differences in perceptions and preferences between regions. Stakeholder and expert opinions and the opinions of the local population in host communities do not necessarily coincide. Therefore, a more complete picture of acceptance drivers and barriers might be obtained if stakeholder and expert estimations were complemented by public surveys in the target regions or host communities.

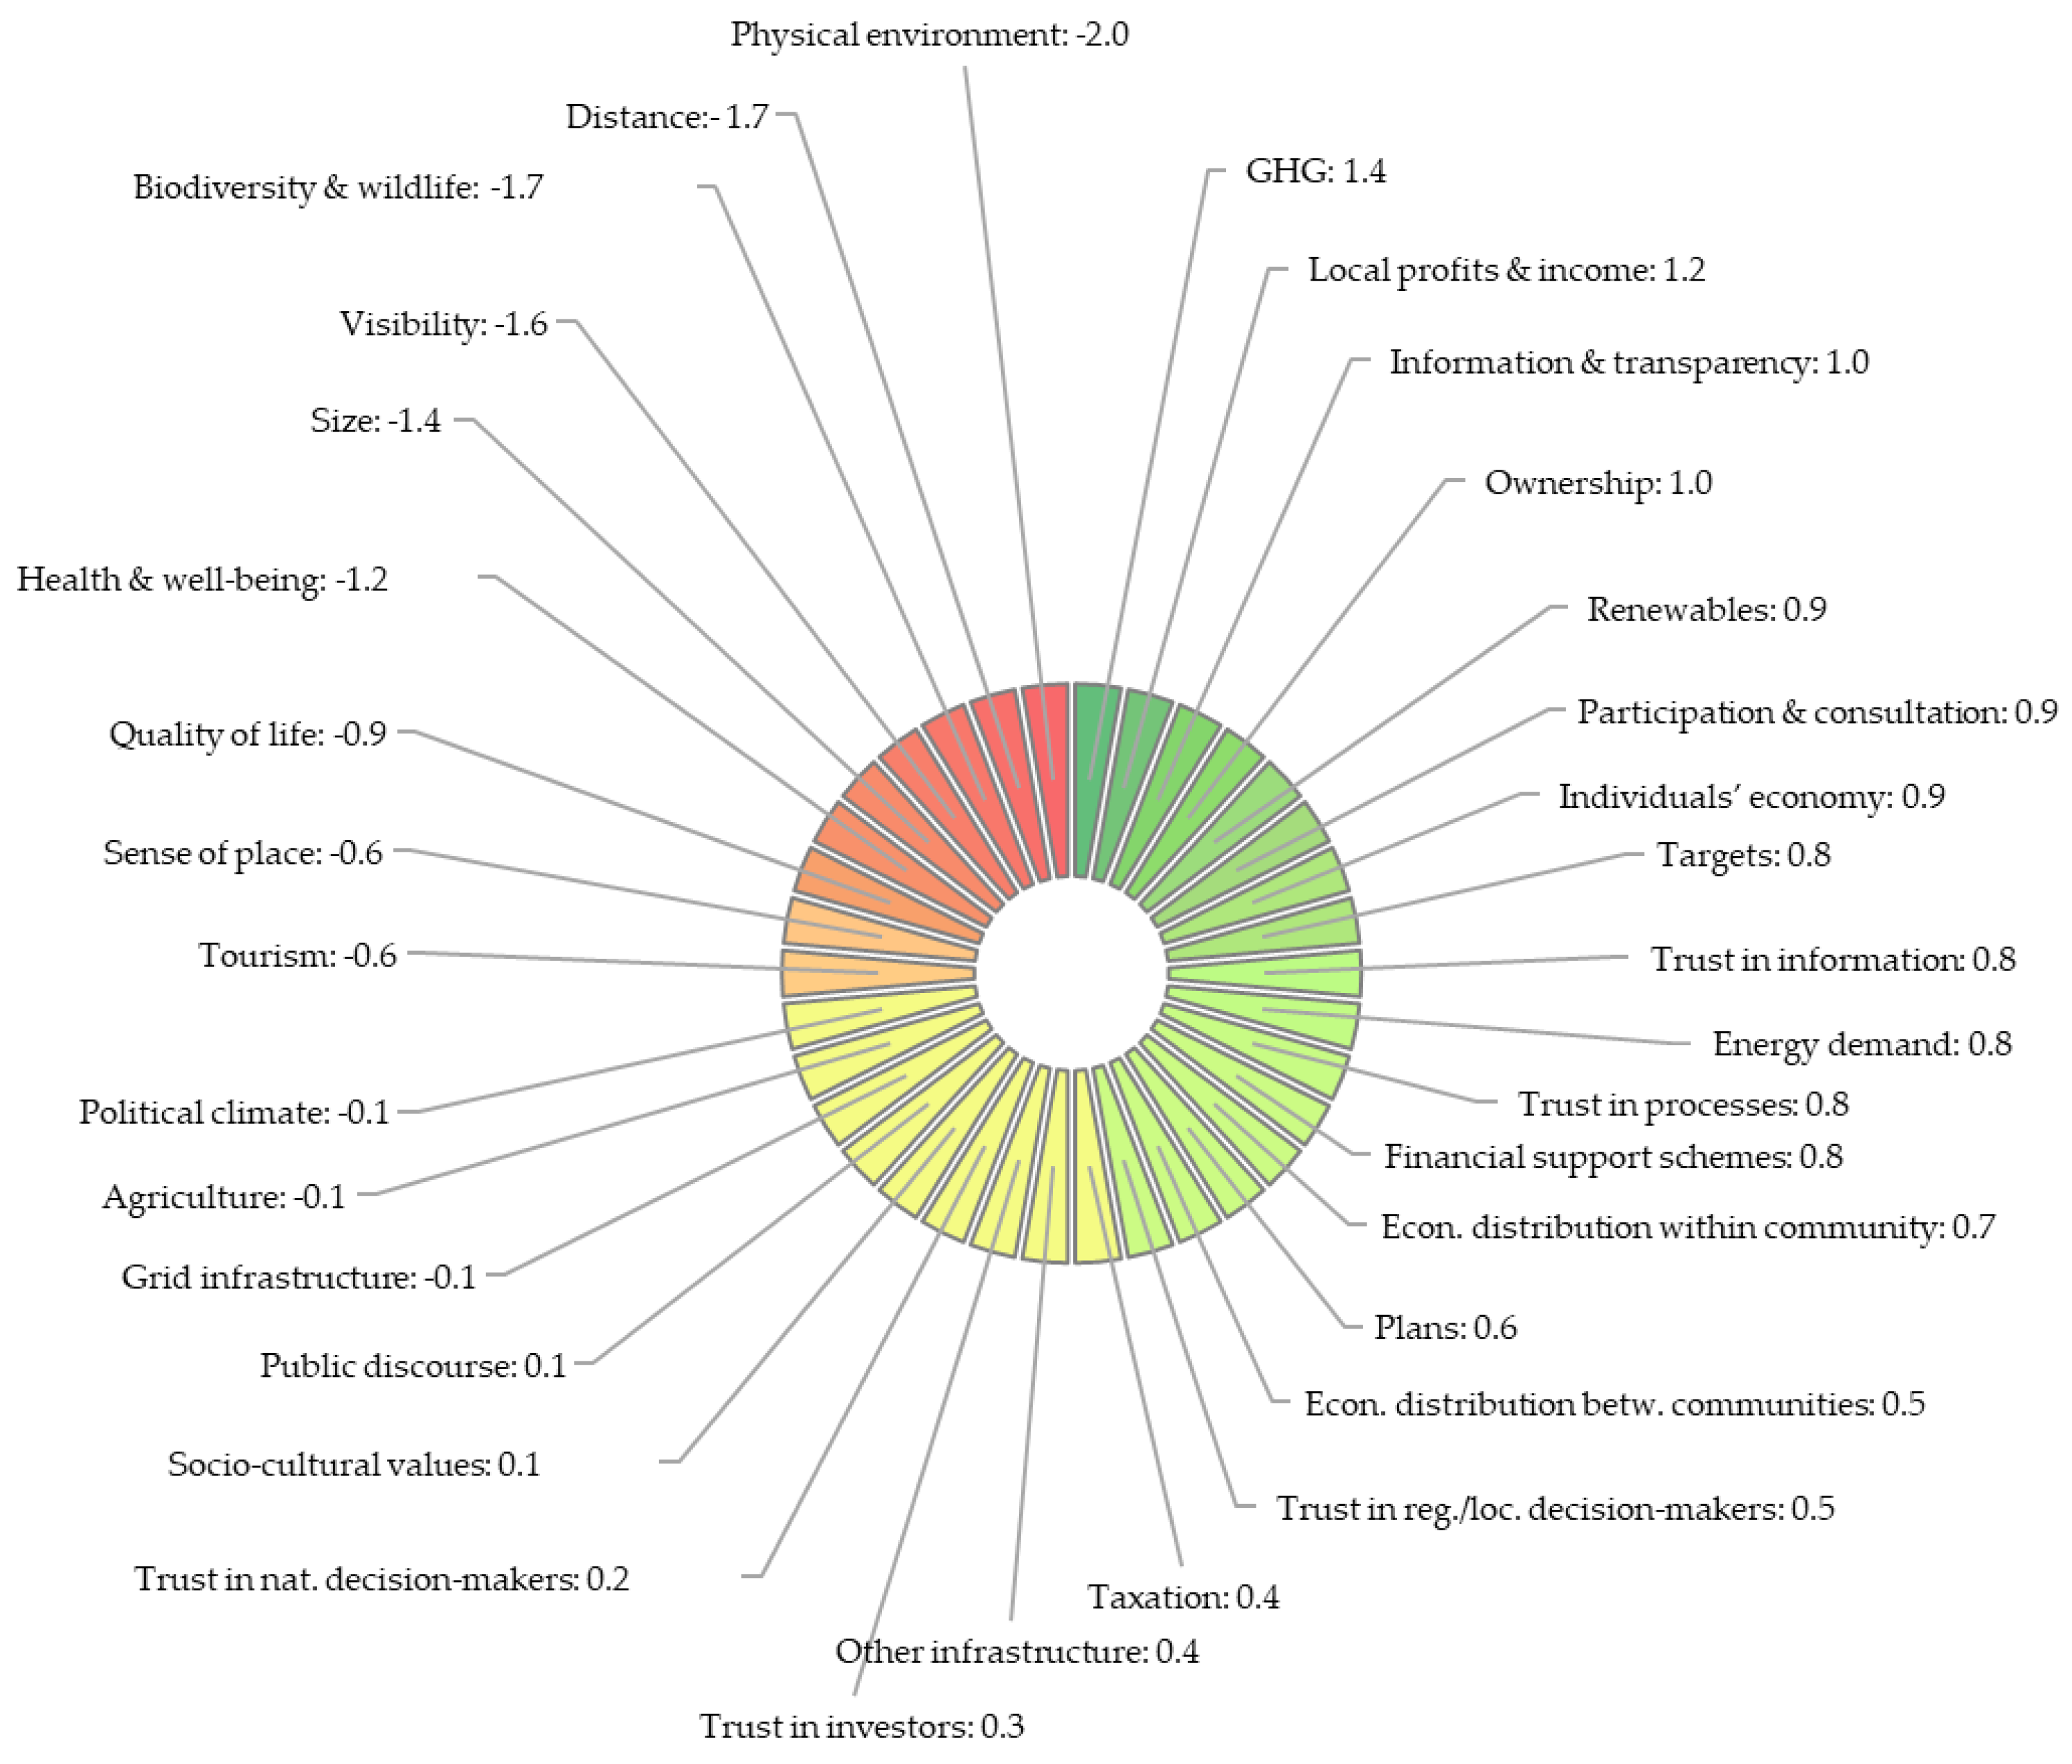
4.1. Cross-case Assessment

Figure 3 shows average impact scores across acceptance factor categories and regions. Impacts on society are evaluated as the acceptance factor category with the largest negative impact on social acceptance across regions (average across regions is −1.0, with regional averages ranging from −0.3 to −1.6), followed by the technical characteristics of projects (average score across regions is −0.9), impacts on the environment (average across regions is −0.8) and individual characteristics (average across regions is −0.1). Impacts on the economy and contextual factors are, on average, evaluated as having a positive impact on social acceptance, with average scores across regions of 0.5 and 0.7, respectively.

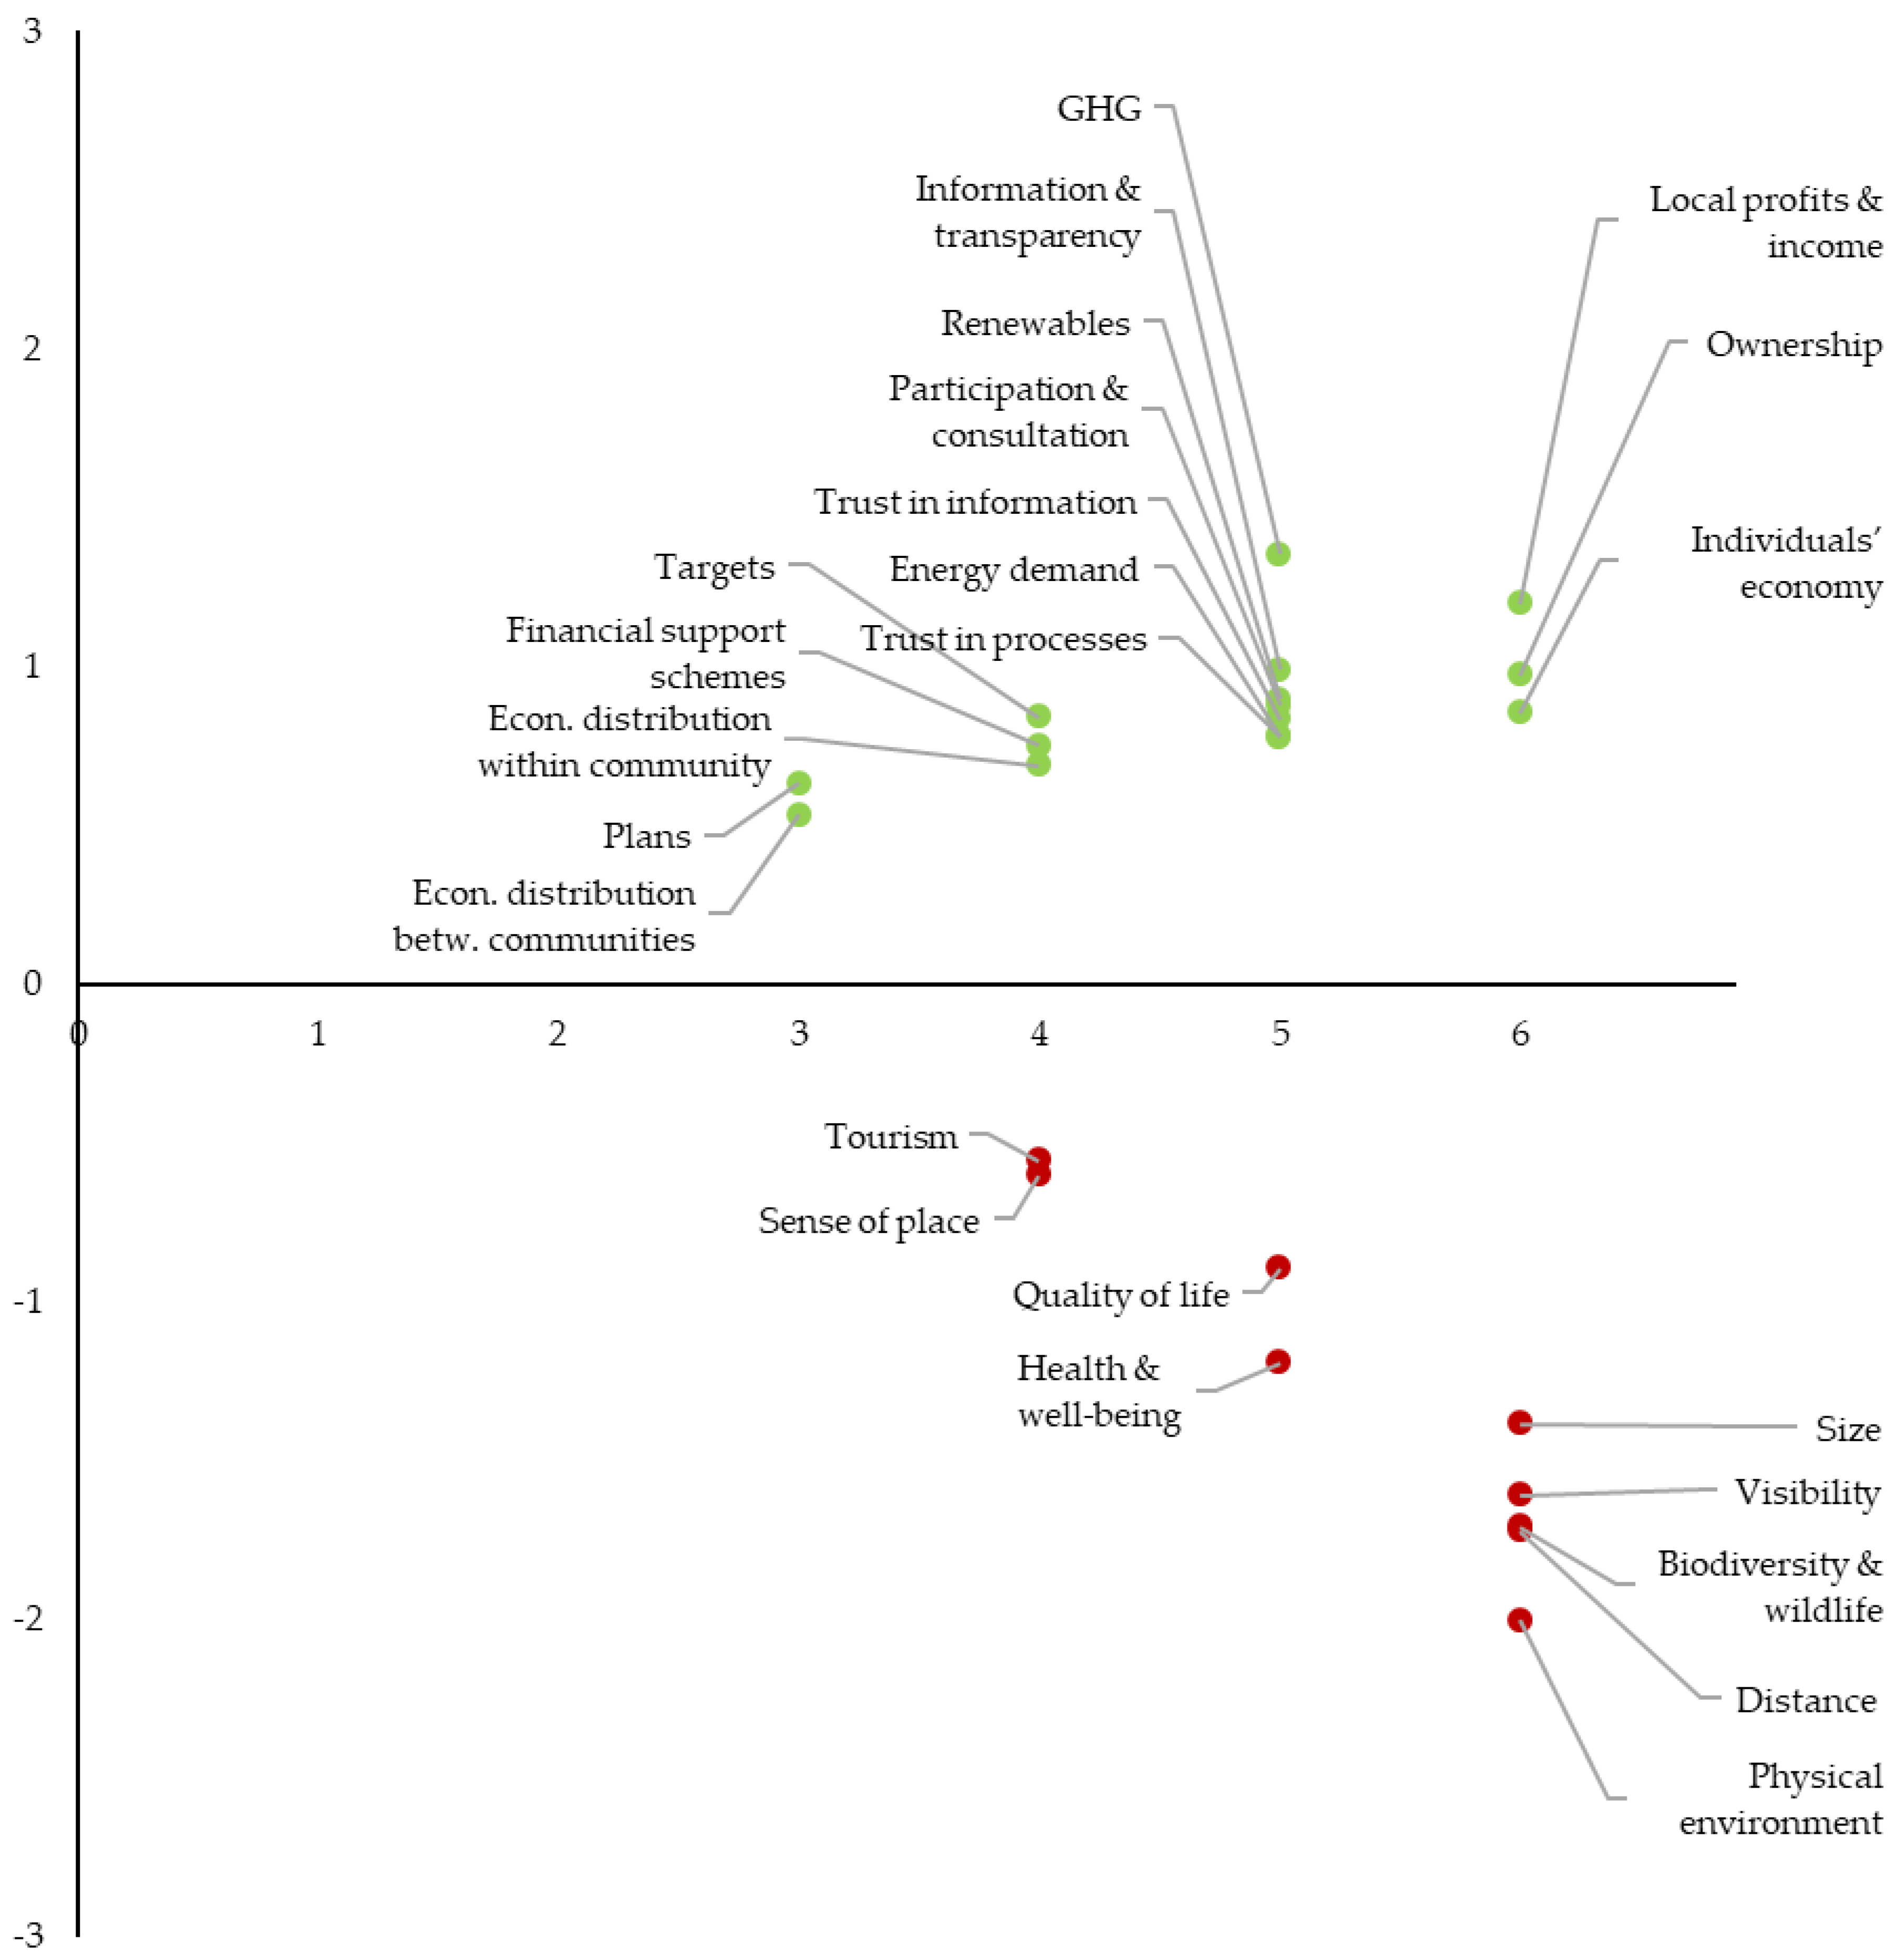
4.2. The Criticality of Social Acceptance Barriers and Drivers

In this section, following [53], we analyze the criticality of each acceptance factor as a function of:
  • its frequency;
  • its level of impact.
Regarding the frequency, scores range from 0 to 6, depending on how many of the regions have evaluated a specific acceptance factor as being either a barrier or a driver of social acceptance. We report the average results from the stakeholder consultations in each of the six following regions: 1) Norway (Mid-Norway); 2) Latvia; 3) Poland (the Warmia-Masuria province); 4) Spain (the Balearic Islands); 5) Italy (results from the stakeholder evaluations in Abruzzo and Latium are combined into one average); 6) Germany (results from the stakeholder evaluations in Saxony and Thuringia are combined into one average).
Regarding the level of impact, stakeholders were asked to evaluate each acceptance factor using a scale from −3 to 3, where the values reflect the assessments described in Table 2, above. The respondents also had the option to answer that they view the factor as ‘not relevant’ in their region (such answers have been excluded from the numerical analyses).
We round the average impact scores to the nearest whole number (-3 to +3), corresponding to the scale in Table 2. Thus, average scores ≤−0.5 are categorized as barriers (average scores ≤−2.5 are classified as a −3 barrier, factors with average scores between −2.49 and −1.5 are classified as a −2 barrier, while factors with average scores −1.49 and −0.5 are classified as a -1 barrier). Average scores ranging from −0.49 to +0.49 are categorized as neutral. Average scores ≥+0.5 are categorized as drivers (average scores ≥2.5 are classified as a +3 driver, average scores between 1.5 and 2.49 are classified as a +2 driver, and average scores between 0.5 and 1.49 are classified as a +1 driver).

4.2.1. The Criticality of Social Acceptance Barriers

Four factors have a rounded average score across the regions of −2, indicating that the factor will have a clear negative effect on acceptance. All four factors were evaluated as a barrier by all six regions (i.e., frequency score of 6). The most critical barrier is an environmental factor—impacts on the physical environment—with an average impact score of −2.0. The distance of wind turbines from residential areas (i.e., a technical characteristic) and impacts on biodiversity and wildlife (i.e., an environmental impact) both have an average score of −1.7 across regions, while the visibility of wind turbines (i.e., a technical characteristic) has an average score of −1.6.
Five factors have a rounded score across the regions of −1, which indicates that the factor has a small but negative impact on social acceptance. The most critical of these is the size of modern projects (i.e., a technical characteristic), with an average score of −1.4 and a frequency score of 6. The societal factors of health and well-being and quality of life have an average score of −1.2 and −0.9, respectively, and frequency scores of 5. The factors sense of place, self-identity, place attachment (i.e., an individual characteristic) and impacts on the tourism sector (i.e., an economic impact) both have an average score of −0.6 and a frequency score of 4.

4.2.2. The Criticality of Social Acceptance Drivers

Fifteen factors have a rounded average score across regions of +1, which indicates that the factor has a small but positive effect on acceptance.
In terms of criticality, impacts on GHG emissions—an environmental factor—has the highest impact score (average across regions of 1.4), but the factor was not evaluated as a driver by all regions (the frequency score is 5). The economic factor impacts on local profits and income generation has an impact score of 1.2, slightly lower than the score assigned to impacts on GHG emissions, but a frequency score of 6. The degree of local ownership of the plants has an average impact score of 1.0 and a frequency score of 6. Information about projects and the transparency of the permitting process has an overall impact score of 1.0, and a frequency score of 5. The other drivers have average scores between 0.5 and 0.9, and were reported as a driver by an increasing number of regions with increasing scores.
The criticality of the different acceptance factors is summarized in Figure 4. The figure shows that, compared to the drivers, the critical barriers to social acceptance are relatively few. Nevertheless, most critical acceptance factors identified are barriers.
Figure 5 below shows average scores across regions for each of the 34 acceptance factors. Impacts on the physical environment have the largest negative effect on acceptance across regions, while impacts on GHG emissions have the largest positive effect. Both are environmental factors.

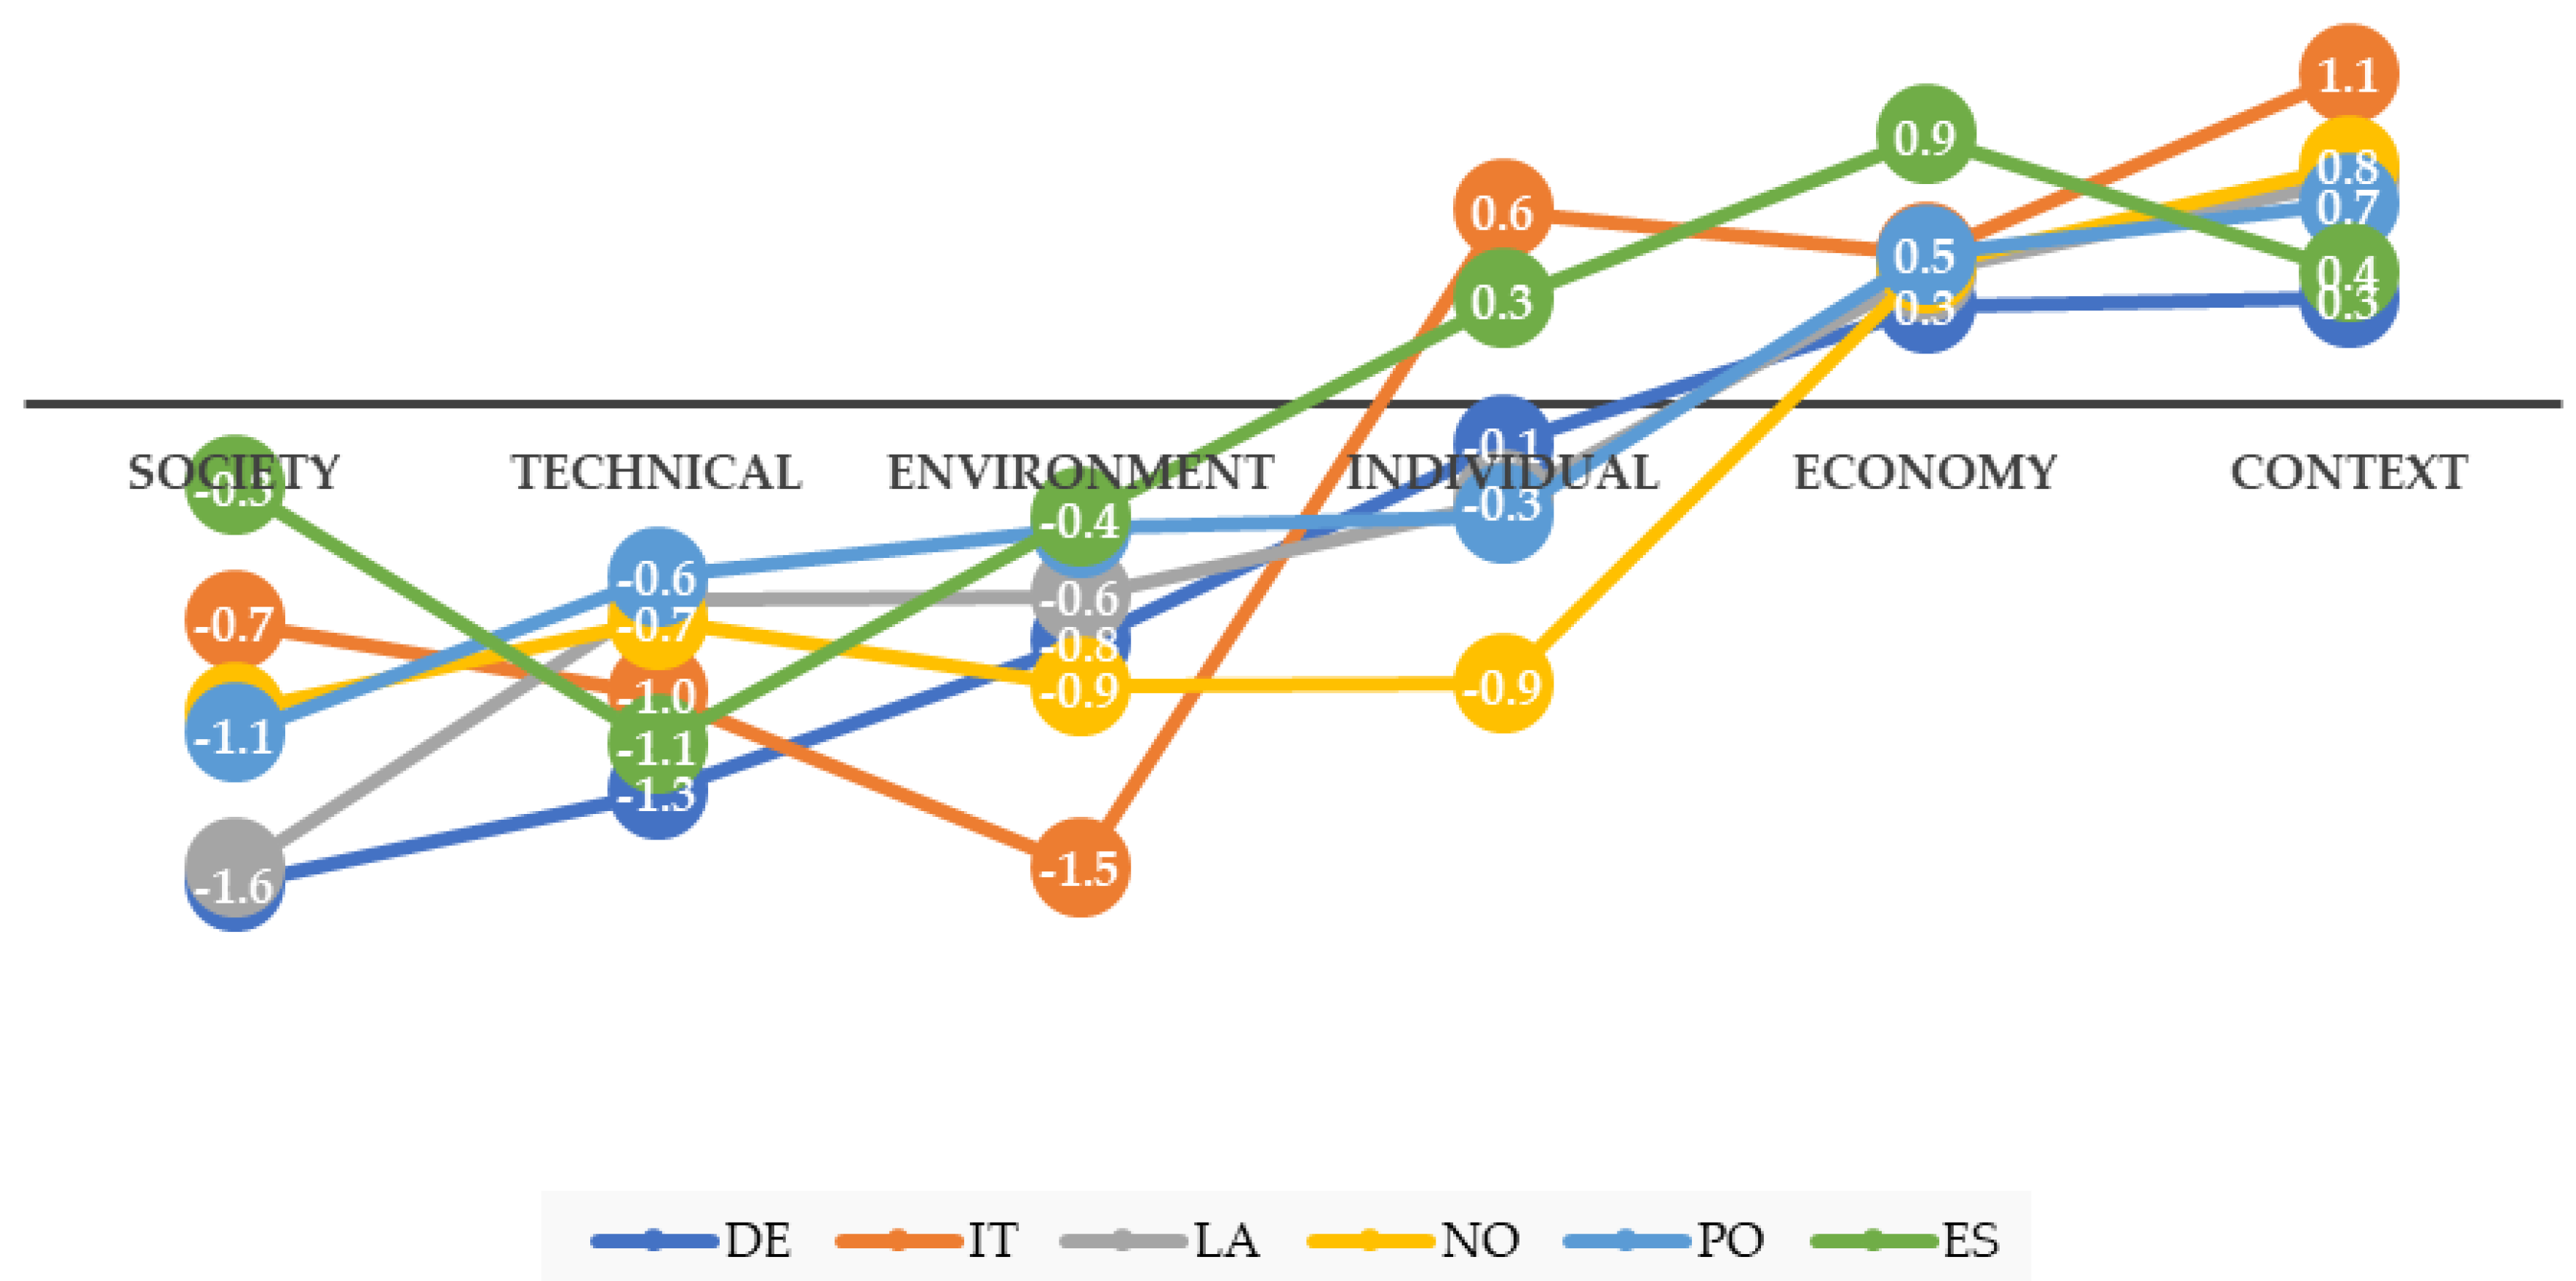
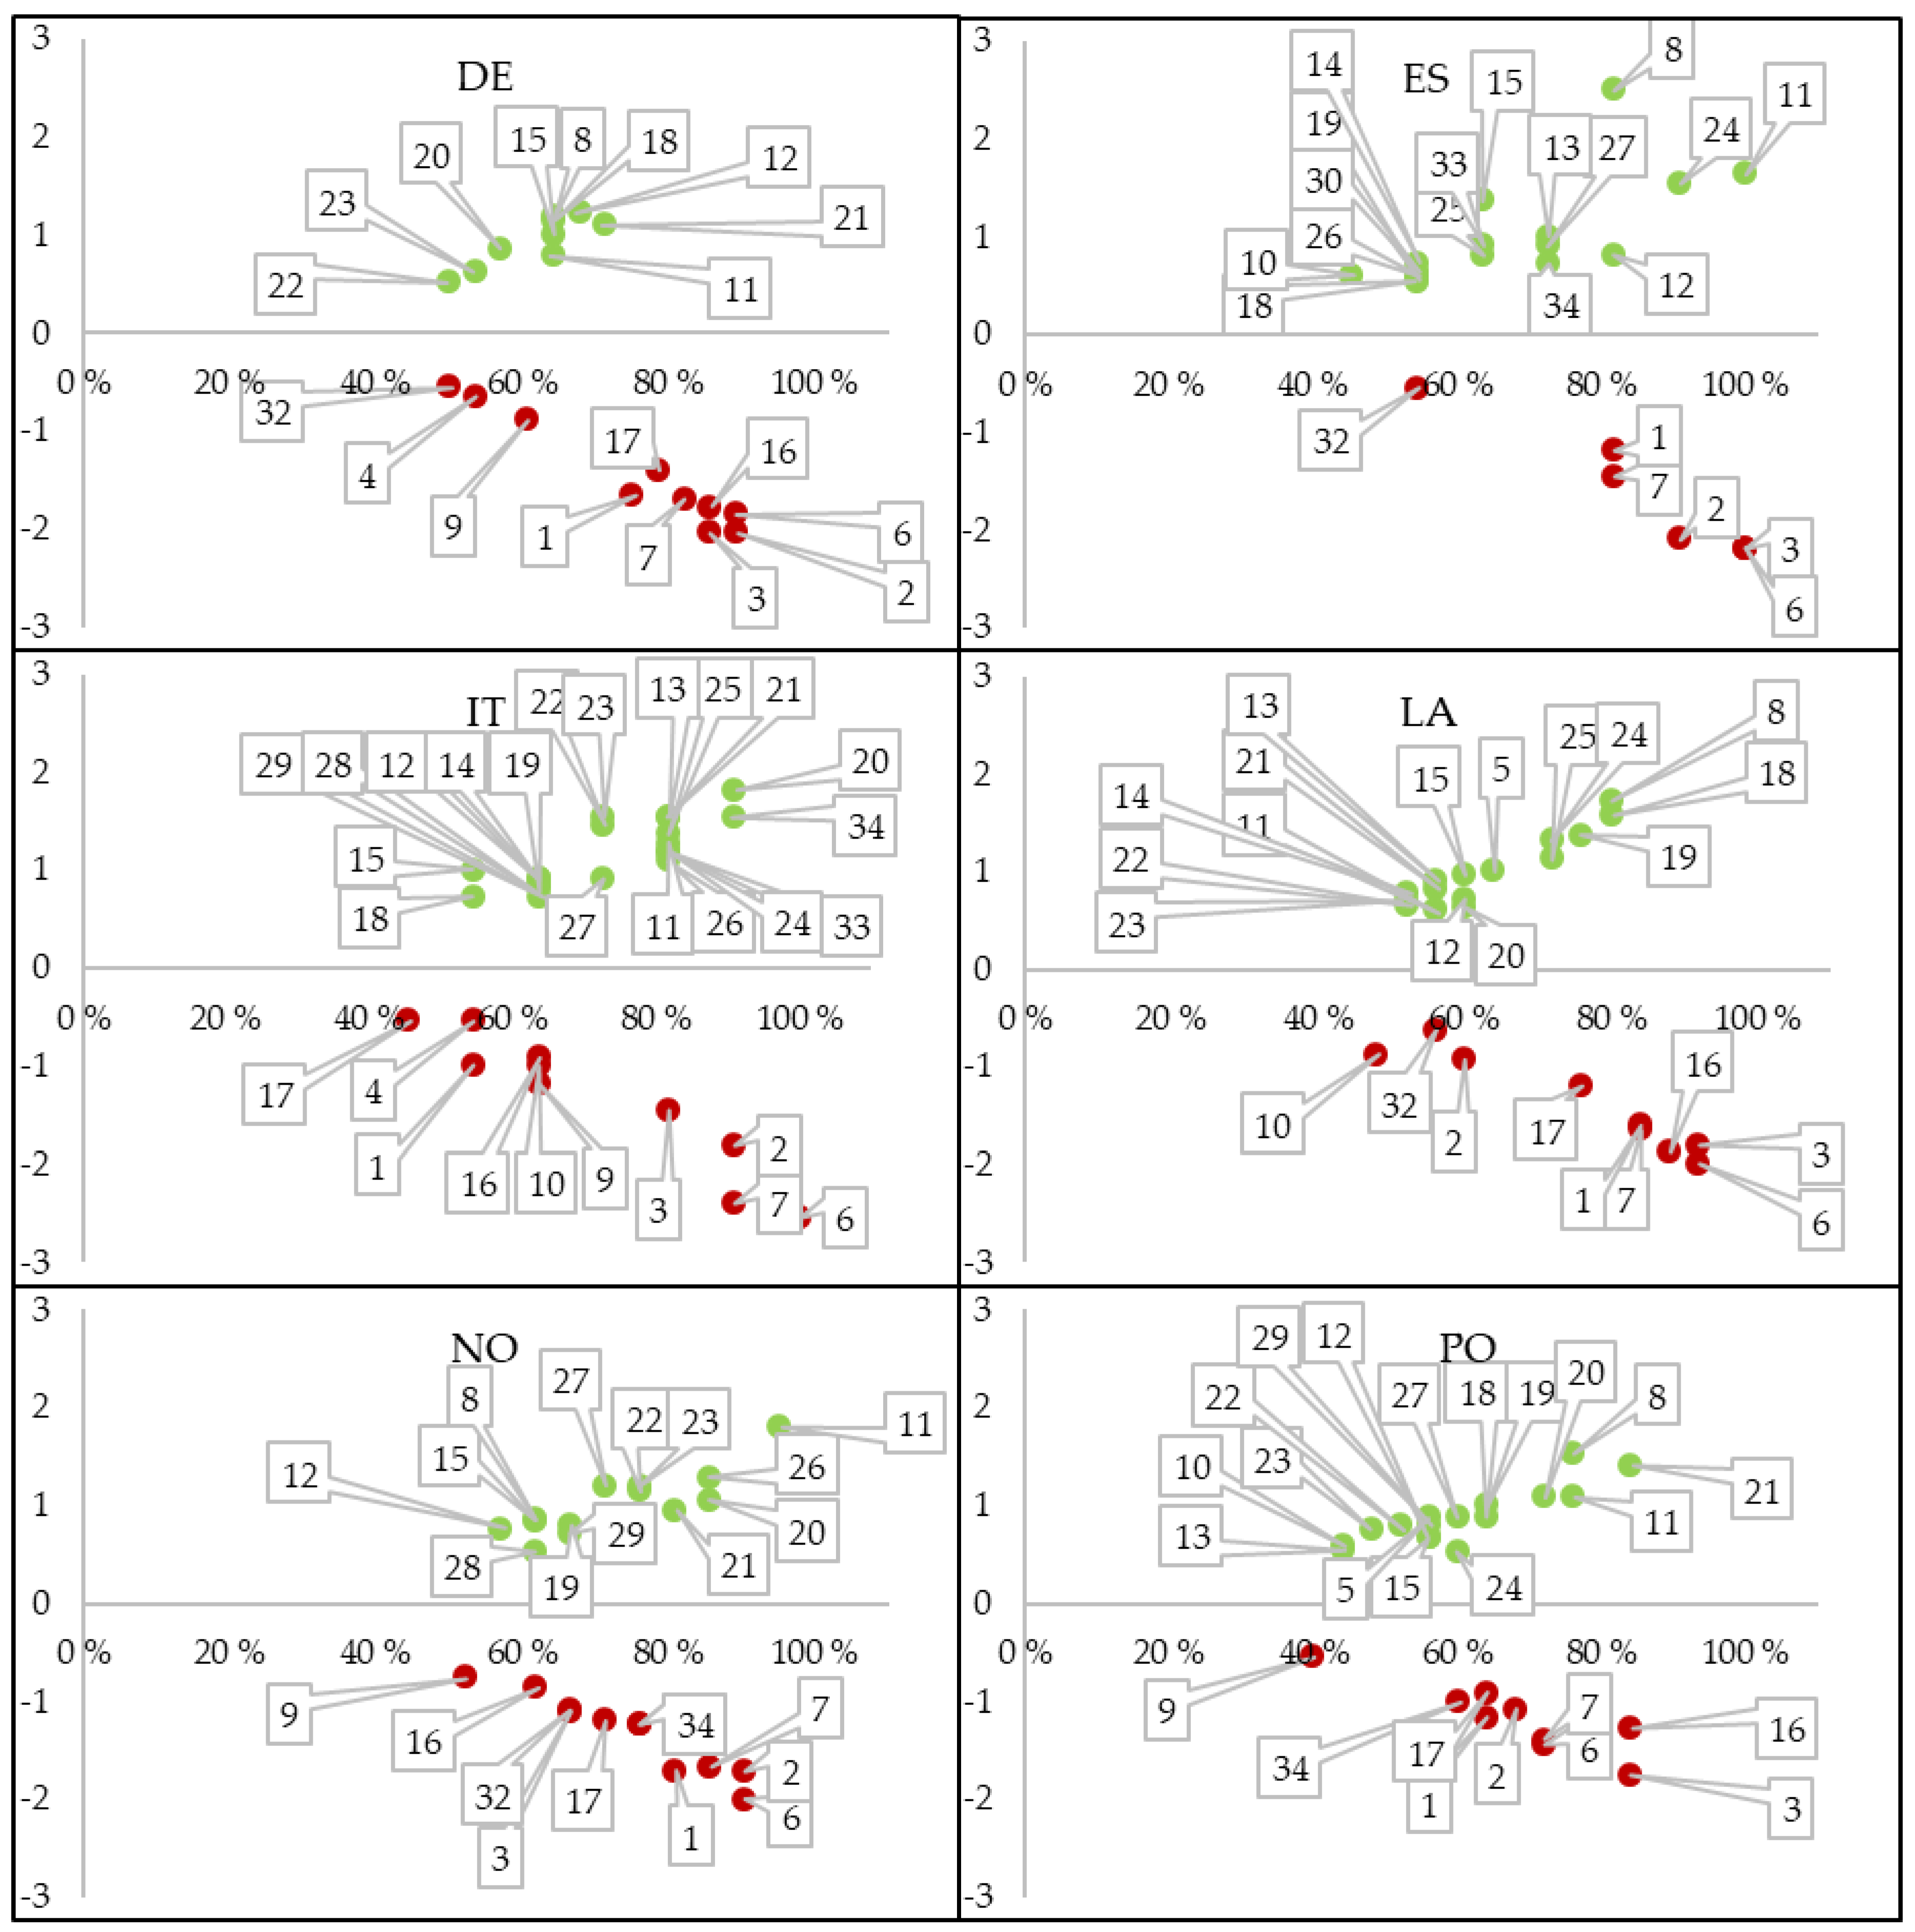
4.2.3. Regional Variations in Acceptance-Related Patterns

Despite similarities across regions, the regional variations in the number of barriers and drivers and in the average impact scores and frequency with which they are reported across regions also highlight the very context-specific nature of community acceptance. Figure 6 summarizes which acceptance factors (see Table 1 for a description of each acceptance factor) have, on average, been evaluated as a barrier or driver in each region.
In the two German regions, ten acceptance factors were, on average, evaluated as a barrier to acceptance. Of these, six have a rounded impact score of −2, while four have a score of −1. The six barriers with the highest average impact score were evaluated as a barrier by at least 75% of the 28 stakeholders. These six factors are related to the technical characteristics of wind energy projects (visibility, distance, and size), environmental impacts (physical environment, and biodiversity and wildlife), and societal impacts (health and well-being). Nine factors were, on average, evaluated as a driver, all with a rounded average impact score of +1. The drivers with the highest average impact scores were impacts on indivduals’ economy, impacts on GHG emissions, and share of renewables (all average +1.2), evaluated as a driver by between 64% and 68% of the respondents.
In the Spanish region, six factors were on average evaluated as barriers, while sixteen were evaluated as drivers. Three barriers have a rounded average impact score of −2, and all were evaluated as a barrier by at least 90% of the Spanish respondents. These are related to the technical characteristics of projects (visibility and distance) and environmental impacts (physical environment). The environmental factor impacts on GHG emissions has a rounded average impact score of +3 (evaluated as a driver by 82% of the respondents). Two drivers have a rounded average impact score of +2 and were evaluated as a driver by at least 90% of the respondents (the economic factor impacts on local profits and income, and the contextual factor national/regional/local targets), while the remaining drivers have a rounded average impact score of +1 (evaluated as a driver by between 45% and 82% of the respondents).
It the two Italian regions, ten factors were, on average, evaluated as a barrier. An environmental factor (physical environment) has the highest average impact score (−2.5), and the factor was evaluated as a barrier by all the Italian stakeholders. Of the remaining barriers, two factors have a rounded average impact score of −2, while seven factors have a score of −1. Nineteen factors were, on average, evaluated as a driver. Of these, five factors have a rounded average impact score of +2. The driver with the highest average impact score is a contextual factor (opportunities for informal/formal participation and consultation in the planning and permitting process), evaluated as a driver by 91% of the respondents.
In Latvia, nine factors have an average impact score indicating that the factor is a barrier. Five of these have a rounded impact score of −2. An environmental factor (physical environment) has the highest average impact score (−2.0), and the factor was evaluated as a barrier by 92% of the Latvian respondents. Fifteen factors have an average impact score indicating that the factor is a driver. Two have a rounded average impact factor of 2. An environmental factor (GHG emissions) has the highest average impact score (+1.7), and the factor was evaluated as a driver by 80% of the Latvian respondents.
In Mid-Norway, 11 factors were, on average, evaluated as a barrier. Four have a rounded average impact score of −2 (evaluated as a barrier by at least 80% of the respondents), while seven have a rounded average impact score of −1 (evaluated as a barrier by between 52% and 76% of respondents). An environmental factor (physical environment) has the highest average impact score (−2.0), and 90% of the stakeholders evaluated the factor as a barrier. Thirteen factors were, on average, evaluated as a driver. An economic factor (local profits and income) has the highest average impact score (+1.8, evaluated as a driver by 95% of the respondents), while the remaining drivers have a rounded average impact score of +1.
In the Polish region, nine factors were, on average, evaluated as a barrier. A factor related to the technical characteristics of wind energy projects (distance) has a rounded average impact score of −2 (evaluated as a barrier by 84% of the respondents), while the remaining barriers have a rounded average impact score of −1. Sixteen factors were, on average, evaluated as a driver of social acceptance, and all but one have a rounded average impact score of +1. An environmental factor (GHG emissions) has the highest average impact score (+1.5, evaluated as a driver by 76% of the Polish respondents).
The regional average evaluations are summarized in Table 4 below.

5. Discussion

The stakeholder survey results provide insights into the relative importance of different social acceptance factors in shaping community acceptance of wind energy development in the regions covered in this study.
Of the factors evaluated by the stakeholders, there is general agreement across regions that factors related to the technical characteristics of projects (distance and visibility) and factors related to the environmental impacts (impacts on the physical environment and impacts on biodiversity and wildlife) constitute a barrier to community acceptance. These factors all have an average rounded score across regions of −2, indicating that the factors will have a clear negative impact on acceptance. Three factors were evaluated as a driver by all regions. These factors are economic impacts (impacts on individuals’ economy, the degree of local ownership of the plants, and impacts on local profits and income generation). All three factors have an average rounded score across the regions of +1, indicating that the acceptance factor has a small but positive impact on acceptance. Figure 4 also highlights that there are also several acceptance factors that have been evaluated as either a barrier or driver of community acceptance by most, but not all, regions, indicating important similarities across the regions studied. Societal impacts (impacts on health and well-being, quality of life) are important barriers all regions except the Balearic Islands in Spain. Six contextual factors (share of renewables, energy demand, participation and consultation, information and transparency, trust in information and trust in processes) and the environmental factor impacts on GHG have a frequency score of 5.
While there is much agreement across regions in terms of which acceptance factor categories and specific acceptance factors are the most important barriers and drivers, there is more variation across regions in terms of the relative significance of each factor in shaping community acceptance.
The technical factor distance of wind turbines from residential areas (acceptance factor number 3 in Table 1) is among the most important barriers in most regions, but this acceptance factor is somewhat less important in the Italian regions and Mid-Norway (rounded average scores are −1, compared to −2 across all regions). Mid-Norway differs from the other regions in terms of being more sparsely populated.
The environmental factors impacts on the physical environment (factor number 6) and impacts on biodiversity and wildlife (factor number 7) are considered as being considerable barriers to wind energy development in all regions, with an average rounded score of −2, except in the Warmian-Masurian province in Poland, where both factors have a rounded impact score of -1. In the Balearic Islands, impacts on biodiversity and wildlife is somewhat less important than impacts on the physical environment (rounded average impact scores are −1 and −2, respectively). The same pattern is observed in the Italian regions, where impacts on the physical environment has an average rounded impact score of −3, which indicates a strong negative effect on local acceptance of wind energy development, while impacts on biodiversity and wildlife has a rounded average score of −2.
In all regions except the Italian regions, impacts on GHG emissions (factor number 8) are perceived as an acceptance driver, but this factor is rated as a more important driver in the Balearic Islands (rounded average score of +3) and in the Warmian-Masurian province and Latvia (rounded average score of +2) than in the other regions. In the Balearic Islands, there are currently positive attempts in regional politics and policies to diversify the energy mix. The recently approved Law of Climate Change and Energy Transition of the Balearic Islands is pushing the further use of wind energy in order to diversify the energy mix. This is a positive driver of social acceptance of wind energy on the islands. The fact that impacts on GHG emissions is rated as having neutral effect on acceptance in the Italian regions is more surprising, where the share of renewables in gross internal consumption in the two regions is low: approximately 9 percent in both regions [54]. In Italy, there is little focus on the impact of wind energy development on GHG emissions, as the debate revolves around the negative impacts on the environment, including landscape and nature conservation.
Impacts on the tourism sector (factor number 9) is the only economic factor which, on average, is considered to have a negative effect on social acceptance (rounded average score across regions is −1). However, in Latvia and the Spanish region the factor is considered to have an overall neutral effect on social acceptance. Although the Balearic Islands are heavily dependent on the tourism industry, the possible negative impacts of wind energy development on the tourism industry have not yet been raised in the public debates as an important or relevant issue, although the tourism industry has some concerns about visual impacts and noise pollution [55]. Interestingly, the main impression is that there is no clear difference between stakeholders’ perceptions in regions with very high shares of tourism industry and regions which are less dependent on tourists.
On average, impacts on local profits and income generation (factor number 11) are considered a small driver of social acceptance (average rounded score across regions is +1). In two regions, Mid-Norway and the Balearic Islands, this factor is perceived as having a clear positive effect, with an average rounded impact score of +2. In rural, depopulated areas, such as in many Norwegian municipalities, wind energy development could help address local concerns regarding the economy, modernization and employment opportunities [5,55,56]. In the Balearic Islands, this factor is considered as a driver because of the fact that seasonal job fluctuation in an island which depends on tourism always positively perceives the opportunity for new job creation in building farms, as well as a stable source of income which does not vary depending on seasons [55].
Regarding the contextual factors that revolve around financial policies, taxation (acceptance factor 26) is considered to have a neutral effect on social acceptance in Latvia, the Warmian-Masurian province and in the German regions, while it is a small driver in Mid-Norway, the Balearic Islands and the Italian regions. Taxation provides an opportunity for the hosting municipalities to achieve an income from the wind energy development. In Norway, taxation is a heated topic because, in particular, the interest group for wind energy municipalities is promoting higher taxation, as large hydropower installations are taxed more heavily than wind power and small hydropower installations, which contributes to making citizens more in favor of hydropower than wind power (i.e., they experience larger local benefits from hydropower than wind power). Municipalities that have wind power typically argue that taxation is important for their decision to support wind power [57].
While taxation gives something back to the hosting communities, financial support schemes (acceptance factor number 27) reduces the risk for investors. This is considered as being a small but important driver in Mid-Norway, which has an electricity certificate scheme that will be phased out in 2021. The Norwegian regulator expects the wind technology to be profitable without support around 2025. One consequence of the phase-out is that the Norwegian regulator currently receives a lot of applications from investors who want to develop projects before the support ends. The support scheme is also a small but important driver in the Warmian-Masurian province, the Balearic Islands and the Italian regions. These countries used to have electricity certificates (Poland) or feed-in tariffs (Spain), but have introduced auctions instead: Poland in 2015, Spain has an auctioning system, and Italy also has a reverse auction process as one way of granting support. Support schemes are not considered as being an important driver in Latvia, where the feed-in tariff has been abolished. The fact that stakeholders in Germany do not view the support scheme as an important driver may be related to the fact that their shift from feed-in tariffs (which encouraged the wind energy boom) to an auctioning system has been politically controversial [58]. Furthermore, the Renewable Energy Sources Act, forming a legal basis for the auctions, does not provide any financial benefits for host communities or citizens, at least not to date. Community wind farms enjoy certain privileges in the auctions, but in the two target regions, community wind farms are more an exception as the market is dominated by commercial developers.
Contextual factors related to the planning and permitting process (factors 20−23) are, on average, considered to have a positive effect on acceptance of wind energy development in all regions, with the exception of the Balearic Islands, where stakeholders, on average, rate all four factors in this category as having a neutral effect on acceptance. Overall the Italian stakeholders have given a higher average score to factors related to the planning and permitting process (average rounded scores of +2 for factors 20, 21 and 23) than any of the other regions. This is somewhat surprising, given the series of investigations and arrests for corruption in the Italian wind energy sector [59]. In Italy, the public is not involved in the general permitting/concession procedure, unless the regions establish public consultation procedures [56].
In all regions expect in the Balearic Islands in Spain, the societal impacts on health and well-being (factor number 16) and on quality of life (factor number 17) are considered as barriers to social acceptance, with rounded average scores across regions of −1 for both factors. The impact on health and well-being is considered as having a larger negative effect in Latvia and the German regions than in the other regions. In Thuringia and Saxony, concerns that wind energy development could adversely affect human health and well-being are regularly raised [55]. The opposition parties in the Thuringian Parliament have asked the state government to revise its wind energy development plans in accordance with the WHO Guidelines (currently, the recommended maximum wind turbine noise exposure during daytime exceeds WHO recommendations), with one opposition populist party (Alternative für Deutschland) having called for a moratorium to temporarily stop any wind energy development.
Sense of place, self-identity and place attachment (acceptance factor 32) is perceived as a barrier to a larger extent in Mid-Norway than in any of the other regions. People in rural Norway, including the Sami people, and people who have grown up in rural Norway, typically have a special sense of self-identity and place attachment, which wind power affects in a negative way. In Latvia, where this factor is also considered an important factor: there are, in general, considerable local patriotic feelings and a view that the ‘land values’ should not be destroyed by wind industry. One survey from Latvia indicates that a significant percentage of respondents (around 40%) consider that the development of wind parks will have or might have negative impact on cultural-historical values [55]. In the Balearic Islands, such identity is, in particular, related to the archaeological sites in all of Menorca, (the Navettas), which is of high importance for tourism and archaeology [55].
The discourse in the public sphere/media (acceptance factor 33) and the political climate for wind energy development (acceptance factor 34) are, on average, considered to have a neutral impact on acceptance, but there are variations across regions. In Mid-Norway, both factors are evaluated as having a small, negative effect, while in the Balearic Islands and the Italian regions, these factors are considered to be drivers. A majority of the Norwegian population is in favor of wind power, in general [60], but the negative views increase when questions relate wind energy with negative biodiversity and wildlife effects [61]. Since autumn 2018, mobilization against wind power has increased drastically, with high media attention and much criticism of wind energy. In the Warmian-Masurian province, the public discourse is more positive than the political climate for wind power (average rounded scores of 0 and -1, respectively). The government has introduced restrictions, while, for example, people at the local level are embracing wind power [52]. In 2013, the Polish Wind Energy Association hired an independent company to carry out a questionnaire in the Warmian-Masurian province [55]. The findings suggest that 78% of the inhabitants are of the opinion that investments in wind energy can bring positive benefits for their region. Research shows that residents of municipalities with wind farms see significantly more benefits related to wind farms compared to the general population. The majority of respondents (75%) agreed that wind power plants should be established within their own commune.

6. Concluding Remarks and Recommendations for Policy

The 34 acceptance factors covered in this study have been selected based on a thorough literature review of social acceptance of wind energy internationally. When it comes to how critical each factor is in specific regions, there is a need for further analyses, as we have done in our six cases. Our findings clearly show that social acceptance for or resistance to wind power always depends on the context. Hence, we cannot generalize to the broader population of all communities with wind power developments. Any research design, whether quantitative or qualitative, should be aware of this.
In terms of the criticality of social acceptance barriers and drivers, our findings indicate important similarities across regions. In general, several factors related to the technical characteristics of projects and the environmental impacts of projects are considered critical barriers, in the sense that the factors, on average, have high impact scores and high frequency scores. Several of the identified drivers also have high frequency scores (i.e., they are reported by many regions as being a driver), but typically have lower impact scores than the barriers. The economic impacts of projects are examples of such drivers. Thus, a general conclusion would be to focus efforts on strengthening existing drivers and reducing existing barriers. Despite similarities across regions, the regional variations in the number of barriers and drivers, and in the average impact scores across barriers and drivers and the frequency with which they are reported across regions, also highlight the very context-specific nature of social acceptance barriers and drivers. Each project is unique, facing unique challenges and opportunities, rooted in the local context. Thus, a second general conclusion would be that efforts to strengthen existing drivers and reduce barriers must take into consideration the location-specific factors that ultimately shape community acceptance of specific wind energy projects. The findings suggest that, on the one hand, comparisons between countries are rather difficult due to the high complexity of the issues analyzed. On the other hand, almost all the countries have key issues in common, which means that learning may occur, and good or bad practices can be shared or re-used to improve domestic regulatory frameworks.
In spite of marked political and socio-cultural differences between the regions, there are some common patterns across countries. For most national and regional governments, wind energy is crucial to achieving the aimed renewable energy and climate policy goals, but its development may create negative impacts. How these impacts are perceived and how they influence social acceptance of wind energy depends on individual characteristics, the context, how people are involved and integrated in the siting and permitting process and how costs and benefits are distributed. A number of empirical studies and the results of our survey reveal that local conflicts over wind energy can be partly mitigated through an integrative approach that takes the different needs and expectations of the affected population and stakeholders into account and considers regional or local processes and cultures.
Our research and other studies reveal that reducing the visual impact of wind turbines, their impact on landscape, nature and wildlife, particularly avifauna, and ensuring effective procedural and financial participation of local communities can help to enhance local acceptance. Although in our study setback distances were identified as a key acceptance factor, there is no clear evidence in the literature regarding the influence of setback distances on local acceptance (ex post).
In particular, the ownership of wind energy plants can also represent a strong influencing factor [62]. Community wind farms owned by local community stakeholders (e.g., farmers, landowners, individuals, municipality) often enjoy higher levels of trust than commercial developers, which are usually not embedded locally. Community ownership models help to strengthen local identification with the wind farms, to generate local/regional added value (in terms of income/profits, tax revenues, jobs). Particularly, energy co-operatives contribute to a more democratic energy system and social economic development by creating employment and benefits at local level. Nevertheless, success also depends on an enabling regulatory framework that governs their operations, and particularly their access to the energy system. Hence, the revised Renewable Energy Directive (2001/2018/EU) can be regarded as a promising step as, for the first time, it requires Member states to develop enabling frameworks for renewable energy communities. Furthermore, Member States will have to ensure that they take the specificities of renewable energy communities into account when designing support schemes. The transition to auctions and competitive bidding invoked by the European Union poses a great challenge to community-led renewable energy projects, and even more in countries without any experience in community ownership of renewable energy. Therefore, it is essential to provide targeted and effective support for community-led projects (e.g., via provision of risk capital, loan guarantees, low interest loans, investment grants, other incentives).
Still, in many cases, it is commercial developers and energy utility companies that keep dominating wind energy markets. Taking into account the ongoing transition to auctioning systems and competitive bidding, and the need to ensure a certain level playing field, governments should find ways for encouraging or obliging developers and. operators of wind farms to offer active (e.g., equity) and passive (e.g., via tax revenues, special wind energy levies, compensations, non-profit community foundations) financial participation possibilities for local communities. A further option is electricity price discounts for local communities hosting wind farms. Recent public surveys conducted in Germany [63] indicate that reduced electricity prices are frequently seen by the public as an important measure to achieve greater local acceptance. Co-operation with local/regional energy utility should be pursued, e.g., by involving them as shareholders, in order to offer host municipalities and citizens electricity price discounts. Generally, governments should try to get an understanding of local communities’ preferences for different options of financial and procedural participation.
Another key lesson from our research is that the opportunities of wind farms to increase regional value creation (e.g., via local income/profits, tax revenues and jobs) should be effectively utilized and communicated. The involvement of local businesses, workforce and technology in wind farm planning, construction, operation/maintenance and decommissioning should be encouraged. Where possible, local/regional banks and financing institutions should be involved in the development of wind farms.
A final policy lesson is that any acceptance strategy should include measures targeting the provision of comprehensible, transparent, non-biased information, preferably from trusted intermediaries assisting local communities, where wind energy projects are planned. Particularly in rural regions, municipalities are often overburdened with the complex planning and permitting processes, lacking proper information about key technical, economic, financial legal, or procedural issues. The role of intermediaries like regional energy agencies and similar advisory bodies becomes, therefore, increasingly important for raising acceptance of wind energy.

Author Contributions

Conceptualization, K.L., M.D.L., S.A.; methodology, S.A., M.D.L., T.E.J., M.-R.D.N., M.K.; investigation, M.D.L., S.A., T.E.J.; writing—original draft preparation, M.D.L.; writing—review and editing, all authors; visualization, S.A.A. and T.E.J.; supervision, M.D.L. All authors have read and agreed to the published version of the manuscript.

Funding

This contribution is part of the WinWind project, which has received funding from the European Union’s Horizon 2020 Research and Innovation programme under Grant Agreement N° 764717.

Acknowledgments

We thank three anonymous reviewers for providing helpful feedback. We are grateful to our colleagues Elena De Luca, Nicoletta del Bufalo, Tania Giuffrida, Ivars Kudrenickis, Pouyan Maleki-Dizaji, Piotr Nowakowski, Maria Cristina Tommasino, Ryszard Wnuk, Gabi Zink Ehlert, Swantje Vondran, Aija Zucika and Rune Flatby for their contributions to earlier reports that we draw on in this paper (Deliverable 2.1: Technical and socio-economic conditions and Deliverable 2.3: Taxonomy of social acceptance drivers and barriers) as well as for translating and distributing the survey to relevant stakeholders in their regions. We would also like to thank the stakeholders, who have taken their time to respond to our survey. We also appreciate the feedback from the participants, and in particular the discussant Eva Eichenauer, of the panel ‘P194: Local environmental concerns vs. climate: Increasing societal polarization in energy policy’ at the General ECPR Conference 2019, 6 September 2019, Wroclaw, Poland.

Conflicts of Interest

The authors declare no conflict of interest.

References

  1. Iuga, D.; Dragan, M.; Claessens, B.; Dütschke, E.; Schneider, U.; Wesche, J.; Ramsay, J. Final Result-Oriented Report WISE Power, Foster Social Acceptance for Wind Power, October 2016 (Deliverable 1.1). Available online: http://wisepower-project.eu/wp-content/uploads/FINAL_WISE-Power-Result_oriented-report_Deliverable-D1.1-1.pdf (accessed on 5 December 2019).
  2. Langer, K.; Decker, T.; Roosen, J.; Menrad, L. A qualitative analysis to understand the acceptance of wind energy in Bavaria. Renew. Sust. Energy Rev. 2016, 64, 248–259. [Google Scholar] [CrossRef]
  3. Jobert, A.; Laborgne, P.; Mimler, S. Local acceptance of wind energy: Factors of success identified in French and German case studies. Energy Policy 2007, 35, 2751–2760. [Google Scholar] [CrossRef]
  4. Wang, S.; Wang, S. Impacts of wind energy on environment: A review. Renew. Sust. Energy Rev. 2015, 49, 437–443. [Google Scholar] [CrossRef]
  5. Rygg, B.J. Wind power—An assault on local landscapes or an opportunity for modernization? Energy Policy 2012, 48, 167–175. [Google Scholar] [CrossRef] [Green Version]
  6. Slattery, M.C.; Johnson, B.L.; Swofford, J.A.; Pasqualetti, M.J. The predominance of economic development in the support for large-scale wind farms in the U.S. Great Plains. Renew. Sust. Energy Rev. 2012, 16, 3690–3701. [Google Scholar] [CrossRef]
  7. Devine-Wright, P.; Howes, Y. Disruption to place attachment and the protection of restorative environments: A wind energy case study. J. Environ. Psychol. 2010, 30, 271–280. [Google Scholar] [CrossRef]
  8. Pasqualetti, M.J. Opposing Wind Energy Landscapes: A Search for Common Cause. Ann. Assoc. Am. Geogr. 2011, 101, 907–917. [Google Scholar] [CrossRef]
  9. Szarka, J. Wind Power in Europe: Politics, Business and Society; Palgrave Macmillan: Basingstoke, UK, 2007. [Google Scholar]
  10. Knopper, L.D.; Ollson, C.A. Health effects and wind turbines: A review of the literature. Environ. Health 2011, 10, 78. [Google Scholar] [CrossRef] [Green Version]
  11. Knopper, L.D.; Ollson, C.A.; McCallum, L.C.; Whitfield Aslund, M.L.; Berger, R.G.; Souweine, K.; McDaniel, M. Wind turbines and human health. Front. Public Health 2014, 2, 63. [Google Scholar] [CrossRef] [Green Version]
  12. Baxter, J.; Morzaria, R.; Hirsch, R. A case-control study of support/opposition to wind turbines: The roles of health risk perception, economic benefits, and community conflict. Energy Policy 2013, 61, 931–943. [Google Scholar] [CrossRef]
  13. Magari, S.R.; Smith, C.E.; Schiff, M.; Rohr, A.C. Evaluation of community response to wind turbine-related noise in Western New York State. Noise Health 2014, 16, 228. [Google Scholar] [CrossRef] [PubMed]
  14. Brennan, N.; Rensburg, T.M.V.; Morris, C. Public acceptance of large-scale wind energy generation for export from Ireland to the UK: Evidence from Ireland. J. Environ. Plann. Man. 2017, 60, 1967–1992. [Google Scholar] [CrossRef]
  15. Liebe, U.; Bartczak, A.; Meyerhoff, J. A turbine is not only a turbine: The role of social context and fairness characteristics for the local acceptance of wind power. Energy Policy 2017, 107, 300–308. [Google Scholar] [CrossRef] [Green Version]
  16. Zoellner, J.; Schweizer-Ries, P.; Wemheuer, C. Public acceptance of renewable energies: Results from case studies in Germany. Energy Policy 2008, 36, 4136–4141. [Google Scholar] [CrossRef]
  17. Wolsink, M. Planning of renewables schemes: Deliberative and fair decision-making on landscape issues instead of reproachful accusations of non-cooperation. Energy Policy 2007, 35, 2692–2704. [Google Scholar] [CrossRef]
  18. Barry, J.; Ellis, G.; Robinson, C. Cool rationalities and hot air: A rhetorical approach to understanding debates on renewable energy. Glob. Environ. Politics 2008, 8, 67–98. [Google Scholar] [CrossRef]
  19. Devine-Wright, P. Reconsidering Public Attitudes and Public Acceptance of Renewable Energy Technologies: A Critical Review; School of Environment and Development, University of Manchester: Manchester, UK, 2007. [Google Scholar]
  20. Ribeiro, F.; Ferreira, P.; Araújo, M.; Braga, A.C. Public Opinion on Renewable Energy Technologies: The Portuguese Case; University of Minho: Guimaraes, Portugal, 2014. [Google Scholar]
  21. Ferguson-Martin, C.J.; Hill, S.D. Accounting for variation in wind deployment between Canadian provinces. Energy Policy 2011, 39, 1647–1658. [Google Scholar] [CrossRef]
  22. Upham, P.; Oltra, C.; Boso, À. Towards a cross-paradigmatic framework of the social acceptance of energy systems. Energy Res. Soc. Sci. 2015, 8, 100–112. [Google Scholar] [CrossRef]
  23. Aasen, M.; Vatn, A. Public attitudes toward climate policies: The effect of institutional contexts and political values. Ecol. Econ. 2018, 146, 106–114. [Google Scholar] [CrossRef]
  24. Fournis, Y.; Fortin, M.-J. From social ‘acceptance’ to social ‘acceptability’ of wind energy projects: Towards a territorial perspective. J. Environ. Plann. Man. 2016, 60, 1–21. [Google Scholar] [CrossRef]
  25. Linnerud, K.; Aakre, S.; Leiren, M.D. Deliverable 2.2: Conceptual framework for analysing social acceptance barriers and drivers. 2018. Available online: https://winwind-project.eu/fileadmin/user_upload/Resources/Deliverables/WinWind_Deliverable_2.2_Conceptual_framework_final.pdf (accessed on 5 December 2019).
  26. Wüstenhagen, R.; Wolsink, M.; Bürer, M.J. Social acceptance of renewable energy innovation: An introduction to the concept. Energy Policy 2007, 24, 2683–2691. [Google Scholar] [CrossRef] [Green Version]
  27. Duong, M.Q.; Grimaccia, F.; Leva, S.; Mussetta, M.; Sava, G.; Costinas, S. Performance analysis of grid-connected wind turbines. U.P.B. Sci. Bull., Ser. C 2014, 76, 169–180. [Google Scholar]
  28. Anshelm, J.; Simon, H. Power production and environmental opinions—Environmentally motivated resistance to wind power in Sweden. Renew. Sust. Energy Rev. 2016, 57, 1545–1555. [Google Scholar] [CrossRef] [Green Version]
  29. Ertör-Akyazı, P.; Adaman, F.; Özkaynak, B.; Zenginobuz, Ü. Citizens’ preferences on nuclear and renewable energy sources: Evidence from Turkey. Energy Policy 2012, 47, 309–320. [Google Scholar] [CrossRef]
  30. Petrova, M.A. NIMBYism revisited: Public acceptance of wind energy in the United States. Wires Clim. Chang. 2013, 4, 575–601. [Google Scholar] [CrossRef]
  31. Rand, J.; Hoen, B. Thirty years of North American wind energy acceptance research: What have we learned? Energy Res. Soc. Sci. 2017, 29, 135–148. [Google Scholar] [CrossRef] [Green Version]
  32. Krug, M.; Ohlhorst, D. Optimizing the Local Embedding of Renewable Energy Plants: The Role of Nature Conservation in Relation to other Acceptance Factors. J. Environ. Policy Admin. 2020, 27, 77–102. [Google Scholar]
  33. Larsen, S.V.; Hansen, A.M.; Lyhne, I.; Aaen, S.B.; Ritter, E.; Nielsen, H. Social impact assessment in Europe: A study of social impacts in three Danish cases. J. Environ. Assess. Policy Manag. 2015, 17, 1550038. [Google Scholar] [CrossRef] [Green Version]
  34. McCunney, R.J.; Mundt, K.A.; Colby, W.D.; Dobie, R.; Kaliski, K.; Blais, M. Wind Turbines and Health. A Critical Review of the Scientific Literature. J. Occup. Environ. Med. 2014, 56, 108–130. [Google Scholar] [CrossRef]
  35. Klæboe, R.; Sundfør, H. Windmill noise annoyance, visual aesthetics, and attitudes towards renewable energy sources. Int. J. Environ. Res. Public Health 2016, 13, 746. [Google Scholar] [CrossRef] [Green Version]
  36. Frantál, B.; Kunc, J. Wind turbines in tourism landscapes: Czech Experience. Ann. Tour. Res. 2011, 38, 499–519. [Google Scholar] [CrossRef]
  37. Breukers, S.; Wolsink, M. Wind power implementation in changing institutional landscapes: An international comparison. Energy Policy 2007, 35, 2737–2750. [Google Scholar] [CrossRef]
  38. Enevoldsen, P.; Sovacool, B. Examining the social acceptance of wind energy: Practical guidelines for onshore wind project development in France. Renew. Sust. Energy Rev. 2016, 53, 178–184. [Google Scholar] [CrossRef]
  39. Boon, F.P.; Dieperink, C. Local civil society based renewable energy organisations in the Netherlands: Exploring the factors that stimulate their emergence and development. Energy Policy 2014, 69, 297–307. [Google Scholar] [CrossRef]
  40. Maruyama, Y.; Nishikido, M.; Iida, T. The rise of community wind power in Japan: Enhanced acceptance through social innovation. Energy Policy 2007, 35, 2761–2769. [Google Scholar] [CrossRef]
  41. Walker, B.J.A.; Wiersma, B.; Bailey, E. Community benefits, framing and the social acceptance of offshore wind farms: An experimental study in England. Energy Res. Soc. Sci. 2014, 3, 46–54. [Google Scholar] [CrossRef]
  42. Warren, C.R.; McFadyen, M. Does community ownership affect public attitudes to wind energy? A case study from south-west Scotland. Land Use Policy 2010, 27, 204–213. [Google Scholar] [CrossRef]
  43. Linnerud, K.; Toney, P.; Simonsen, M.; Holden, E. Does change in ownership affect community attitudes toward renewable energy projects? Evidence of a status quo bias. Energy Policy 2019, 131, 1–8. [Google Scholar] [CrossRef]
  44. Ek, K.; Persson, L. Wind farms—Where and how to place them? A choice experiment approach to measure consumer preferences for characteristics of wind farm establishments in Sweden. Ecol. Econ. 2014, 105, 193–203. [Google Scholar] [CrossRef]
  45. Enevoldsen, P.; Permien, F.-H.; es Bakhtaoui, I.; von Krauland, A.-K.; Jacobson, M.Z.; Xydis, G.; Sovacool, B.K.; Valentine, S.V.; Luecht, D.; Oxley, G. How much wind power potential does europe have? Examining European wind power potential with an enhanced socio-technical atlas. Energy Policy 2019, 132, 1092–1100. [Google Scholar] [CrossRef]
  46. WindEurope. Wind Energy in Europe in 2018. Trends and Statistics. Published in February 2019. Available online: https://windeurope.org/wp-content/uploads/files/about-wind/statistics/WindEurope-Annual-Statistics-2018.pdf (accessed on 21 January 2020).
  47. Deutsche Windguard. Status des Windenergieausbaus an Land in Deutschland, 1. Halbjahr 2018. Available online: https://www.windguard.de/veroeffentlichungen.html?file=files/cto_layout/img/unternehmen/veroeffentlichungen/2018/Status%20des%20Windenergieausbaus%20an%20Land%20in%20Deutschland%2C%201.%20Halbjahr%202018.pdf (accessed on 15 November 2019).
  48. NVE. Vindkraft. Nøkkeltall for Norsk Vindkraftproduksjon i 2018. Available online: https://www.nve.no/energiforsyning/kraftproduksjon/vindkraft/ (accessed on 29 January 2020).
  49. Terna. Renewable Sources. Available online: https://www.terna.it/en/electric-system/dispatching/renewable-sources (accessed on 21 January 2020).
  50. Polish Wind Energy Association. The State of Wind Energy in Poland in 2016. Published 2017. Available online: http://psew.pl/en/wp-content/uploads/sites/2/2017/06/Stan-energetyki-wiatrowej-w-Polsce-w-2016-r.pdf. (accessed on 22 November 2019).
  51. Renewable Energy Statistics. Available online: https://ec.europa.eu/eurostat/statistics-explained/index.php/Renewable_energy_statistics (accessed on 4 December 2019).
  52. Szulecki, K. Poland: Incumbent stability amid legislative volatility. In Comparing Renewables Policy: The role of Political, Organizational and European Fields; Boasson, E.L., Leiren, M.D., Wettestad, J., Eds.; Routledge: Abingdon, UK, Forthcoming.
  53. Mosannenzadeh, F.; Di Nucci, M.R.; Vettorato, D. Identifying and prioritizing barriers to implementation of smart energy city projects in Europe: An empirical approach. Energy Policy 2017, 105, 191–201. [Google Scholar] [CrossRef]
  54. ENEA. Energy Efficiency. Annual Report. Analysis and Results of Energy Efficiency Policies in Italy. Available online: https://www.enea.it/it/seguici/pubblicazioni/pdf-volumi/2018/raee-2018-executivesummary-en.pdf (accessed on 15 January 2020).
  55. Aakre, S.; Leiren, M.D.; Linnerud, K. Deliverable 2.3: Taxonomy of Social Acceptance Drivers and Barriers. 2019. Available online: https://winwind-project.eu/fileadmin/user_upload/Resources/Deliverables/D2.3_Taxonomy__of_acceptance_barriers_and_drivers__updated.pdf (accessed on 29 January 2020).
  56. Linnerud, K.; Aakre, S.; Leiren, M.D. Deliverable 2.1: Technical and Socio-Economic Conditions a Literature Review of Social Acceptance of Wind Energy Development, and an Overview of the Technical, Socioeconomic and Regulatory Starting Conditions in the Wind Energy Scarce Target Regions. 2018. Available online: https://winwind-project.eu/fileadmin/user_upload/Resources/Deliverables/Del2.1_final.pdf (accessed on 29 January 2020).
  57. Maleki-Dizaj, P.; del Bufalo, N. Deliverable 4.3. Synthesis and Comparative Analysis of Best Practice Case Studies for Promoting the Social Acceptance of Wind Energy. Available online: https://winwind-project.eu/fileadmin/user_upload/Resources/Deliverables/Del_4.3.pdf (accessed on 29 January 2020).
  58. Leiren, M.D.; Reimer, I. Historical institutionalist perspective on the shift from feed-in tariffs towards auctioning in German renewable energy policy. Energy Res. Soc. Sci. 2018, 43, 33–40. [Google Scholar] [CrossRef]
  59. Oles, T.; Hammarlund, K. The European Landscape Convention, Wind Power, and the Limits of the Local: Notes from Italy and Sweden. Landsc. Res. 2011, 36, 471–485. [Google Scholar] [CrossRef]
  60. Vatn, A.; og Aasen, M. CICEROs klimaundersøkelse, et dypdykk i folket, vol. 2. Available online: https://cicero.oslo.no/no/klimaundersokelsen-2019 (accessed on 27 January 2020).
  61. DNT (Den Norske Turistforeningen). Folket Setter Naturen Fremfor Vindkraft. Available online: https://www.dnt.no/artikler/nyheter/17191-folket-setter-naturen-fremfor-vindkraft/ (accessed on 27 January 2020).
  62. Di Nucci, M.R.; Krug, M. Conditions Enhancing the Socially Inclusive and Environmentally Sound Uptake of Wind Energy: The Case of Germany. J. Environ. Policy Admin. 2018, 26, 1–41. [Google Scholar] [CrossRef]
  63. FA Wind. Umfrage zur Akzeptanz der Windenergie an Land—Herbst 2019, Berlin. Available online: https://www.fachagentur-windenergie.de/fileadmin/files/Veroeffentlichungen/FA_Wind_Umfrageergebnisse_2019.pdf (accessed on 27 January 2020).
Figure 1. Analytical framework for analyzing social acceptance. Figure adapted from [25]. The areas shaded in dark gray represent the main focus areas in studying the community acceptance of specific wind energy projects. To emphasize the dynamics of social acceptance at different scales, the remaining two dimensions of social acceptance and how they interact with community acceptance are shown in light gray.
Sustainability 12 01754 g001
Figure 2. Compilation of stakeholders in the panel (N = 121).
Sustainability 12 01754 g002
Figure 3. Impact areas and region (average scores). * DE: Saxony and Thuringia, Germany; ES: Balearic Islands, Spain; IT: Abruzzo and Latium, Italy; LA: Latvia; NO: Mid-Norway; PO: Warmian-Masurian province, Poland.
Sustainability 12 01754 g003
Figure 4. The criticality of social acceptance barriers and drivers across regions. The figure shows average impact scores across regions (on the y axis) and the frequency with which acceptance factors have been reported by the regions (on the x axis). Red color indicates that the acceptance factor is, on average across the regions, considered a barrier to social acceptance. Green color indicates that the acceptance factor is, on average across the regions, considered a driver of social acceptance.
Sustainability 12 01754 g004
Figure 5. Average impact scores across regions. The figure shows average impact scores across regions for all 34 acceptance factors. Red color indicates that the factor is, on average, evaluated as a barrier to acceptance, yellow color indicates that the factor is, on average, evaluated as having a neutral effect on acceptance, while the green color indicates that the factor is, on average, evaluated as a driver of acceptance in the regions.
Sustainability 12 01754 g005
Figure 6. The criticality of acceptance factors in the regions. The figure shows average impact scores (on the y axis) and the share of stakeholders in each region that have evaluated the acceptance factor as being either a barrier or driver (on the x axis). Acceptance factors and their corresponding numbers are described in Table 1. * DE: Saxony and Thuringia, Germany; ES: Balearic Islands, Spain; IT: Abruzzo and Latium, Italy; LA: Latvia; NO: Mid-Norway; PO: Warmian-Masurian province, Poland.
Sustainability 12 01754 g006
Table 1. Acceptance factors covered in the stakeholder survey.
Acceptance Factor CategoryAcceptance FactorsNo.
Technical characteristics of projectThe size of modern projects (e.g., number of turbines and turbine height)1
The visibility of wind turbines2
The distance of wind turbines from residential areas3
Grid infrastructure improvement4
Other infrastructure improvement (e.g., transport and communications)5
Impacts on EnvironmentPhysical environment (e.g., landscape, protected areas, increased traffic)6
Biodiversity and wildlife 7
GHG emissions8
Impacts on EconomyTourism sector9
Agricultural sector 10
Local profits and income (e.g., jobs, tax, local added value generation)11
Individuals’ economy (e.g., electricity prices, landowners’ income, property value)12
Distribution of benefits and costs between actors within the community13
Distribution of benefits and costs between communities hosting wind power and other communities14
The degree of local ownership of the plants15
Impacts on SocietyHealth and well-being (e.g., electromagnetic frequencies, shadow flicker, noise)16
Quality of life (e.g., recreational opportunities)17
Context
MarketRegional (or national) share of renewables in the electricity sector 18
Energy demand (e.g., exporter/importer of electricity, security of supply)19
Planning & permitting processOpportunities for informal/formal participation and consultation in the planning and permitting process20
Information about projects and the transparency of the permitting process21
Trust in processes22
Trust in information23
Governance & regulatory frameworkNational/regional/local targets24
National/regional/local plans25
National/regional/local policies: taxation26
National/regional/local policies: financial support schemes27
Trust in key actorsTrust in national decision-makers28
Trust in regional/local decision-makers29
Trust in investors30
Individual characteristicsSocio-cultural values (e.g., equal rights, entrepreneurialism)31
Sense of place, self-identity, place attachment32
Discourse on wind energy in the public sphere/media 33
Political climate for wind energy development34
Table 2. A scale to assess the level of impact of social acceptance factors in the regions. Stakeholders were asked to assess whether and to which extent specific acceptance factors prevent or enable projects from being developed in their region. Negative values indicate that the acceptance factor is a barrier to community acceptance, positive values indicate that the factor is a driver of community acceptance. 0 indicates that the acceptance factor has a neutral impact on community acceptance of wind energy development.
Barrier−3This factor, by itself, is sufficient to prevent projects from being realized.
−2This factor has a clear negative impact on social acceptance, but it will not be enough, by itself, to hinder the project from being realized. Yet, the barrier is so important it will have a significant impact on the overall assessment of the social acceptance of the project.
−1This factor has a small but negative impact on social acceptance or the negative impacts are slightly greater than the positive impacts, and there are no considerable conflicts related to the acceptance factor.
Neutral0This factor has an overall neutral impact on acceptance.
Driver1This factor has a small but positive impact on social acceptance or positive impacts are slightly greater than the negative impacts, and there are no considerable conflicts related to the acceptance factor.
2This factor will have a clear positive impact on social acceptance, but it will not be enough by itself to guarantee that the project is realized. Yet, the driver is so important it will have a significant impact on the overall assessment of the acceptance of the project.
3This factor, by itself, may be enough to ensure considerable support for the wind energy project.
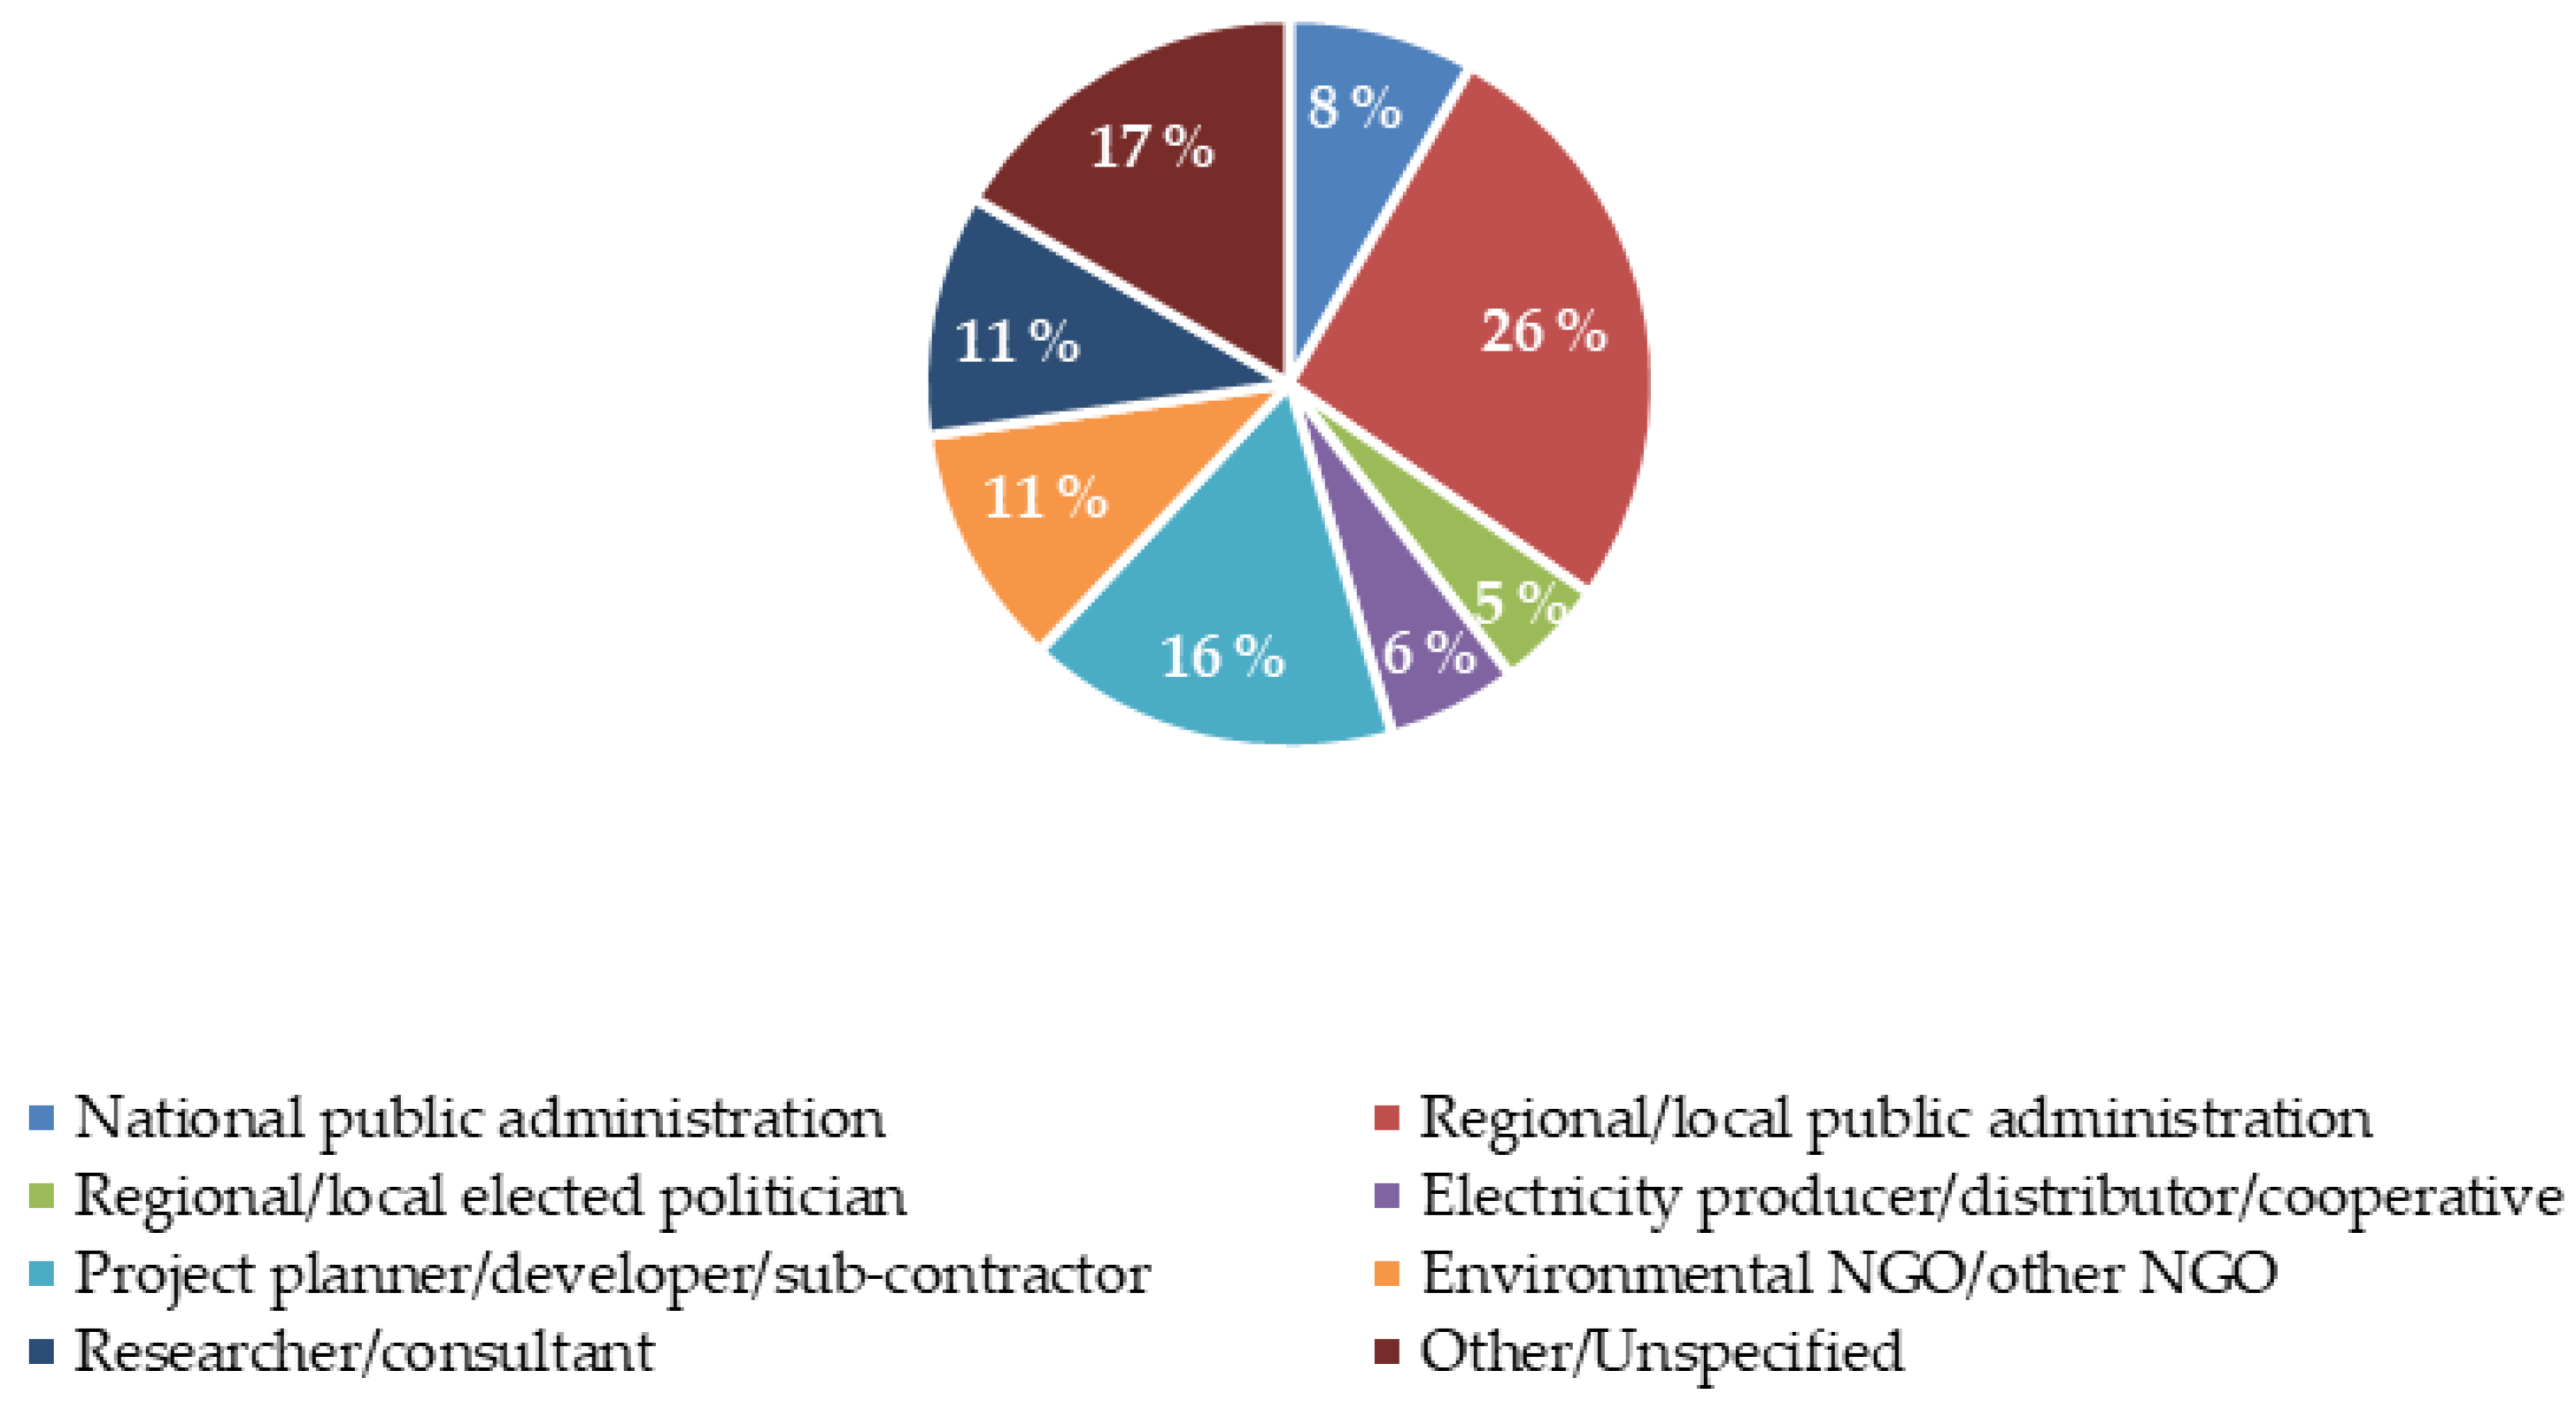
Table 3. Affiliation of stakeholders in each case region (N = 121).
Respondent AffiliationDEESITLANOPOSum
National public administration00163010
Regional/local public administration731651034
Regional/local elected politician3100116
Electricity producer/distributor/cooperative1112117
Project planner/developer/sub-contractor150212020
Environmental NGO/other NGO00256013
Researcher/consultant23122311
Other/unspecified033311020
Total281111252125121
* DE: Saxony and Thuringia, Germany; ES: Balearic Islands, Spain; IT: Abruzzo and Latium, Italy; LA: Latvia; NO: Mid-Norway; PO: Warmian-Masurian province, Poland.
Table 4. Variations in acceptance-related patterns across the regions. Red color indicates that the acceptance factor is, on average, evaluated as a barrier to social acceptance. Yellow color indicates that the factor is, on average, evaluated as having a neutral effect on social acceptance. Green color indicates that the factor is, on average, evaluated as a driver of social acceptance. Acceptance factor numbers are shown in parenthesis (see Table 1 for reference).
Acceptance Factor Category and Acceptance FactorDEESITLANOPOAvg. Across Regions
Technical characteristics of project
Size (1) −2−1−1−2−2−1−1
Visibility (2)−2−2−2−1−2−1−2
Distance (3)−2−2−1−2−1−2−2
Grid infrastructure improvement (4)−10−10000
Other infrastructure improvement (5)0001010
Impacts on environment
Physical environment (6)−2−2−3−2−2−1−2
Biodiversity & wildlife (7)−2−1−2−2−2−1−2
GHG (8)1302121
Impacts on economy
Tourism (9)−10−10−1−1−1
Agriculture (10)01−1−1010
Local profits & income (11)1211211
Individuals’ economy (12)1111111
Econ. distribution within community (13)0121011
Econ. distribution betw. communities (14)0111001
Ownership (15)1111111
Impacts on society
Health & well-being (16)−20−1−2−1−1−1
Quality of life (17)−10−1−1−1−1−1
Context
Market
Renewables (18)1112011
Energy demand (19)0111111
Planning & permitting process
Participation & consultation (20)1021111
Information & transparency (21)1021111
Trust in processes (22)1011111
Trust in information (23)1021111
Governance & regulatory framework
Targets (24)0211011
Plans (25)0111001
Taxation (26)0110100
Financial support schemes (27)0110111
Trust in key actors
Trust in nat. decision-makers (28)0010100
Trust in reg./loc. decision-makers (29)0010110
Trust in investors (30)0100000
Individual characteristics
Socio-cultural values (31)0000000
Sense of place (32)−1−10−1−10−1
Public discourse (33)0110−100
Political climate (34)0120−1−10
Number of barriers1061091199
Number of drivers9161915131615
* DE: Saxony and Thuringia, Germany; ES: Balearic Islands, Spain; IT: Abruzzo and Latium, Italy; LA: Latvia; NO: Mid-Norway; PO: Warmian-Masurian province, Poland.

