1. Introduction
The coal basin of the Jiu Valley (
Figure 1) is geographically located in the center of the country and contains the most important hard coal deposit in Romania, both in terms of balance reserves exceeding one billion tons and in relation to the special coking characteristics of the western coal seams in the basin. This deposit has been known and mined sporadically since the 19th century, but its systematic mining only began after World War II, reaching a maximum output capacity of over 8–10 million tons per year after 1980. The hard coal deposit covers an area of 163 km
2 and has been delimited in 17 mining fields, within which 13 mines have been exploited. Following several stages of reorganization and the closure of some mining perimeters starting in the 1990s, only 4 mines currently remain active, resulting a corresponding reduction of production capacities [
1].
From a geological point of view, the Jiu Valley coal basin is an epistructural depression consisting of a crystalline foundation and Molasic cover sedimentary deposits, attributed to the Upper Cretaceous (Maestrichtian), Paleogene, and Miocene periods, largely covered by possible Quaternary formations. The sedimentary deposits comprise the following main units: the Getic domain, the autochthonous domain, and the sedimentary complex of the basin with the Chattian level, which also includes coal seams.
The coal reserves are intensely tectonized, with a significant variation in the qualitative and quantitative parameters, generating geological blocks with small extensions, most of which range between 200 and 300 m (
Figure 2).
Within this basin, 22 coal seams have been identified, of which the highest weight is held by coal seam number 3 at 48%, followed by coal seam number 5 at 12%. Coal seam number 3 is located at a distance of 25–30 m from the Rupellian–Chatian limits. This coal seam has variable thicknesses ranging from 0.5 m to 34 m, sometimes even over 50 m, with large differences depending on the direction and dip of the seam. The largest thickness is found in the mining fields on the eastern side of the basin. The dips of the coal seams are very diverse, starting with the high dips towards the border of the basin, turning into gentle dips and then horizontal dips towards the center.
Because the genesis of the coal deposit is sedimentary, the most common rocks in this basin are limestone, marls, clays, clayish or marlish sandstones, and conglomerates, the compressive strengths of which are between 15 and 16 MPa, and sometimes even over 50–60 MPa. Generally, these rocks have a relatively low stability and are prone to collapsing.
Over time, as a result of the mining of thick coal seams in the Jiu Valley coal basin, deformations have appeared on the ground surface, which in some cases have even led to the destruction of buildings located on the surface and of some main underground mining works. In this respect, the effects mining activities have on the surroundings receive significant global attention due to the nature of their environmental and social responsibilities [
2]. In addition to the destruction of land and buildings, these phenomena have important impacts on the environment, including the impossibility of reusing the land for buildings or for agriculture; disturbance of groundwater flow regimes and hydrostatic levels, and in rarer cases pollution of the same area; and emissions into the atmosphere through fissures and cracks of methane (greenhouse) gas and of gases resulting from the spontaneous combustion of coal. Furthermore, the destruction of some buildings [
3] owned by disadvantaged families, together with other economic factors, have resulted in the emergence of significant social phenomena [
4,
5].
An important reserve of coal measuring almost one billion tons (equal to the balance coal reserve) is also immobilized in the main safety pillars of the buildings, roads, railways, and watercourses that cross the basin from east to west, and in the pillars of some main underground mining works (shafts, galleries, inclined planes, etc.). Failure to observe the limits of the main safety pillars has led to some of these objects being affected on the surface or underground.
The greatest damage to the ground surface has been caused by the mining of coal seams in horizontal slices, leading to total collapse of the surrounding rocks of the thick, large dip seams located at the limits of the coal basin, where the presence of construction is insignificant. As such, the purpose of the investigations reviewed in this article is to clarify the behaviour of the buildings located towards the center of the basin, which are affected by the underground mining of the thick coal seams with low dips, in the event of future extraction of the coal reserves from the main safety pillars or following an instance where the limits of these pillars are accidentally exceeded. The geo-mining conditions introduced in the numerical models are extreme ones that can occur only in the case of practicing roof control by caving of integral rocks [
6], and less so in conditions of total stowing (filling) of the gob [
7,
8,
9] (which will apply only in the event of a future decision to exploit the main safety pillars). The post-mining area can be filled with a hydraulic, dry, or paste filling. The choice of the backfilling method depends, among other things, on the time of backfilling, equipment, costs, and above all, the limitation of the impact of mining on the surface [
10,
11].
It is preferred to model the coal mining based on the total caving of roof rocks in order to achieve both the accidental damage of buildings through exceeding the pillar limits, as well as the planned mining of the coal reserves in the main safety pillars.
In general, underground mining operations lead to significant disturbances in the balance of the roof rocks, and sometimes in the floor of the mined coal seam. Finally, under certain conditions, this movement is transmitted to the surface, causing damage to both the ground surface and the objects located in the area of influence of the coal seam mining area [
12,
13]. The magnitude of these deformations depends on the following parameters: number of seams worked on; their thickness; the dimensions of the fields worked on within each seam; the exploitation method; liquidation of the space worked on; geological and hydrogeological overburden structures; and tectonics, strength, and strain properties of the rock mass and rock strata [
14].
Depending on the character of the ground deformation, the following factors differ: (a) continuous or trough subsidence, involving the formation of a smooth surface subsidence profile that is free of step changes; (b) a discontinuous subsidence, which is characterized by large surface displacements over limited surface areas and the formation of steps or discontinuities in the surface profile [
15].
In the case of continuous subsidence, the trough is characterized by terrain deformation indicators, such as: subsidence
w, horizontal displacement
u, horizontal strain
ε and vertical strain
ε(
z), slope
T, and radius of curvature
R [
14].
The main parameters of the subsidence troughs are determined separately for each mining basin, and even for each mining field, with the help of topographic measurements of high accuracy. Across the globe, the monitoring of deformation over time of the surface lands under the influence of underground mining, especially in the areas of special interest, is carried out systematically with the help of topographic and photogrammetric methods, global positioning systems (GPS) technology, interferometric synthetic aperture radar (InSAR) [
16] together geographic information systems (GIS) [
17], and by laser scanning (either land or aerial) [
18].
The prognosis and the study of the deformations of the lands affected by the underground mining can be done with the aid of empirical methods (profile functions and influence functions); physical models (based on rock like or optically active materials); analytical models (plate and beam theory [
7], etc.)); and numerical models (finite element, finite difference, boundary element, and distinct element methods [
19,
20,
21]).
The land deformation also affects the surface buildings and underground mining construction within the radius of the coal mining influence.
While in the specialized literature there are numerous in-depth studies on the numerical modelling of the influence of tunnel excavation on surface buildings [
22,
23,
24,
25,
26,
27,
28,
29,
30,
31,
32], in the case of underground mining of deposits of useful mineral substances, these studies are less frequent [
3,
33,
34,
35]. Therefore, we consider that this study has a certain contribution to the elucidation of the behaviour of buildings under the influence of coal seam mining by means of the longwall faces, especially by analyzing the development of the state of stresses in the structural elements of the buildings.
Over time, the assessment of the damage to the surface structures caused by the underground mining has become the concern of many experts.
It is quite difficult to quantitatively determine the destruction of the surface structures due to underground mining. The deformations induced in different structures, once they exceed the critical values of the characteristics of the structural elements, cause damage. The amount and intensity of the damage depends on their ability to take over the additional stresses generated by the deformations transmitted by the ground. Therefore, the maximum permissible deformations of the ground and structures vary from country to country, and even frequently from one region to another region in the same country [
36].
Specialists from certain countries (UK, China, Russia, USA, Australia, and others) affected by the phenomenon of mining subsidence have developed methods of assessing the damage of buildings located in the mining subsidence areas. Most of these methods are empirical, based on observations made on degraded buildings. There are also various methods based on simple mechanical and analytical calculations [
37]. In the same context, to study the impact of mining subsidence on masonry buildings, Abdallah and Verdel used a numerical experimental design, represented by distinct element models of a masonry wall, where masonry blocks are explicitly taken into account, along with statistical analysis and surface responses according to the positions of buildings in the convex or the concave curvature zones of a subsidence trough [
3].
The vulnerability analysis of a structure in relation to ground deformation is difficult to perform due to the quantity of the necessary repair works, uncertainty regarding requests, and the uncertainty of the different methods used to assess the damage. The vulnerability functions define the damage according to the intensity of the danger and are expressed either by empirical methods or analytical methods [
38]. As such, this problem has elicited concern for many researchers.
The tensile and compressive strains are clearly the main factors that cause the destruction of all types of structures on the surface. The degree of transmission of horizontal strain depends on the rigidity of a structure relative to that of the ground [
38,
39]. Structures are sensitive to all types of terrain deformation, except for pure subsidence and pure displacement, while transport structures are sensitive to pure subsidence [
39].
Bruhn et al. [
40] proposed a classification scheme founded on the basic characteristics of the damage, quantified according to a severity index that takes into account both the damage to walls and floors and their rehabilitation costs. Additionally, Sengupta [
41] proposes a method of classification in which the characteristics of buildings are divided into different categories in accordance with their response to ground surface deformation. The final category represents the sum of all categories of the diverse characteristics of buildings, which includes building foundations, superstructure materials, the ratio between the length of a building and the radius of influence, and the ratio between the height of a building and its length.
The correlation between the values of the deformations and the damage caused to the buildings is established by Wardell [
42] in five classes, in which the severity of the damage caused to the buildings is assessed according to their length and the deformation to the foundations. Later, other experts detailed this classification into six classes for two-storey brick structures, taking into consideration deflection ratios, extensions, and crack width [
21,
43,
44].
Taking into account the factors presented above, the finite element analysis of the behavior of buildings under the influence of the underground mining of thick coal seams from the Jiu Valley, and the studies synthesized in this article, our work has the following practical motivations:
- -
investigating the potential mining of a lost reserve in the main safety pillars of cities of over 1 billion tons;
- -
investigating accidental mining of the safety pillars of the buildings.
We note that the finite element analysis of the building stability under the influence of coal seam mining in the Jiu Valley is performed for the first time under the conditions of the most important coal basin in Romania. In addition, there is a drastic lack of such numerical analyses in the literature, due to existence of very large underground mining excavations of the order of hundreds of thousands of m
3 (which, in this case, led to the generation of numerical models with a volume of over 500 million m
3) compared to the small sizes of the buildings. These constraints have created special problems, both in terms of model construction and calculations. Therefore, the closest numerical models known in the literature are those relating to buildings under the influence of tunnels (excavations with a small volume of the order of thousands of m
3), which involve models with much smaller dimensions (with a volume of the order of hundreds of thousands of m
3) and implicitly require less important computing resources [
20,
21,
22,
23,
24,
25,
26,
27,
28,
29,
30]. Therefore, this numerical modelling analysis, which is specific to civil engineering, has allowed consideration of many details regarding the construction of models and constitutive laws applied to rocks and materials, which are much more complex than in the case of mining engineering problems (as they are treated in this article).
3. Study on the Behaviour of Buildings Located in the Influence Area of Thick Coal Seam Mining by 3D Finite Element Modelling
3.1. Description of Finite Element Models
The purpose of the research constituting the subject of this paper is the study of the behaviour of buildings located on the ground surface of the coal deposits in the Jiu Valley, which are under the influence of thick coal seam mining with gentle dips using different extraction systems. In these geo-mining conditions, several numerical models were generated, which were the basis of the following stability analyses, namely:
- (a)
the stability of buildings with the same geometry in the horizontal plane, with one, two, and three levels, built entirely of reinforced concrete;
- (b)
the stability of a building with two levels of different lengths, the first version built entirely of reinforced concrete and another variant built with brick masonry walls and reinforced concrete floors.
We mention the fact that the modelled buildings are representative of the houses in the Jiu Valley, where the precast reinforced concrete buildings are predominant.
To achieve the purpose of the mentioned investigations, we used 3D finite element modelling with the aid of the CESAR-LCPC software version 4 and the CLEO3D processor.
From the beginning, we must highlight a series of constraints and limits imposed by the complexity of the aforementioned models, namely:
- -
the very large dimensions of the models (0.5 billion m3), determined by the large volume of the gobs, which require significant computational resources;
- -
the very high ratio between the relatively small sizes of the buildings and the very large dimensions of the modelled rock massif;
- -
the important number of models (over of 300 computational models) with different geometries (determined by the existence of panels in different mining sequences and buildings of different lengths and heights) coming from a single conceptual 3D finite element model.
Due to the above restrictions, in order for these models to be put into operation, it was necessary to implement the following simplifications, without inducing significant deviations in the results obtained:
- -
focusing the modelling interest on the behaviour of buildings and less on the behaviour of the ground surface, in the context of sequential extraction of a coal seam;
- -
the thick coal seam undergoing exploitation is modelled as horizontal;
- -
the gobs are represented in the massif model in the form of voids;
- -
the coal seam, the rock mass, and the constructive elements of buildings are considered to be continuous, homogeneous, and isotropic;
- -
the rock massif loading is simulated as gravitational.
We mention that the above simplifications were performed based on sensitivity analyses of the main parameters of the subsidence troughs to the variation of the geometrical and qualitative characteristics contained in the analyzed models, and the calculation parameters were calibrated according to the in situ ground deformation measurements [
45,
49].
As a consequence, the modelling of the coal deposit subjected to mining was made for the conditions of thick coal seams with gentle dips, located at an average depth of
H = 300 m—the most frequently encountered depth of thick coal seam number 3 in the areas with reduced dips in the Jiu Valley hard coal basin (for example, from the Paroşeni, Lupeni, and Livezeni mining fields, shown in
Figure 1).
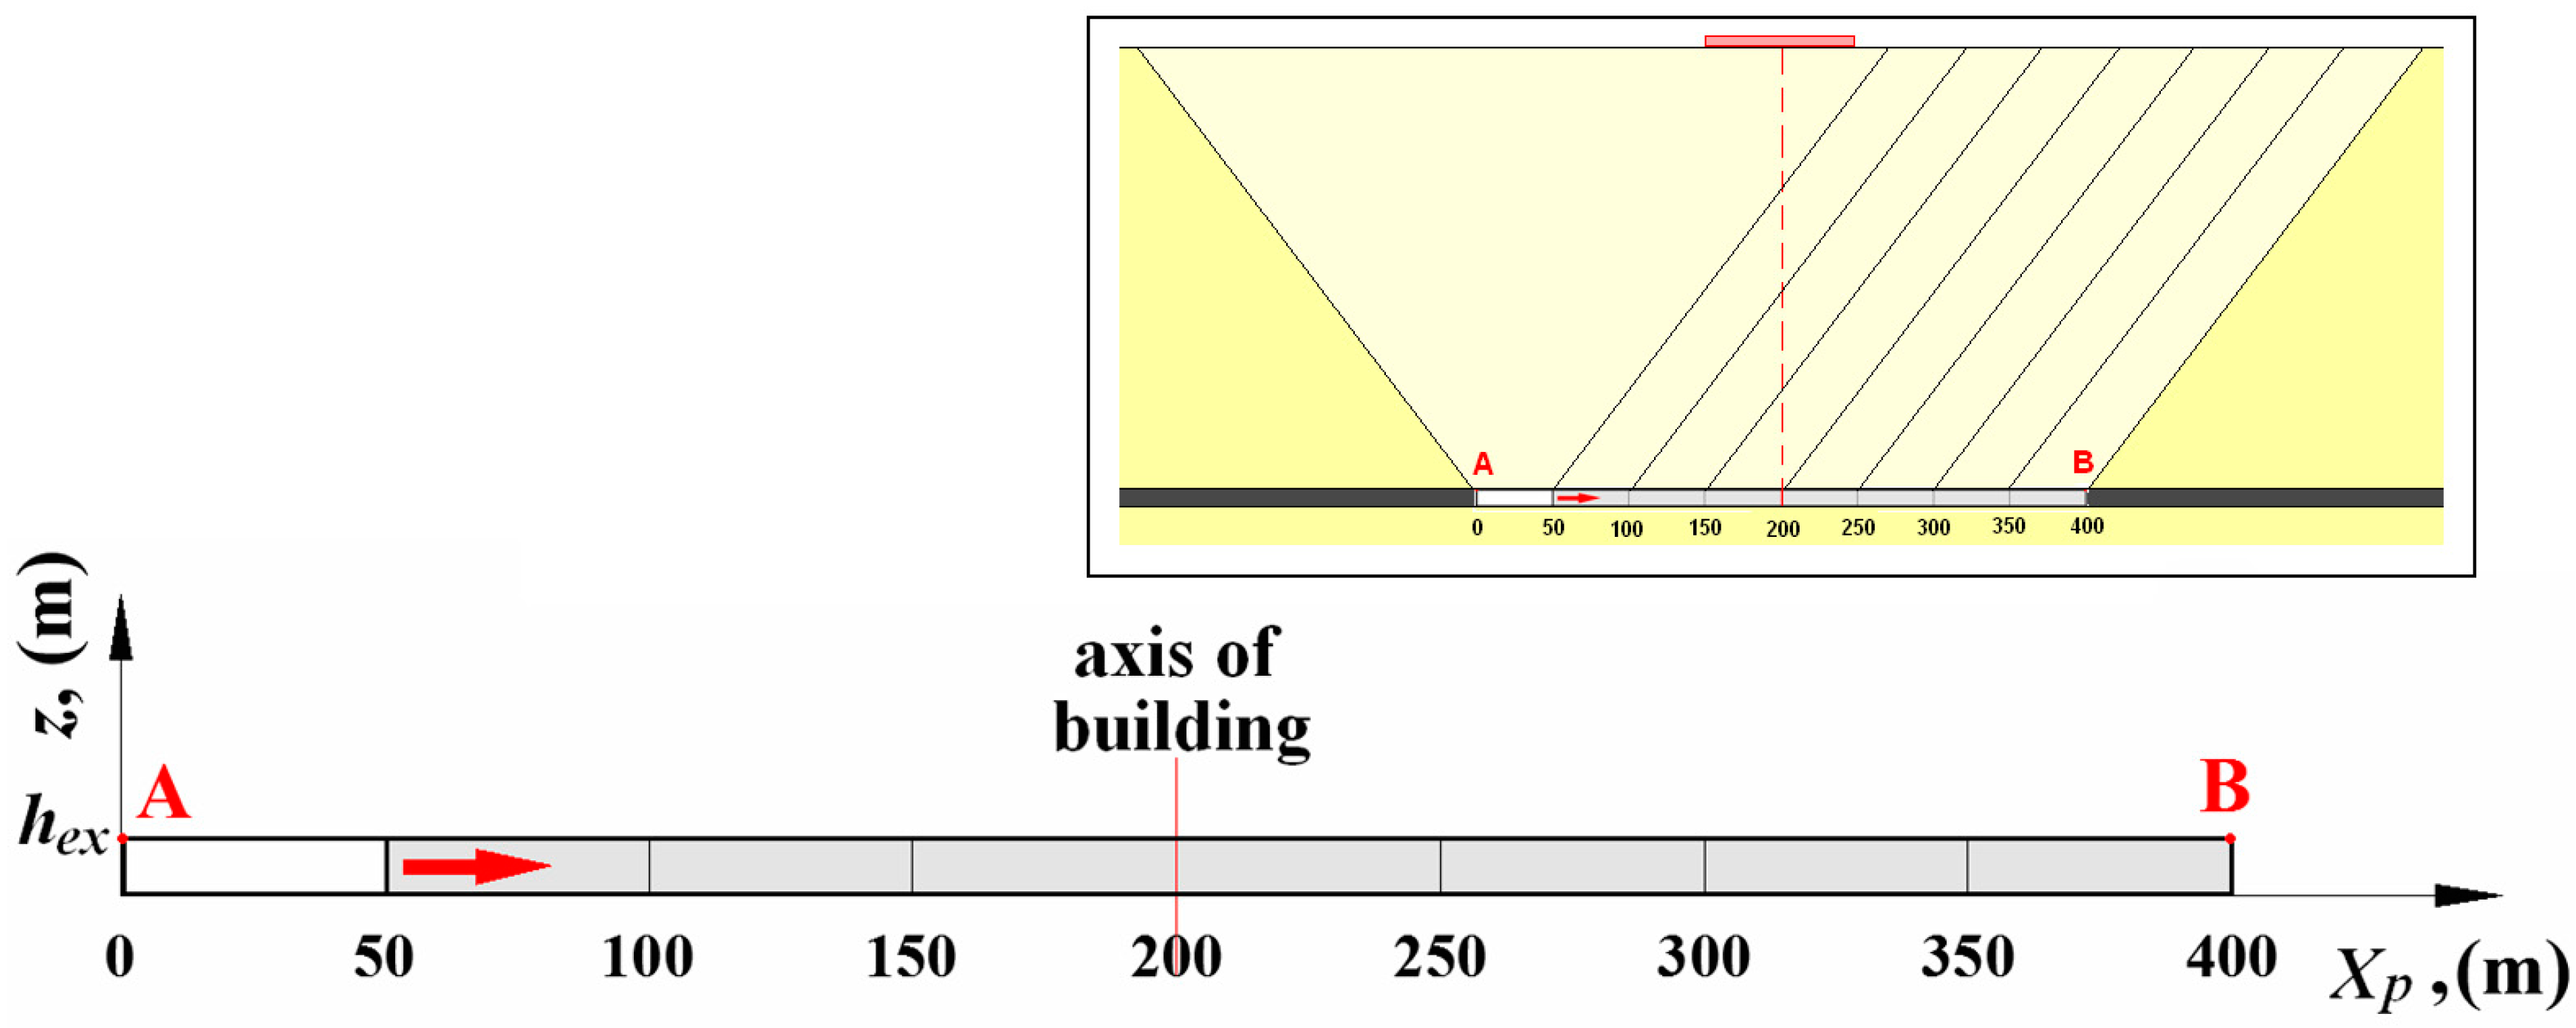
So that the results obtained can be significant for the conditions in the Jiu Valley, the coal seam was imagined as being mined in a panel with a total extension of Xp = 400 m and with a longwall face length of lf = 150 m. We note that due to the complicated tectonics of the coal field in the Jiu Valley, these dimensions of the panels are technically possible.
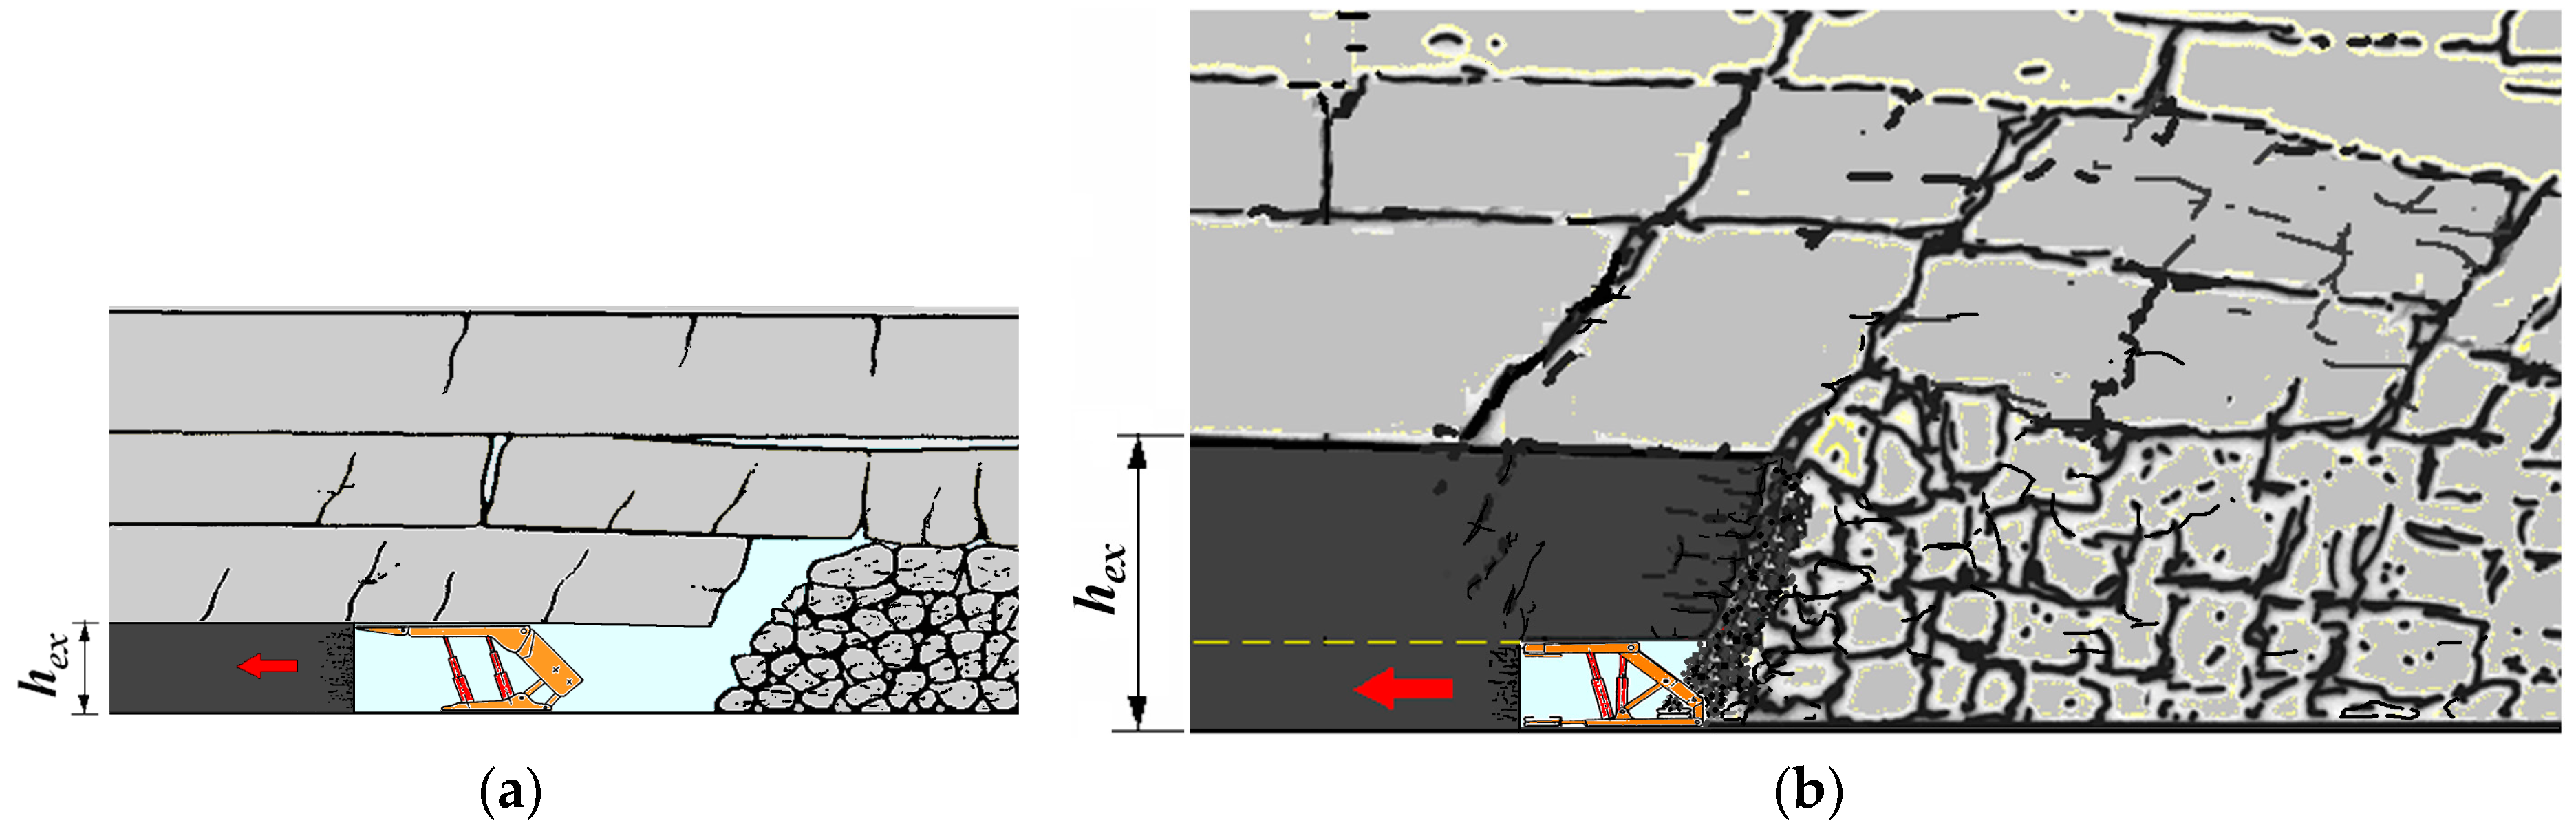
In the finite element analysis, several case studies were considered for the mined coal seams with longwall coal faces:
- (a)
the caving of the roof rocks (
Figure 7a) of a coal seam mined at mining heights of
hex = 3 m, 4 m, and 5 m;
- (b)
top coal caving (
Figure 7b) of a coal seam mined at a mining height of
hex = 9 m.
- (c)
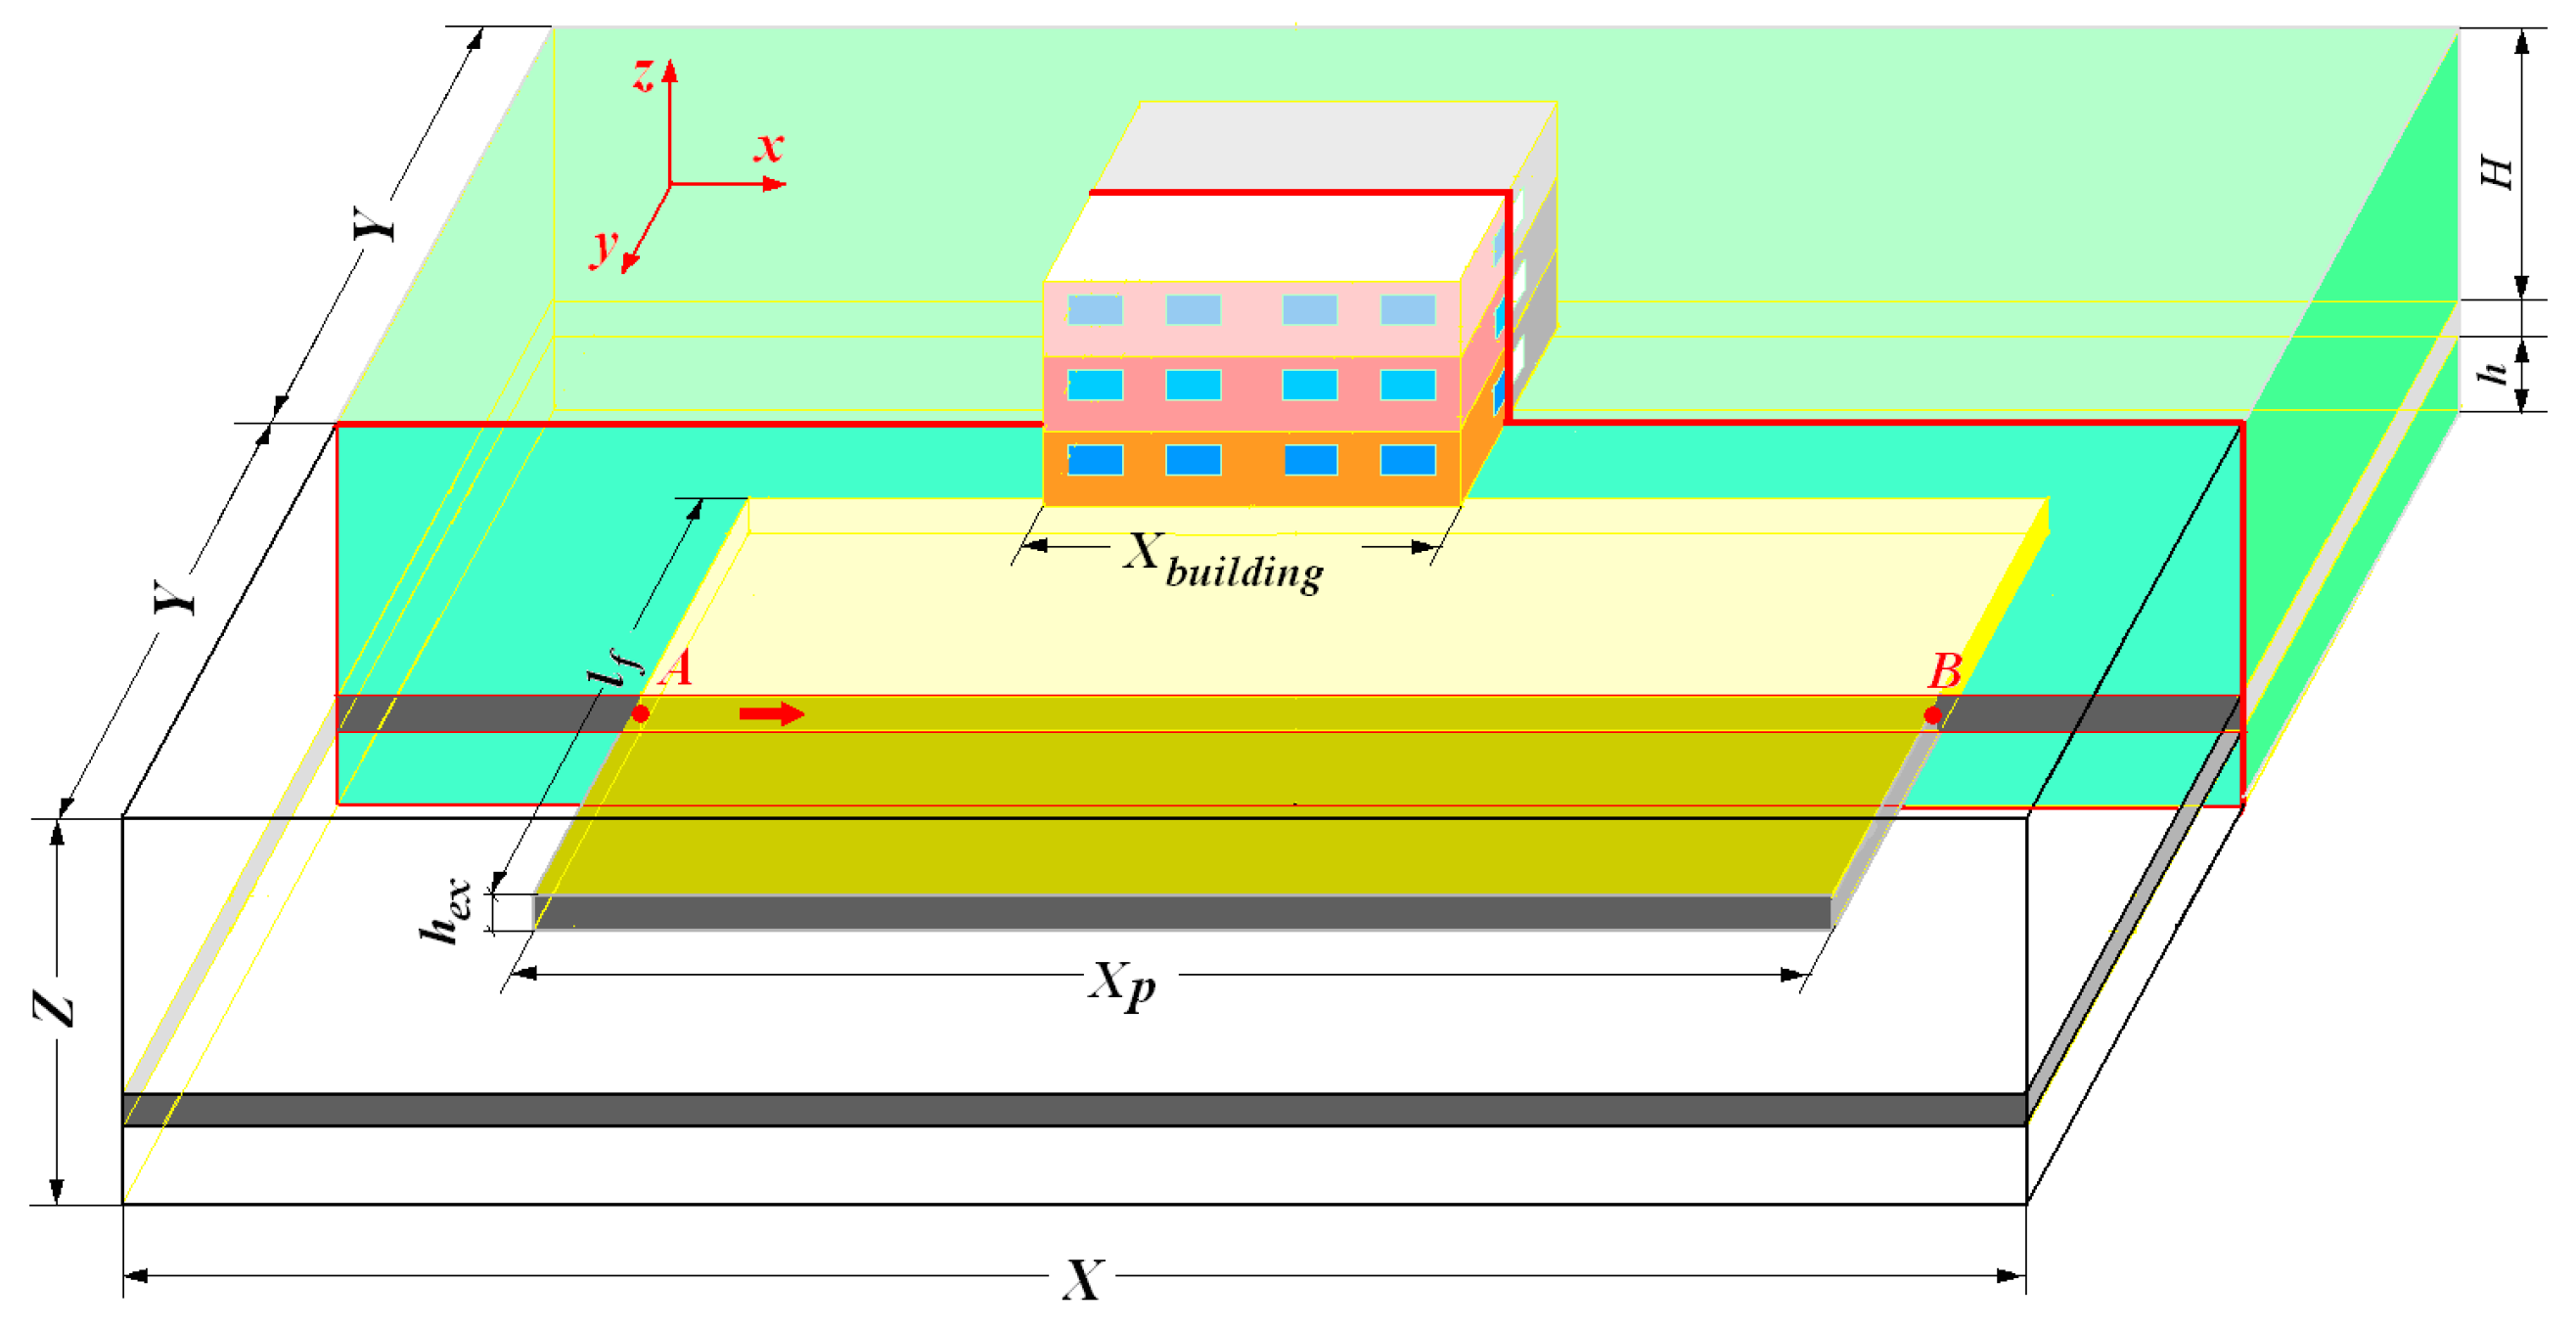
Regarding the modelling of the stability of the structures on the surface, two fundamental situations were analyzed:
- (a)
buildings with a fixed horizontal surface (Xbuilding = 20 m/Ybuilding = 10 m), with one, two, and three levels (with Zbuilding = 3 m, 6 m, and 9 m high) and with coal seam mining heights of hex = 3 m, 4 m. and 9 m (where: Xbuilding, Ybuilding and Zbuilding are the dimensions of the buildings);
- d)
buildings with two levels (with a height of Zbuilding = 6 m), with a constant width (Ybuilding = 18 m) and variable length (Xbuilding. = 50 m 100 m) and with a coal seam mining height of hex = 5 m.
The buildings were arranged on the vertical line raised in the center of the panel (for
Xp = 400 m). In all cases, the levels of buildings with a height of 3 m were separated from each other with reinforced concrete floors, so that a series of buildings with heights of 3 m, 6 m, and 9 m resulted in the image shown in
Figure 8).
As we can see in
Figure 9, the computational models studied the successive mining of the panel in several stages, starting from the set up room at point A to the recovery room at point B.
In order to reduce the dimensions of the basic model (see
Figure 7), its symmetry was taken into account according to the vertical cross-section plane
z0
x, resulting in a model with dimensions of
X = 2500 m,
Y = 500 m, and
Z = 400 m, with a total volume of modelled rock massif of 500 × 10
6 m
3. The models with finite elements were meshed with 40,843 volumetric finite elements, 540 surface finite elements (shell type), and 23,712 nodes.
The density of discretization with finite elements is increased near the foundation of the buildings and around the excavations, where the variation of strains and stresses is more pronounced.
Regarding the representation of the massif, this was obtained from the discretization in the plane of a model with triangular finite elements, and through its sequential “extrusion” after the “z” axis, 3D finite elements in the form of triangular prisms were obtained with the height oriented after this axis.
Due to the very large volume of the modelled rock massif, which requires significant computational resources, in order to reduce them for the construction of the walls and floors of the modelled buildings, the “extrusion” option of the CLEO3D processor was used, but applied on linear finite elements in order to generate “shell” surface finite elements.
For the implementation of the model boundary conditions, the following restrictions were imposed. For the lower limit, the movement along the z axis was blocked (Ux = Uy 0; Wz = 0), and for the lateral limits, the movements along the x and y axes (Ux = Uy = 0; Wz 0) maintained the freedom of movement for the ground surface (Wz 0).
Regarding the constitutive laws of the materials used in the models, a hypothesis incorporating an elasto-plastic Mohr–Coulomb criterion without hardening behaviour for the rock or coal mass was used; and an elastic type was chosen for the reinforced concrete and masonry construction elements. In this regard, we adopted average features determined in the laboratory and in situ for the rock and coal mass, which are presented in
Table 3. The properties of real rock masses in the field are usually different from those tested in the laboratory [
50]. Therefore, following the sensitivity analyses of the parameters according to different factors, performed on numerical models [
49] and calibrated on in situ measurements, the characteristics of the massif used in numerical modelling were adopted [
45]. The elastic modulus, cohesion, and tensile strength results are generally 0.1–0.25 of the laboratory testing results. The Poisson’s ratios are approximately 1:2–1:4 of the laboratory testing results [
51].
For the materials used in the structural elements of the structures modelled with finite element method, a series of equivalent average properties were adopted, both for reinforced concrete and for the masonry walls (zigzag bricks and mortar [
23]), shown in
Table 4.
In the calculations, “phase” loading of the model was used, using the MCNL module of the CESAR solver. The model was geostatically loaded in the initial phase, with average vertical stresses at the mining level
and horizontal stresses
; the buildings were gravitationally charged. Here,
is the average apparent specific weight of the overburden rocks;
[
52];
is the average Poisson’s ratio (represents the value of the weighted arithmetic mean of all the rock strata in the package, depending on their thickness).
3.2. Deformation of the Ground Surface due to Underground Mining
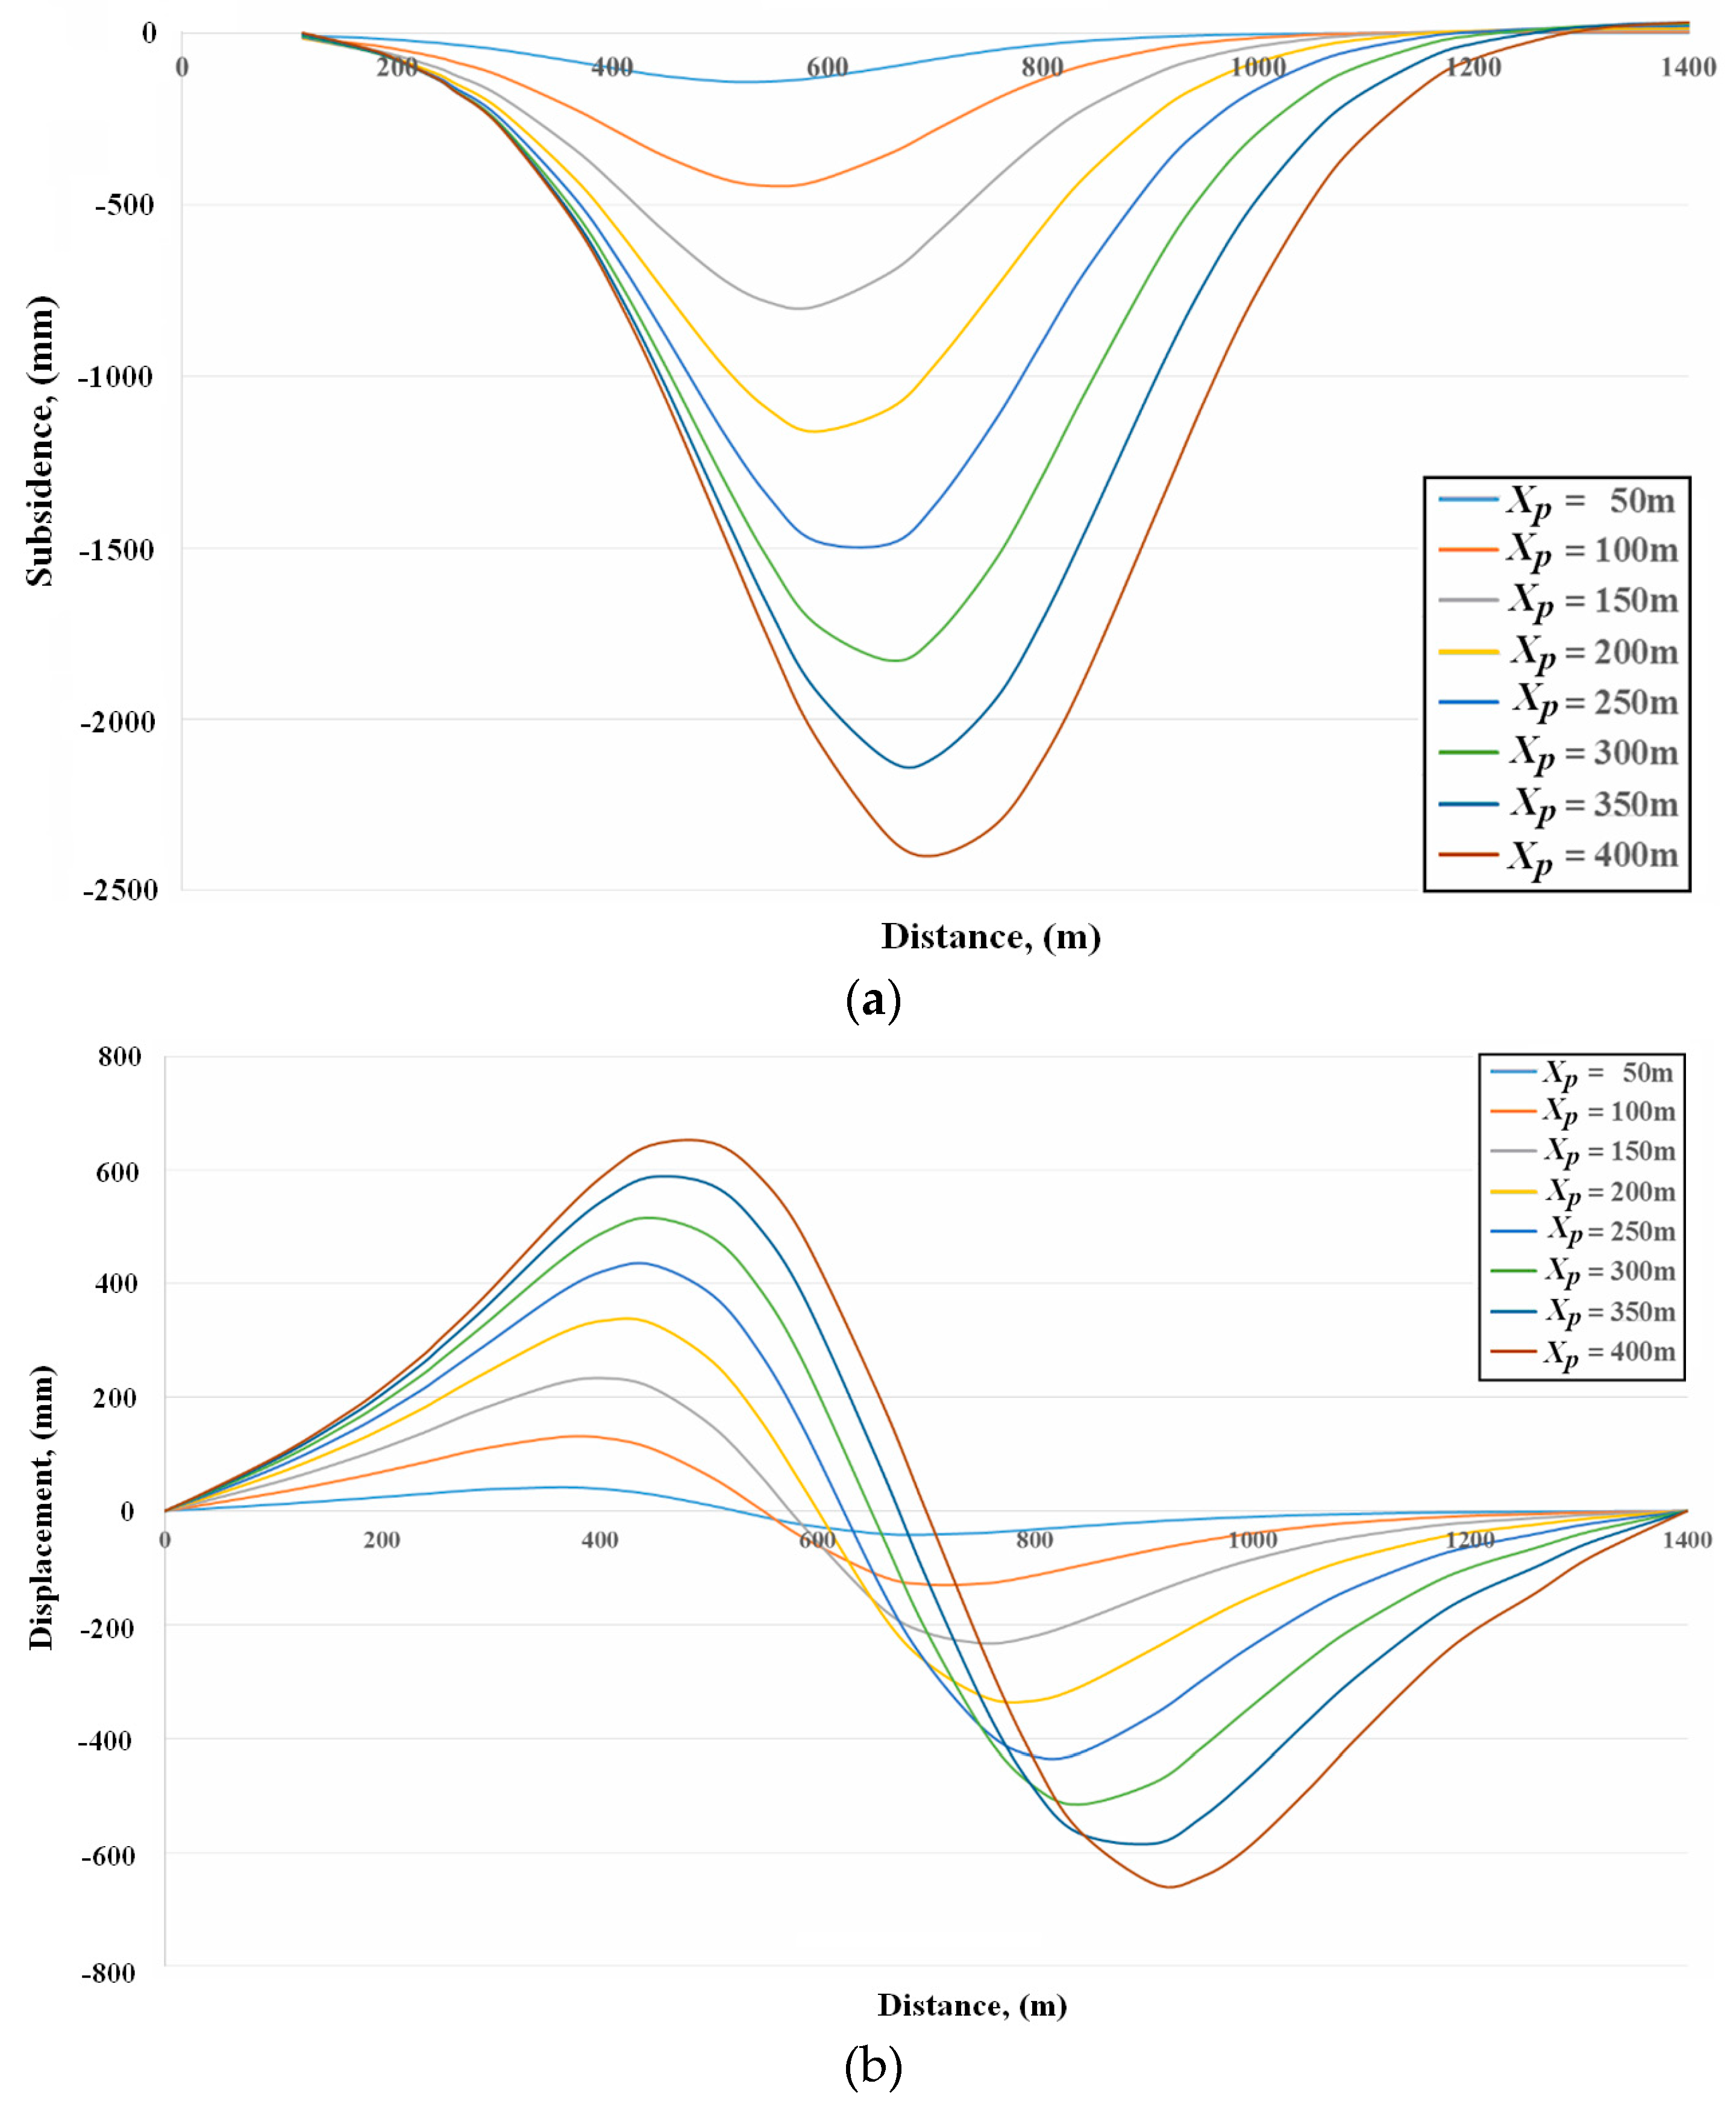
Following the calculations made on the finite element models, different values were obtained for subsidence Wz and horizontal displacement Ux of the ground surface, depending on the coal seam mining height hex, the position of the coal working face, and the mining extension of panel Xp.
For example, for the coal seam with a mining height of
hex = 5 m, the subsidence
W reaches a maximum value of +2400 mm at the time of full operation of the panel with a length of
Xp = 400 m, and at the point where the gob has an extension of the mined out area measuring
Xp = 50 m, the subsidence is 140mm (
Figure 10a).
The horizontal displacement
Ux at the point where the mined panel has a size of
Xp = 50 m and is at a distance of 150 m from the axis of the building, it has a maximum value of ±42 mm. It continues its development until the full exploitation of the panel, where it reaches a value of ±657 mm (
Figure 10b).
For all cases analyzed with finite elements, the maximum values of the ground surface displacement parameters are summarized in
Table 5.
3.3. Analysis of the Distribution of the Principal Stresses in the Structural Elements of the Buildings from the Jiu Valley
The stability analysis of the buildings under study, modelled with “shell” finite elements, is performed based on the distribution of the major principal stress and minor stress in the structure of the modelled buildings. The assessment of the behaviour of the structural elements of the buildings and the requests determined by the principal stress is based on “the theory of maximum normal stress”, which is applicable, but with a bias for brittle or rigid materials (such as concrete and brick masonry). Based on this theory, the limited state of strength of the material at one point of the resistance element is reached when the value of the major principal stress or minor stress is equal with to limit strength (stress) in the tensile test or simple compressive test of the respective material.
3.3.1. Analysis of Stresses in Buildings with One, Two, and Three Levels
Single-Level Buildings
In the case of buildings with one level, the development of maximum values of the major principal stress
is for tensile ranges between 1640 kN/m
2 and 31,800 kN/m
2 for
hex = 3 m; and between 1840 kN/m
2 and 33,100 kN/m
2 for
hex = 9 m (
Figure 11).
Regarding the development of maximum stresses in the building, depending on the mined thickness of the coal seam hex, there is a concentration of tensile stresses on the floor, the corners of the windows, and the walls of the building closest to the coal face line when the working face is in the second sequence of the model for
Xp = 100 m. The extension of the zones affected by the coal mining continues so that at the end of the exploitation of the coal seam, the areas where the highest concentration of stresses exists are the corners of the windows; the joints between the side walls, the front walls, and the floor of the building; the part of the wall between the windows; and the window lintels (
Figure 11, detail D).
Following the analysis of the maximum values of minor principal stresses
(compressive stresses) developed in the structural elements of a single-level building (
Figure 12), it turns out that they occur from a value of −7000 kN/m
2 for
hex = 3 m and
Xp = 100 m down to a value of −80,800 kN/m
2 when fully operating the panel (for
Xp = 400 m).
In the case of the mining panel with
Xp = 100 m, the main structural elements of the building loaded by compressive stresses are the foundation, the window parapet, and the part of the building closest to the coal face line. Consequently, the degradation of the building continues so that at the end of the operation of the panel, the building is totally affected, with the most affected areas being the corners of the windows, the joints between the side walls, the front walls, and the foundation (
Figure 12, detail D).
Two-Level Buildings
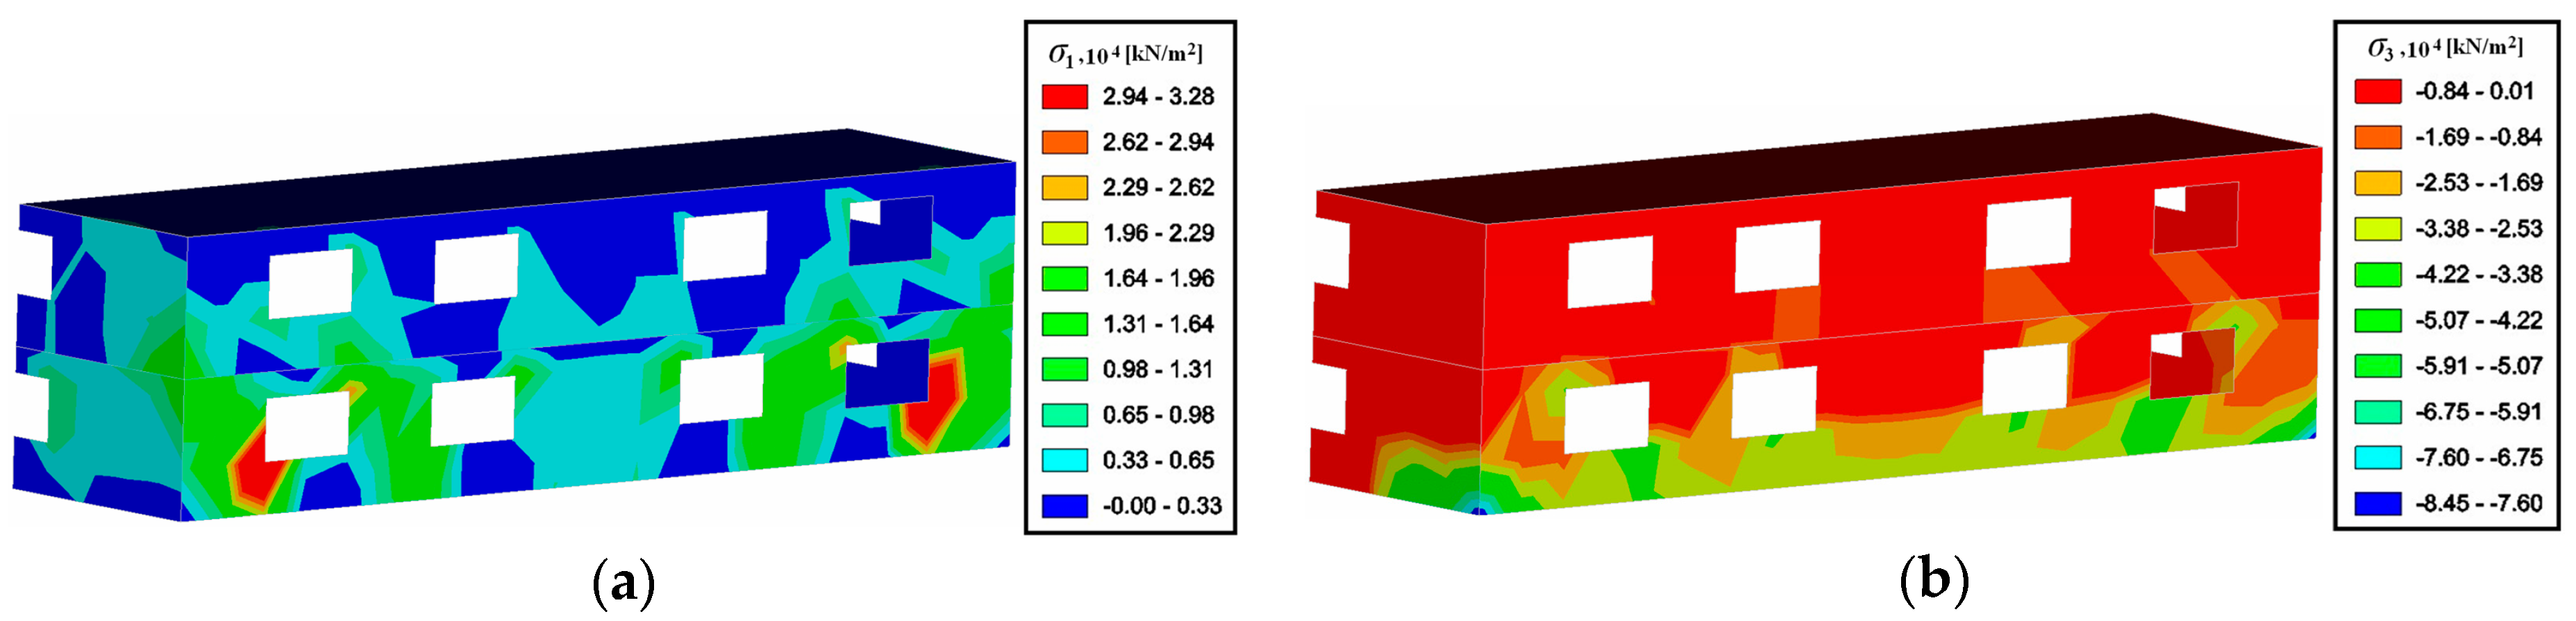
Regarding the major principal (tensile) stress
, to which a building with two levels is exposed, for
hex = 9 m and
Xp = 400 m, a maximum of 32,700 kN/m
2 is reached, so that the following are subject to tensile stresses: the facade and the lower and upper corners of the windows on the two levels of the building; and the area where the facade of the building joins with the side walls, both on the first level and the higher level (
Figure 13a).
For the same conditions, the value of the minor principal stress
(compressive stresses) reaches a maximum of −84,400 kN/m
2. The main areas of the building subject to compressive stresses (
Figure 13b) are: the foundations as a whole, the parapets of the windows, the upper corners of the windows, the floor on the first level, and the parapets of the windows on the second level.
It should be noted that tensile or compressive loadings are focused on the first level, including its floor, and less so on the second level, whose floor is loaded insignificantly.
Three-Level Buildings
Major principal (tensile) stresses appearing in a building with three levels are influenced by the exploitation of a coal seam or 3 m slices and range between 1650 kN/m2 and 31700 kN/m2, growing to a maximum of 33,000 kN/m2 for hex = 9 m.
In the case of extraction of a coal seam or slice with
hex = 9 m, for a mined panel measuring 400 m, the main areas affected by major principal (tensile) stresses are: the building’s front and the lower and upper corners of the windows from the first two levels of the building; the area where the facade of the building joins with the side walls, both on the first level and the upper level; and the side walls of the building, both on the first level and the other two upper levels (
Figure 14a).
The development of minor principal stresses (compressive stresses) in the structural elements of the three-level building for hex = 3 m ranges between −6950 kN/m2 and −81,400 kN/m2, reaching a maximum of −85,000 kN/m2 for hex = 9 m.
These principal compressive stresses develop with the mining thickness of the coal seam, so that for
hex = 9 m the main affected areas of the building are: the foundation as a whole; the parapets of the windows; the upper and lower corners of the windows; the floor from the first level and parts of the parapets of the windows from the second level; the area where the facade of the building joins with the side walls; and the foundation (
Figure 14b).
As we can see from
Figure 14, stress concentration is still mainly limited to the first level of the building; it is much less apparent on the second level and insignificant on the third level.
3.3.2. Stress Analysis in Buildings with Two Levels and Different Lengths
Reinforced Concrete Buildings
For reinforced concrete buildings, studying the results obtained by numerical modelling leads to an observation that the greatest stresses appear for a building with a length of 100 m, with an extension of the mined out area measuring Xp = 400 m. Principal stresses grow almost linearly in line with the length of the building and approximately linearly in three different areas in line with the development of the panel operation Xp.
As the length of the gob increases, stresses arising in the structures of the buildings start from an asymmetrical distribution with Xp = 50 m and reach an integral symmetrical distribution with respect to the building axis at the end of the panel extraction for Xp = 400 m. In the latter case, the areas with the highest concentration of stresses are the corners of the foundations at the ends of the buildings and the upper corners of the windows.
The asymmetric distribution of stresses is given by the distance of the building from the working face and implicitly from the gob, which influences the spatial distribution of stress concentrators in the structure of the building, both in position and intensity.
In the case of buildings with walls and floors made entirely of reinforced concrete, it is the case that the structural elements are very compact and the loads developed by the ground surface are transmitted almost entirely to the walls, which have very high bending rigidity. For this reason, one can notice a concentration of stresses in the hollows of the windows and towards the ends of the buildings.
Along with the increase of the volume of the gob area, it is evident that the displacements of the ground surface are amplified, causing an increase of stresses in the structural elements of the buildings. Moreover, we can observe a concentration of stresses towards the ends of the building, with their emphasis towards the end-facing the gob. These laws are general for distribution in the structure of buildings of different lengths with all types of stresses (which will be analyzed below).
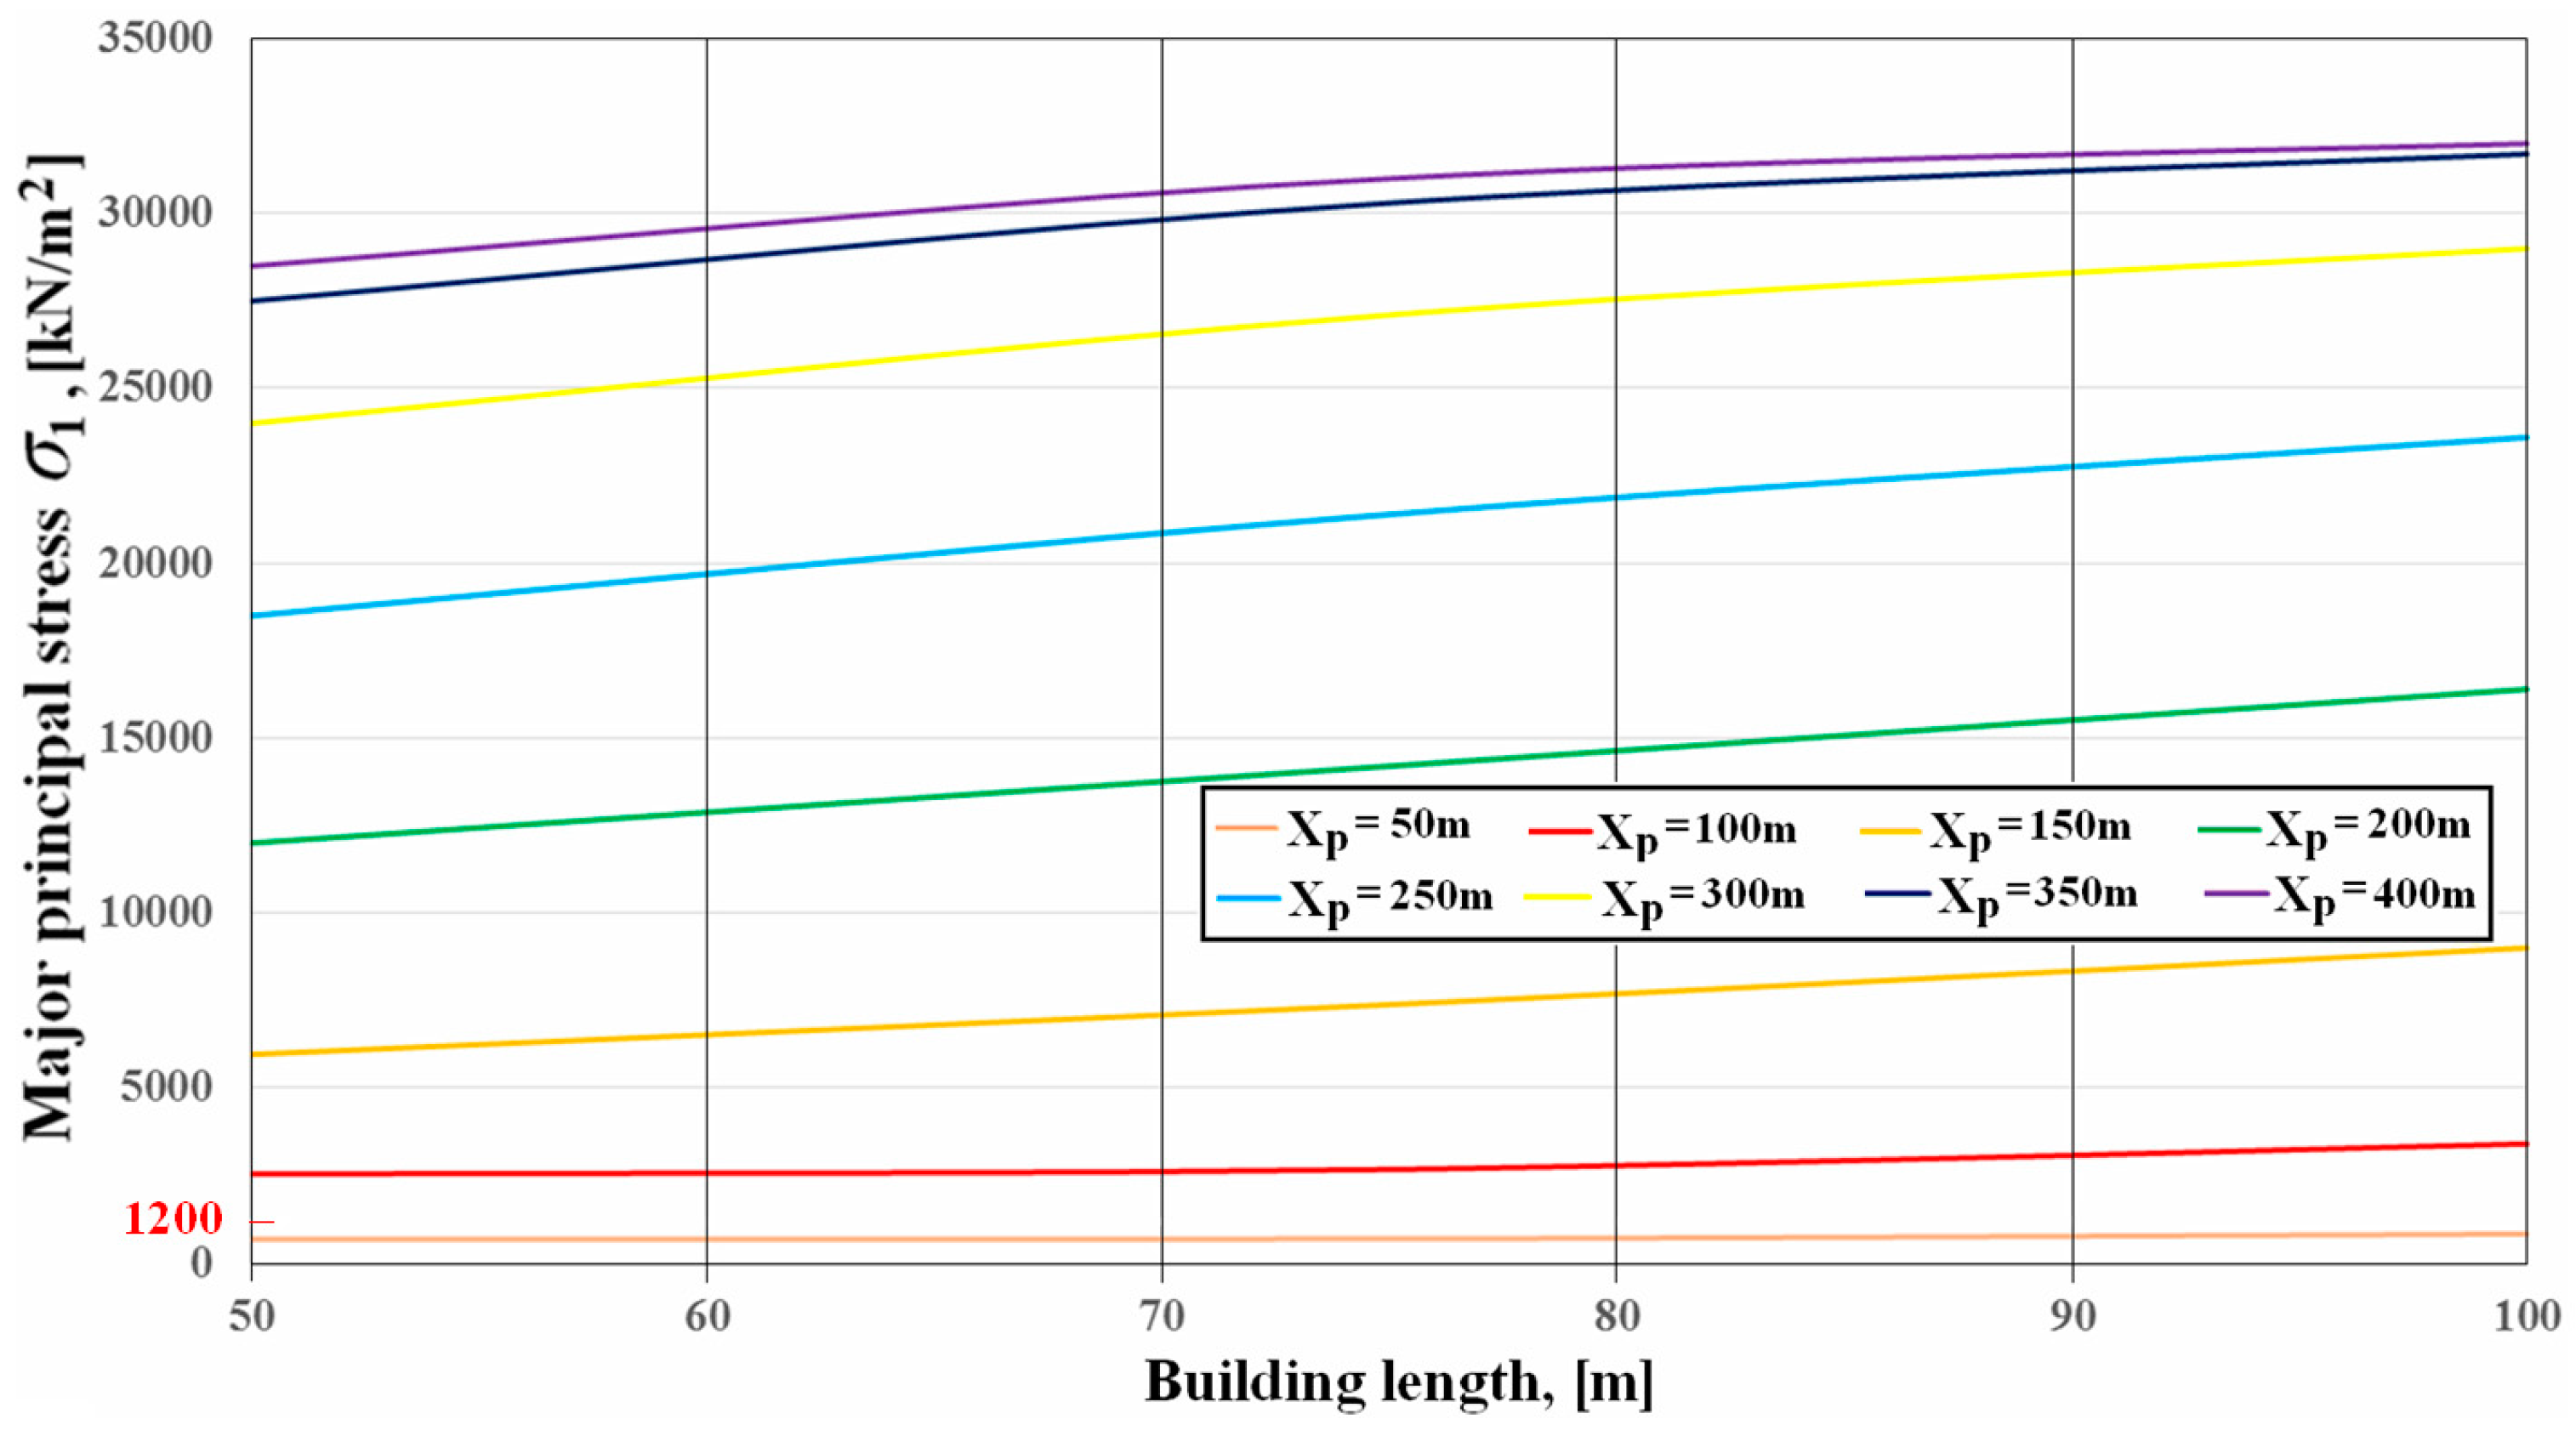
In
Figure 15, one may notice that the values of major principal (tensile) stresses
grow almost linearly as the length of the building increases in the range of 50–70 m, with a slow reduction of stress values for buildings over 70 m in length, reaching a maximum value for buildings measuring 100 m in length.
Depending on the mining extent of the panel, the dynamics of the maximum and minimum stresses have the same growth tendency, as shown in the previous subchapter (
Section 3.3.1).
For all cases, it is observed that maximum stresses exceed the average tensile strength of the concrete (of 1200 kN/m2) immediately after the first operating sequence for Xp = 50 m.
From the maximum stress distribution in the structure of the buildings, it is found that once the operation is started (for
Xp = 50 m), the most affected areas are the lower corner of the window on the long side of the building closest to the gob and the corner of the foundation opposite to it (
Figure 16). After the operation reaches the final stage (under the conditions analyzed,
Xp = 400 m, with the building located in the center of the gob), it is found that major principal stresses reach the highest values in the lower corners of the marginal windows on the lower floor, with a decrease of the stress values towards the center of the buildings.
It should be noted that for all the cases analyzed, during the mining extension of the panel from Xp = 50 m to Xp = 400 m the development of major and minor stresses begins with a strongly asymmetrical distribution in relation to the length of the buildings towards their ends, which is accentuated towards the end closest to the gob area, which obviously reaches perfect symmetry at the end of the panel operation.
In the case of reinforced concrete buildings, the maximum values of minor principal stresses (
Figure 17) show an increase in absolute value, which is approximately linear according to the lengths of the buildings (from the buildings with length of 50 m to those with lengths of 100 m) for all operating sequences (between
Xp = 50 m and
Xp = 400 m).
Depending on the extent of the area under exploitation, minor stresses also maintain the same tendency, which is more pronounced in the range of Xp = 175–325 m and slower for the rest of the panel operating intervals. Comparing these values with the compressive failure strength of the concrete, it can be noted that it is exceeded in the length of the gob by Xp = 150 m.
From the scalar representation of stresses in the building structure (
Figure 18), it is found that once the mining of the panel begins, the greatest stresses are in the lower part of the building, in the corners closest to the foundation of the area under exploitation. As mining of the coal seam progresses, stresses affect the entire structure of the building, with a decrease in their value towards the center of the building. In the final phase of the operation, the most affected areas of the building are the corners of the foundation and the lower and upper corners of the windows.
Buildings with masonry walls and reinforced concrete floors.
Regarding masonry buildings, a significant decrease of the maximum values of the principal stresses is observed by approximately 10 times in the masonry walls of the building, along with a significant transfer of stress concentration to the reinforced concrete floors. For each mining sequence, a slower increase of stresses in buildings up to 70 m in length can be observed, followed by a doubling of stresses in the floor between the two levels and a less significant increase in the walls.
This phenomenon is generated by the fact that the bending rigidity of the brick walls is less important, which causes the stresses developed in the building due to the deformation of the foundation ground to be taken over by the two floors, especially by the floor that separates the two levels of the building.
As for the development of the principal stresses, depending on the extension of the panel operation, for all building lengths, these stresses follow the growth trends presented in the previous subchapter. This means that the main stresses grow more slowly in the ranges of Xp = 50–175 m and Xp = 325–400 m, and are more pronounced in the range of Xp = 175–325 m.
Analyzing the distribution of stresses in the structures of the masonry buildings, we remark that the principal stresses, in terms of absolute values, are detected in the floor that separates the two levels of the structure, in the areas above the windows and to a lesser degree in the corners of the foundations of the building (as opposed to reinforced concrete buildings).
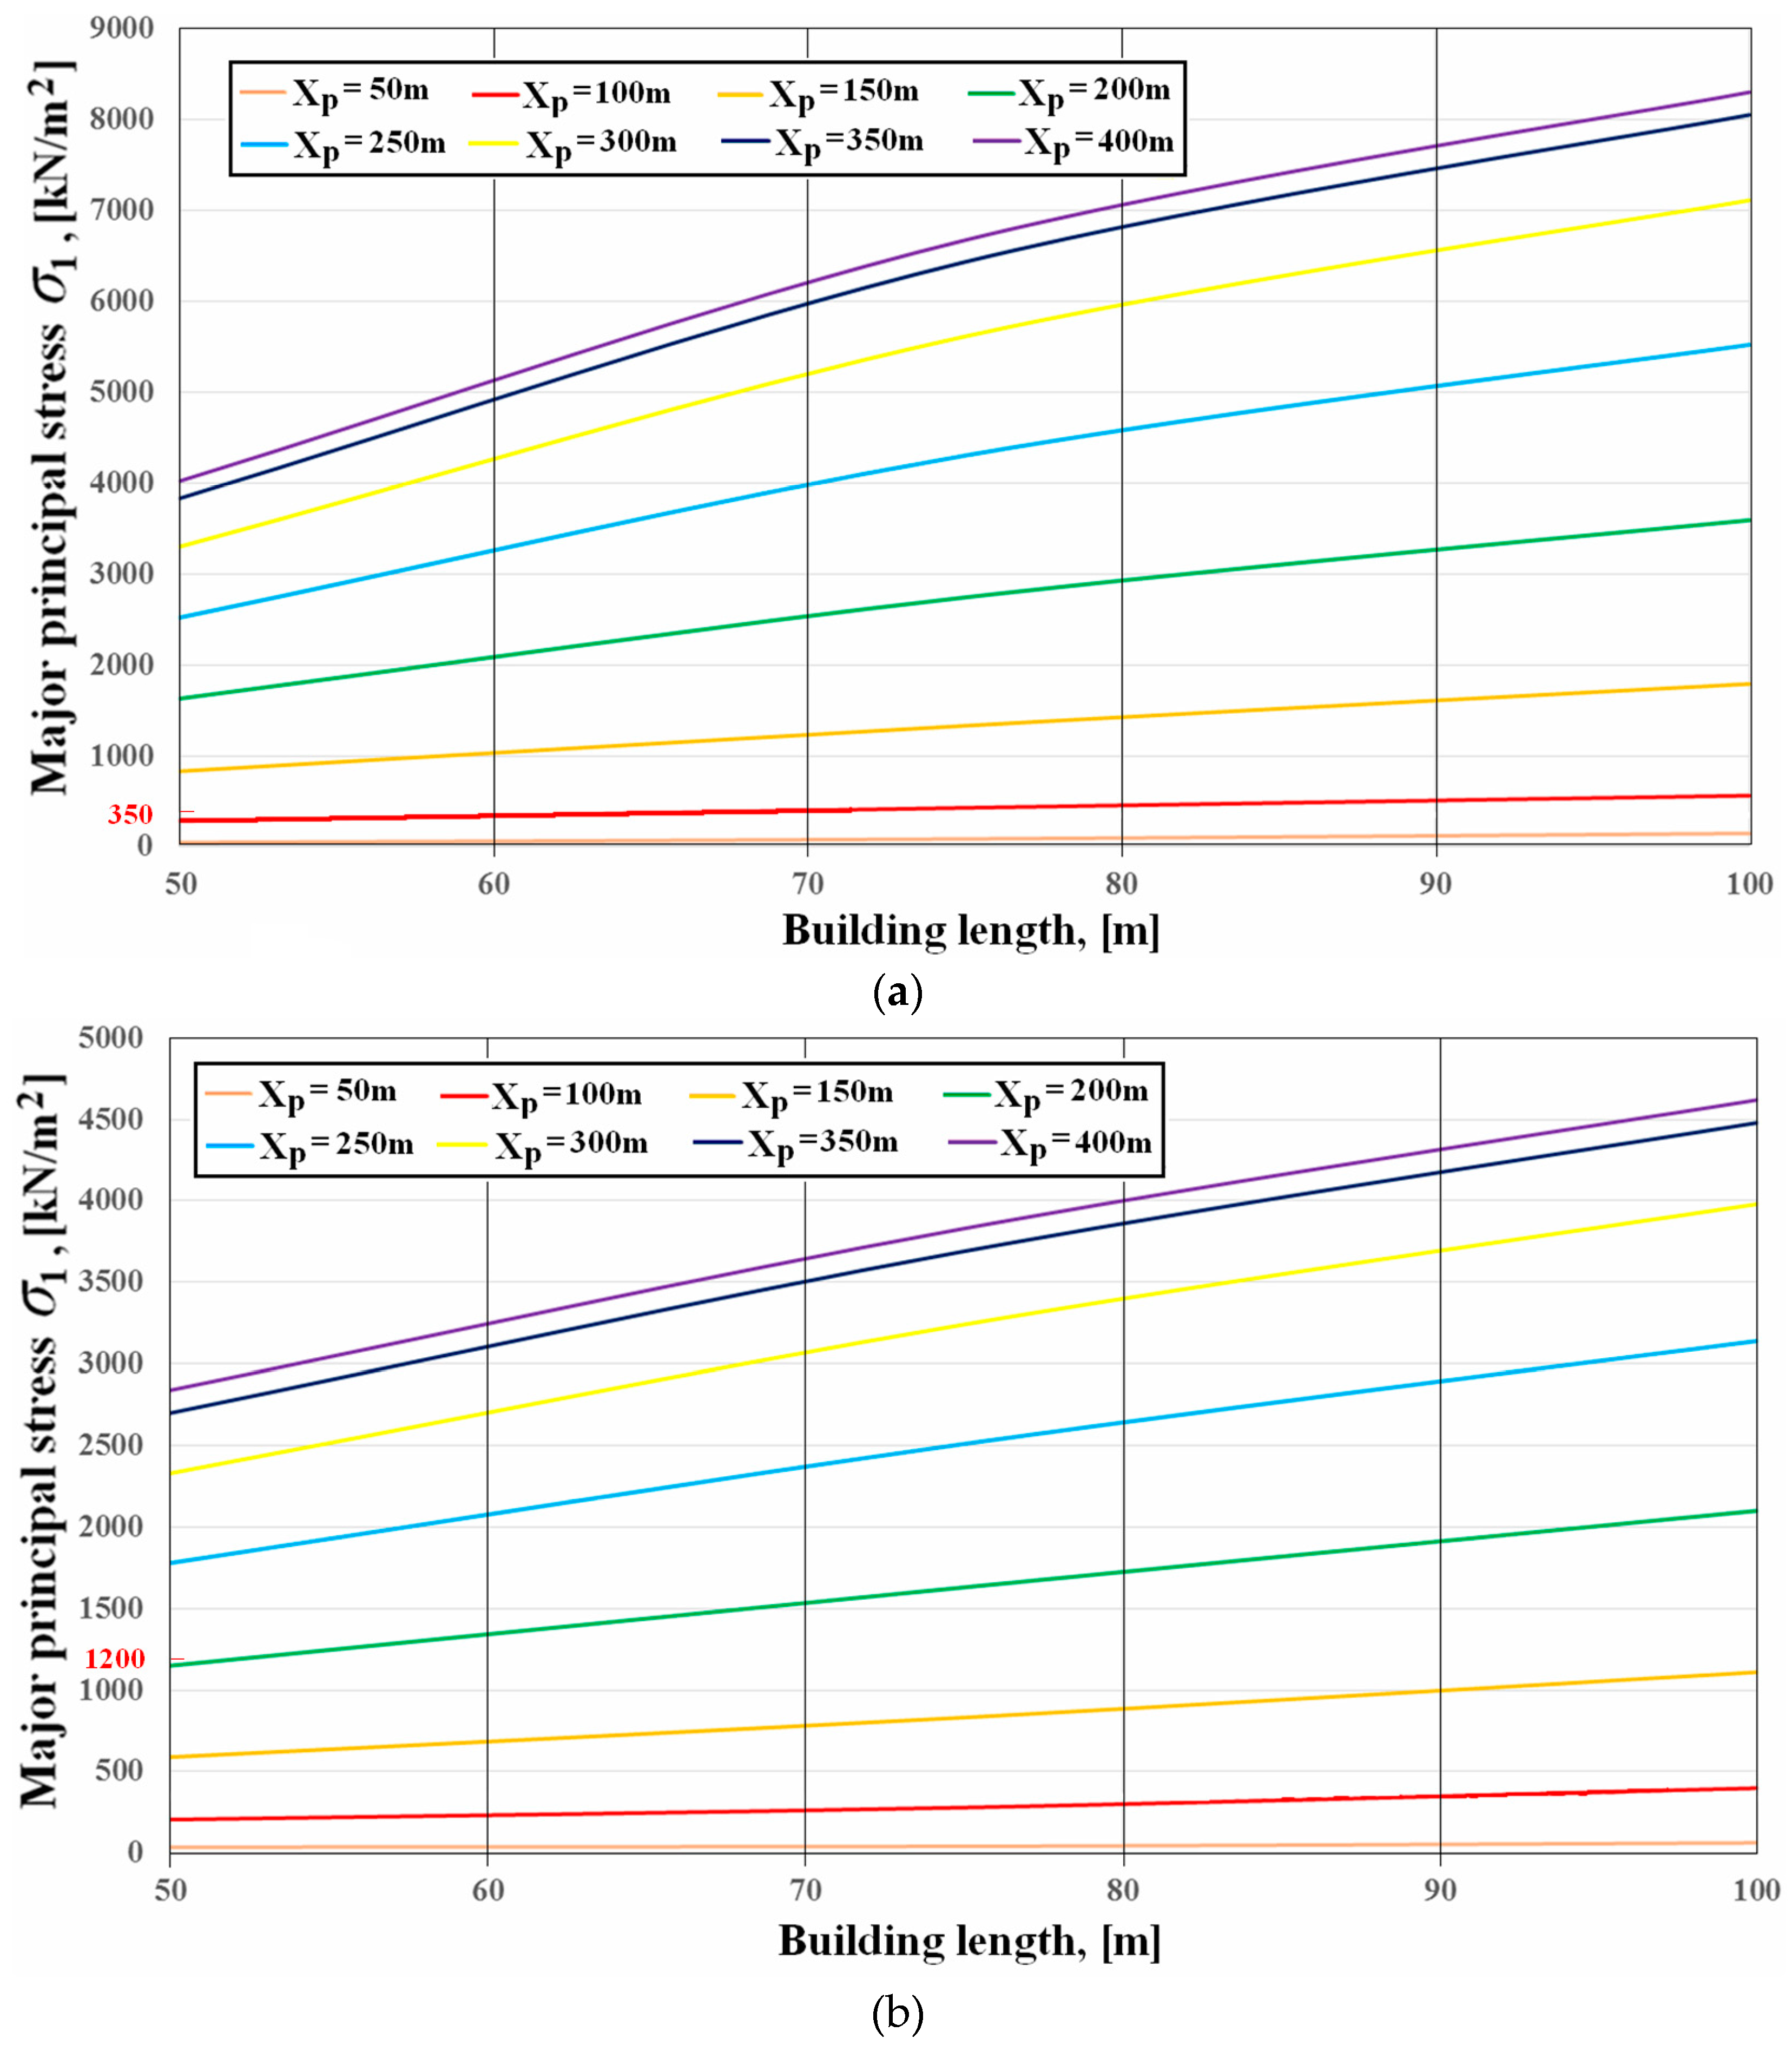
For brick wall buildings, major principal stresses
(
Figure 19) in their structures are up to three times smaller than those seen in concrete buildings. Additionally, we can remark that there are important differences between the values of major stresses that appeared in buildings of different lengths. In this case, stresses with the highest values appear in the case of masonry buildings measuring 100 m long.
The increase of stresses, both in floors and in masonry walls, is more accentuated for buildings measuring approximately 70–75 m in length, and slowly decreases above this value.
Additionally, one may notice that for the first mining sequences of the panel, the rate of increase of major and minor stresses depending on the increase of the length of the buildings is insignificant, increasing as the panel operation is extended.
It should be noted that the maximum values of major principal stresses reach the limit of tensile strength of the brick masonry for mined panels with lengths of over Xp = 150 m and for reinforced concrete floors above Xp = 200 m.
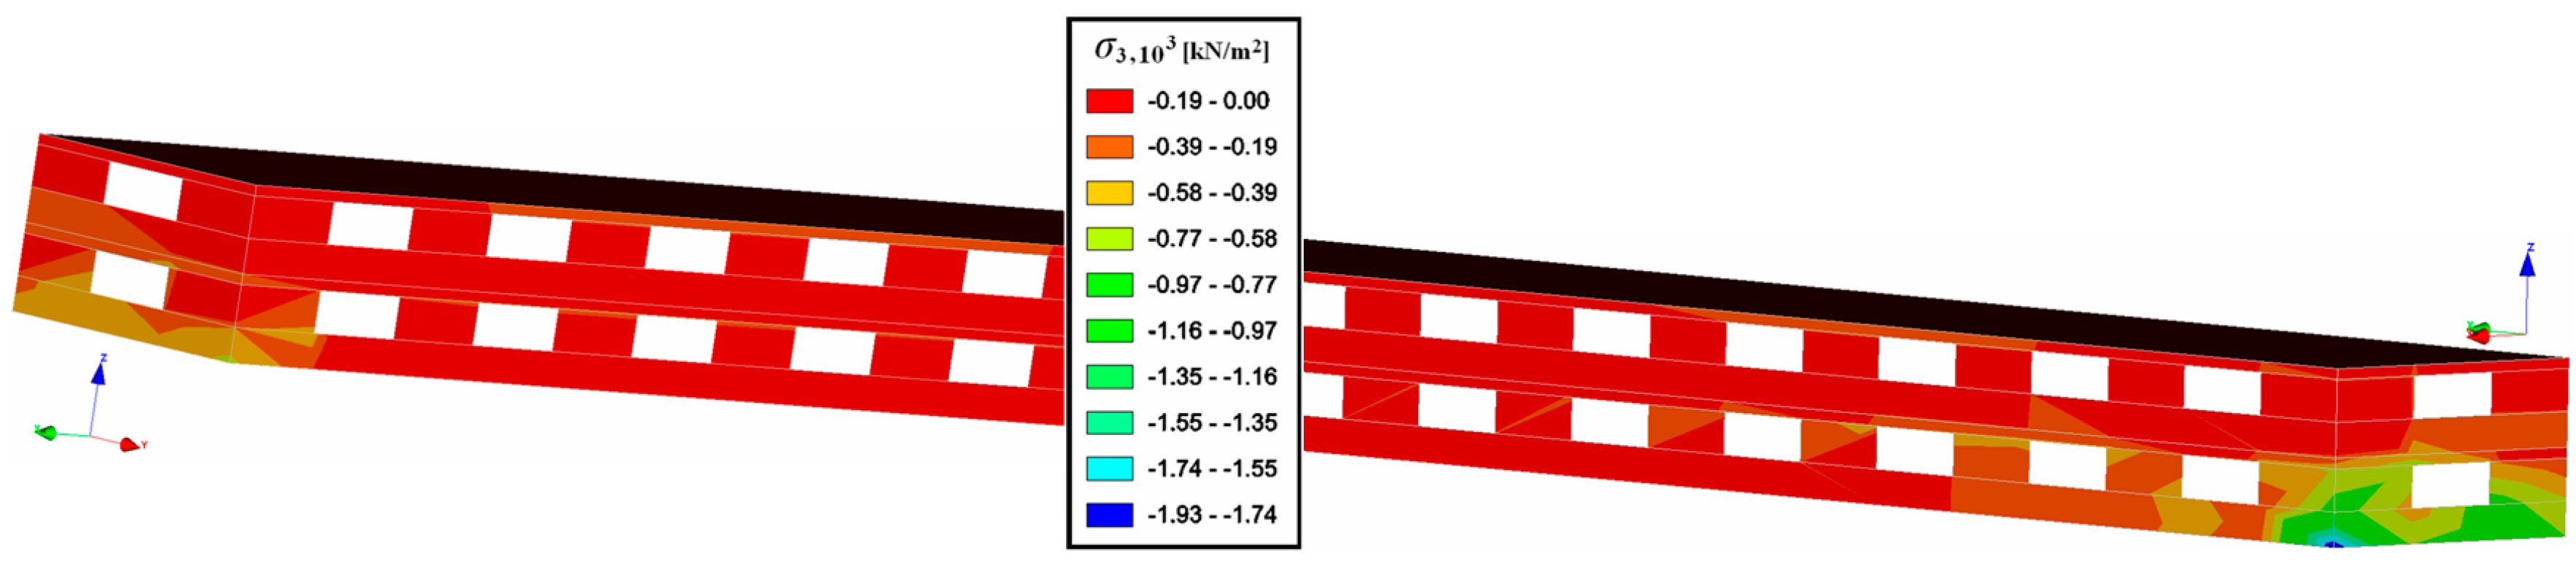
The distribution of stresses
in the structures of masonry buildings is different from that in concrete buildings. In the first case, the greatest stresses appear in the reinforced concrete floor between the two levels of the building, in the area above the windows at the ends of the building (
Figure 20).
As for the minor principal stresses
developed in the structures of masonry buildings (
Figure 21), as a result of underground mining there is immediately a much more marked increase in the walls in relation to major principal stresses over the value
Xp = 70–75 m, and a slower increase in reinforced concrete floors. Additionally, it can be seen that the failure of the compressive phenomenon in the brick walls occurs only when the mined panel exceeds
Xp = 350 m. As one can see in
Figure 21b, due to the stress redistribution in the structural elements of the buildings, regardless of their modelled length, the compressive failure of the reinforced concrete floors does not occur within the limits of the operation of a panel measuring 400 m in length.
At the beginning of the panel mining, as with the distribution of major stresses, the most important minor stresses, which are marked by a strong asymmetry towards the mined panel, appear on the floor between the two levels of the building, especially in the joints between the floor and the walls on the long sides of the building in the areas above the windows (
Figure 22). These stresses are redistributed to the walls as the panel mining expands and become symmetrically arranged along the building at the final exploitation of the panel.
4. Conclusions
The Jiu Valley mining basin is the most important coal basin in Romania, the exploitation of which began as early as the 19th century. Due to the coal seams having various configurations and complicated tectonics, with varying thicknesses and dips, over time numerous mining methods and technologies have been applied, including short, medium, and long wall faces along the entire thickness of the coal seam or divided into horizontal or inclined slices, all with roof control by integral caving of the surrounding rocks. Since 1996, for the mining of thick coal seams, the longwall mining method with top coal caving has been applied.
The practice of caving the surrounding rocks, due to the large mined height of the coal seams, led to the ground surface being affected. As such, the subsidence of the land appeared, ranging from several tens of meters for the thick coal seams mining to a few meters for other coal seams. Over time, the ground surface deformation has been monitored using topographic, photogrammetric, and aerial laser scanning methods.
Even if the main safety pillars were correctly designed for the main objectives on the surface or underground, there have been cases of accidental crossing of these borders that have led to damage to objects that should have been protected. Also, due to the important coal reserves totalling almost one billion tons that are immobilized in these pillars, their future exploitation is a problem.
The objective of this study is to analyze the behaviour and the state of stresses developed in the structures of the typical buildings in the Jiu Valley following the accidental or planned exploitation of the main safety pillars. In this respect, numerical modelling was used, utilizing the finite element method. The method simulated buildings with one, two, and three levels with a constant horizontal surface, and two-level buildings with constant width and variable length. The buildings were made from reinforced concrete or masonry walls under the influence of sequential underground mining of a panel with a longwall face, containing a coal seam located in geo-mining conditions specific to the Jiu Valley mines.
Following the analysis of the distribution of stresses in the structures of the modelled buildings, in comparison with the strength characteristics of the building materials, the following important conclusions were reached:
- (1)
The maximum values of the principal stresses developed in all the modelled buildings, depending on the extension of the mined panel, show greater increases in the range of Xp = 175–325 m and lower increases in the ranges of Xp = 50–175 m and Xp = 325–400 m;
- (2)
Regardless of the number of modelled levels and the extension of the mined panel, the stress concentration is limited to the first level and near the window frames;
- (3)
As the mining of the panel expands, the state of stresses in the building structure starts as an extremely asymmetric one (for Xp = 50 m), with the maximum stresses concentrated towards the gob at the beginning of the mining. It continues to balance gradually as the panel is mined by transferring the stresses concentration at the opposite end of the building into a perfectly symmetrical distribution when the panel is completely removed (for Xp = 400 m);
- (4)
In the case of buildings made entirely of precast, reinforced concrete panels, regardless of the length of the buildings taken into consideration for the finite element analysis or the position of the working coal face, the stresses are concentrated in the walls and are insignificant on the first floor above the first level of the building, due to the high bending rigidity of the walls. Also, the stresses increase almost linearly as the length of the building is also increased, reaching a maximum for the modelled length of 100 m and for the full exploitation of the panel (Xp = 400 m);
- (5)
Under the conditions of brick-walled buildings and reinforced concrete floors, stresses remain in the walls, but due to their reduced bending rigidity, a significant part of the stresses is redistributed on the floor above the bottom level of the building. As such, most major principal stresses in the walls are approximately 40% greater than on the floor, and minor stresses are approximately three times greater in masonry walls than in reinforced concrete floors. These grow slowly for concrete building with lengths ranging 70–75 m, and are then more accentuated after this length, regardless of the working coal face position.


