Article

Tsetse Invasion as an Emerging Threat to Socioecological Resilience of Pastoral Communities in Karamoja, Uganda

1
Training and Community Development, Regional Universities Forum for Capacity Building in Agriculture (RUFORUM), Wandegeya-Kampala P.O. Box 16811, Uganda
2
Department of Environmental Management, College of Agricultural and Environmental Sciences, Makerere University, Kampala-Uganda P.O. Box 7062, Uganda
3
Department of Biosecurity, Ecosystems and Veterinary Public Health, College of Veterinary Medicine, Animal Resources and Biosecurity, Makerere University, Kampala-Uganda P.O. Box 7062, Uganda
4
Department of Geomatics and Land Management, College of Engineering Design Art and Technology, Makerere University, Kampala-Uganda P.O. Box 7062, Uganda
*
Author to whom correspondence should be addressed.
Sustainability 2020, 12(4), 1599; https://doi.org/10.3390/su12041599
Submission received: 16 January 2020 / Revised: 14 February 2020 / Accepted: 15 February 2020 / Published: 20 February 2020
(This article belongs to the Section Social Ecology and Sustainability)

Abstract

:
Over 70% of Uganda is infested by the tsetse fly, which has negative effects on human and livestock health. From colonial to post-independent Uganda, the Government of Uganda has worked to eradicate the tsetse menace. Despite these efforts, recent veterinary reports from the Karamoja sub-region have indicated widespread tsetse invasion. This study investigated the potential impact of tsetse invasion on the socioecological resilience of pastoral communities in the Karamoja sub-region. Results indicated that tsetse invasion is spreading from north to south of Karamoja. The tsetse transmission route emerging from southern Karamoja is perceived to be a continuation of the tsetse belt from West Pokot, Kenya. Cases of livestock deaths, livestock abortions, decreased milk yields, restricted access to prime grazing lands, heightened human-wildlife conflicts and disruption on crop cultivation have been reported. A computed socioecological resilience index in the study area was positive but low. Owing to the transboundary characteristics of tsetse invasions and sources and the associated documented effects, an urgent, strategic and system-wide intervention should be undertaken to control the tsetse invasion in this sub-region.

1. Introduction

Trypanosomiasis transmitted by tsetse flies (genus Glossina) continues to constitute a major factor limiting rural development in vast areas of tropical Africa and affects 37 countries in sub-Saharan Africa (Figure 1). More than 10 million square kilometres of Africa, especially sub-Saharan Africa, are infested by tsetse [1]. Three types of tsetse flies are found in Africa: Palpalis in riverine habitats and Fusca in forests and isolated patches. In contrast, Morsitans is mainly found in savannahs dominated by woodlands and scattered thickets [2]. These haematophagous vectors are responsible for transmitting animal African trypanosomiasis (AAT) and human African trypanosomiasis (HAT), also known as livestock nagana and sleeping sickness, respectively [3].
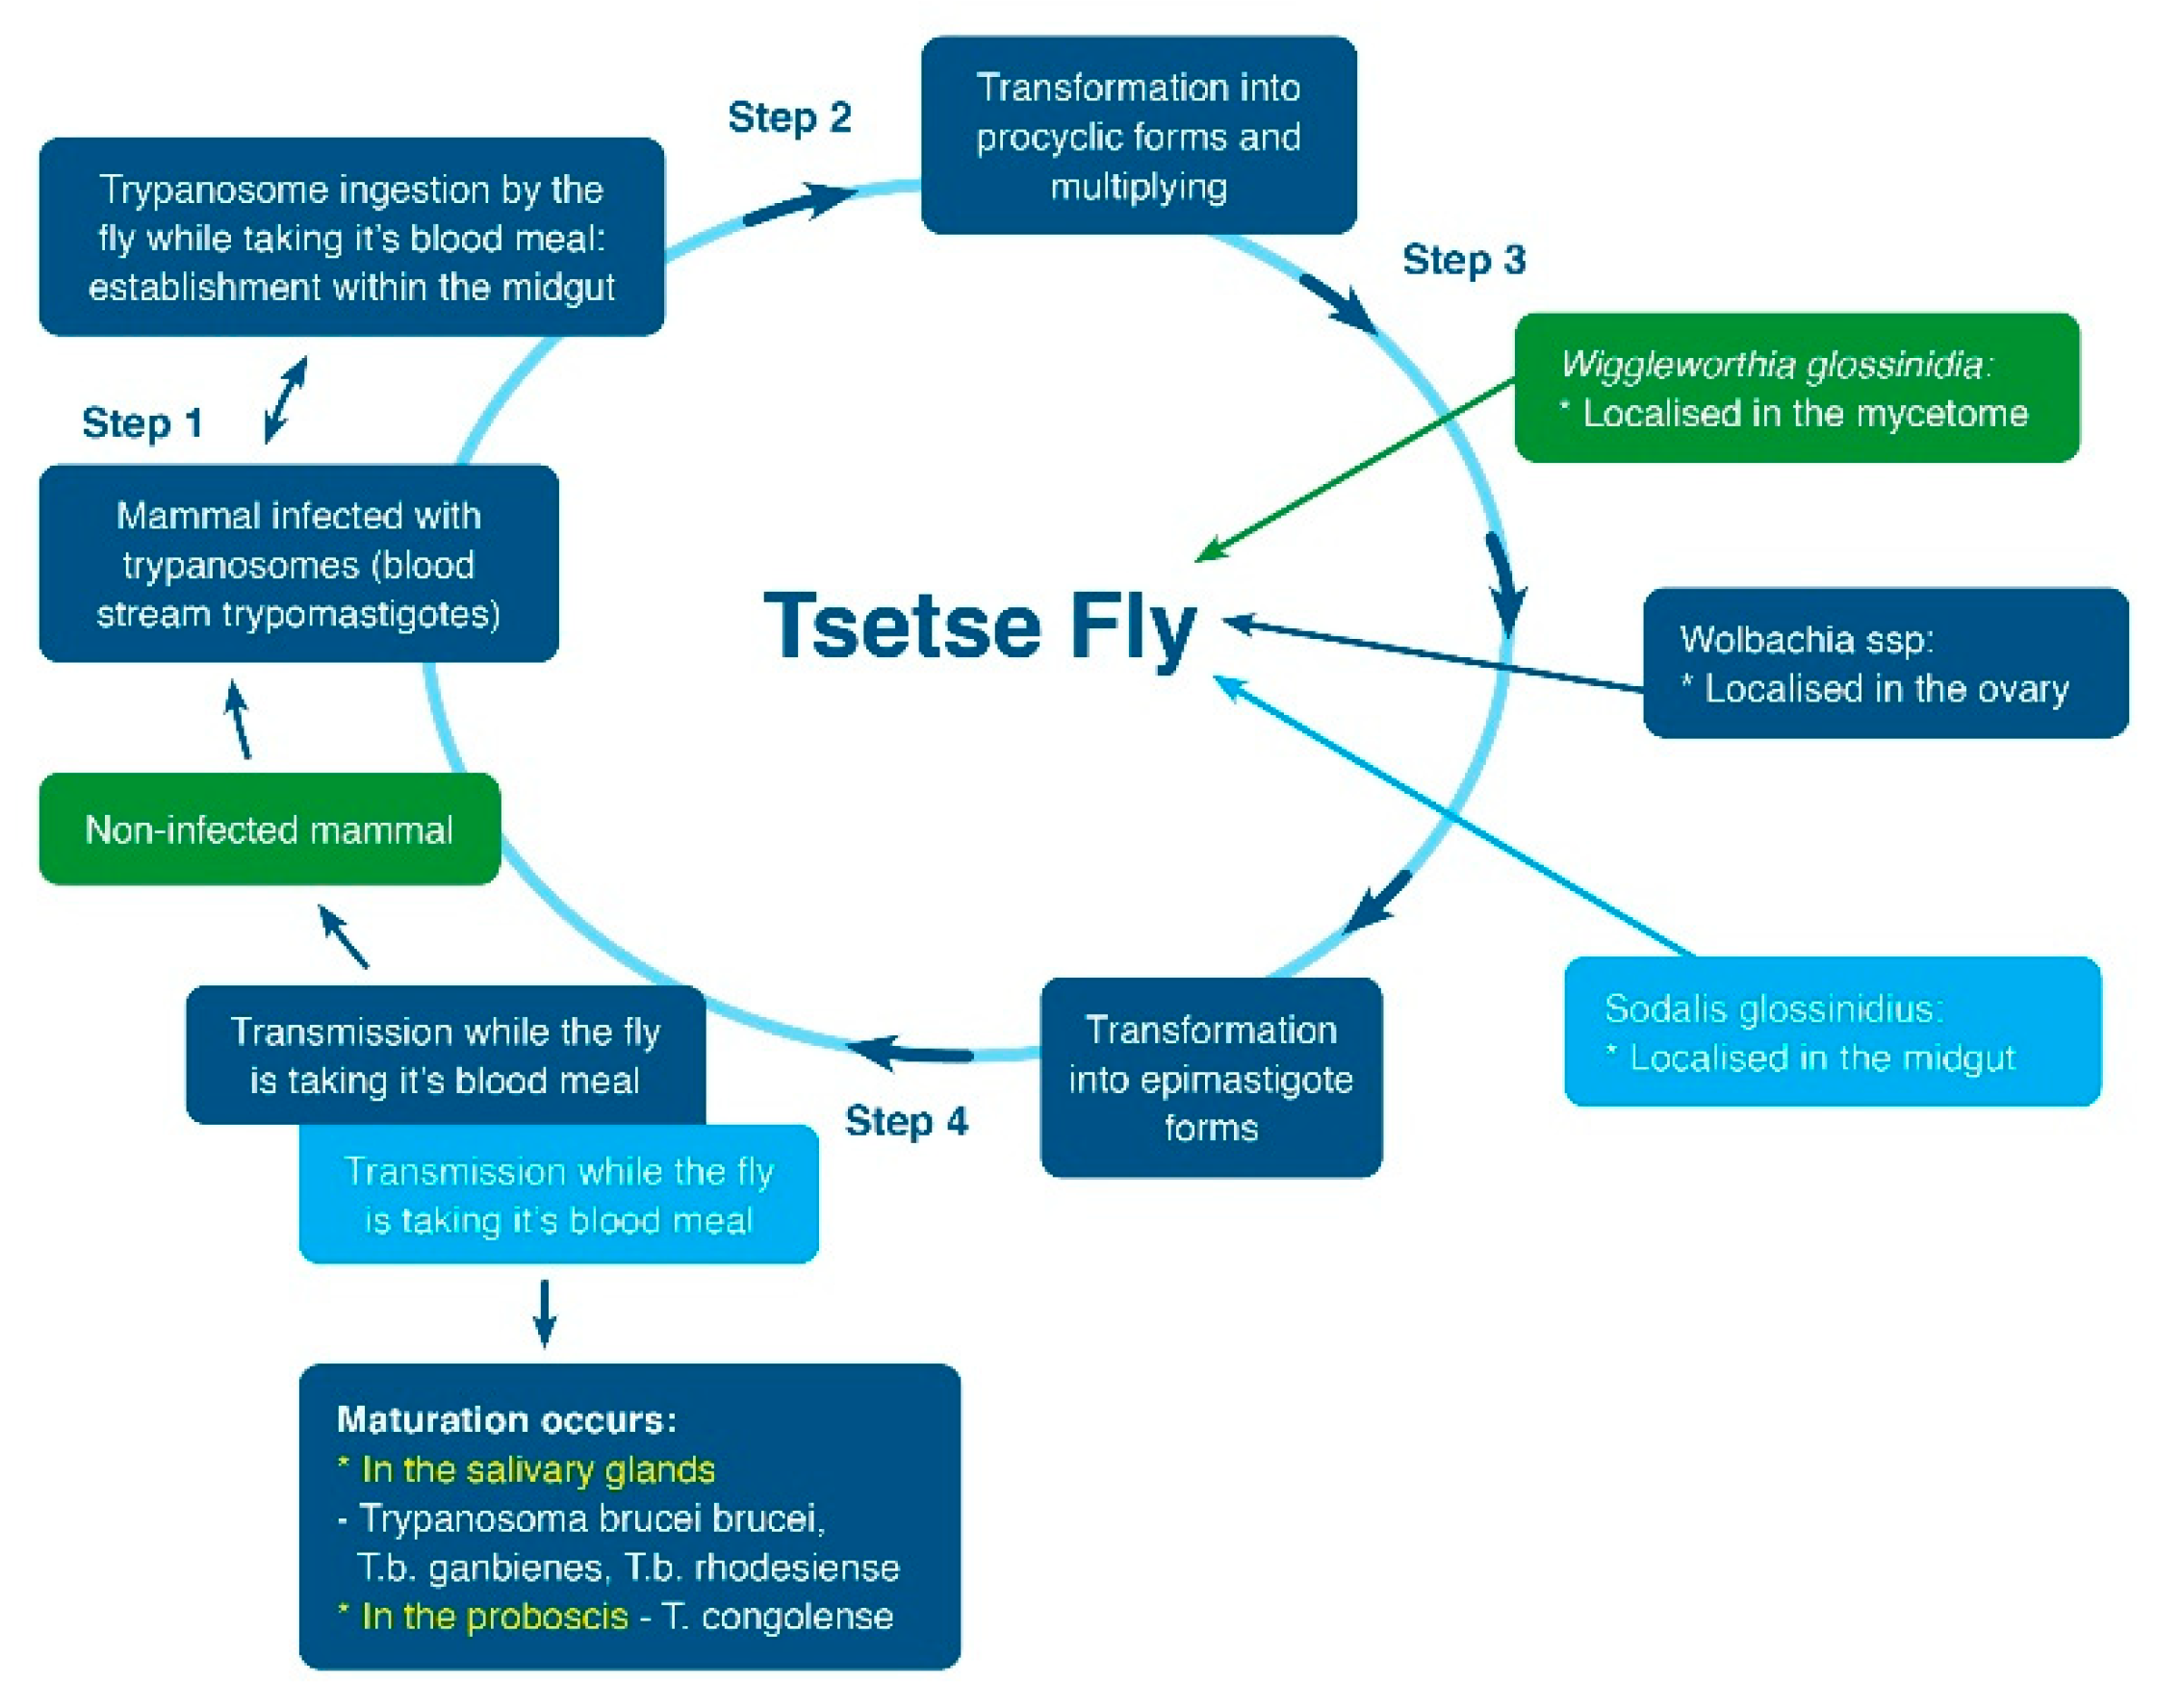
Both HAT and AAT are caused by flagellate protozoa transmitted by the tsetse [4]. The tsetse provides an ambient environment where the parasites complete their unique breeding life cycle (Figure 2). The flagellate protozoa infect a wide range of wild and domestic animals as well as humans in sub-Saharan Africa [5]. Infected livestock and humans present diverse clinical manifestations. For example, persons infected with sleeping sickness may experience multi-organ dysfunction, high-grade fever, dizziness and constipation [6,7]. In the case of one Polish tourist who experienced a tsetse fly bite in Queen Elizabeth National Park in Uganda, a high-grade fever was observed. The fever was preceded by chills, bleeding from the gums and oral mucosa. Haemorrhage at the sites of venepuncture, numerous ecchymoses, fine-spotted skin rashes and tachycardia were observed. In addition, hepatosplenomegaly, dehydration, jaundice, dyspnoea, hypoxaemia, generalised oedema and oliguria have been observed [6]. Additionally, livestock anaemia, lacrimation, enlarged lymph nodes, abortions and decreased fertility are signs associated with infected livestock. In other cases, infected livestock exhibited a loss of appetite, poor body condition and productivity and early mortality [8,9].
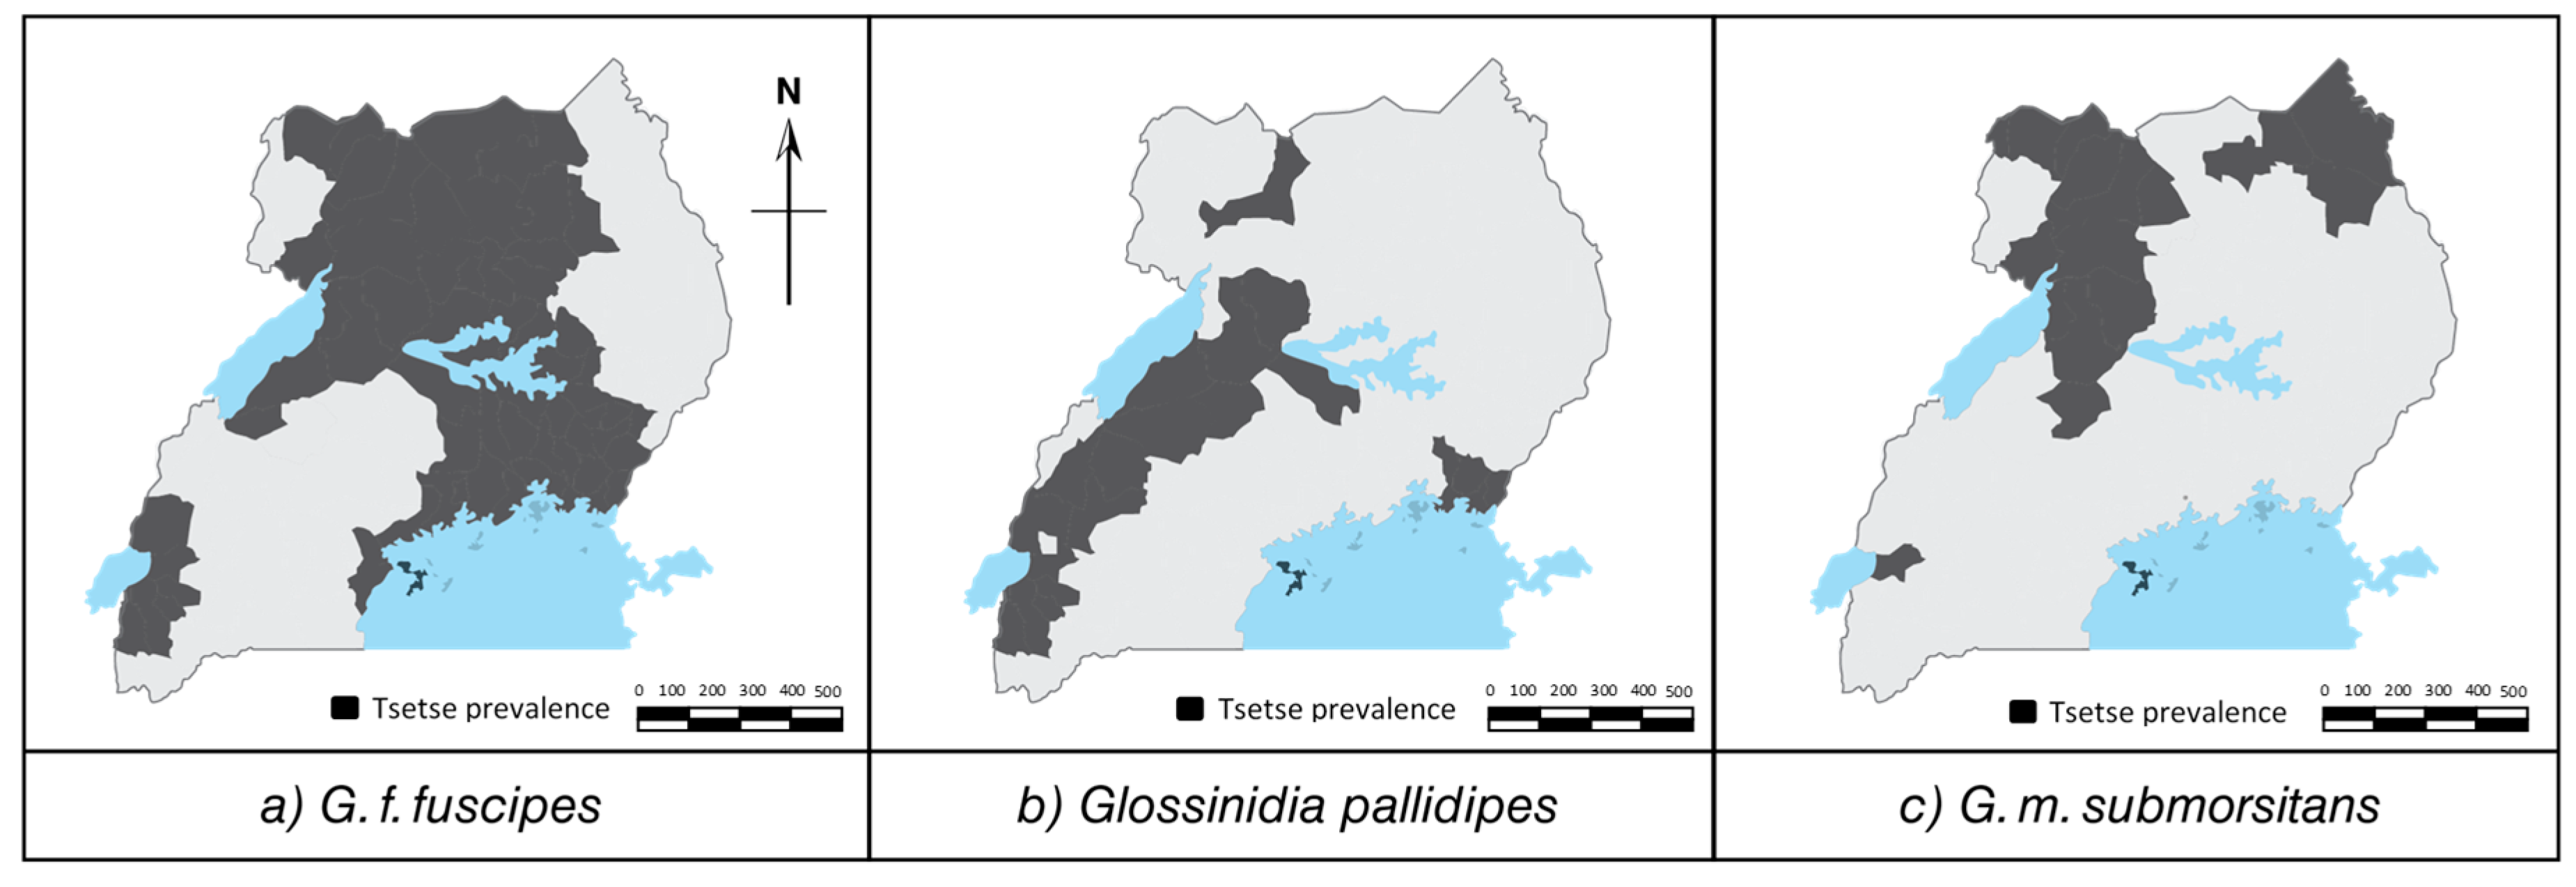
The tsetse phenomenon presents a high disease burden on the human population. This high incidence often leads to decreased agricultural productivity and livestock deaths [5]. Sleeping sickness is an important public health disease in sub-Saharan Africa. On the basis of the HAT related mortality, it has been ranked ninth out of 25 human infectious parasitic diseases in Africa [4]. Meanwhile, livestock nagana remains a major obstacle to livestock development in several sub-Saharan African countries. It causes the death of an estimated three million cattle annually. Furthermore, losses of approximately 26% in dairy yield and 50% of cattle herds in high potential agricultural areas are attributed to tsetse infestation. These losses lead to an estimated economic loss of US$4.5 billion annually in Africa [11,12]. In the case of Uganda, approximately 90% of sleeping sickness cases are caused by tsetse Glossina fuscipes fuscipes [3] and Glossina f. fuscipes and Glossina palidipes are known to occur in most of Uganda (Figure 3). The infection of livestock in cattle-rearing communities by nagana has led to a livestock crisis arising from livestock deaths and sale restrictions. This pattern has exacerbated food and nutrition insecurity [13,14]. Trypanosomiasis prevalence and resistance are predicted to become more pronounced and persistent in many African tsetse belts, signifying an aggravation of the phenomenon [15]. These patterns are attributed to changes in land use and cover as well as climate variability and change [16,17]. Evidence from within Uganda show treatment failure rates are as high as 30% in northern Uganda [18].
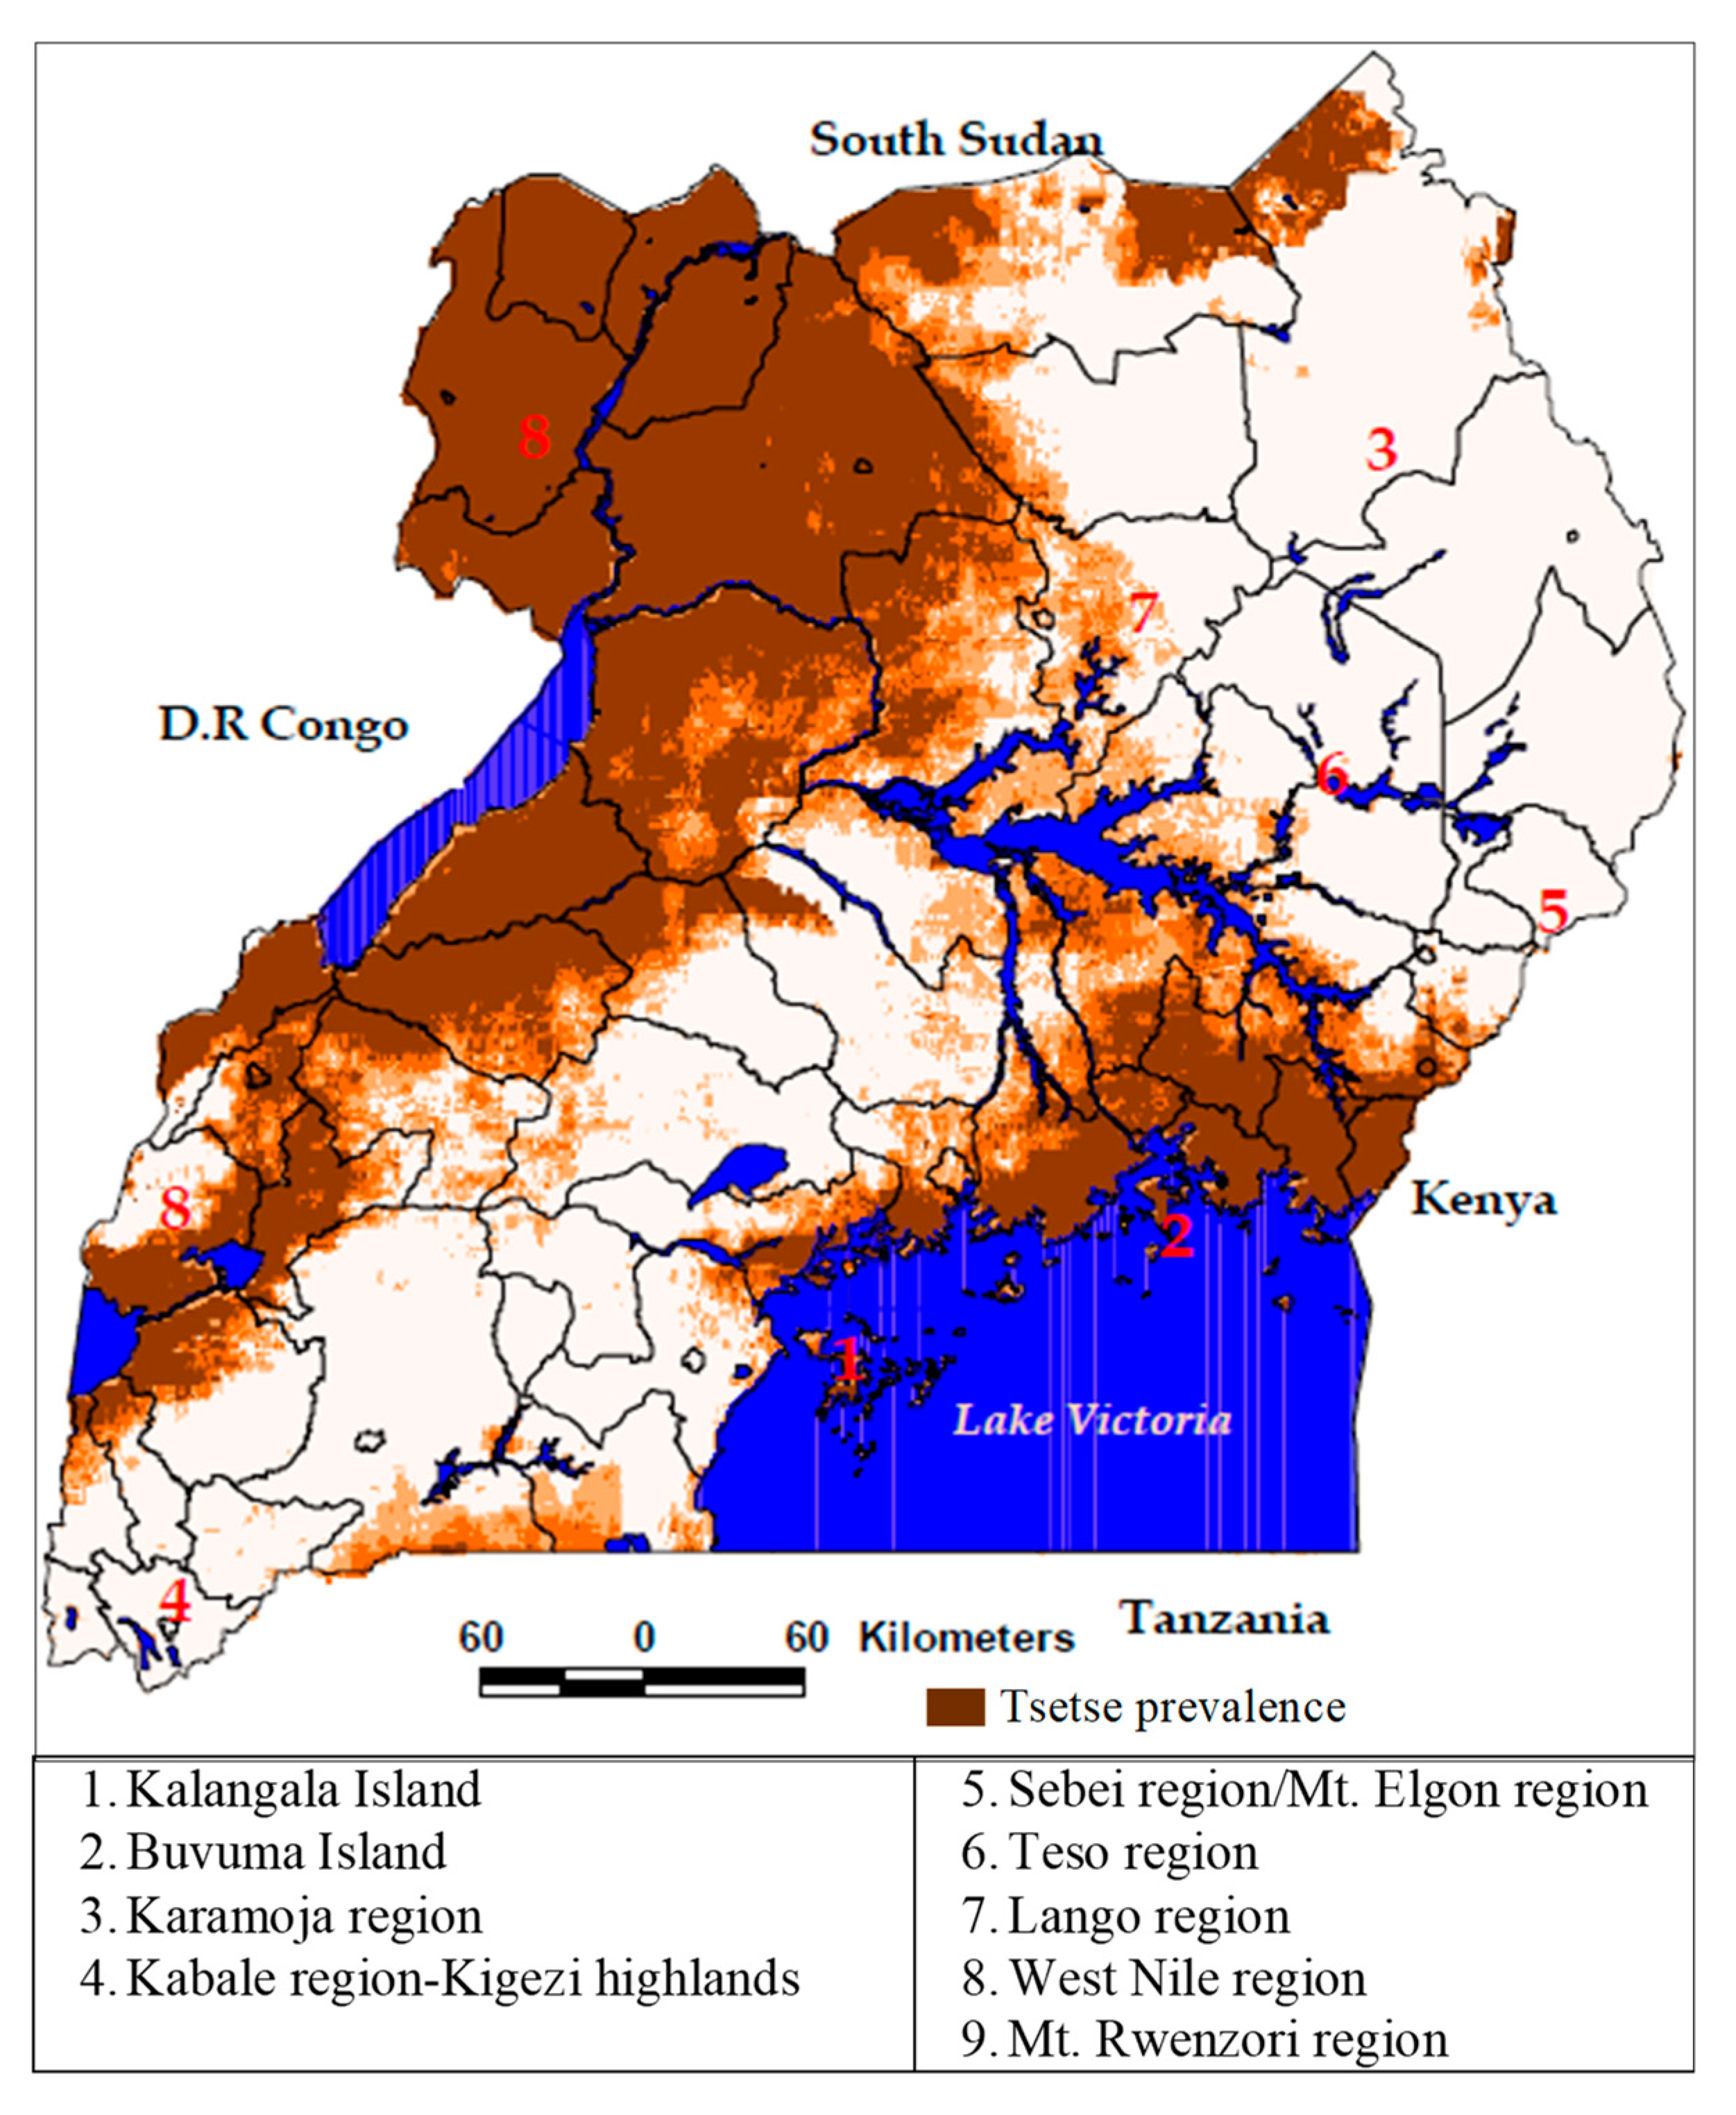
Over 70% (140,000 km2) of Uganda’s land area has been invaded by tsetse flies, but with varying levels of prevalence [19]. Uganda has approximately eleven tsetse fly subspecies. However, two species, Glossina f. fuscipes and Glossina palidipes, have received significant verification and documentation (Figure 3). G. f. fuscipes is the most abundant and widespread tsetse species and is found in approximately 70% of the country’s total infested area. Uganda is the only country in the region that has endemic foci of Trypanosoma brucei rhodesiense and T. b. gambiense [20]. Tsetse studies in Uganda have shown that the country has had three major epidemics of sleeping sickness since the 1890s (Figure 4). Over the years, the geographical extent of tsetse prevalence and trypanosomosis in Uganda has evolved. It has expanded from the traditional concentration in the Buganda sub-region (1905–1920) to the Busoga, south-eastern and mid-eastern parts of the Teso sub-region and the northern and West Nile areas of Uganda [3,21,22].
Studies in parts of Kenya and Uganda have revealed that climate, knowledge of tsetse and their control methods, culture, farming practices and demographic factors have a significant influence on its prevalence [23,24]. The occurrence belt observed in eastern and mid-eastern Uganda now appears to be progressing towards the Karamoja sub-region [19,22,25]. A spike in the reports of tsetse prevalence in the Karamoja sub-region has been reported, particularly in the districts of Kaabong and Kotido. In these areas, the areas that are most affected include Sidok, Lolelia, Kapedo and Kathile. This outbreak in tsetse represents a possible invasion after decades of no reports of new species spread after the eradication campaigns of the 1960s [26]. Despite these observations, the extent to which tsetse invasion has impacted the socioecological resilience of pastoral communities in Karamoja remains ambiguous. The socioecological resilience of ecosystems depends on its ability to absorb change and disturbance, without shifting to a new regime, governed by a different set of processes and structures. In this case, resilience is the system’s ability to resist transforming into a new system state [27]. Often, transformations and the associated threat of additional transformations have critical implications for both human well-being and resource management [28].
Successful vector control requires sound coordination of the on ground measures that are founded on detailed knowledge of the vector’s distribution, movement patterns, connectivity across socioecological systems. This approach requires a sound understanding of the spatial dynamics of human and animal trypanosomiasis, connectivity across the landscape and good coordination ability [3,29]. A sub-regional study in eastern and southern Africa, ref. [30] opined that changes in land-use patterns and climate affected fly abundance and distribution. Furthermore, recent distribution patterns have become more confined to protected areas such as game parks and reserves. It has also been noted that vector distribution may occur in limited biotopes, such as water points and associated areas frequented by mammals. Depending on hydrographic network variations, differences in distribution could exist. For example, a forest region’s vector distribution could be uniquely different from that of a savannah [31]. In this regard, the identification of distributional patterns is critical for the execution of control measures [3] and for determining the challenge index that reflects tsetse abundance and infection rates in an area [32]. This identification is particularly important in areas that are experiencing recurrent and sporadic tsetse outbreaks, e.g., in the traditional endemic areas of south-eastern Uganda and the previously unaffected areas in northern Uganda. In these areas, HAT and AAT remain a major health threat to both humans and livestock [5,33].
Vectors and vector-borne disease dynamics continue to change with changes in land use because they affect host-parasite dynamics at the landscape level. These dramatic changes have subsequently led to a loss of resilience (social and ecological) that has traditionally underpinned the adaptive capacity within dryland environments and societies [17,34]. This effect arises because the socioecological system connections within the drylands include the intricate interactions among the environment, vectors, their relationships with humans and the transmission of bacteria, viruses or protozoa [35,36]. Consequently, numerous studies on tsetse distribution, prevalence and trypanosome infection risk have been conducted [3,30]. However, there is a paucity of information on the linkage between tsetse invasion and the socioecological resilience of communities. In this study, we assessed the potential impact of tsetse invasion on the socioecological resilience of pastoral communities in the Karamoja sub-region. This approach was taken because tsetse distribution and prevalence represent i) a socioecological challenge that requires interdisciplinary perspectives for it to be addressed and ii) have the potential to cause changes in the areas where the species occurs, including transformations of the socioecological systems in response to induced perturbations.

2. The Study Area

The Karamoja sub-region is located between latitudes 2°30’N and 4°15’N and longitudes 33°30’E and 34°35’E in north-eastern Uganda (Figure 5). Rainfall in the sub-region is highly variable with intermittent drought episodes. Droughts in the sub-region have been recorded since the 1920s and have debilitating effects, including severe livestock mortality [37]. The region’s temperatures are relatively high with high evapotranspiration levels. Karamoja is mostly covered by open savannah grasslands, woodlands, thickets and shrublands [38]. The vegetation in Karamoja consists of Acacia–Combretum–Terminalia species associations, with a grass layer of Hyparrhenia, Setaria, Themeda, Chrysopogon and Sporobolus spp. In this sub-region, five land cover classes have been identified: subsistence farmlands, woodlands, grasslands, thickets and shrublands and bushlands. An increased emergence of bushlands, especially in northern and southern Karamoja, has been recorded [38].
Livestock is an important mainstay of the Karamoja sub-region. The 2008 national livestock census estimated livestock populations in the sub-region as follows: 2,253,960 cattle, 2,025,293 goats, 1,685,500 sheep, 960 donkeys and 32,870 camels. Cattle are traditionally the most important livestock and are a source of wealth and status. However, cattle ownership and trade have declined in recent years due to disease, raiding and the transition to cropping. On average, 44% of families in Karamoja own some livestock [39]. The Uganda National Household Census of 2014 estimated the total population of the Karamoja sub-region to be close to one million people, with one of the highest population growth rates (Amudat 4.3%; Kotido 3.3%; Nakapiripirit 4.6%) in Uganda [40]. The sub-region is a major biodiversity conservation area, with 12% and 41% of the land area dedicated to forest reserves and wildlife conservation areas, respectively [41]. These areas are also important migratory zones for wild mammals, especially buffalos and elephants. These large mammals migrate southwards from Kidepo Valley National Park to other rangelands in central and southern Karamoja. The seasonal movements of these wildlife species have been attributed to influence tsetse distribution in the sub-region.

3. Research Methodology and Methods

3.1. Tsetse Entomological Survey

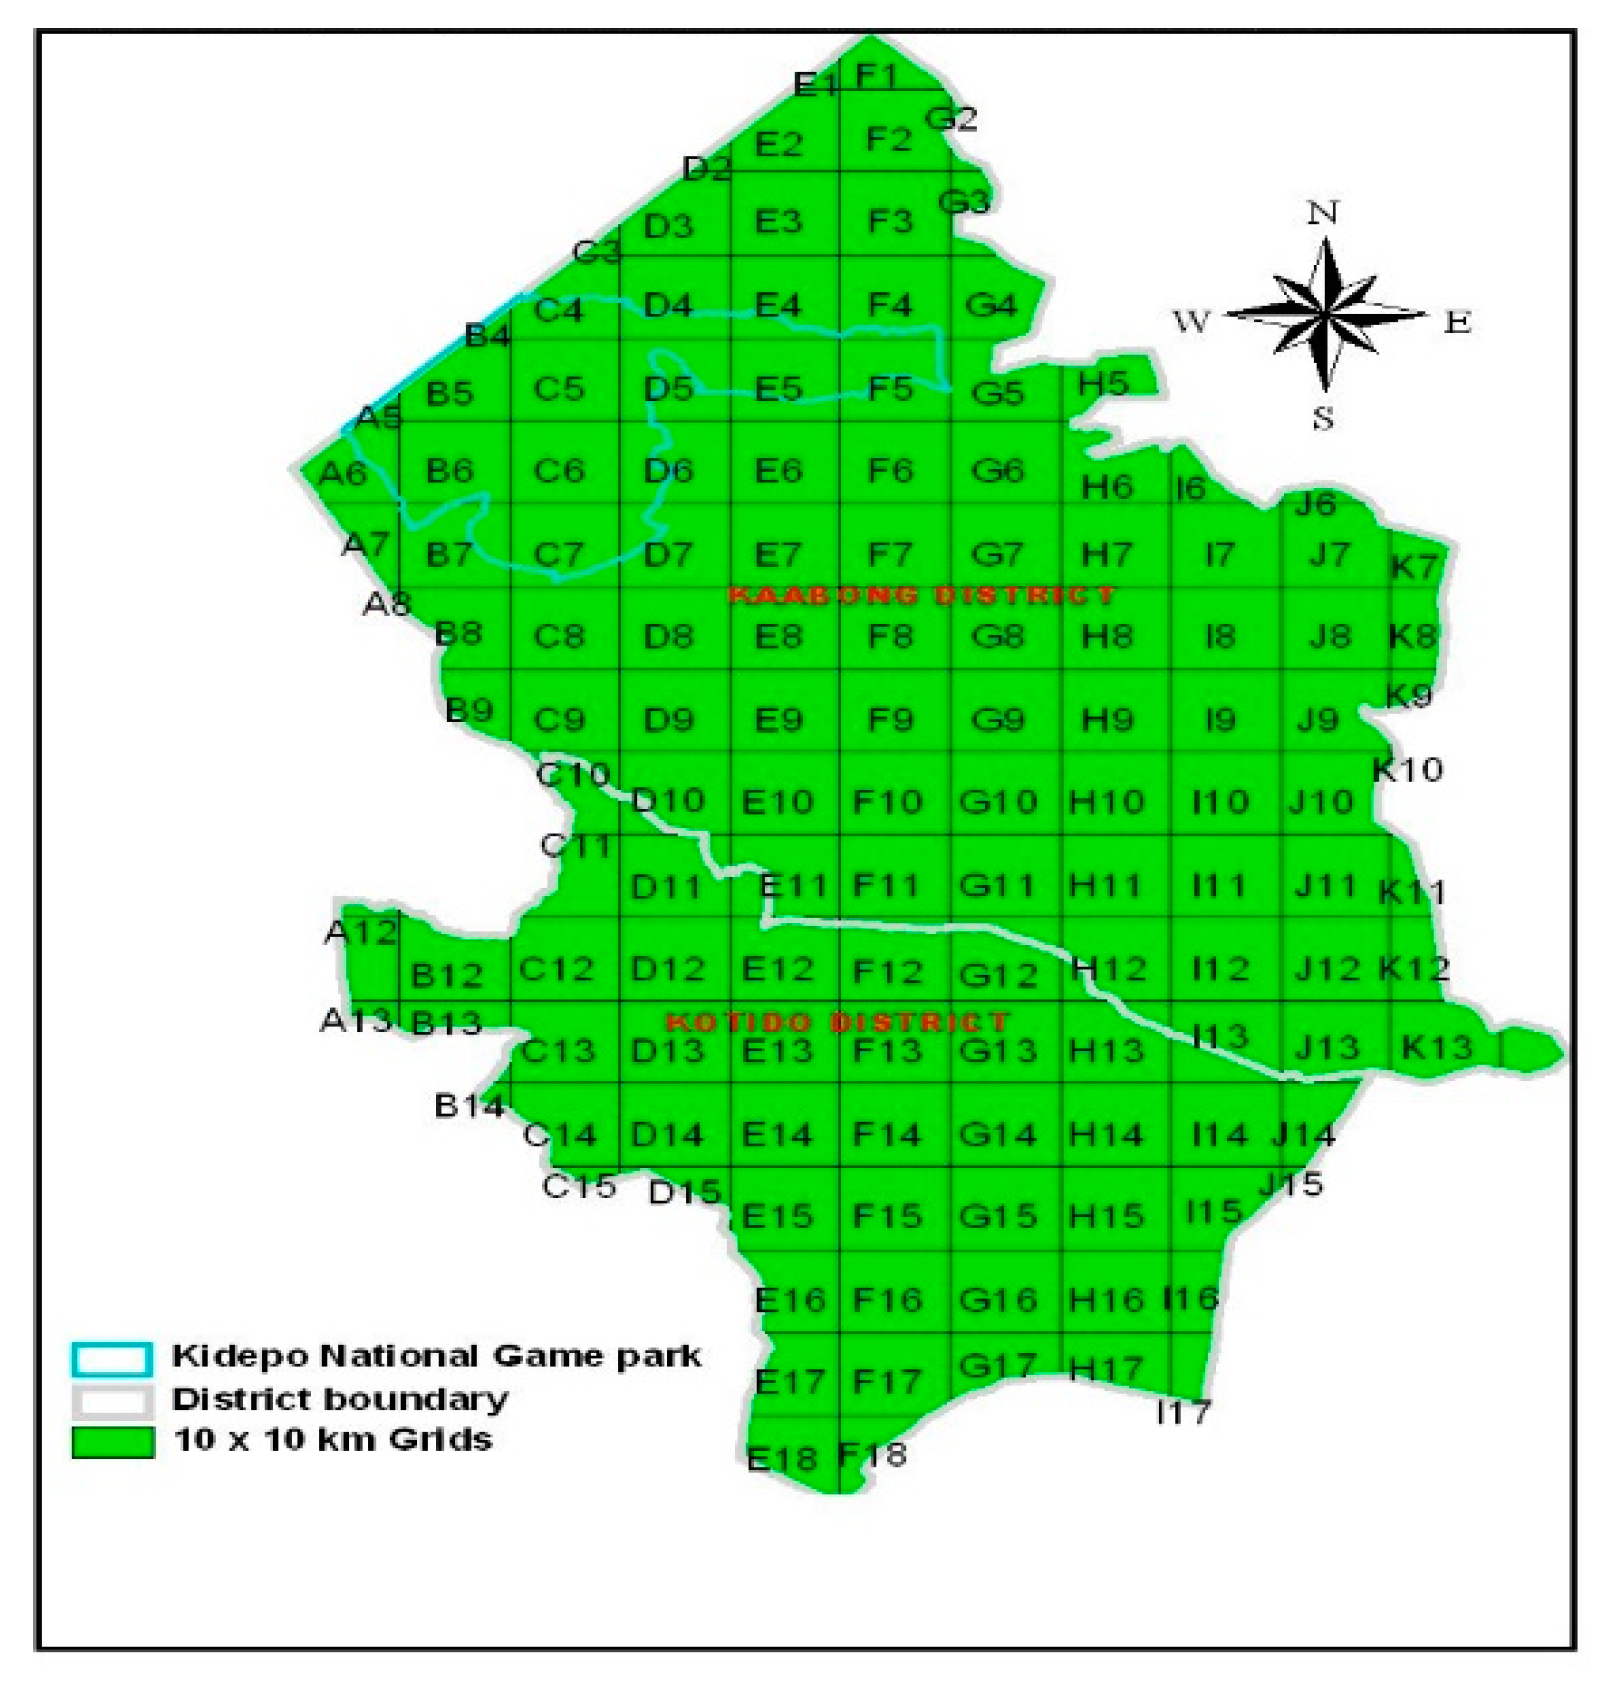
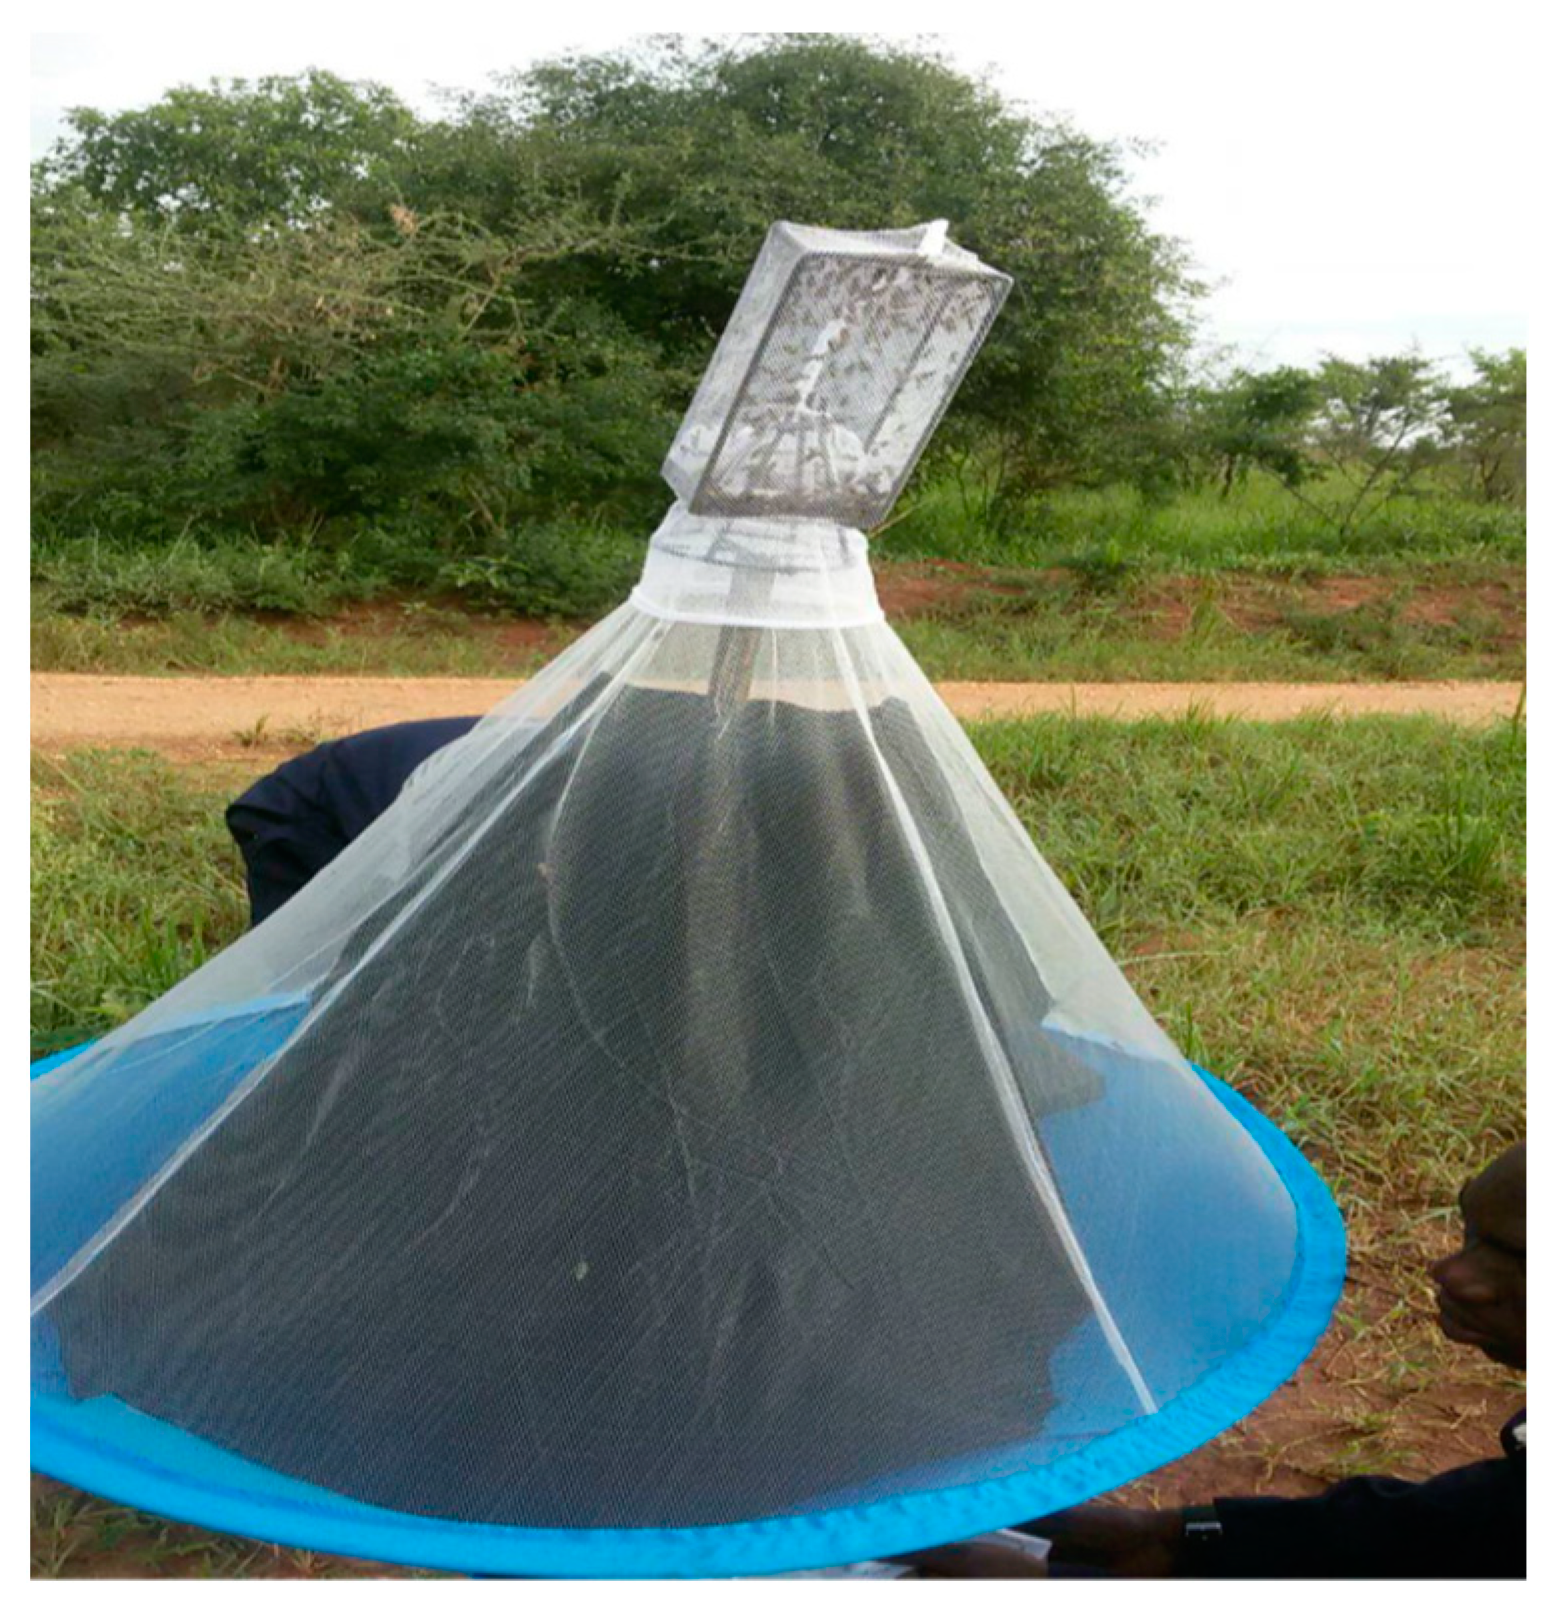
A tsetse survey in the month of June-July 2016, was undertaken to provide baseline information on the Glossina morsitans distribution in northern Karamoja (Kotido and Kaabong districts). The two districts were selected because invasion reports by the District Veterinary Officers in the sub-region indicated that the two districts were most affected. Ten by ten kilometre (10 × 10 km) grids were overlain in the districts of Kaabong and Kotido. The grids were used to ensure unbiased sampling during the tsetse survey and survey team assignment. Using the grids as operational units, five teams were allocated to the survey grids, and each grid had a unique identifier code as shown (Figure 6) for ease of georeferencing and geotagging. Each team was led by an entomologist and field assistants. Sampling within the grids was based on the heterogeneity of habitats. Biconical tsetse traps were used in the survey (Figure 7). The traps were odour-baited and set at a height of 30 cm above the ground. A total of 444 georeferenced traps were established. The trapping covered all the sub-counties in the study sites. However, trapping coverage depended on the probability of registering a catch as directed by local guides. Trapping at each site lasted 72 h in accordance with the established protocol [42]. Collections were made at the end of the 72-h period. At each collection, the parameters recorded in the predesigned entomological survey sheet included the trap code, eastings (X), northings (Y), elevation (Z), vegetation type at the trap site, start date and time, end date and time, species trapped, number of females or males and flies of unidentified sex and number of other biting insects. Caught tsetse flies were identified to the species level using the Food and Agriculture Organisation (FAO of the United Nations Training Manual for Tsetse Control Personnel [43]. Fly trap density (FTD), a measure of tsetse prevalence, was obtained by dividing the total tsetse catch per trap by the number of three trap days (72 h).

3.2. Participatory Assessment of Tsetse Prevalence in Karamoja

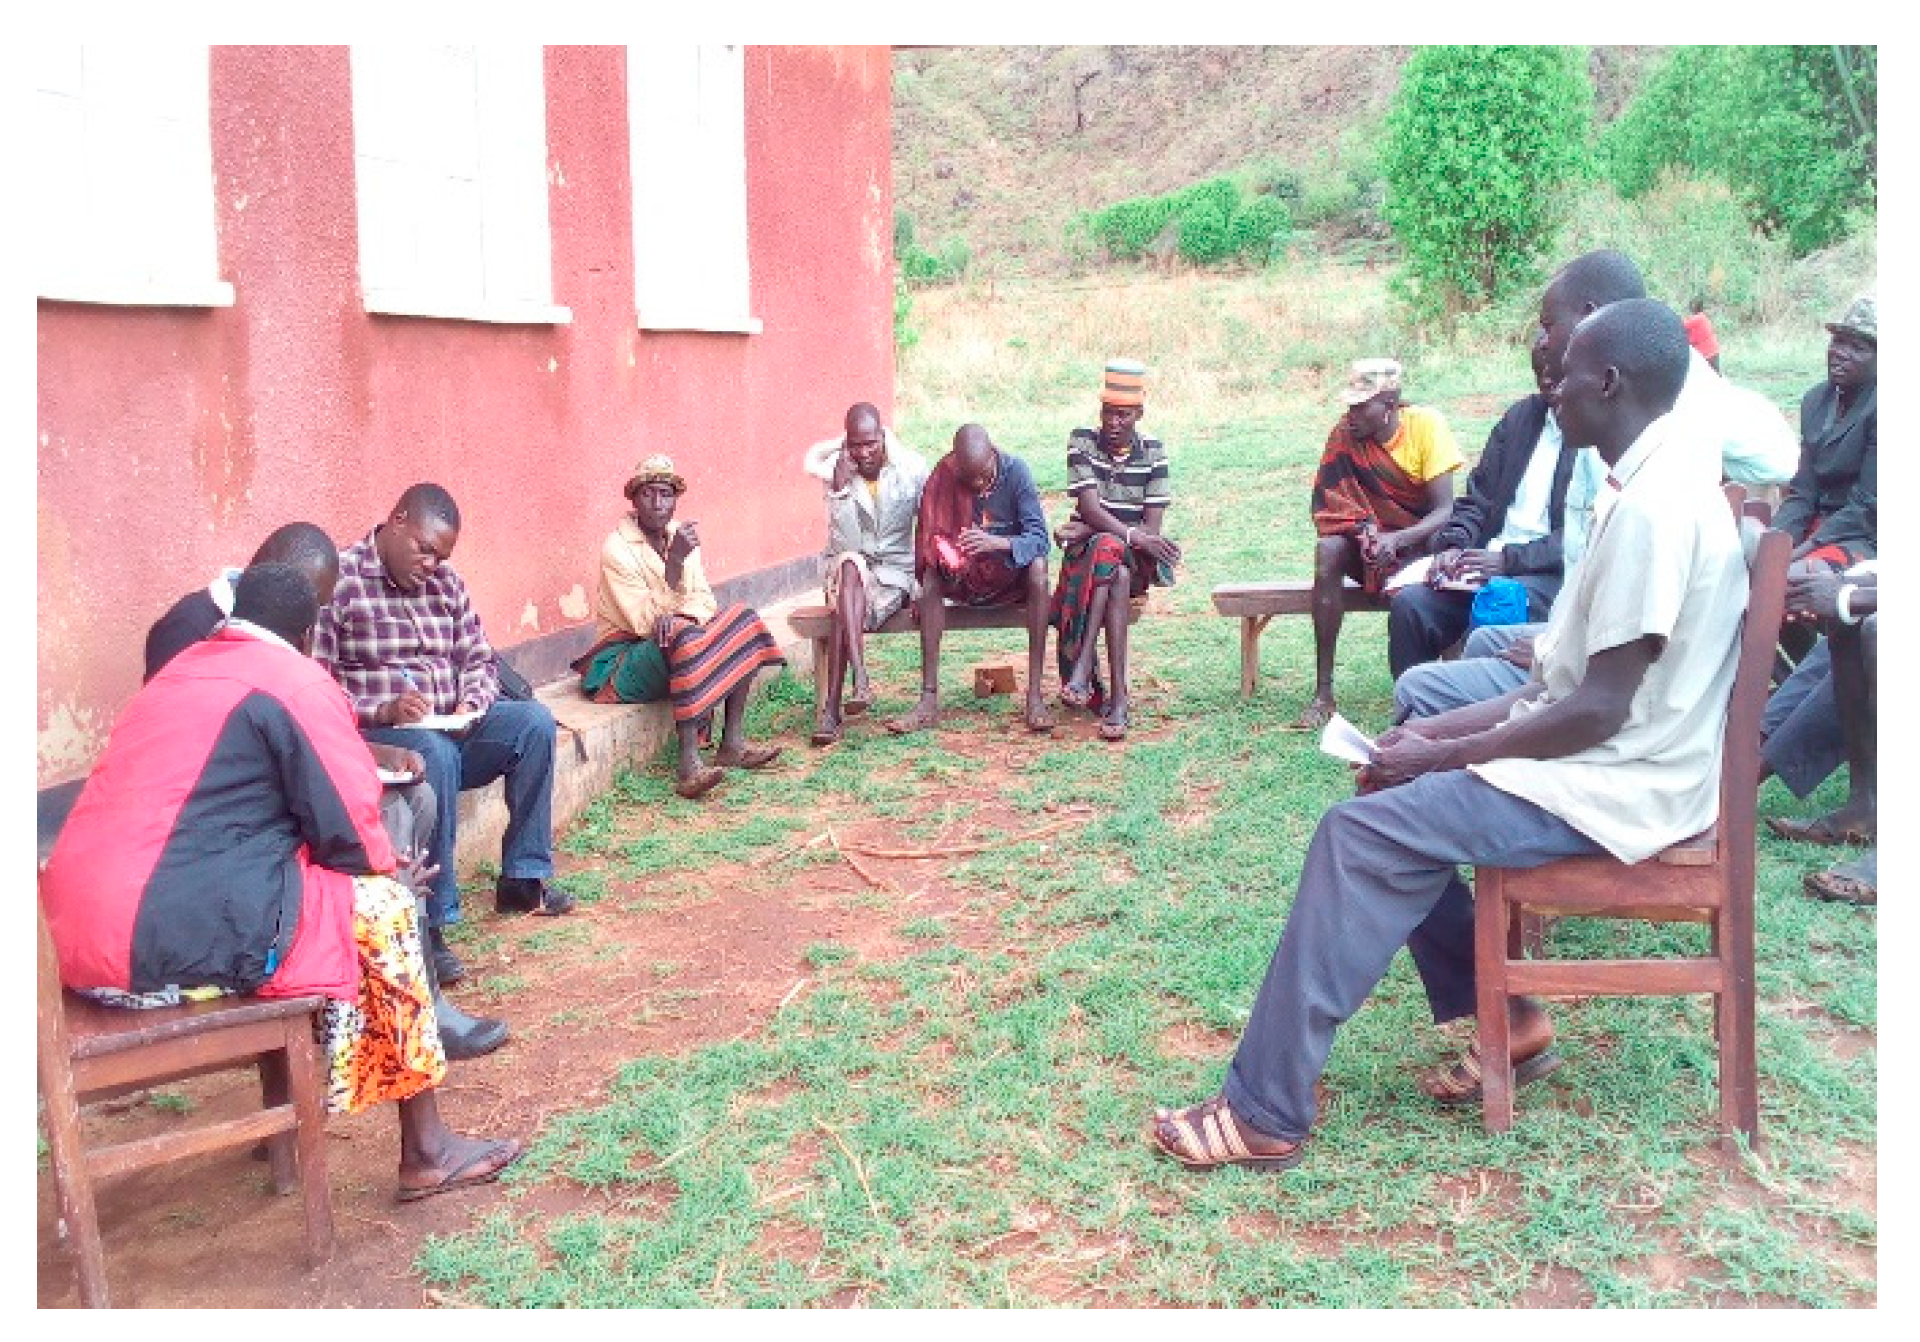
Participatory assessment involving the use of focus group discussions (FGDs) and key informant interviews was undertaken in five (Kaabong, Kotido, Nakapiripirit, Amudat and Napak) of the seven districts in the Karamoja sub-region. The FGDs were conducted in Sidok (Figure 8), Lolelia, Loyoro, Usake (Kaabong district), Rengen (Kotido district), Lorengdwat (Nakapiripirit) and Karita (Amudat district). Additionally, key informants were interviewed from the Amudat, Napak, Moroto, Nakapiripirit, Kotido and Kaabong districts. Though considered a low-risk location, Usake was included because it is a major grazing area in the dry season. It is also a relatively high-altitude area and a cattle trading corridor with South Sudan Turkana (Kenya). Furthermore, it is a key exit route for cattle raided by the Turkana entering Kenya and Toposa of South Sudan (Figure 9). Participants in the FGDs and the key informant interviewees were asked to deliberate on the historical patterns of tsetse in the sub-region. They had to relate these trends to key political events in the sub-region and in Uganda. This approach was meant to enable the research team to better position the event to relative historical time. Participants also provided information about the perceived effects of tsetse on household welfare and on cultural and social relations. The FGD participants consisted of elders and Karachunas-herders whose knowledge and folklore is well developed. Key informant interviews were undertaken with the District Government Leaders, Veterinary Officers and two resident senior researchers in the sub-region. Information gathered from the key informants was critical in triangulating the FGDs and cross-sectional survey data.

3.3. Cross-Sectional Survey

A household cross-sectional survey was conducted using semi-structured questionnaires involving 152 randomly selected households in Kaabong and Kotido districts. Respondents provided information on the perceived effects of tsetse at the household and community levels. During the cross-sectional survey, guided interviews were used in the administration of the semi-structured questionnaires. This approach was preferred because of high illiteracy rates in the area, which were estimated at 88% [44]. Enumerators that administered the semi-structured questionnaires were selected from within the region. They were required to have an education qualification of the Uganda Advanced Certificate of Education (High School Certificate). They were knowledgeable in the local dialect used by the local communities in Kotido (Jie) and Kaabong (Dodoth). The enumerators were trained in the instrument administration process, procedures and purpose. A pre-test of the semi-structured questionnaires was undertaken as part of the training process. After the pre-test, questions were fine-tuned for consistency and accuracy. The survey ran for a period of two weeks.

4. Research Analysis Implementation

4.1. Tsetse Prevalence in Karamoja

Fly trap density (FTD), a measure of tsetse prevalence, was obtained by dividing the total tsetse catch per trap by the number collected over the three trap days (72 h). To determine mean differences in the FTDs, a least significant difference (LSD) procedure using Duncan’s multiple range test for mean comparisons was used. Prior to running an LSD, analysis of variance (ANOVA) was performed to determine whether there were significant differences in FTDs among the sites. FGD data were thematically analysed. Emerging themes were grouped into thematic clusters to provide a logical result. The thematic analysis of participatory assessments was used because of its ability to provide critical insights among local pastoral communities [45,46]. Furthermore, the cross-sectional survey data were descriptively analysed, generating frequencies and means to describe the effects of tsetse at the household level.

4.2. Perceived Effect of Tsetse Invasion on Socioecological Resilience in Karamoja

Resilience, a multifaceted term, has evolved over the last four decades in its meaning and application. It has subsequently risen in prominence in various disciplines. In the 1970s, as ecologists were grappling with explaining nonlinear dimensions within ecological systems, defined resilience from an ecological theory perspective [47]. It was also considered to be the ability of a system to absorb changes or shocks from a disturbance while maintaining its internal relations [48]. Since then, resilience has come to be used in a number of ways, often as an evocative metaphor in sustainability discourse. Second, resilience is a measurable quantity in a given socioecological system [49]. Increasingly, the concept has been recognised within the context of uncertainties and rapid changes that affect rural areas. Ecological, economic and social systems often become increasingly entangled, with the interactions among these systems increasing in scale and intensity [50]. Further, it has been noted that socioecological resilience is the capacity to adapt or transform in the face of change in socioecological systems [51]. Four critical issues are identifiable within the socioecological resilience realm: i) socioecological resilience relies on assumptions of nonlinearity in dynamics of change; ii) existence of cross-scale coordination; iii) adaptive management/co-management and learning; and iv) transformability into new pathways [52,53].
The measurement of resilience is a complex process, partly because long periods of observation may be required. However, in most cases, these data requirements are generally lacking, especially in rural sociological systems. Furthermore, considering historical contingency and path dependency contexts within complex ecological systems, it may be problematic to make generalisations about causal relationships [54]. Taking these perspectives into account, it becomes apparent that resilience is an emergent property of complex systems rather than a directly measurable characteristic [55]. As such, surrogates of socioecological systems are utilised to measure resilience. Such surrogates are those that are deemed to have the potential to enhance resilience and adaptive capacity [56].
Three components are important surrogates often measured to derive the resilience of communities: absorptive, adaptive and transformative capacities. Absorptive capacity refers to the various coping strategies used by individuals and/or households to moderate or buffer the impacts of shocks and stresses on their livelihoods and basic needs. They enable individuals and households to avoid suffering permanent and negative impacts on longer-term well-being [57,58]. Absorptive capacity is identified from a range of household capitals such as number of livestock owned [59]. Adaptive capacity refers to the ability of a household or community to adjust to changing social, economic and environmental conditions, including climate variability and extremes. It enables households and/or communities to moderate potential damages, take advantage of opportunities, or cope with the consequences and shocks [60]. It describes the proactive responses taken by individuals, households and communities in response to extreme events, e.g., tsetse invasion in this study. Conversely, transformative capacity of communities refers to the ability to create a new system when ecological, economic or social structures make the existing system untenable [61]. It reflects deliberate actions of the people in a given area. These actions could be autonomous as a result of spontaneous events. However, these actions could be unintentional, arising from forced transitions imposed from outside the system as a result of a perturbation.
To establish the relationship, adaptive, absorptive and transformative indices were individually computed following the approach by [62]. As such, the adaptive capacity index was computed as:
ADCI = A D C n × 0 + ADC l × 1 + A D C m × 2 + A D C h × 3
where,
  • A D C I = Adaptive capacity index
  • A D C n = Frequency of households that rate adaptation capacity as having no importance
  • A D C l = Frequency of households that rate adaptation capacity as having low importance
  • A D C m = Frequency of households that rate adaptation strategy as having moderate importance
  • A D C h = Frequency of households that rate adaptation strategy as having high importance.
The relative importance of absorption capacity on socioecological resilience was calculated based on the following index formula:
ADCI = A B C n × 0 + ABC l × 1 + A B C m × 2 + A B C h × 3
where,
  • A B C I = Absorptive capacity index
  • A B C n = Frequency of households that rate absorption capacity as having no importance
  • A B C l = Frequency of households that rate absorption capacity as having low importance
  • A B C m = Frequency of households that rate absorption capacity as having moderate importance
  • A B C h = Frequency of households that rate absorption capacity as having high importance.
The relative importance of the transformative capacity on socioecological resilience was calculated based on the following index formula:
TRCI = T R C n × 0 + TRC l × 1 + T R C m × 2 + T R C h × 3
where,
  • T R C I = Transformative capacity index
  • T R C n = Frequency of households that rate transformative capacity as having no importance
  • T R C l = Frequency of households that rate transformative capacity as having low importance
  • T R C m = Frequency of households that rate transformative capacity as having moderate importance
  • T R C h = Frequency of households that rate transformative capacity as having high importance.
To obtain the resilience index, principal components using principal component analysis (PCA) and the varimax rotation method were applied to the factors in the absorptive capacity, adaptive capacity and transformative capacity. Factor loadings with a principal component >0.5 were identified and used in the computation of the resilience index. Accordingly, the principal components used were as follows: diversified economic activities and livestock off-take for absorptive capacity; access to livestock drugs, deployment of paravets-community animal health workers, access to information and early warming for adaptive capacity; and tsetse control infrastructure, access to extension services, level of sedentary households and urbanization for transformative capacity. These components formed the latent variables used to compute the resilience index; this formed the first stage. In the second stage, the resilience index was derived using a factor analysis of the interacting components estimated in the first stage,
R i = j w j F j
in which the resilience index is a weighted sum of the factors (Fj) generated by the scoring method, and the weights (wj) are the proportions of variance explained by each factor. In this study, the resilience index was computed from the principal component analysis factor loadings for component 1 that showed close similarity output to the anticipated hypothesised outcomes.

5. Results

5.1. Tsetse Spatial Distribution and Prevalence

The results indicated that Kaabong district had a higher prevalence of males and females as well as a higher derived fly trap density (FTD) of tsetse populations than did Kotido district (Table 1). The distribution of females was found to be higher than that of males in both districts. In these districts, tsetse prevalence was higher in the areas of Karenga, Loyoro, Nakitoit, Lokori, Kmolicher, Longaro and Locherep in Kaabong district (Figure 10); these areas are adjacent to Kidepo Valley National Park.

5.2. Historical Patterns and Dispersal Routes of Tsetse in the Karamoja Sub-Region

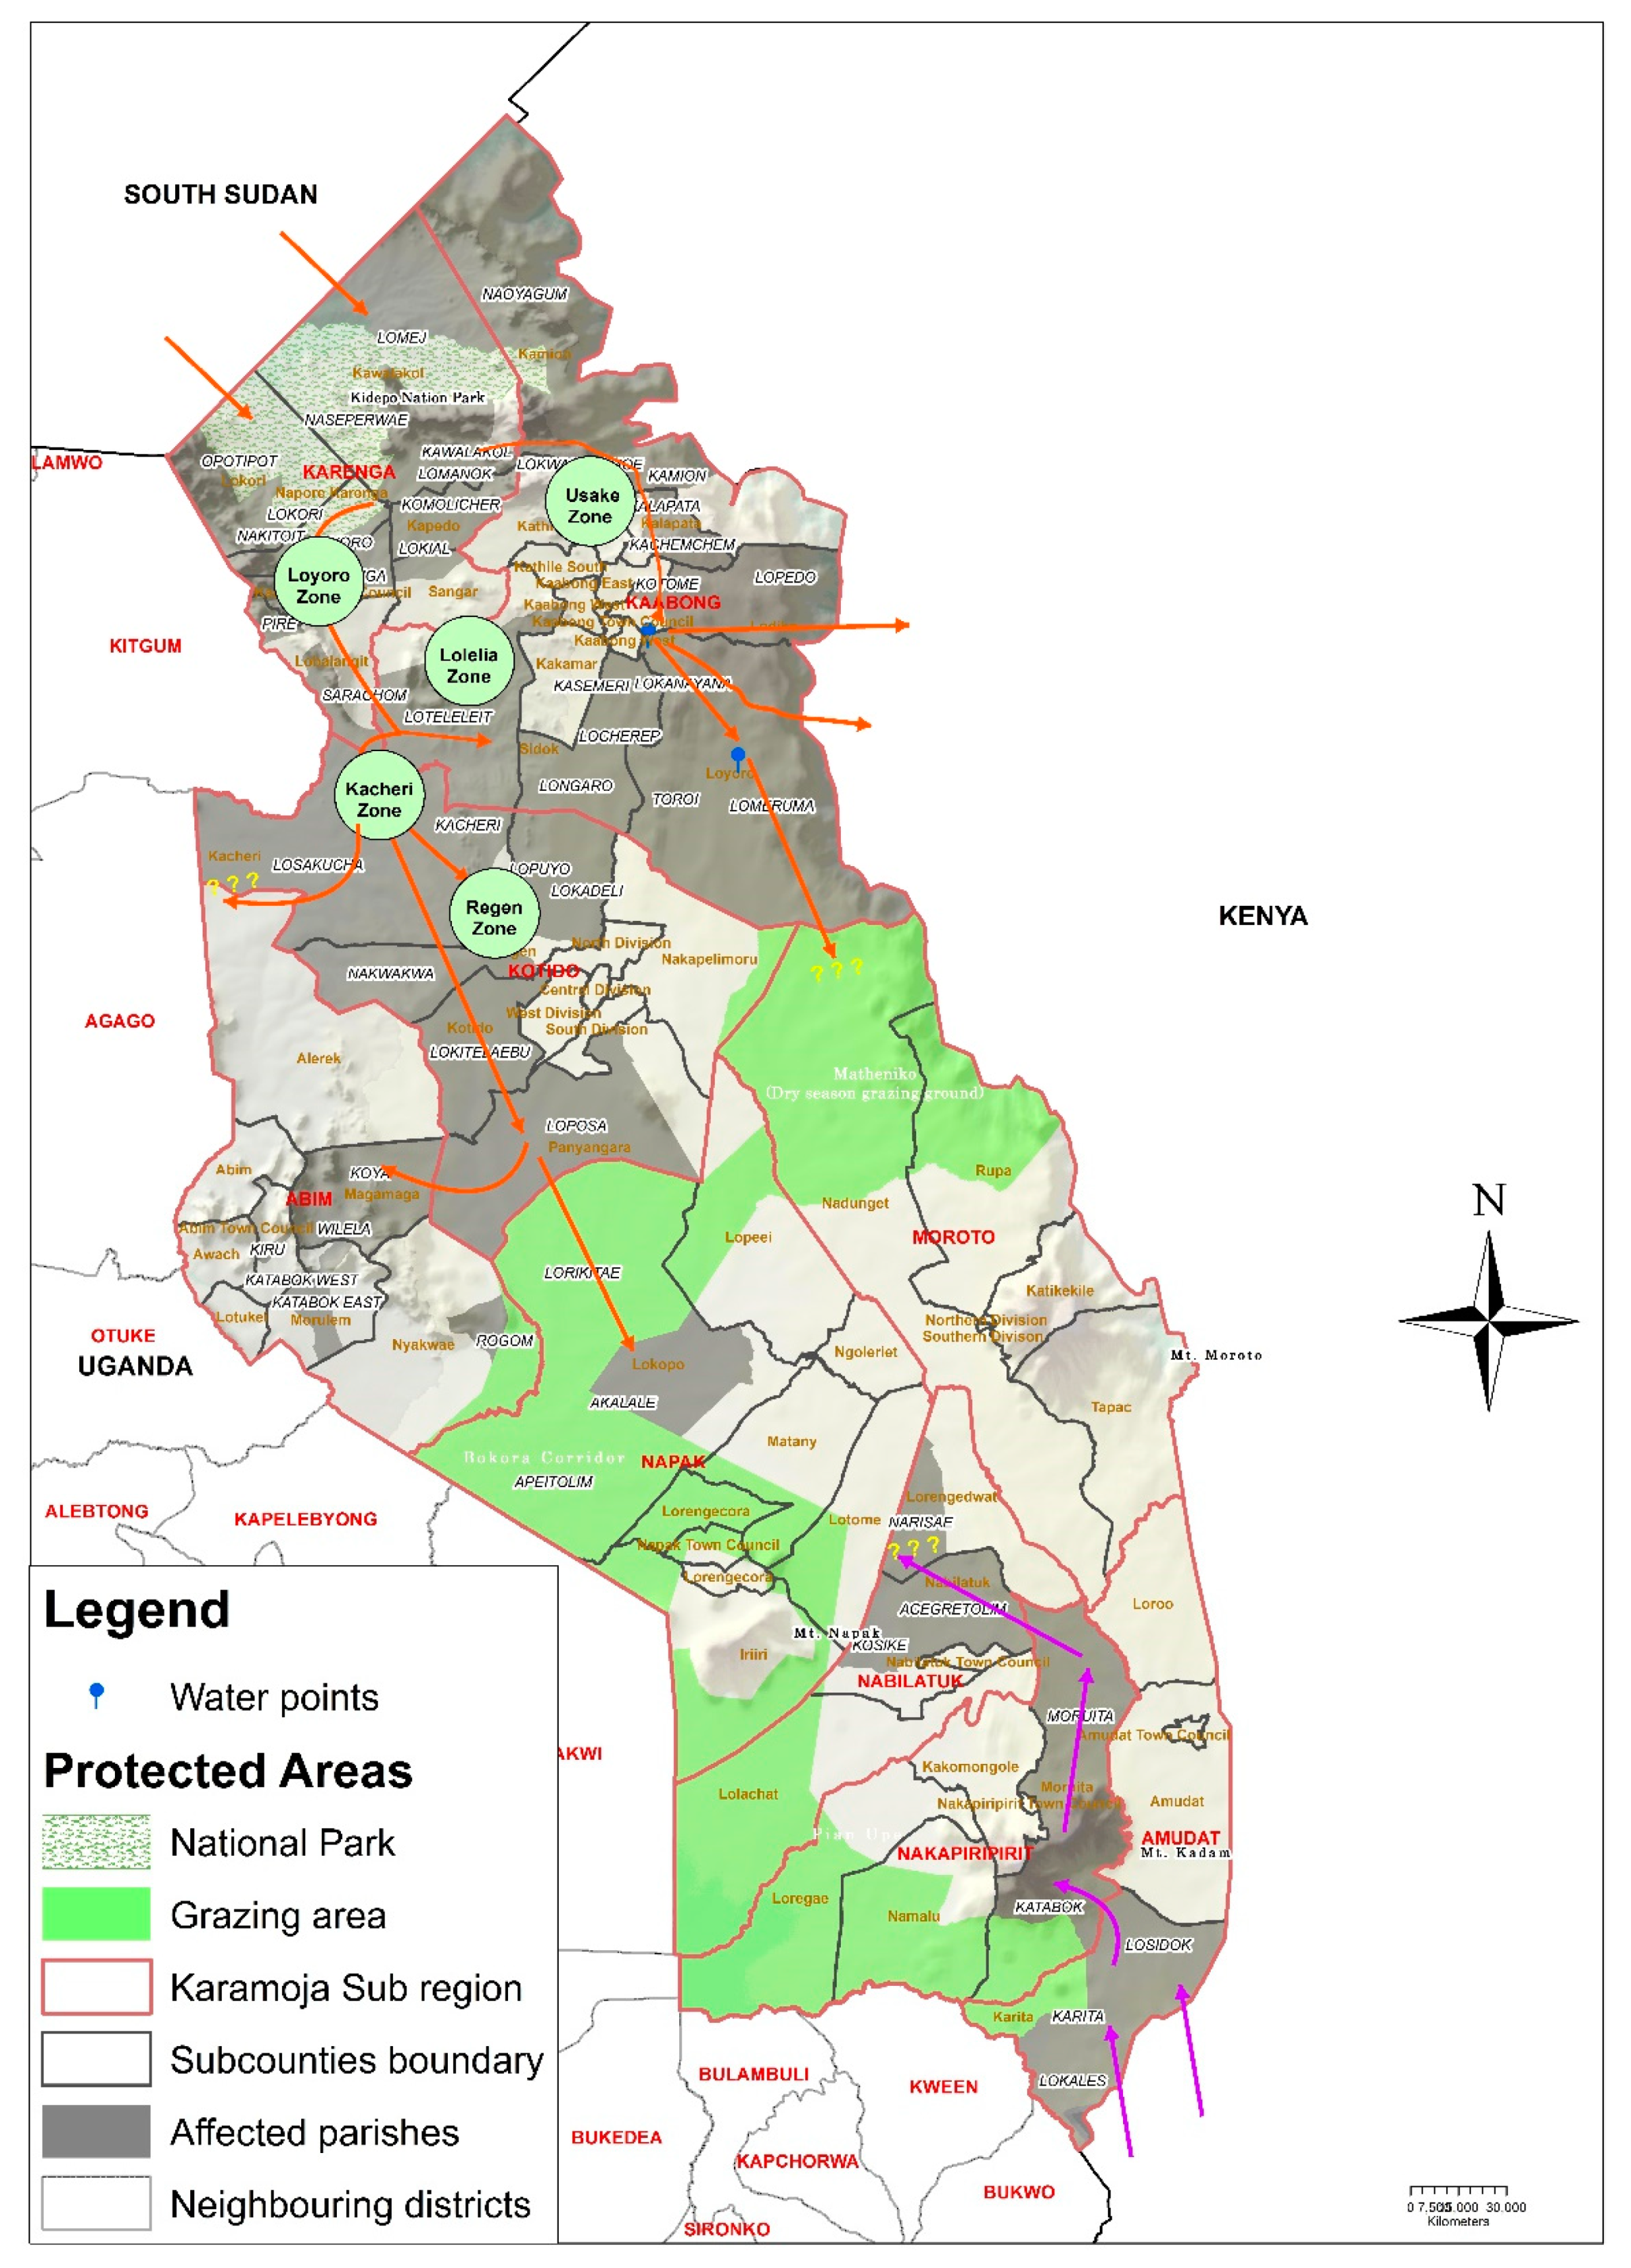
Through the participatory assessment undertaken in the districts of Kaabong, Kotido, Moroto, Amudat, Napak and Nakapiripirit, a historical account of tsetse in the sub-region was provided. Participants observed that the current invasion of tsetse was traceable to a period between 2003 and 2007 (Table 2). This period is in tandem with the renewed forceful disarmament exercise in the sub-region. The tsetse prevalence is accelerating within two wildlife migratory routes (eastern and western routes). The northern Karamoja to southern Karamoja apex route is aligned with the buffalo and elephant seasonal migrations that occur because the animals are in search of water and pasture. The eastern route commences from Kidepo Valley National Park through Pire-Nawuntos-Kalopeto-Kangaleta-Logum-Tukutan-Lokasirim to Remarim. Upon reaching Remarim, this route subdivides into two minor routes: one that enters Loyoro-Kotein to Sare and another that crosses into Kenya (Figure 11). The elephants and buffalos spend, on average, approximately three months at the water points at Loyoro, Kotein and Sare. These are the major convergence points. The second major migratory-dispersal route commences from Kidepo Valley National Park and runs through Nataba Lokure-Lofa-Omodoch-Lolelia-Lokapir. Upon reaching Lolelia, two minor routes emerge: one towards the areas of Leterua-Naperetom-Sidok and Lopoet and one to Lolelia through Lomodoch-Kamoringaetyang-Sangar-Kotor-Kapeta-Lobanya-Kaicheri-Abim and Morulem (Figure 11). Key informants noted that tsetses on this western route have a risk of merging with those observed in parts of the Teso, Lango and Acholi sub-regions (Figure 12). Both the eastern and western routes open towards central and southern Karamoja. Presently, prevalence is largely concentrated in northern Karamoja in the districts of Kaabong and Kotido, with limited reports in the Amudat district in southern Karamoja.
Within the two transmission routes in northern Karamoja, five tsetse fly concentration zones were identified in the communities as follows: i) Loyoro zone (Losululut, Aterak, Sar, Tapajei, Natelo, Musorod, Loglech, Loyile, Lobuneit, Bwangakou, Loumo, Maechit, Timira and Nakutan), ii) Regen zone (Lobel, Kalokitido, Morunyang, Waliwal Valley dam, Katukenyang Valley dam, Makal, Kanakori, Kanachom and Kaleta), iii) Kacheri zone (Lolelia, Kalingalem, Kayirang and Kapethinyang), iv) Usake-Kameon zone (Naminyit, Nawurat, Puta, Adumakuj, Lotila and Pire) and v) Lolelia zone (Kamoni, Narogole, Kumet, Kekuruk, Kamerisogol, Kamugemuge, Kalamaikol, Kotor, Lochokoi, Kaka, Lomodoch and Lochwai). Participants in the Napak and Nakapiripirit districts pointed to the areas of Narisai and sometimes to the bushes of Lotome and Narentogo in Nakapiripirit district. These areas are on the western migratory route, in which the northern Karamoja and central-to-southern Karamoja routes are connected through the Pian-Upe and Bokora wildlife reserves. In addition, some tsetse catches were reported in the Amudat district in southern Karamoja. Participatory assessment in Amudat indicated that the prevalence was higher in the areas of the Karita and Losidok sub-counties and the Katabok area towards the foot slopes of Mt. Kadam. Participants noted that heightened prevalence was observed at a time when the Pokot kinsmen from West Pokot (Kenya) crossed over to Uganda during the period of dry season grazing.
Participants attributed tsetse invasion in the sub-region to several factors. The pastoral communities acknowledged that the tsetse eradication efforts of the 1960s and 1970s, especially those championed by Ayela, were effective in reducing the tsetse populations in the sub-region. They observed that the Republic of Sudan (now South Sudan) did not undertake any action towards tsetse eradication in its area of control, which left the problem only half solved. Participants noted that the source of the current invasion appears to have a transboundary character emerging from South Sudan and perhaps from western Kenya (based on the catches reported in Amudat district). They also attributed the prevalence to the disarmament exercise (removing AK47 guns) that was undertaken in the sub-region from approximately 2003, which played a significant role in releasing the buffalos and elephants from the Kidepo Valley National Park to graze freely in other parts in the sub-region. Participants indicated that previously, when the communities were fully armed, elephants and buffalos were contained in the park for safety, as the communities killed them. They also noted that the creation of valley dams and permanent water points in areas that originally did not have such waterholes attracted elephants and buffalos into such areas. Accordingly, the migration and dispersion of buffalos and elephants have widened in the region, and their residence time in particular locations where permanent water sources exist has increased. Consequently, there is increased breeding, dispersion and distribution in non-traditional tsetse host locations in the sub-region.

5.3. Perceived Socioecological Effects of Tsetse in Karamoja

Participants observed that herder movements to and from grazing grounds had become limited. They observed that grazing grounds with good pastures, such as Hyparrhenia newtonii (Hack.) (Emaa), Sporobolus pyramidalis Beauv (Ngajien), Eragrostis pilosa (L.) Beauv (Ngiletio) and Bracharia brizantha (Hochst.) Stapf (Elet), had a high tsetse prevalence. In this case, the herders had to realign their grazing movements by reducing residence time in the grazing grounds as was historically done. This approach creates a higher grazing pressure in areas with low-quality pastures. Participants observed that tsetse prevalence had significant effects on kinsmen from Turkana in particular, as it restricted their movement to the grazing lands in Uganda. They also observed that livestock diseases, particularly livestock nagana and other tick-borne diseases, became prevalent mainly in the Kaabong, Kotido and Amudat districts. These diseases have had negative effects on livestock health in the area. Participants indicated that because of their livestock’s inability to graze well, cattle milk yield became limited, livestock body conditions decreased and some livestock died over time. Furthermore, they observed that livestock abortions among cattle, donkeys, sheep and goats become more common than before. Participants from Lolelia and Sidok also noted that tsetse flies were most prevalent in the ‘fertile’ agricultural lands. This prevalence affected women’s active participation in crop production because women avoided staying in the gardens due to tsetse bites on them and on children. As a result, overall crop output, especially sorghum, a key food security crop in the sub-region, was affected.
Despite the observed variability in livestock numbers, the results of the cross-sectional survey revealed that there was a visible perceived effect of tsetse flies on owned and sold livestock (Table 3). Approximately 94.7% of the respondents indicated that their livestock numbers had decreased due to tsetse invasion. Meanwhile, 76.3% of the respondents indicated that their crop production activities in the fertile agricultural lands had been affected. Respondents participated in diverse and multiple livelihood activities: 55.3% relied on farming, 48.7% on charcoal burning, 9.2% on beekeeping, 11.8% on the sale of livestock and livestock products and 2.6% on gold mining.
In terms of the effect of tsetse invasion on socioecological resilience, 57% of respondents indicated that they had the capacity to adapt to tsetse invasion, 54% indicated that the area had the requisite transformative capacity and 35% indicated that there was a mechanism to absorb any shocks due to tsetse invasion. The results of the absorptive capacities showed that diversified economic activities were ranked first. This result constituted the most important absorption strategies to tsetse prevalence among respondents. Access to financial services was ranked second, followed by livestock off-take, bush burning and seeking loan facilities (Table 4). The results of the adaptive capacities showed that diversified access to livestock drugs was ranked high and was most important among respondents’ adaptive capacities to tsetse prevalence. This was followed by the deployment of paravets, access to information and early warning systems, diversification of livestock and temporary migration (Table 5).
For transformative capacity, tsetse control infrastructure was ranked high in response to tsetse prevalence. This was followed by access to extension services (entomologists), level of sedentary population and urbanization (Table 6). When all these capacities were combined, the factor analysis results revealed that the absorptive capacity of the respondents was 15.0%, the adaptive capacity was 22.1% and the transformative capacity was 24.5% (Table 6). The results of the principal component analysis (PCA) were more stable in component 1. These factor loadings were used in the computation of the resilience index (Table 7). Accordingly, the computed socioecological resilience index of the study area was 20.5% (Table 8).

6. Discussion

6.1. Tsetse Prevalence and Distribution Patterns

The results showed a high tsetse prevalence in close proximity to the protected areas (Kidepo Valley National Game Park). This pattern could be attributed to the fact that these areas have remained undisturbed habitats for wildlife, including the buffalos and elephants that act as primary hosts of tsetse. Second, Kidepo Valley National Park is connected to the Kidepo Game Reserve in South Sudan, which is nearly four times larger. The Kidepo Game Reserve in South Sudan is believed to have continued to serve a breeding ground for tsetse in the region. No major traceable eradication intervention action was found to have been implemented in this area. Wildlife acts as hosts and influences the survival of tsetse due to a constant supply of food (i.e., blood). Furthermore, game parks act as breeding grounds [30,64]. Thus, the observed prevalence in proximity to the National Park should not be surprising.
Current evidence indicates tsetse dispersal from the north to central southern Karamoja following wildlife migratory routes. Additionally, there is a dispersal route emerging from southern Karamoja towards central Karamoja. This particular route is linked to the seasonal migrations of Pokot from West Pokot in Kenya, as animals search for pasture and water during the dry season. Tsetse prevalence in western Kenya, including in Turkana and West Pokot that neighbour Karamoja, and whose people routinely migrate to Karamoja in search of water and pasture, have previously been documented [65]. This belt from southern Karamoja thus appears to be an expansion of the western Kenya tsetse belt that has previously been reported, with an expanding tsetse belt in the region bordering Uganda [23,24,66].
The dispersal of tsetse southwards is particular concern, as there is potential for this tsetse population to interact with other tsetse species (Figure 12) in eastern and northern Uganda [63]. If this happens, the tsetse belt in the country will become more complex with unprecedented effects. However, the current dispersal southwards is linked to the migration of wildlife in search of water and pasture, particularly during the dry season. Seasonally distributed tsetse patterns associated with livestock and wildlife migration patterns have previously been documented in the Maasai Steppe of Tanzania, with pronounced abundance during the dry season [67]. During the participatory assessments, participants noted that the construction of permanent waterholes, such as those at Loyoro, Kotein and Sare, was further complicating the migration patterns of wildlife in the sub-region. These artificial waterholes enabled the elephants and buffalos to spend more time grazing outside the park than traditionally known. These waterholes were introduced as a governmental response to frequent pastoral movements, restricted movements and conflict over water resources during the dry seasons [68]. Regardless of why they were developed, it is important to note that the extent of tsetse distribution in the sub-region can no longer be ignored.
It is clear that tsetse has had a negative effect by affecting various aspects of life, culture and relations, production and economy in the sub-region. It has also affected relations with kinsmen and women in neighbouring Kenya, particularly in the Turkana and Pokot pastoral communities. By affecting livestock, tsetse is generating a livestock health crisis that has cumulative effects on socioeconomic and cultural well-being. In a review of five African countries, Meyer et al. observed that tsetse affected farmers’ livelihoods and welfare and food security and posed a threat to public health [69]. As indicated by participants in the assessments, livestock deaths caused by livestock nagana have become widespread, particularly in the Kaabong and Kotido districts. These observations corroborate earlier reports of tsetse infestation in Kaabong and Kotido districts [26]. Further, by affecting herder movements and reducing milk yields, tsetse invasion is likely to worsen the food security situation in the sub-region, particularly during the dry season. This situation could be more acute in Turkana, Kenya, whose food security situation is often more acute than that of Karamoja [45]. Both areas are renowned food insecurity hotspots in Kenya and Uganda [70,71]. A particular disruption to food security in the sub-region includes its effect on women, who are the major cultivators of food in the sub-region.
Tsetse invasion on grazing grounds, perceived as having good pasture species, and the limit on adequate grazing cycles in these locations could trigger an ecological imbalance leading to bush encroachment that will affect the long-term availability of pasture feed resources. According to [38], bush encroachment in Karamoja is increasing. It has previously been observed that when bush encroachment occurs, high-quality grass species often disappear, leaving behind hardy and less palatable grasses. Further, bush encroachment could occur due to the removal of keystone species and/or the removal of grasses that often help with maintaining the balance of tree-grass interactions [72,73].

6.2. Socioecological Effects of Tsetse Invasion in Karamoja

The resilience results from the study area have revealed a generally positive resilience estimated at 20.5%. This positive resilience outcome is unique in that it is a departure from some analyses of resilience that have shown a negative resilience pattern among pastoral communities [74]. A positive resilience pattern observed in the study area could be attributed to the deployment of paravets, access to extension services, diversified economic activities including crop production, livestock off-take, access to veterinary drugs and access to information including early warning systems. In the pastoral and agro-pastoral Somali, Afar and Oromia areas of Ethiopia, households with better access to veterinary services achieve better resilience. Community animal health workers (CAHWs) are critical players facilitating the delivery of much-needed livestock health services, including advisory services. These services help pastoral and agro-pastoral households maintain healthy herds [75]. Furthermore, institutional setup, including improving irrigation facilities and skills and expanding the participation of pastoral households in irrigation farming, increases pastoral resilience [76]. Additionally, creating opportunities for non-farming income and improving access to credit, integration into markets, health and veterinary services expands pastoral resilience. These practices, in addition to ethno-veterinary practices, positively improve household resilience to shocks [77]. The components as discussed by Fent et al. and Muricho et al. fall within the broad spectra of absorptive, adaptive and transformative capacities necessary to influence resilience [76,77].
However, it is also critical to note that there is a considerable narrative on the disruptiveness that vectors cause in pastoral and agro-pastoral communities. These vectors and other associated conditions predispose such communities to further weakened resilience. As seen in the resilience index results, the overall minimum index indicated a negative resilience situation. This is a revelation that there are households whose resilience has generally been affected by the tsetse invasion. Poor communities are often not resilient in the face of different hardships and shocks that erode their adaptive capacity [78]. This pattern has particularly been observed among many pastoral groups in East Africa, such as Boarana [79] and Afar of Ethiopia [80]. To this end, most of the food insecurity in pastoral communities is a result of weak resilience to shocks [81]. Vectors such as tsetse have also been recognised as causing instability within complex adaptive systems. Thus, they affect the resilience of such systems by interfering with their adaptive cycle [17]. For example, in parts of northern Uganda, the spread of sleeping sickness associated with tsetse is linked to restocking efforts after decades of military conflict [82,83]. Due to the agistments associated with pastoral communities, including Karamoja, they may be gifting their kinsmen with already infected livestock. Such practices lead to heterogeneous risks of transmission in both space and time. It is thus not surprising to observe limited socioecological resilience although the overall resilience index was positive [84].

6.3. Implications of the Assessment on Socioecological Practices of Tsetse Control

This study assessed tsetse prevalence and its effect on socioecological resilience in the pastoral Karamoja sub-region. We found complex and multiple dimensions of socioecological interactions in the study region. These interactions included: i) livestock-wildlife interaction; ii) wildlife-human-livestock interaction; iii) agricultural land expansion into wildlife grazing locations; iv) cross-country human-livestock-wildlife movements; v) intensified water resource development for livestock production development without due consideration for wildlife grazing and water needs; and vi) seasonally oriented wildlife-livestock movements taking advantage of heterogeneously distributed water and pasture resources in space and time. These observations highlight the need for the application of transdisciplinary, interdisciplinary and system dimensions in planning, implementing and managing tsetse control interventions in the area. The application of multi-disciplinary approaches for addressing socioecological challenges is required [85].
By adopting transdisciplinary, interdisciplinary and system dimensions, we believe that the actors in the intervention sphere will be better poised to co-create integrative solutions. Collaborative co-creation of solutions brings stakeholders together to share knowledge and form networks that are vital in guiding intervention strategies and practices that increase socioecological resilience [86]. Furthermore, through these approaches, practitioners are in a better position to engage policymakers, decision leaders and local communities to adopt scale- and transboundary-level interventions [87,88]. This process is particularly important because resilience and sustainable development are possible only within a context where the processes affecting and the processes affected by the health of ecosystems and human societies are holistically considered [87,89]. In this regard, it will not be necessary to separate planning for wildlife grazing and watering needs from that of cattle. Further, the tsetse eradication effort in cattle populations was separated from that of wildlife in national parks and game reserves. Yet, these areas are believed to be source points. Accordingly, integrative and cross-sector approaches to tsetse control are critical [90].
The tsetse distribution in Karamoja bears a spatiotemporal distribution characteristic. Both entomological surveys and participatory assessments revealed a higher prevalence in northern Karamoja than in central and southern Karamoja. Of particular concern is the spatial distribution and spread southwards and the emerging south-to-west Karamoja pattern. These patterns call for the establishment of a permanent, robust and routine tsetse monitoring system in Karamoja. This robust system must be inclusive, taking into consideration local knowledge and information systems. It is also critical to develop approaches that can enable the timely transfer of tsetse-based information for prevalence and risk quantification. This speed is important in facilitating timely response [91]. Actors in tsetse control must pay close attention to seasonal dimensions because dispersal is associated with seasonal migrations of hosts, especially wildlife. High fly abundance and mobility during dry seasons have been reported elsewhere in Tanzania and South Sudan [92,93,94]. Considering the flux in wildlife and livestock-cattle mobility into Uganda during the dry season, it is vital that monitoring be conducted to ascertain tsetse dynamics associated with this mobility. Tsetse is a vector of transboundary importance whose control calls for coordinated multinational actions [95,96]. Temporal migratory route monitoring could perhaps aid in providing critical information regarding the progression of tsetse abundance and therefore help with the identification of risk hotspots, particularly because these routes are transformation foci.

7. Conclusions

Tsetse invasion in the Karamoja sub-region is an important entomological and epidemiological concern. Although the socioecological resilience in the study is positive, the threat of tsetse in the sub-region is growing. A higher prevalence is observed in two districts in northern Karamoja that are in close proximity to Kidepo Valley National Park, and there were some reported in southern Karamoja. This result raises an urgent need for immediate intervention before a wider and total sprawl of tsetse occurs in the sub-region. Intervention is required to control the spread, particularly to minimise the potential of the tsetse belts from greater northern and eastern Uganda (Teso sub-region) merging with that from western Kenya. Tsetse control approaches that need to be implemented should be holistic and recognise the complex and multiple dimensions of socioecological interactions in the study region. Furthermore, given the perceived transboundary nature of tsetse prevalence and distribution in Karamoja, coordinated multination intervention is required. It is only through these dimensions that resilience in the sub-region can be sustained and further increased.

Author Contributions

Cconceptualization, A.E., J.O., and B.B.; methodology, A.E., J.O., B.B. and J.J.N.; software, J.O. and J.P.M.; validation, A.E., J.O., J.P.M. and B.B.; formal analysis, A.E., J.O. and J.P.M.; investigation, A.E. and J.O.; resources, A.E.; data curation, J.O., J.P.M. and A.S.; writing—original draft preparation, A.E.; writing—review and editing, A.E., J.O., B.B., and A.S.; visualization, A.E., J.O., B.B. and A.S.; supervision, J.J.N.; project administration, A.E.; funding acquisition, A.E. and J.J.N. All authors have read and agreed to the published version of the manuscript.

Funding

This research was funded by the Carnegie Corporation of New York through the Nurturing Emerging Research Leaders Project at Makerere University (Post Doc 2017). The research also received tsetse data from the Ministry of Agriculture Animal Industry and Fisheries (MAAIF) through the tsetse surveillance programme, and the publication of this article was funded by the Regional Universities from for Capacity Building in Agriculture (RUFORUM) through the Transforming African Agricultural Universities to meaningfully contribute to Africa’s growth and development (TAGDev) supported by the Mastercard Foundation.

Conflicts of Interest

The authors declare no conflict of interest.

References

  1. Cecchi, G.; Mattioli, R.C.; Slingenbergh, J.; De La Rocque, S. Land cover and tsetse fly distributions in sub-Saharan Africa. Med. Vet. Entomol. 2008, 22, 364–373. [Google Scholar] [CrossRef] [PubMed]
  2. Rogers, D.J.; Robinson, T.P. Tsetse distribution. In The Trypanosomiases; Maudlin, I., Holmes, P.H., Miles, M.A., Eds.; CABI: Wallingford, UK, 2004. [Google Scholar]
  3. Saarman, N.; Burak, M.; Opiro, R.; Hyseni, C.; Echodu, R.; Dion, K.; Opiyo, E.A.; Dunn, A.W.; Amatulli, G.; Aksoy, S.; et al. A spatial genetics approach to inform vector control of tsetse flies (Glossina fuscipes fuscipes) in Northern Uganda. Ecol. Evol. 2018, 8, 5336–5354. [Google Scholar] [CrossRef] [PubMed]
  4. Geiger, A.; Malele, I.; Abd-Alla, A.M.; Njiokou, F. Blood feeding tsetse flies as hosts and vectors of mammals-pre-adapted African Trypanosoma: Current and expected research directions. BMC Microbiol. 2018, 18, 17–29. [Google Scholar] [CrossRef] [Green Version]
  5. Echodu, R.; Sistrom, M.; Bateta, R.; Murilla, G.; Okedi, L.; Aksoy, S.; Enyioha, C.; Enyaru, J.; Opiyo, E.; Gibson, W.; et al. Genetic diversity and population structure of Trypanosoma brucei in Uganda: Implications for the epidemiology of sleeping sickness and Nagana. PLoS Negl. Trop. Dis. 2015, 9, 2. [Google Scholar] [CrossRef] [PubMed]
  6. Paul, M.; Stefaniak, J.; Smuszkiewicz, P.; Van Esbroeck, M.; Geysen, D.; Clerinx, J. Outcome of acute East African trypanosomiasis in a Polish traveller treated with pentamidine. BMC Infect. Dis. 2014, 14, 111. [Google Scholar] [CrossRef] [PubMed] [Green Version]
  7. Mwanakasale, V.; Songolo, P.; Babaniyi, O.; Simarro, P. Clinical presentation of human African trypanosomiasis in Zambia is linked to the existence of strains of Trypanosoma brucei rhodesiense with varied virulence: Two case reports. J. Med. Case Rep. 2014, 8, 53. [Google Scholar] [CrossRef] [Green Version]
  8. Steverding, D. The history of African trypanosomiasis. Parasites Vectors 2008, 1, 3. [Google Scholar] [CrossRef] [Green Version]
  9. Muhanguzi, D.; Mugenyi, A.; Bigirwa, G.; Kamusiime, M.; Kitibwa, A.; Akurut, G.G.; Ochwo, S.; Amanyire, W.; Okech, S.G.; Hattendorf, J.; et al. African animal trypanosomiasis as a constraint to livestock health and production in Karamoja region: A detailed qualitative and quantitative assessment. BMC Veter. Res. 2017, 13, 355. [Google Scholar] [CrossRef] [Green Version]
  10. Mugenyi, A.W. Spatial Distribution of Tsetse (Diptera: Glossinidae) within the Trypanosoma brucei rhodesiense focus of Uganda. Ph.D. Thesis, The University of Edinburg, Edinburg, UK, 2015; p. 250. Available online: http://coctu.go.ug/T&T%20draft%20Policy_2014.pdf (accessed on 10 March 2019).
  11. Shaw, A.P.M.; Torr, S.J.; Waiswa, C.; Cecchi, G.; Wint, G.R.W.; Mattioli, R.C.; Robinson, T.P. Estimating the costs of tsetse control options: An example for Uganda. Prev. Veter. Med. 2013, 110, 290–303. [Google Scholar] [CrossRef]
  12. Kame-Ngasse, G.I.; Njiokou, F.; Melachio-Tanekou, T.T.; Farikou, O.; Simo, G.; Geiger, A. Prevalence of symbionts and trypanosome infections in tsetse flies of two villages of the “Faro and Déo” division of the Adamawa Region of Cameroon. BMC Microbiol. 2018, 18, 83–91. [Google Scholar] [CrossRef]
  13. Ilemobade, A.A. Tsetse and trypanosomosis in Africa: The challenges, the opportunities. Onderstepoort J. Veter. Res. 2009, 76, 35–40. [Google Scholar] [CrossRef] [Green Version]
  14. Krätli, S.; Huelsebusch, C.; Brooks, S.; Kaufmann, B. Pastoralism: A critical asset for food security under global climate change. Anim. Front. 2013, 3, 42–50. [Google Scholar] [CrossRef]
  15. Chitanga, S.; Marcotty, T.; Namangala, B.; Van den Bossche, P.; Van Den Abbeele, J.; Delespaux, V. High prevalence of drug resistance in animal trypanosomes without a history of drug exposure. PLoS Negl. Trop. Dis. 2011, 5, e1454. [Google Scholar] [CrossRef] [PubMed] [Green Version]
  16. Easter, T.S.; Killion, A.K.; Carter, N.H. Climate change, cattle, and the challenge of sustainability in a telecoupled system in Africa. Ecol. Soc. 2018, 23, 10. [Google Scholar] [CrossRef] [Green Version]
  17. Wilcox, B.A.; Echaubard, P.; de Garine-Wichatitsky, M.; Ramirez, B. Vector-borne disease and climate change adaptation in African dryland social-ecological systems. Infect. Dis. Poverty 2019, 8, 36. [Google Scholar] [CrossRef] [Green Version]
  18. Barrett, M.P. Veterinary link to drug resistance in human African trypanosomiasis? Lancet 2001, 358, 603–604. [Google Scholar] [CrossRef]
  19. Ministry of Agriculture Animal Industry and Fisheries. National Policy for the Eradication of Tsetse Flies and Elimination of Trypanosomosis; Entebbe, Uganda, 2014; p. 14. Available online: http://coctu.go.ug/T&T%20draft%20Policy_2014.pdf (accessed on 18 August 2019).
  20. Franco, J.R.; Simarro, P.P.; Diarra, A.; Jannin, J.G. Epidemiology of human African trypanosomiasis. Clin. Epidemiol. 2014, 6, 257. [Google Scholar] [CrossRef]
  21. Fèvre, E.M.; Coleman, P.G.; Welburn, S.C.; Maudlin, I. Reanalyzing the 1900–1920 sleeping sickness epidemic in Uganda. Emerg. Infect. Dis. 2004, 10, 567–573. [Google Scholar] [CrossRef] [Green Version]
  22. Fèvre, E.M.; Coleman, P.G.; Odiit, M.; Magona, J.W.; Welburn, S.C.; Woolhouse, M.E.J. The origins of a new Trypanosoma brucei rhodesiense sleeping sickness outbreak in eastern Uganda. Lancet 2001, 358, 625–628. [Google Scholar] [CrossRef]
  23. Thumbi, S.M.; Jung’a, J.O.; Mosi, R.O.; McOdimba, F.A. Spatial distribution of African animal trypanosomiasis in Suba and Teso districts in Western Kenya. BMC Res. Notes 2010, 3, 6. [Google Scholar] [CrossRef] [Green Version]
  24. Rutto, J.J.; Karuga, J.W. Temporal and spatial epidemiology of sleeping sickness and use of geographical information system (GIS) in Kenya. J. Vector Borne Dis. 2009, 46, 18. [Google Scholar] [PubMed]
  25. Berrang-Ford, L.; Odiit, M.; Maiso, F.; Waltner-Toews, D.; McDermott, J. Sleeping sickness in Uganda: Revisiting current and historical distributions. Afr. Health Sci. 2006, 6, 223–231. [Google Scholar] [CrossRef]
  26. Wanyama, O. Tsetse Flies Trigger Migration in Kaabong. URN. 2014. Available online: https://ugandaradionetwork.com/story/tsetse-flies-trigger-migration-in-kaabong (accessed on 18 August 2019).
  27. Garmestani, A.; Craig, R.K.; Gilissen, H.K.; McDonald, J.; Soininen, N.; van Doorn-Hoekveld, W.; van Rijswick, H.F. The role of social-ecological resilience in coastal zone management: A comparative law approach to three coastal nations. Front. Ecol. Evol. 2019, 7, 410. [Google Scholar] [CrossRef] [Green Version]
  28. Brown, E.D.; Williams, B.K. Resilience and resource management. Environ. Manag. 2015, 56, 1416–1427. [Google Scholar] [CrossRef] [Green Version]
  29. Scoones, I.; Dzingirai, V.; Anderson, N.; MacLeod, E.; Mangwanya, L.; Matawa, F.; Murwira, A.; Nyakupinda, L.; Shereni, W.; Welburn, S.C. People, Patches, and Parasites: The Case of Trypanosomiasis in Zimbabwe. Hum. Ecol. 2017, 45, 643–654. [Google Scholar] [CrossRef] [Green Version]
  30. Wamwiri, F.N.; Changasi, R.E. Tsetse flies (Glossina) as vectors of human African trypanosomiasis: A review. Biomed. Res. Int. 2016, 8, 6201350. [Google Scholar] [CrossRef] [Green Version]
  31. Tchouomene-Labou, J.; Nana-Djeunga, H.; Simo, G.; Njitchouang, G.R.; Cuny, G.; Asonganyi, T.; Njiokou, F. Spatial and temporal variations relevant to tsetse control in the Bipindi focus of southern Cameroon. Parasites Vectors 2013, 6, 193. [Google Scholar] [CrossRef] [Green Version]
  32. Wacher, T.J.; Milligan, P.J.M.; Rawlings, P.; Snow, W.F. Tsetse–trypanosomiasis challenge to village N’Dama cattle in The Gambia: Field assessments of spatial and temporal patterns of tsetse–cattle contact and the risk of trypanosomiasis infection. Parasitology 1994, 109, 149–162. [Google Scholar] [CrossRef]
  33. Schneider, D.I.; Saarman, N.; Onyango, M.G.; Hyseni, C.; Opiro, R.; Echodu, R.; O’Neill, M.; Bloch, D.; Vigneron, A.; Johnson, T.J.; et al. Spatio-temporal distribution of Spiroplasma infections in the tsetse fly (Glossina fuscipes fuscipes) in northern Uganda. PLoS Negl. Trop. Dis. 2019, 13, e0007340. [Google Scholar] [CrossRef] [Green Version]
  34. Aguirre, A.A.; Basu, N.; Kahn, L.H.; Morin, X.K.; Echaubard, P.; Wilcox, B.A.; Beasley, V.R. Transdisciplinary and social-ecological health frameworks—Novel approaches to emerging parasitic and vector-borne diseases. Parasite Epidemiol. Control 2019, 4, e00084. [Google Scholar] [CrossRef]
  35. Colwell, D.D.; Dantas-Torres, F.; Otranto, D. Vector-borne parasitic zoonoses: Emerging scenarios and new perspectives. Veter. Parasitol. 2011, 182, 14–21. [Google Scholar] [CrossRef]
  36. De Vos, A.; Cumming, G.S.; Cumming, D.H.; Ament, J.M.; Baum, J.; Clements, H.S.; Grewar, J.D.; Maciejewski, K.; Moore, C. Pathogens, disease, and the social-ecological resilience of protected areas. Ecol. Soc. 2016, 21, 20. [Google Scholar] [CrossRef] [Green Version]
  37. Egeru, A.; Wasonga, O.; MacOpiyo, L.; Mburu, J.; Tabuti, J.R.; Majaliwa, M.G. Piospheric influence on forage species composition and abundance in semi-arid Karamoja sub-region, Uganda. Pastoralism 2015, 5, 12. [Google Scholar] [CrossRef] [Green Version]
  38. Egeru, A.; Wasonga, O.; Kyagulanyi, J.; Majaliwa, G.M.; MacOpiyo, L.; Mburu, J. Spatio-temporal dynamics of forage and land cover changes in Karamoja sub-region, Uganda. Pastoralism 2014, 4, 6. [Google Scholar] [CrossRef] [Green Version]
  39. Ministry of Agriculture, Animal Industry and Fisheries and Uganda Bureau of Statistics. The National Livestock Census: A Summary Report of the National Livestock Census; Kampala, Uganda, 2009; p. 273. Available online: https://www.ubos.org/wp-content/uploads/publications/05_2019THE_NATIONAL_LIVESTOCK_CENSUS_REPORT_2008.pdf (accessed on 9 February 2020).
  40. Uganda Bureau of Statistics. National Population and Housing Census 2014—Main Report; Uganda Bureau of Statistics: Kampala, Uganda, 2016; p. 104. Available online: https://unstats.un.org/unsd/demographic/sources/census/wphc/Uganda/UGA-2016–05-23.pdf (accessed on 9 February 2020).
  41. Uganda Investment Authority. Karamoja Investment Profile 2016; Uganda Investment Authority: Kampala, Uganda, 2016; p. 32. Available online: https://www.ugandainvest.go.ug/wp-content/uploads/2016/04/uia-Karamoja-profile.pdf (accessed on 12 March 2017).
  42. Williams, B.; Dransfield, R.; Brightwell, R. Monitoring tsetse populations. The intrinsic variability of trap catches of Glossina pallidipes at Nguruman, Kenya. Med. Vet. Entomol. 1990, 4, 167–179. [Google Scholar] [CrossRef]
  43. Pollock, J.N. Vol.1: Tsetse Biology, Systematics and Distribution, Techniques. In Training Manual for Tsetse Control Personnel; FAO: Rome, Italy, 1982; p. 274. Available online: http://www.fao.org/3/a-p5178e.pdf (accessed on 9 February 2020).
  44. Uganda Bureau of Statistics (UBOS). Uganda National Household Survey 2012/2013; UBOS: Kampala, Uganda, 2014; p. 230. Available online: https://www.ubos.org/wp-content/uploads/publications/04_20182012_13_UNHS_Final_Report.pdf (accessed on 9 February 2020).
  45. Egeru, A. Climate Risk Management Climate risk management information, sources and responses in a pastoral region in East Africa. Clim. Risk Manag. 2016, 11, 1–14. [Google Scholar] [CrossRef] [Green Version]
  46. Galiè, A.; Teufel, N.; Girard, A.W.; Baltenweck, I.; Dominguez-Salas, P.; Price, M.J.; Jones, R.; Lukuyu, B.; Korir, L.; Raskind, I.; et al. Women’s empowerment, food security and nutrition of pastoral communities in Tanzania. Glob. Food Secur. 2019, 23, 125–134. [Google Scholar] [CrossRef]
  47. Holling, C.S. Resilience and stability of ecological systems. Ann. Rev. Ecol. Syst. 1973, 4, 1–23. [Google Scholar] [CrossRef] [Green Version]
  48. Bollettino, V.; Alcayna, T.; Dy, P.; Vinck, P. Introduction to socio-ecological resilience. In Oxford Research Encyclopedia of Natural Hazard Science; Oxford University Press: Oxford, UK, 2017. [Google Scholar] [CrossRef]
  49. Carpenter, S.; Walker, B.; Anderies, J.M.; Abel, N. From metaphor to measurement: Resilience of what to what? Ecosystems 2001, 4, 765–781. [Google Scholar] [CrossRef]
  50. Heijman, W.; Hagelaar, G.; van der Heide, M. Rural resilience as a new development concept. In EU Bioeconomy Economics and Policies; Palgrave Macmillan: London, UK, 2019; Volume 2, pp. 195–211. [Google Scholar] [CrossRef]
  51. Chapin, F.S., III; Carpenter, S.R.; Kofinas, G.P.; Folke, C.; Abel, N.; Clark, W.C.; Olsson, P.; Smith, D.M.S.; Walker, B.; Young, O.R.; et al. Ecosystem stewardship: Sustainability strategies for a rapidly changing planet. Trends Ecol. Evol. 2010, 25, 241–249. [Google Scholar] [CrossRef] [Green Version]
  52. Folke, C. Resilience: The emergence of a perspective for social–ecological systems analyses. Glob. Environ. Chang. 2006, 16, 253–267. [Google Scholar] [CrossRef]
  53. Walker, B.; Carpenter, S.; Anderies, J.; Abel, N.; Cumming, G.; Janssen, M.; Lebel, L.; Norberg, J.; Peterson, G.D.; Pritchard, R. Resilience management in social-ecological systems: A working hypothesis for a participatory approach. Conserv. Ecol. 2002, 6, 14. Available online: http://www.consecol.org/vol6/iss1/art14 (accessed on 19 February 2020).
  54. Leslie, P.; McCabe, J.T.; Bollig, M.; Greiner, C.; Fratkin, E.; Galaty, J.G.; Homewood, K.; Lansing, S.; Lu, F.; Moran, E.F.; et al. Response diversity and resilience in social-ecological systems. Curr. Anthropol. 2013, 54, 114–143. [Google Scholar] [CrossRef] [Green Version]
  55. Robinson, L.W.; Berkes, F. Applying resilience thinking to questions of policy for pastoralist systems: Lessons from the Gabra of northern Kenya. Hum. Ecol. 2010, 38, 335–350. [Google Scholar] [CrossRef]
  56. Cumming, G.S.; Barnes, G.; Perz, S.; Schmink, M.; Sieving, K.E.; Southworth, J.; Binford, M.; Holt, R.D.; Stickler, C.; Van Holt, T. An exploratory framework for the empirical measurement of resilience. Ecosystems 2005, 8, 975–987. [Google Scholar] [CrossRef]
  57. Cutter, S.L.; Barnes, L.; Berry, M.; Burton, C.; Evans, E.; Tate, E.; Webb, J. A place-based model for understanding community resilience to natural disasters. Glob. Environ. Chang. 2008, 18, 598–606. [Google Scholar] [CrossRef]
  58. Béné, C.; Wood, R.G.; Newsham, A.; Davies, M. Resilience: New utopia or new tyranny? Reflection about the potentials and limits of the concept of resilience in relation to vulnerability reduction programmes. IDS Work. Pap. 2012, 2012, 1–61. [Google Scholar] [CrossRef]
  59. Opiyo, F.; Mureithi, S.; Manzano, J.N.A.; Pitaud, T. An Indicator Framework for Measuring Pastoralists’ Resilience to Drought in the Horn of Africa. Sci. Environ. 2018, 32, 52–68. [Google Scholar]
  60. Adger, W.N. Vulnerability. Glob. Environ. Chang. 2006, 16, 268–281. [Google Scholar] [CrossRef]
  61. Walker, B.; Holling, C.S.; Carpenter, S.R.; Kinzig, A. Resilience, Adaptability and Transformability in Social-Ecological Systems. Available online: https://www.jstor.org/stable/26267673 (accessed on 18 February 2020).
  62. Uddin, M.N.; Bokelmann, W.; Entsminger, J.S. Factors affecting farmers’ adaptation strategies to environmental degradation and climate change effects: A farm level study in Bangladesh. Climate 2014, 2, 223–241. [Google Scholar] [CrossRef] [Green Version]
  63. Wint, W. Kilometre resolution tsetse fly distribution maps for the Lake Victoria basin and West Africa. In Report to the Joint Food and Agriculture Organization of the United Nations/International Atomic Energy Agency Programme; Food and Agriculture Organization: Rome, Italy, 2001. [Google Scholar]
  64. Munang’andu, H.M.; Siamudaala, V.; Munyeme, M.; Nalubamba, K.S. A review of ecological factors associated with the epidemiology of wildlife trypanosomiasis in the Luangwa and Zambezi valley ecosystems of Zambia. Interdiscip. Perspect. Infect. Dis. 2012, 372523, 13. [Google Scholar] [CrossRef]
  65. Messina, J.P.; Moore, N.J.; DeVisser, M.H.; McCord, P.F.; Walker, E.D. Climate change and risk projection: Dynamic spatial models of tsetse and African trypanosomiasis in Kenya. Ann. Assoc. Am. Geogr. 2012, 102, 1038–1048. [Google Scholar] [CrossRef] [PubMed] [Green Version]
  66. Moore, N.; Messina, J. A landscape and climate data logistic model of tsetse distribution in Kenya. PLoS ONE 2010, 5, e11809. [Google Scholar] [CrossRef]
  67. Ngonyoka, A.; Gwakisa, P.S.; Estes, A.B.; Nnko, H.J.; Hudson, P.J.; Cattadori, I.M. Variation of tsetse fly abundance in relation to habitat and host presence in the Maasai Steppe, Tanzania. J. Vector Ecol. 2017, 42, 34–43. [Google Scholar] [CrossRef] [Green Version]
  68. Mugerwa, S.; Kayiwa, S.; Egeru, A. Status of livestock water sources in Karamoja sub-region, Uganda. Res. Environ. 2014, 4, 58–66. [Google Scholar] [CrossRef]
  69. Meyer, A.; Holt, H.R.; Selby, R.; Guitian, J. Past and ongoing tsetse and animal trypanosomiasis control operations in five African countries: A systematic review. PLoS Negl. Trop. Dis. 2016, 10, e0005247. [Google Scholar] [CrossRef] [Green Version]
  70. Loewenberg, S. Breaking the cycle: Drought and hunger in Kenya. Lancet 2014, 383, 1025–1028. [Google Scholar] [CrossRef]
  71. Akwango, D.; Obaa, B.B.; Turyahabwe, N.; Baguma, Y.; Egeru, A. Effect of drought early warning system on household food security in Karamoja subregion, Uganda. Agric. Food Secur. 2017, 6, 43. [Google Scholar] [CrossRef]
  72. Abdalla, M.; Hastings, A.; Chadwick, D.R.; Jones, D.L.; Evans, C.D.; Jones, M.B.; Rees, R.M.; Smith, P. Critical review of the impacts of grazing intensity on soil organic carbon storage and other soil quality indicators in extensively managed grasslands. Agric. Ecosyst. Environ. 2018, 253, 62–81. [Google Scholar] [CrossRef] [Green Version]
  73. Kgosikoma, O.E.; Mogotsi, K. Understanding the causes of bush encroachment in Africa: The key to effective management of savanna grasslands. Trop. Grassl.-Forrajes Trop. 2013, 1, 215–219. [Google Scholar] [CrossRef]
  74. Alinovi, L.; D’errico, M.; Mane, E.; Romano, D. Livelihoods Strategies and Household Resilience to Food Insecurity: An Empirical Analysis to Kenya; European Report on Development: Rome, Italy, 2010; pp. 1–52. Available online: http://www.technicalconsortium.org/wp-content/uploads/2014/05/Livelihoods-Strategies_Household-Res.pdf (accessed on 16 December 2019).
  75. Craft, T. Enabling Resilience for Pastoral Communities in Ethiopia. Prime Impact and Results Report; Mercy Corps: Portland, OR, USA, 2019; p. 16. Available online: https://www.mercycorps.org/sites/default/files/mc_prime_impact_report_FINAL_March2019.pdf (accessed on 16 December 2019).
  76. Fenta, M.; Jordaan, A.; Melka, Y. Vulnerability of Southern Afar pastoralists to climate variability and change, Ethiopia. Jàmbá J. Dis. Risk Stud. 2019, 11, 1–8. [Google Scholar] [CrossRef]
  77. Muricho, D.N.; Otieno, D.J.; Oluoch-Kosura, W.; Jirström, M. Building pastoralists’ resilience to shocks for sustainable disaster risk mitigation: Lessons from West Pokot County, Kenya. Int. J. Dis. Risk Reduct. 2019, 34, 429–435. [Google Scholar] [CrossRef]
  78. Little, P.D.; McPeak, J.G. Resilience and Pastoralism in Africa south of the Sahara, with a Particular Focus on the Horn of Africa and the Sahel, West Africa. Available online: http://www.vivo.colostate.edu/lccrsp/reports/2020resilienceconfpaper09.pdf (accessed on 10 February 2020).
  79. Birhanu, Z.; Ambelu, A.; Berhanu, N.; Tesfaye, A.; Woldemichael, K. Understanding resilience dimensions and adaptive strategies to the impact of recurrent droughts in Borana Zone, Oromia Region, Ethiopia: A grounded theory approach. Int. J. Environ. Res. Public Health 2017, 14, 118. [Google Scholar] [CrossRef] [PubMed] [Green Version]
  80. Mekuyie, M.; Jordaan, A.; Melka, Y. Understanding resilience of pastoralists to climate change and variability in the Southern Afar Region, Ethiopia. Clim. Risk Manag. 2018, 20, 64–77. [Google Scholar] [CrossRef]
  81. Ambelu, A.; Birhanu, Z.; Tesfaye, A.; Berhanu, N.; Muhumuza, C.; Kassahun, W.; Daba, T.; Woldemichael, K. Intervention pathways towards improving the resilience of pastoralists: A study from Borana communities, southern Ethiopia. Weather Clim. Extrem. 2017, 17, 7–16. [Google Scholar] [CrossRef]
  82. Selby, R.; Bardosh, K.; Picozzi, K.; Waiswa, C.; Welburn, S.C. Cattle movements and trypanosomes: Restocking efforts and the spread of Trypanosoma brucei rhodesiense sleeping sickness in post-conflict Uganda. Parasites Vectors 2013, 6, 281. [Google Scholar] [CrossRef] [PubMed] [Green Version]
  83. Bardosh, K.L.; Ryan, S.J.; Ebi, K.; Welburn, S.; Singer, B. Addressing vulnerability, building resilience: Community-based adaptation to vector-borne diseases in the context of global change. Infect. Dis. Poverty 2017, 6, 166. [Google Scholar] [CrossRef] [Green Version]
  84. Dicko, A.H.; Percoma, L.; Sow, A.; Adam, Y.; Mahama, C.; Sidibé, I.; Dayo, G.K.; Thévenon, S.; Fonta, W.; Sanfo, S.; et al. A spatio-temporal model of African animal trypanosomosis risk. PLoS Negl. Trop. Dis. 2015, 9, e0003921. [Google Scholar] [CrossRef] [Green Version]
  85. Dick, M.; Rous, A.M.; Nguyen, V.M.; Cooke, S.J. Necessary but challenging: Multiple disciplinary approaches to solving conservation problems. Facets 2016, 1, 67–82. [Google Scholar] [CrossRef]
  86. Paolisso, M.; Prell, C.; Johnson, K.J.; Needelman, B.; Khan, I.M.; Hubacek, K. Enhancing socio-ecological resilience in coastal regions through collaborative science, knowledge exchange and social networks: A case study of the Deal Island Peninsula, USA. Socio-Ecol. Pract. Res. 2019, 1, 109–123. [Google Scholar] [CrossRef] [Green Version]
  87. Assmuth, T.; Chen, X.; Degeling, C.; Haahtela, T.; Irvine, K.N.; Keune, H.; Kock, R.; Rantala, S.; Rüegg, S.; Vikström, S. Integrative concepts and practices of health in transdisciplinary social ecology. Socio-Ecol. Pract. Res. 2019, 1–20. [Google Scholar] [CrossRef] [Green Version]
  88. Mwaseba, D.L.; Kigoda, K.J. Knowledge, attitude, and practices about tsetse control among communities neighbouring Serengeti National Park, Tanzania. Heliyon 2017, 3, e00324. [Google Scholar] [CrossRef] [Green Version]
  89. Percoma, L.; Sow, A.; Pagabeleguem, S.; Dicko, A.H.; Serdebéogo, O.; Ouédraogo, M.; Rayaissé, J.B.; Bouyer, J.; Belem, A.M.; Sidibé, I. Impact of an integrated control campaign on tsetse populations in Burkina Faso. Parasites Vectors 2018, 11, 270. [Google Scholar] [CrossRef]
  90. Grant, C. Politics of Knowledge: Whose Knowledge Matters in Trypanosomiasis Policy Making in Zambia? STEPS Centre: Brighton, UK, 2014; p. 35. Available online: https://opendocs.ids.ac.uk/opendocs/bitstream/handle/20.500.12413/6701/Tsetse-wp2.pdf?sequence=1&isAllowed=y (accessed on 16 December 2019).
  91. Vale, G.A.; Hall, D.R.; Chamisa, A.; Torr, S.J. Towards an early warning system for Rhodesian sleeping sickness in savannah areas: Man-like traps for tsetse flies. PLoS Negl. Trop. Dis. 2012, 6, e1978. [Google Scholar] [CrossRef] [Green Version]
  92. Sindato, C.; Malele, I.I.; Mwalimu, C.; Nyingilili, H.S.; Kaboya, S.; Kombe, E. Seasonal epidemiological variation of human African trypanosomiasis in Babati District, Tanzania. Tanzania J. Health Res. 2007, 9, 136–139. Available online: https://www.ajol.info/index.php/thrb/article/viewFile/14317/2681 (accessed on 18 December 2019). [CrossRef]
  93. Nnko, H.J.; Ngonyoka, A.; Salekwa, L.; Estes, A.B.; Hudson, P.J.; Gwakisa, P.S.; Cattadori, I.M. Seasonal variation of tsetse fly species abundance and prevalence of trypanosomes in the Maasai Steppe, Tanzania. J. Vector Ecol. 2017, 42, 24–33. [Google Scholar] [CrossRef] [PubMed] [Green Version]
  94. Lukaw, Y.S.; Abdelrahman, M.M.; Mohammed, Y.O.; Ochi, E.B.; Elrayah, I.E. Factors influencing seasonal abundance of Glossina fuscipes fuscipes (Glossina: Glossinidae) in Kajo-Keji County, South Sudan. Curr. Res. J. Biol. Sci. 2014, 6, 222–228. [Google Scholar] [CrossRef]
  95. Rutto, J.J.; Osano, O.; Thuranira, E.G.; Kurgat, R.K.; Odenyo, V.A.O. Socio-economic and cultural determinants of human African trypanosomiasis at the Kenya–Uganda transboundary. PLoS Negl. Trop. Dis. 2013, 7, e2186. [Google Scholar] [CrossRef] [Green Version]
  96. Shereni, W.; Anderson, N.E.; Nyakupinda, L.; Cecchi, G. Spatial distribution and trypanosome infection of tsetse flies in the sleeping sickness focus of Zimbabwe in Hurungwe District. Parasites Vectors 2016, 9, 605. [Google Scholar] [CrossRef] [PubMed] [Green Version]
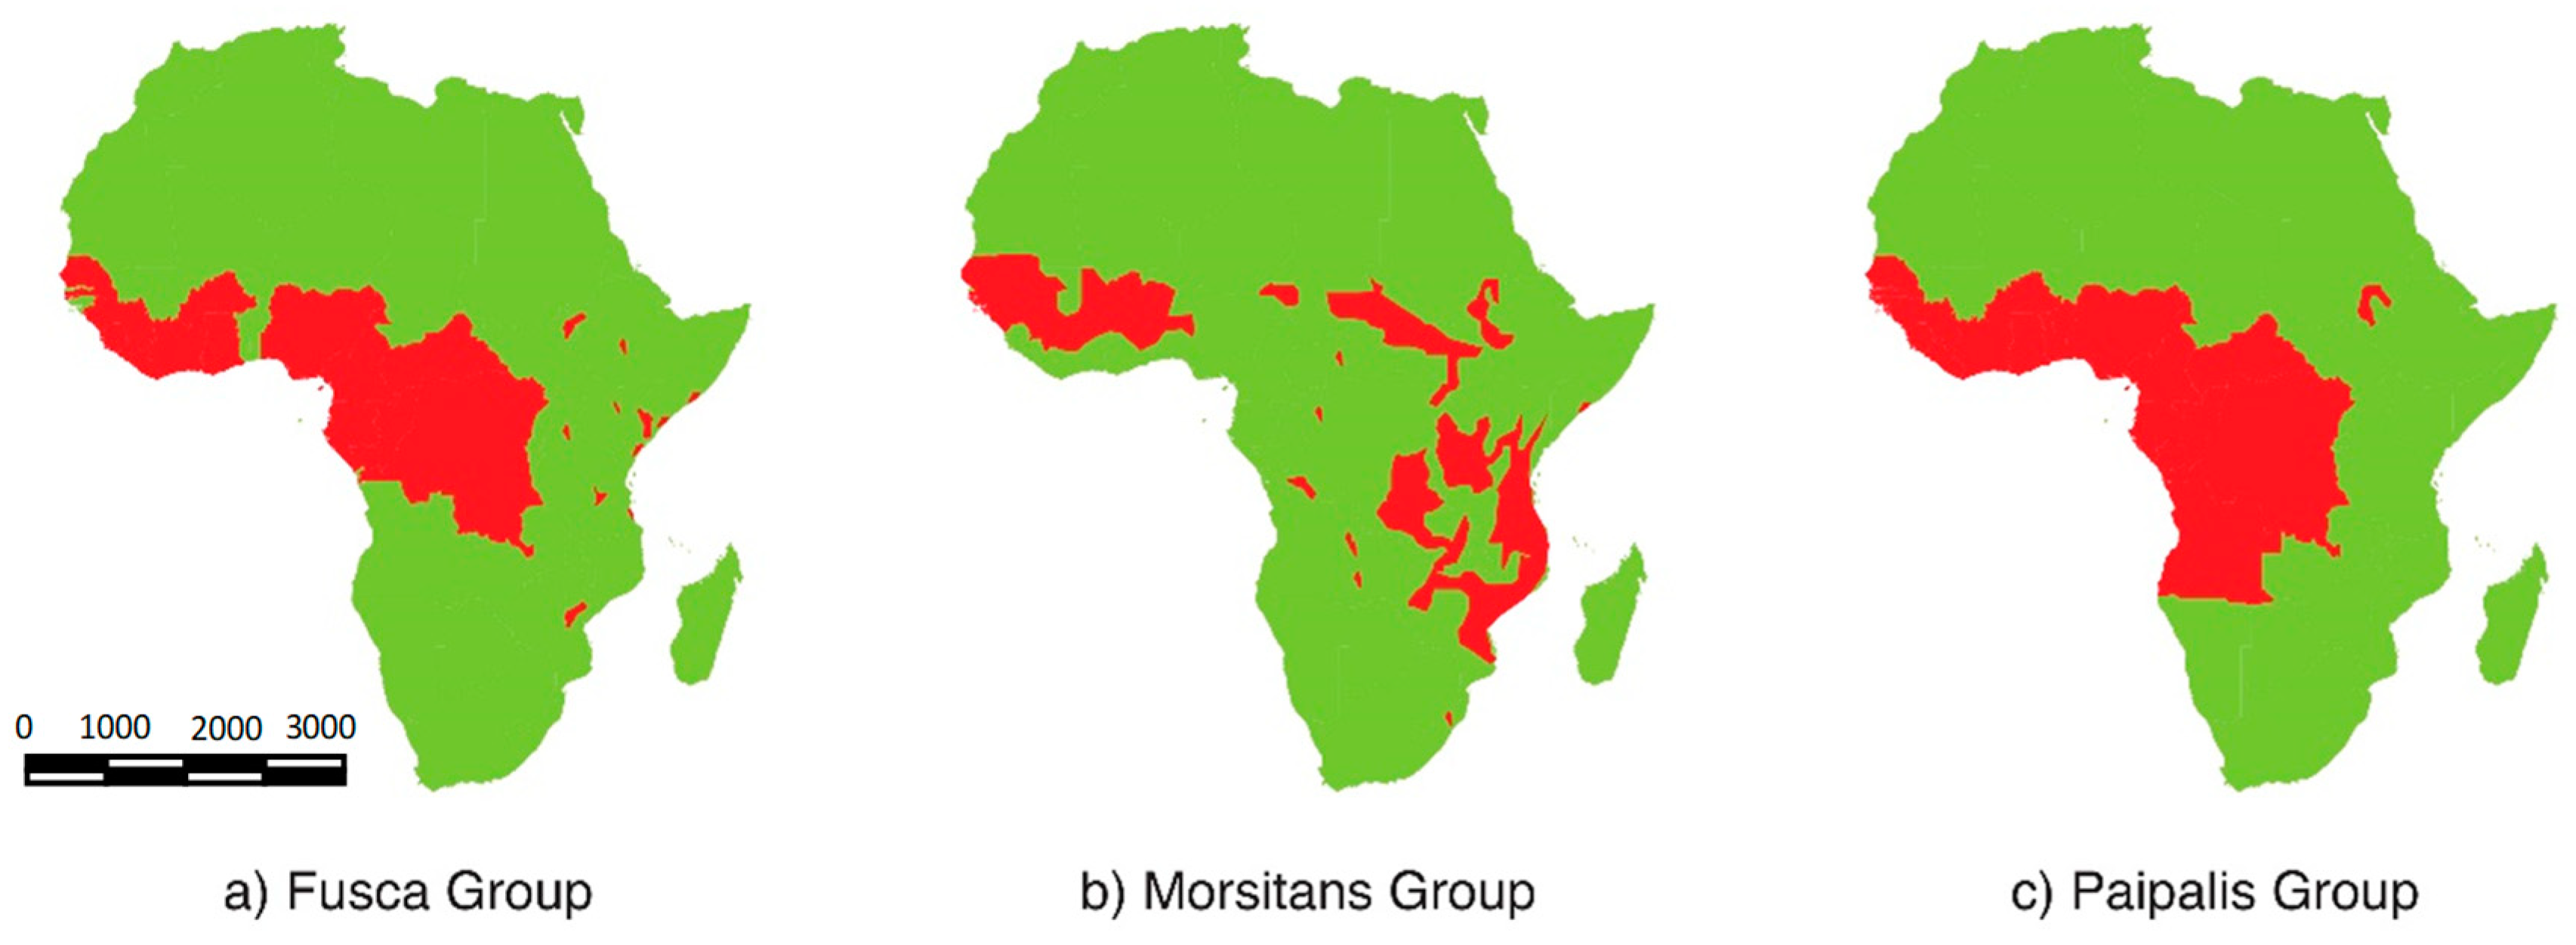
Figure 1. Predicted distribution of tsetse fly in Africa, 2000 (Source: [10]).
Sustainability 12 01599 g001
Figure 2. Life cycle of trypanosomes [4].
Sustainability 12 01599 g002
Figure 3. Historical distribution of the three major tsetse species in Uganda, 1982 [10]. Maps have been recreated by the authors of this article.
Sustainability 12 01599 g003
Figure 4. Sleeping sickness epidemic cycles in Uganda (Source: [22]).
Sustainability 12 01599 g004
Figure 5. Location of the Karamoja sub-region.
Sustainability 12 01599 g005
Figure 6. A 10 × 10 km grid network guide for team and trap deployment.
Sustainability 12 01599 g006
Figure 7. A biconical trap at one of the field sites.
Sustainability 12 01599 g007
Figure 8. Focus group discussions (FGD) in Sidok sub-county.
Sustainability 12 01599 g008
Figure 9. A research team at Usake with the herd of rustled cattle recovered by the Uganda People’s Defense Forces (UPDF) from the Toposa of South Sudan.
Sustainability 12 01599 g009
Figure 10. Spatial distribution of tsetse flies in northern Karamoja (Source: primary data).
Sustainability 12 01599 g010
Figure 11. Tsetse dispersal routes in Karamoja (Source: participatory assessment data). The reddish-brown arrows denote tsetse emerging from Kidepo Valley National Park in northern Karamoja. The purple arrows denote the tsetse perceived to be coming from West Pokot in Kenya.
Sustainability 12 01599 g011
Figure 12. Prediction of tsetse prevalence for the three major species in Uganda in 2011 (Source: [63]).
Sustainability 12 01599 g012
Table 1. Geographical comparison of the distribution of tsetse in Kaabong and Kotido districts.
AltitudeKaabongKotidoSEP-value
Parameter
Tsetse Males20.698 a1.033 b4.129030.0101
Tsetse Females23.893 a3.1 b4.137410.0008
Tsetse Total44.59 a4.13 b8.133390.0026
Tsetse FTD14.864 a1.378 b2.711130.0026
Means with different superscripts within a row are significantly different at p ≥ 0.05.
Table 2. Historical timeline of events and tsetse prevalence in the Karamoja sub-region.
Colonial Period through 1950sPost-Colonial Period 1962–Early1970s1970s–Early 2000sMid-2000s to Post–Disarmament Period
Sustainability 12 01599 i001 Sustainability 12 01599 i002 Sustainability 12 01599 i003 Sustainability 12 01599 i004
Colonial administration was established in Karamoja with several effects including the well-established subdivision of cultural groupings in Karamoja. Tsetse was recognised as a problem in the region and a control camp was established at Lolelia. A camp was also located on the fertile lands of Lokapir and Naperetom. This group used to kill wildlife, including elephants, as trophies. This was perhaps the worst time for wildlife and livestock. Cattle were herded and confined to the east of Karamoja. Post-colonial government recognised the tsetse menace in the sub-region. A tsetse control officer called Ayela had been posted to Karamoja who established a camp in Kotido and parts of Kaabong closer to Kidepo Valley. Control mechanisms, including a gazette of communities in one location/camps and mobilising able-bodied men to cut and burn all bushes and trees. Much vegetation was cut, transforming woodlands into open grasslands. Evidence of these remnant tree trunks can be observed at the Kidepo Valley. In addition, herbicides that killed everything including bees (non-selective) were used in the eradication efforts. At the fall of the Obote I government in the early 1970s, Karamojong acquired guns after overrunning the Moroto barracks. Light weapons made entry into the life of the pastoral community in this region. Ayela was killed by Amin’s soldiers, and this marked the end of the tsetse eradication efforts in the region. Ayela, a re-known tsetse eradication officer, had been killed in the early 1970s. The Karamojong were now armed, and the rapid proliferation of light weapons became more prominent in the sub-region. Governance systems collapsed with regards to public authority and administration. Intense livestock rustling and wildlife poaching became prominent. Wildlife were confined into the Kidepo National Park, which became more like a refuge centre. This period also represented a period of obscurity of the Karamoja sub-region from government investment, and Karamoja was viewed as a problem to the neighbouring communities in Teso, Lango, Sebei and Acholi. In the mid-2000s approximately 2003, a disarmament exercise by the Government of Uganda was initiated. First, there was a peaceful disarmament involving voluntary declaration and return of guns to the Uganda People’s Defense Forces (UPDF). Failure to achieve success and continued counter raids, forced the Government of Uganda to launch a forceful disarmament exercise. Upon the disarmament, the UPDF then provided security to communities and herders. This marked the return of normalcy and ‘peace’ in the region. The wildlife that had hitherto been confined to Kidepo Valley National Park slowly started to return to graze in the outskirts of the National Park, especially during the dry season. With the return of the wildlife, the reinvasion of tsetse was first reported in Kaabong and Kotido. As the wildlife continues to routinely return to the grazing and waterholes outside the park, the prevalence of tsetse is also intensifying.
Table 3. Livestock owned and livestock sold.
LivestockLivestock OwnedLivestock Sold
Affected by Tsetse
(N = 76)
Not Affected by Tsetse
(N = 75)
Affected by Tsetse
(N = 76)
Not Affected by Tsetse
(N = 75)
Cattle5.8 ± 5.55.8 ± 7.71.3 ± 1.91.1 ± 1.6
Sheep20.6 ± 84.56.8 ± 12.72.4 ± 4.51.1 ± 2.4
Donkeys0.8 ± 1.90.7 ± 1.30.1 ± 0.50.1 ± 0.9
Goats11.3 ± 21.38.3 ± 9.62.7 ± 3.41.7 ± 2.5
Table 4. Ranked order of the absorptive capacity to tsetse invasion.
Absorptive CapacityHighMediumLowNoABCIRank
Diversified economic activities1454711571
Access to financial services132918161152
Livestock off-take23526131023.5
Bush burning112323181023.5
Seeking loan facility 4351720995
Table 5. Ranked order of the adaptive capacity to tsetse invasion.
Adaptive CapacityHighMediumLowNoADCIRank
Access to drugs5913402071
Deployment of paravets (CAHWs)5220402002
Access to information and early warning systems25361231593
Diversification of livestock17421161464
Temporary migration2113627645
Table 6. Ranked order of the transformative capacity to tsetse invasion.
Transformative CapacityHighMediumLowNoTRCIRank
Tsetse control infrastructure 3829811801
Access to extension services (entomologists)34251431662
Sedentary level6392741233
Urbanization1113529604
Table 7. Principal component analysis factor loadings.
FactorComp1Comp2Comp3Comp4Comp5Comp6Unexplained
Livestock off-take0.1338−0.2675−0.24490.42270.3244−0.23390.2871
Access to financial services−0.3083 0.34020.38080.24250.14110.2371
Seeking a loan facility −0.3816 0.31840.3436−0.05560.17550.1939
Diversified economic activities0.31890.3586−0.13080.1810−0.19070.20190.2768
Bush burning0.3650 0.1085 −0.13840.37790.4266
Diversification of livestock0.2767−0.13510.2258 0.40520.53650.2222
Temporary migration 0.09290.1782−0.48800.2928−0.20900.24880.3173
Deployment of paravets (CAHWs) *0.3971 0.2630 0.1318−0.17750.3587
Access to information and early warning systems0.3327−0.32710.18040.2127−0.12200.07410.3053
Access to drugs0.1950−0.31400.19800.2766−0.2799−0.45270.249
Tsetse control infrastructure0.20340.42640.24280.2544−0.2356−0.20630.2206
Urbanization−0.1928−0.1585−0.29200.4505−0.14970.13980.3682
Sedentary level 0.16620.2266−0.25940.14370.6075−0.22350.2373
Access to central extension services (entomologists)−0.09390.52990.22900.16930.1096−0.08540.2581
* Community Animal Health Workers (CAHWs).
Table 8. Resilience index.
Variable25th Percentile50th Percentile75th PercentileMeanStd. Dev. (Mean)MinMax
Resilience Index1.08022.22853.05262.0526751.304063−0.59054.8386
Rescaled Resilience Index0.30770.51920.67100.48685320.240198701