Article

The Correlation between Soil Nutrient and Potato Quality in Loess Plateau of China Based on PLSR

1
College of Life Sciences, Yan’an University, Yan’an 716000, Shaanxi, China
2
College of Agricultural Equipment Engineering, Henan University of Science and Technology, Luoyang 471000, Henan, China
*
Author to whom correspondence should be addressed.
Sustainability 2020, 12(4), 1588; https://doi.org/10.3390/su12041588
Submission received: 17 January 2020 / Revised: 12 February 2020 / Accepted: 19 February 2020 / Published: 20 February 2020
(This article belongs to the Special Issue Agroecology in Sustainable Agriculture)

Abstract

:
Potato tuber quality is influenced by the interaction of soil nutrients. Hence, simple correlation analysis cannot accurately reflect the true relationship between soil nutrients and potato tuber quality. In this study, potato tuber quality and soil nutrient content were used as research materials in the Loess Plateau of China. The partial least square regression (PLSR) method was used to establish the regression equation between potato quality and soil nutrient. The major soil nutrient indexes influencing potato quality were screened out to provide theoretical basis for potato field management. The results showed that the major soil nutrient factors influencing the potato tuber quality in Loess Plateau were soil ammonium nitrogen, soil nitrate nitrogen, soil available phosphorus, pH, and soil available potassium. Soil pH value is the most important factor affecting potato starch, reducing sugar content, and soluble protein content. Soil nitrate nitrogen is one of the important factors affecting potato tuber soluble total sugar content, vitamin C, browning intensity, and polyphenol oxidase activity. Soil ammonium nitrogen was positively correlated with the total soluble sugar content of potato tubers, and negatively correlated with reducing sugar content, browning intensity, and polyphenol oxidase activity. However, soil available potassium has positive effects on potato starch and reducing sugar content, and negative effects on soluble protein and browning strength. Results of this study indicates that the major soil nutrient factors influencing potato tuber quality were soil nitrate nitrogen and soil pH value.

1. Introduction

Potato (Solanum tuberosum L.) is a highly adaptable crop. The potato planting area in the loess plateau region accounts for 36% of the total potato planting area in China [1]. On one hand, the potato is rich in starch, protein, vitamin C, sugar, and various mineral salts, which have high nutritional value in food [2]. On the other hand, the potato is an important raw material for making starch, alcohol, scrubbing solution, and citric acid, which have high economic value [3]. In potato processing and consumption, people have different quality requirements for tubers. Therefore, it is of great significance to study the relationship between soil nutrient content and potato tuber quality.
The potato tuber quality is very important to the processing industry, and the economic benefit can be improved by increasing the specific quality content and reducing the quality content of the negative effect in the process [4]. Potato starch, a representative of tuber starches, is the third largest starch raw material, with about 6% global starch production [5]. The starch content of raw potato could be improved by scientific field management and fertilization. Browning reaction often occurs during the processing of fresh potato tuber, which leads to the decrease of the quality and nutritional value of processed products [6]. The quality of potato raw material is necessary in industrial production [7]. It is important to select high-quality potato tubers that meet the requirements of deep processing to reduce the production cost.
Potato quality is influenced by its genetic factors and external environment, and most of them cannot be controlled by humans. In modern agricultural production, the factors that can be artificially regulated are field management, and water and fertilizer management, which regulate the soil microenvironment in which crops grow [8,9,10]. Soil microenvironment is the carrier of plant growth and provides nutrients for its development. Soil organic matter is the most important indicator of soil health, which influences the crop yield [10,11]. Soil organic matter and nutrient cycling are mediated by soil microbial communities [12,13], soil-dwelling arthropods [14], and soil-nesting bees [15]. Soil organic matter and other soil nutrients are affected by the chemical composition of plants [16] and soil-plant-grazing animal interactions [17,18]. Nitrogen is one of the major mineral nutrients absorbed by potato, and application of nitrogen fertilizer can significantly improve potato absorption and transformation [19,20].
Studies have shown that increasing nitrogen fertilizer can increase the soluble protein content in potato tubers, while excessive nitrogen fertilizer can reduce the content of starch, soluble sugar, and vitamin C [20]. The application of potassium fertilizer can promote the accumulation of tuber dry matter, the synthesis of crude starch, vitamin C, and soluble protein [21]. The suitable amount of potash fertilizer can reduce the potato tuber reducing sugar content [22]. Reasonable application of phosphate fertilizer is beneficial to increase the content of potato starch, improve the quality of starch, and promote the absorption of nitrogen [23]. Suitable application of NPK had a significant effect on the quality of potato tuber [24]. The content of starch, vitamin C, and reducing sugar in tuber increased with the increase of fertilizer application [25]. In recent years, researchers have focused on the effects of water and fertilizer management on potato yield and quality, and there are few studies on the correlation between soil nutrients and potato quality. The transformation process of applied fertilizer into soil nutrients is affected by soil type, rainfall, and other factors, and only part of nutrients will eventually participate in the growth and development of crops. Therefore, the study of the correlation between soil nutrients and potato quality can provide a theoretical basis for accurate fertilization.
Soil nutrients interact with each other and affect potato tuber quality together [26]. Therefore, simple correlation analysis cannot accurately reflect the true relationship between soil nutrients and fruit quality. When the correlation between the independent variables is strong or the sample is small relative to the independent variables, the model error established by the common multiple regression method will become larger. Partial Least Squares Regression (PLSR) is a regression modeling method of multiple dependent variables to multiple independent variables [27]. It focuses on the basic skills of multiple linear Regression analysis, canonical correlation analysis, and principal component analysis, which can better decompose and filter the obtained data, and establish a stable Regression model. The theory and method of PLSR have developed rapidly since it was proposed, and its application field has also expanded rapidly from the initial chemical field to more natural and social sciences. PLSR also provides several ancillary techniques for further analysis of data, one of which is Variable Importance for Projection (VIP). The VIP technique is based on PLSR analysis. A method of variable selection, VIP value argument not only reflects the influence of the dependent variable, the variable itself, and considered other independent variables indirectly affect the dependent variable through the variable. The VIP technical analysis is not to screen variables according to the P-value, but to make reasonable selection according to the effect of independent variables on dependent variables. Therefore, data processing emerges in the research in this field that is more in line with the actual situation.
In this study, potato tuber samples and soil samples were collected from different counties in the Loess Plateau of China. The PLSR method was used to establish the regression equation between potato tuber quality and soil nutrient. The objective of this study was (1) to analyze the correlation between soil nutrient contents and potato tuber quality; (2) to determine the major soil nutrient factors influencing potato tuber quality by PLSR method. Results will provide the theoretical basis for producing high-quality potatoes that meet the requirements of food consumption or deep processing, and reducing the fertilizer waste.

2. Materials and Methods

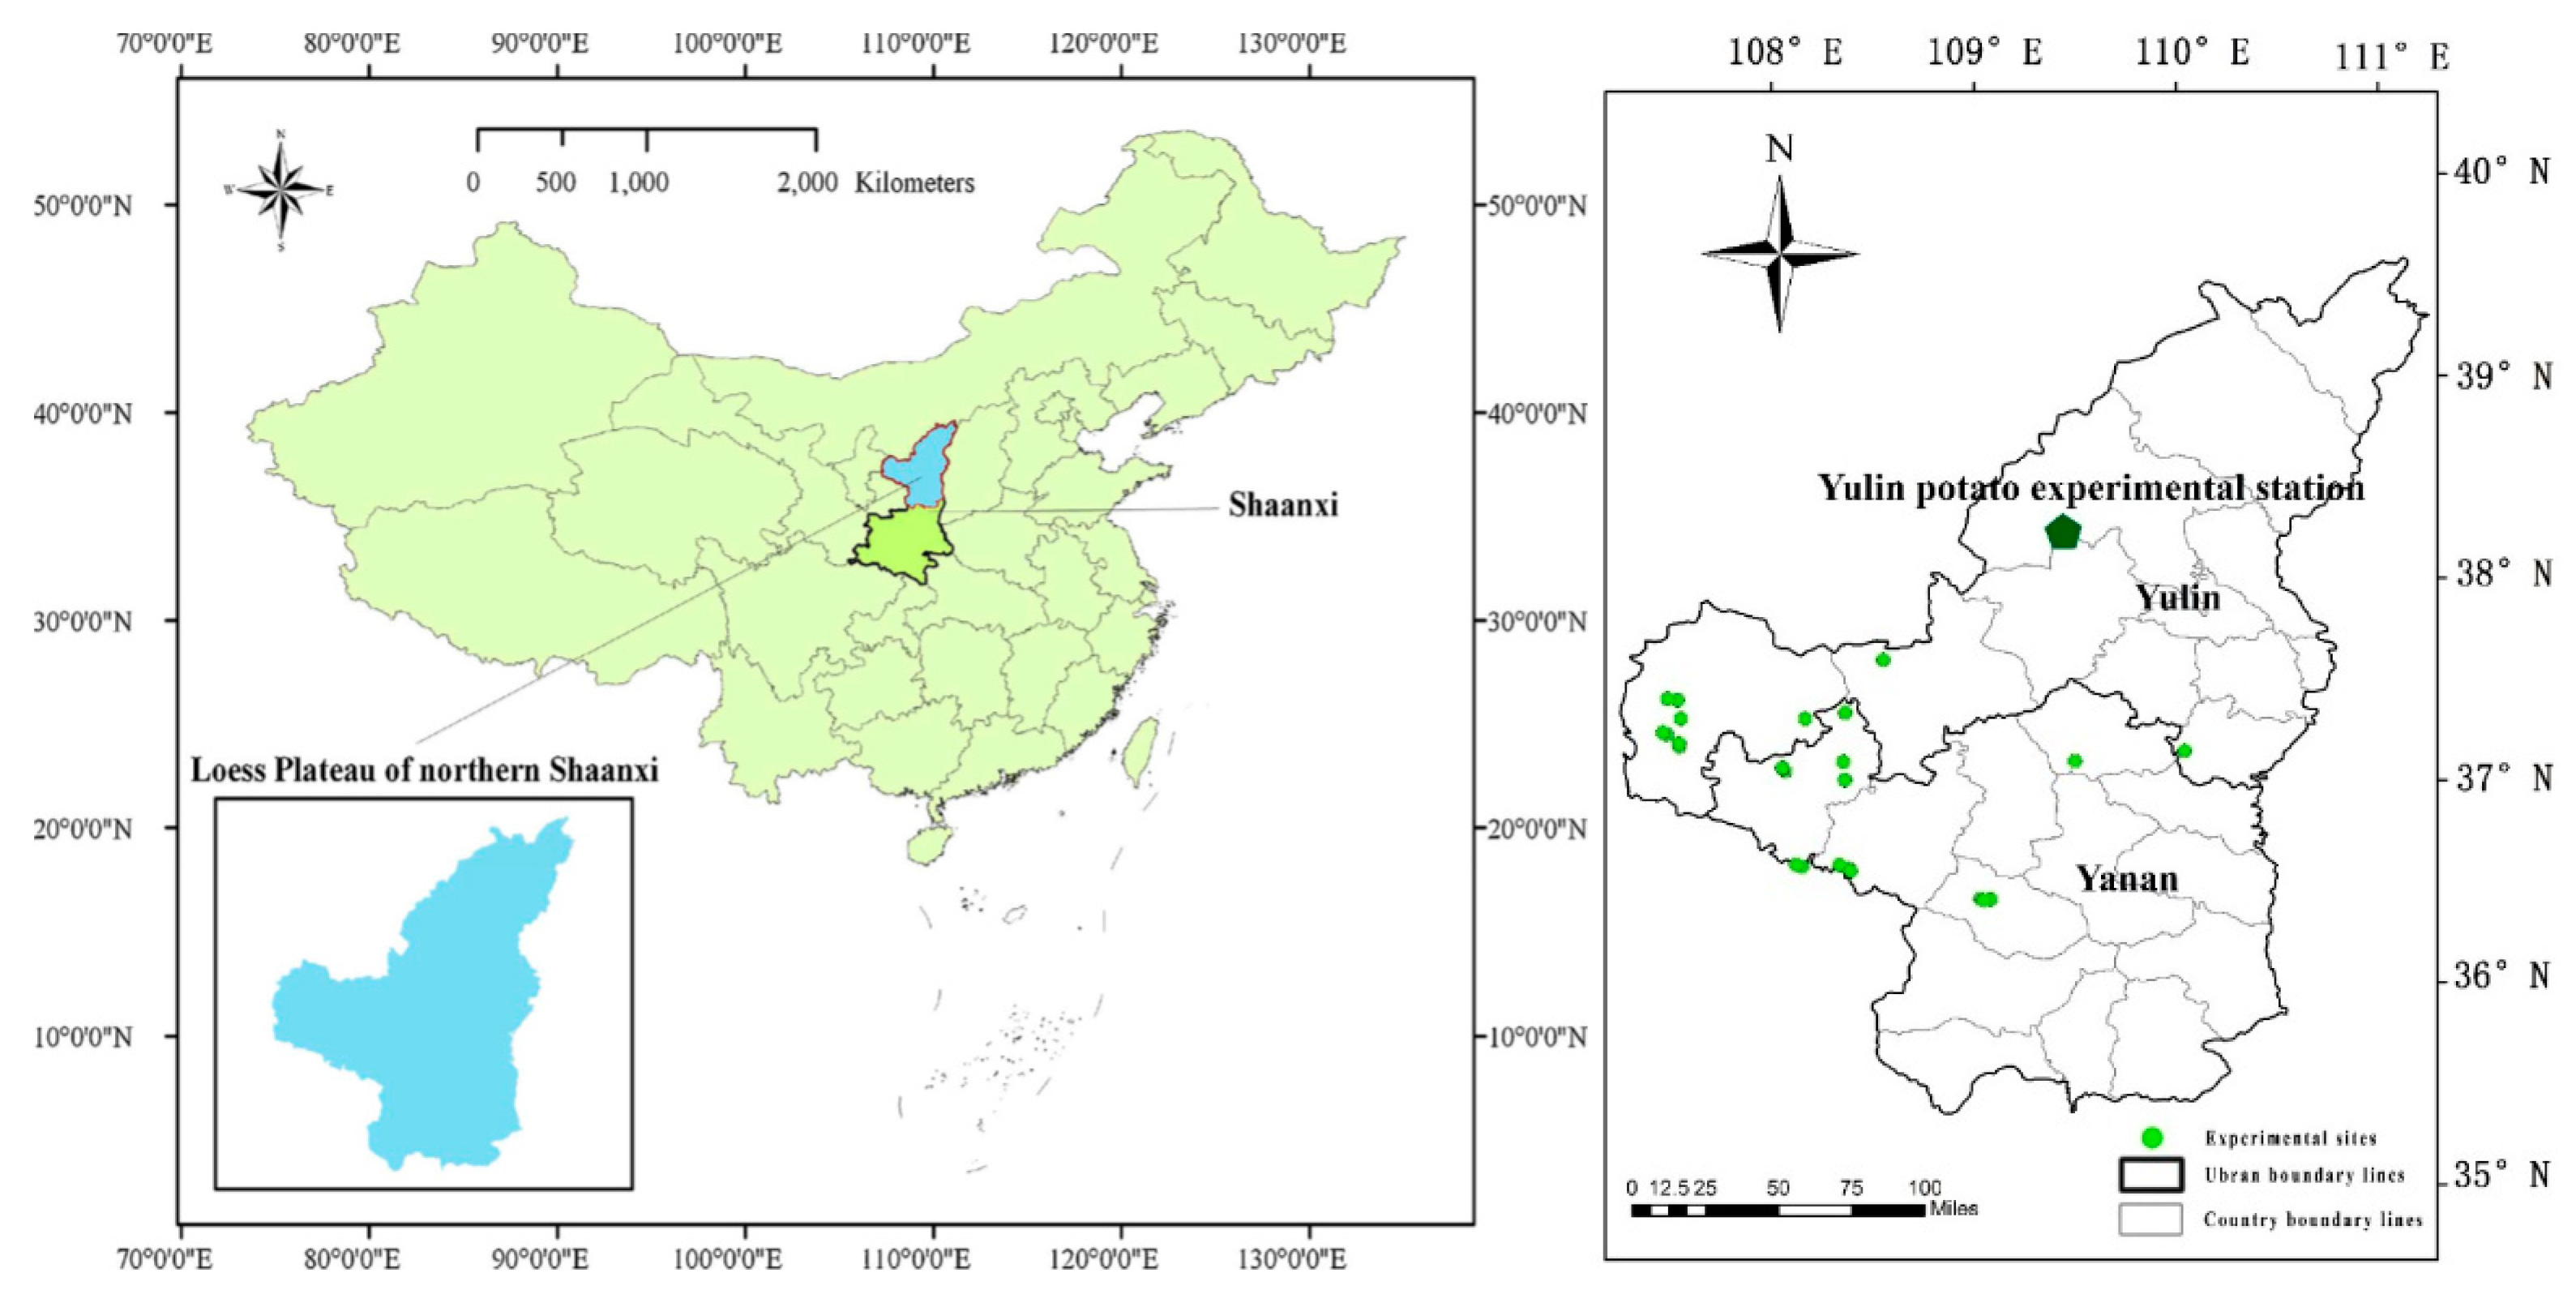
2.1. Site Description

The experiment was conducted in 10 counties in China’s Loess Plateau region from 2017 to 2019 (36°40′–39°21′ N, 108°46′–109°44′ E, altitude of 772–1320 m above sea level), which belongs to the typical loess hilly landform of loess tableland, with arid and semi-arid continental monsoon climate (Figure 1). The average annual rainfall ranges from 300 to 700 mm. The average annual temperature is 9 °C. The no-frost cycle ranges from 156 to 205 days. The soil type mainly includes the yellow spongy soils and the wind sand. The average sand, silt, and clay contents in the 0–80-cm soil profile was measured with a laser particle size analyzer (Dandong Haoyu Technology Co., Ltd.), and the values were 53.2%–81.1%, 11.32%–3.2%, and 7.6%–21.4%, respectively.

2.2. Collection and Analysis of Soil Samples and Potato Tuber Samples

Distances between sampling locations were average 30 km, and potato fields with an area of more than 0.2 ha were randomly selected. The potato experimental station sampling sites were selected according to the variety of potato, and the amount of fertilizer and applied irrigation throughout the whole growth period. The global positioning system (GPS, Qstarz International Co., Ltd., Taipei, Taiwan) is used to record the name, longitude, and latitude of the sample plot. The planting and fertilization of the sample plot are also collected and recorded. The plant and row spacing of potatoes were measured with a tape. Potato and soil samples are collected, labeled, and sealed, and taken to the laboratory for analysis. After the potato and soil samples had been collected, they were marked and sealed and taken back to the laboratory for analysis.
Potato tuber samples are collected from the fields and experimental stations from September 1 to September 18 each year. The weight fresh tuber (g plant−1) was determined by harvesting 10 plants from the center row of the plot. Soil samples and potato tuber samples were collected simultaneously. Soil samples and potato tuber samples were collected simultaneously. Soil samples were collected at three horizontal collection points: 10 cm from the plant, 30 cm toward the furrow, and 30 cm toward the ridge. The soil samples were collected through a soil auger (4 cm inner diameter, TC-300B, Changzhi, China) from each plot.
The soil water content was measured using the gravimetric method [29]. After collection from the field, the soil water content of each sampled soil layer was determined by weighing to a constant weight at 105 °C. Determination of soil organic matter content was performed according to Zhang et al. [30]. Soil available nitrogen was determined as described by Sun et al. [31]. The concentration of soil nitrate nitrogen and ammonium N were measured using a spectrophotometer (UV-1800, China) [32,33]. First, 0.5 g of fresh soil was put into a 100 mL triangular bottle. In addition, 50 milliliters of 2 mol/L potassium chloride and the solution were added together. The solution was shaken for half an hour and reached uniformity. The solution was then filtered, and 5 mL was placed in a spectrophotometer at a wavelength of 210 nanometers. Determination of soil available phosphorus was performed according to Lu et al. [34]. We measured soil available potassium by flame photometry method with NH4OAc extraction [35]. The pH was measured in an aqueous soil extract in deionized water (1:5 soils: water) [32].
The starch content was determined as described by Wang et al. [36]. We measured reducing sugar content by the 3,5-2 nitrosalicylic acid colorimetric method [20]. Determination of soluble total sugar content was performed according to Paul et al. [37]. The vitamin C content was measured by molybdenum blue colorimetry [38]. The soluble protein content was determined as described by Liu et al. [39]. Determination of browning intensity was performed according to Nguyen et al. [40]. The potato polyphenol oxidase activity was determined using the method described by Gomes et al. [41] for the use of a 100 mM citrate acid–200 mM sodium phosphate buffer between pH 3.0 and 8.0. The enzyme extract (0.5 mL) was added to the quartz test tube and a buffer solution containing phenolic substrate (2.5 mL) was added. The initial absorbance was measured at 420 nm. PPO activity was measured by measuring the absorbance growth rate at 420 nautical miles during a 30-minute incubation period. A unit of enzyme activity was defined as a 0.001 per minute change per milligram of protein absorbed in the enzyme extract. All tests were performed in independent biological samples.

2.3. Simple Linear Regression

Simple linear regression analysis uses linear predictive functions to model, and unknown model parameters are estimated by data. Simple linear regression analysis consists of only one independent variable and one dependent variable, and the relationship between them can be approximated by a straight line. In this study, the soil nutrient contents and potato tuber quality, X, is assumed with linear relationship with the potato tuber yield, C. The regression is expressed as C= ax + b, where a is the coefficient and C is the predicted concentration.

2.4. Partial Least Squares Regression

Partial least square regression analysis (PLSR) is a multivariate statistical data analysis method proposed in 1968 [42], which is the integration and development of multiple linear regression, canonical correlation analysis, and principal component analysis. PLSR method is a kind of regression modeling method that studies multiple independent variables to multiple dependent variables or single dependent variables. It solves the problem of multiple correlation of independent variables in typical regression analysis, that is, there is high correlation between independent variables. In this study, the PLSR method of multiple independent variables to single dependent variables is adopted. The main ideas of PLSR are as follows: First, extract th (h = 1,2, …) from the set of independent variables X, the components are independent of each other. Second, to establish the regression equation of these components and the independent variable X, the key lies in the extraction of components. The difference between PLSR and principal component regression is that the components extracted by PLSR can not only well summarize the information in the independent variable system, but also best explain the dependent variable. Therefore, the problem of regression modeling in the case of multiple correlations between independent variables is solved effectively. The calculation process is as follows:
(i) Standardized processing of data. The purpose of data standardization is to make the center of gravity of the collection of sample points coincide with the origin of coordinates. The independent variable set X and dependent variable Y are normalized to obtain the matrix of independent variable and dependent variable following normal distribution.
E 0 = [ x i j x j ¯ s j ] n × p F 0 = [ y i j y ¯ s y ] n × 1 i = 1 , 2 , , n ;   j = 1 ,   2 ,   , p .
where E0 is the normalized matrix of X, and F0 is the normalized matrix of Y; x j ¯ and s j are the mean and standard deviation of the jth independent variable; y ¯ and s y are the mean and standard deviation of y.
(ii) Find the objective function value of the optimization problem. Let’s first extract a component t 1 = E 0 w 1 from the matrix E 0 , w 1 is the first spindle of E 0 , and w 1 is the unit vector w 1 = 1 . Next, we extract a component, u 1 = F 0 c 1 , from the matrix F 0 , c 1 is the first spindle of F 0 , and c 1 is the unit vector u 1 = 1 . If t 1 and u 1 are required to represent data variation information in X and Y, there are Var ( t 1 ) and Var ( u 1 ) Max . In addition, according to the canonical correlation analysis, independent variables are required to have good explanatory ability for dependent variables, namely, the correlation coefficient r ( t 1 ,   u 1 ) Max of t 1 and u 1 . In general, the covariance of t 1 and u 1 is required to be maximized in partial least square regression. The results are as follows.
C o v ( t 1 ,   u 1 ) = Var ( t 1 ) Var ( u 1 )   r ( t 1 ,   u 1 ) max
Therefore, it can be transformed into the problem of finding the maximum value of w 1 T E 0 T F 0 c 1 under the constraint condition of w 1 = 1 , and u 1 = 1 . Lagrange algorithm is adopted.
s = w 1 T E 0 T F 0 c 1 λ 1 ( w 1 T w 1 1 ) λ 1 ( c 1 T c 1 1 )
Then take the partial derivatives of s with respect to w 1 , c 1 , λ 1 , and λ 2 , respectively, and set them to 0.
s w 1 = E 0 T F 0 c 1 2 λ 1 w 1 = 0 s c 1 = F 0 T E 0 w 1 2 λ 2 c 1 = 0 s λ 1 = ( w 1 T w 1 1 ) = 0 s λ 2 = ( c 1 T c 1 1 ) = 0
By the above, formula 4 can launch 2 λ 1 = 2 λ 2 = w 1 T E 0 T F 0 c 1 , and make θ 1 = 2 λ 1 = 2 λ 2 = w 1 T E 0 T F 0 c 1 . Therefore, θ 1 is the objective function value of our optimization problem.
(iii) Find the model effect load. By substituting θ 1 into the above four formulas, we can arrive at the following equation:
{ E 0 T F 0 F 0 T E 0 w 1 = θ 1 2 w 1 F 0 T E 0 E 0 T F 0 c 1 = θ 1 2 c 1
where w 1 is the maximum eigenvalue of matrix E 0 T F 0 F 0 T E 0 unit characteristic vector, c 1 is the maximum eigenvalue of matrix F 0 T E 0 E 0 T F 0 unit characteristic vector. When we get w 1 and c 1 , we get the principal components t 1 = E 0 w 1 and u 1 = F 0 c 1 . And then the regression of E 0 and F 0 on t 1 .
{ E 0 = t 1 p 1 T + E 1 F 0 = t 1 r 1 T + F 1
where p 1 and r 1 are regression coefficient vectors, E 1 and F 1 are residual matrix. The least square estimation of the regression coefficient vector is p 1 = E 0 T t 1 t 1 2 , and r 1 = F 0 T t 1 t 1 2 , and p 1 , and r 1 are called model effect loads.
(iv) Find the regression equation. If the accuracy of the regression equation of y to t 1 fails to meet the requirements, the second component shall be extracted. In this case, E 0 and F 0 shall be replaced by residual matrix E 1 and F 1 , and the spindle w 2 and c 2 , as well as the second principal components t 2 and u 2 shall be obtained again by the same method. If the rank of F 0 is m, then there is always m components t1, t2, … tm, find F0 regression on t1, t2, …, tm. The following formula is obtained.
F 0 = t 1 r 1 T + t 2 r 2 T + + t m r m T + F m
Because t1, t2, …, tm is a linear combination of E0. Therefore, the above equation can be reduced to the regression equation of y F 0 for the x j E 0 . The following formula is obtained.
y = α 1 x 1 + α 2 x 2 + + α m x m + F m
Finally, the inverse change normalization process reduces the regression equation of y with respect to x i to the regression equation of X and y.

2.5. Statistical Analysis

The variable importance for projection (VIP) belongs to a multivariate screening method, which describes the explanatory ability of independent variables to dependent variables through the principal component of related independent variables synthesis, and screens the independent variables according to the explanatory ability. Statistical analyses and data plotting were performed using SPSS Statistics Software 16.0 and Sigma Plot 14.0, respectively. The differences between all treatments were detected using Tukey’s multiple comparisons tests at the 0.05 significance level. In addition, the relationships among all the parameters (soil nutrient contents and potato tuber quality) was calculated using bivariate correlation analysis (Pearson correlation coefficients and a two-tailed test of significance).

3. Results

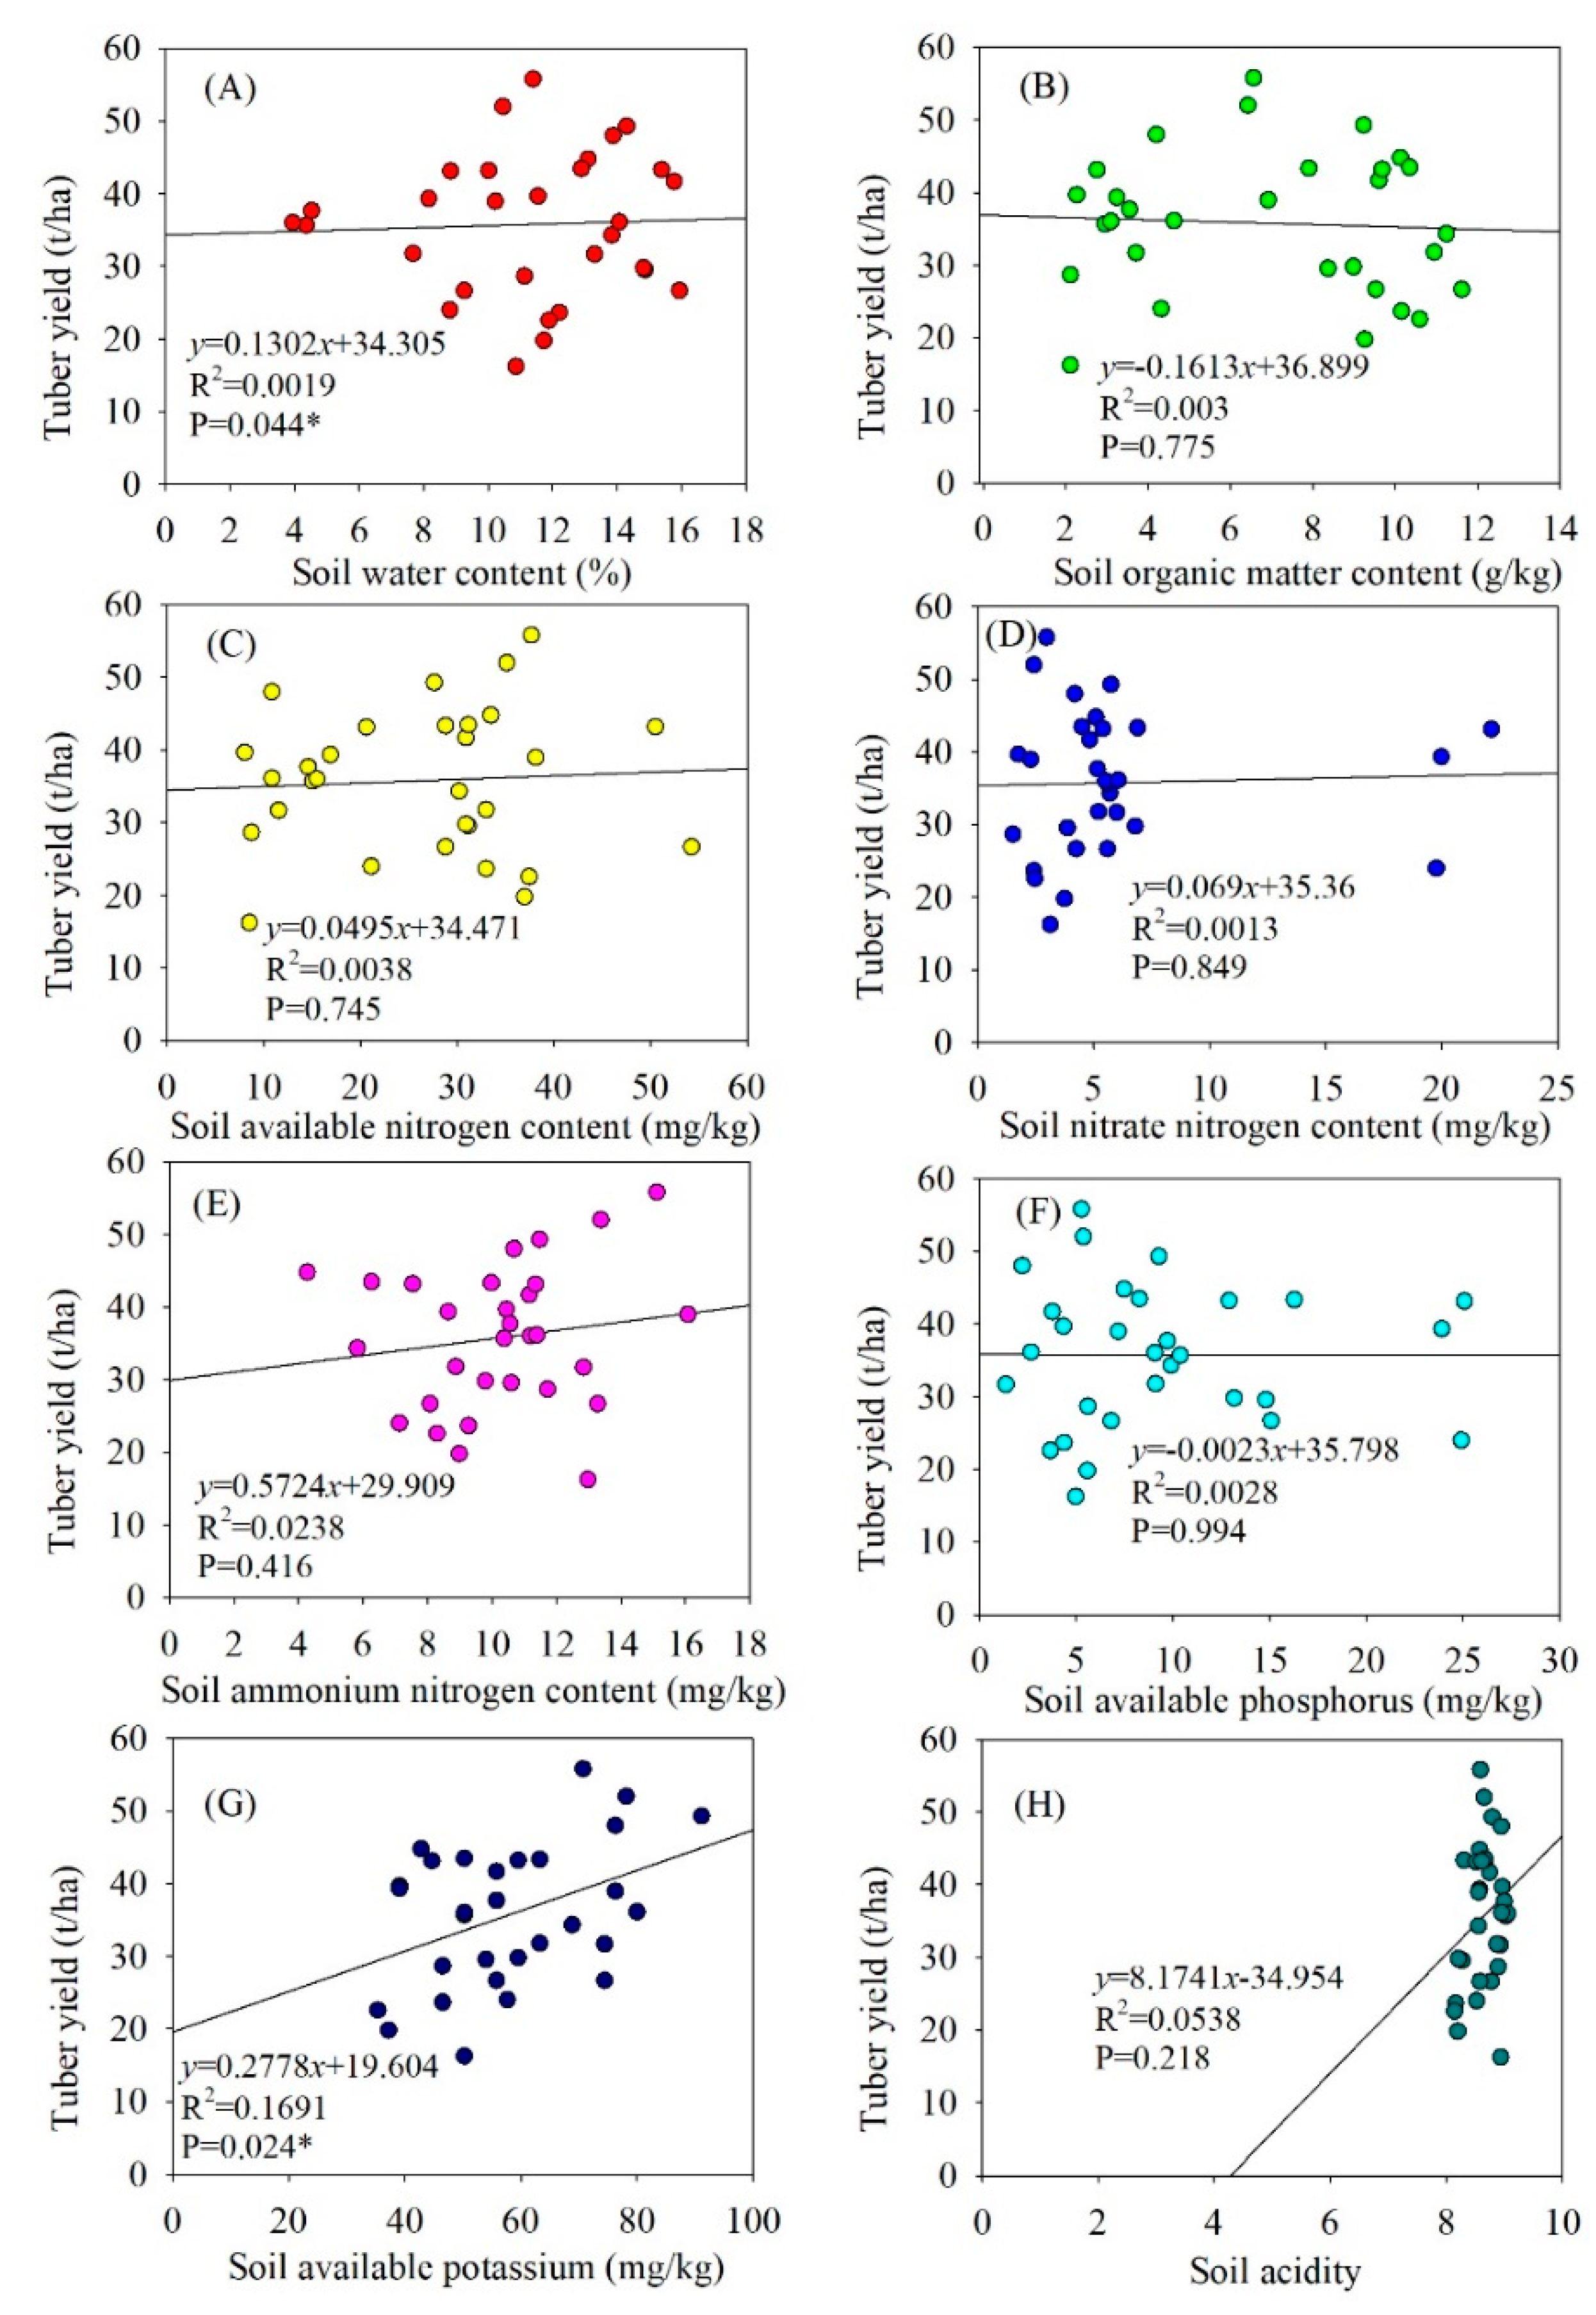
3.1. Linear Regression Analysis of Potato Yield and Soil Nutrient Contents

The linear regression analysis of potato tuber yield and soil nutrient contents is shown in Figure 2. The results showed that soil available potassium content and soil water content.
(Figure 2G) were significantly correlated with potato yield, while potato yield was not significantly correlated with other soil nutrient contents. Potato tuber yield increased with the increase of soil water content, soil available nitrogen content, soil nitrate nitrogen content, soil ammonium nitrogen content, soil available potassium content, and pH (Figure 2). The potato tuber yield decreased with the increase of soil organic matter content and soil available phosphorus content (Figure 2). The maximum determination coefficient (R2) of potato yield and soil available potassium content was 0.169 (Figure 2G).

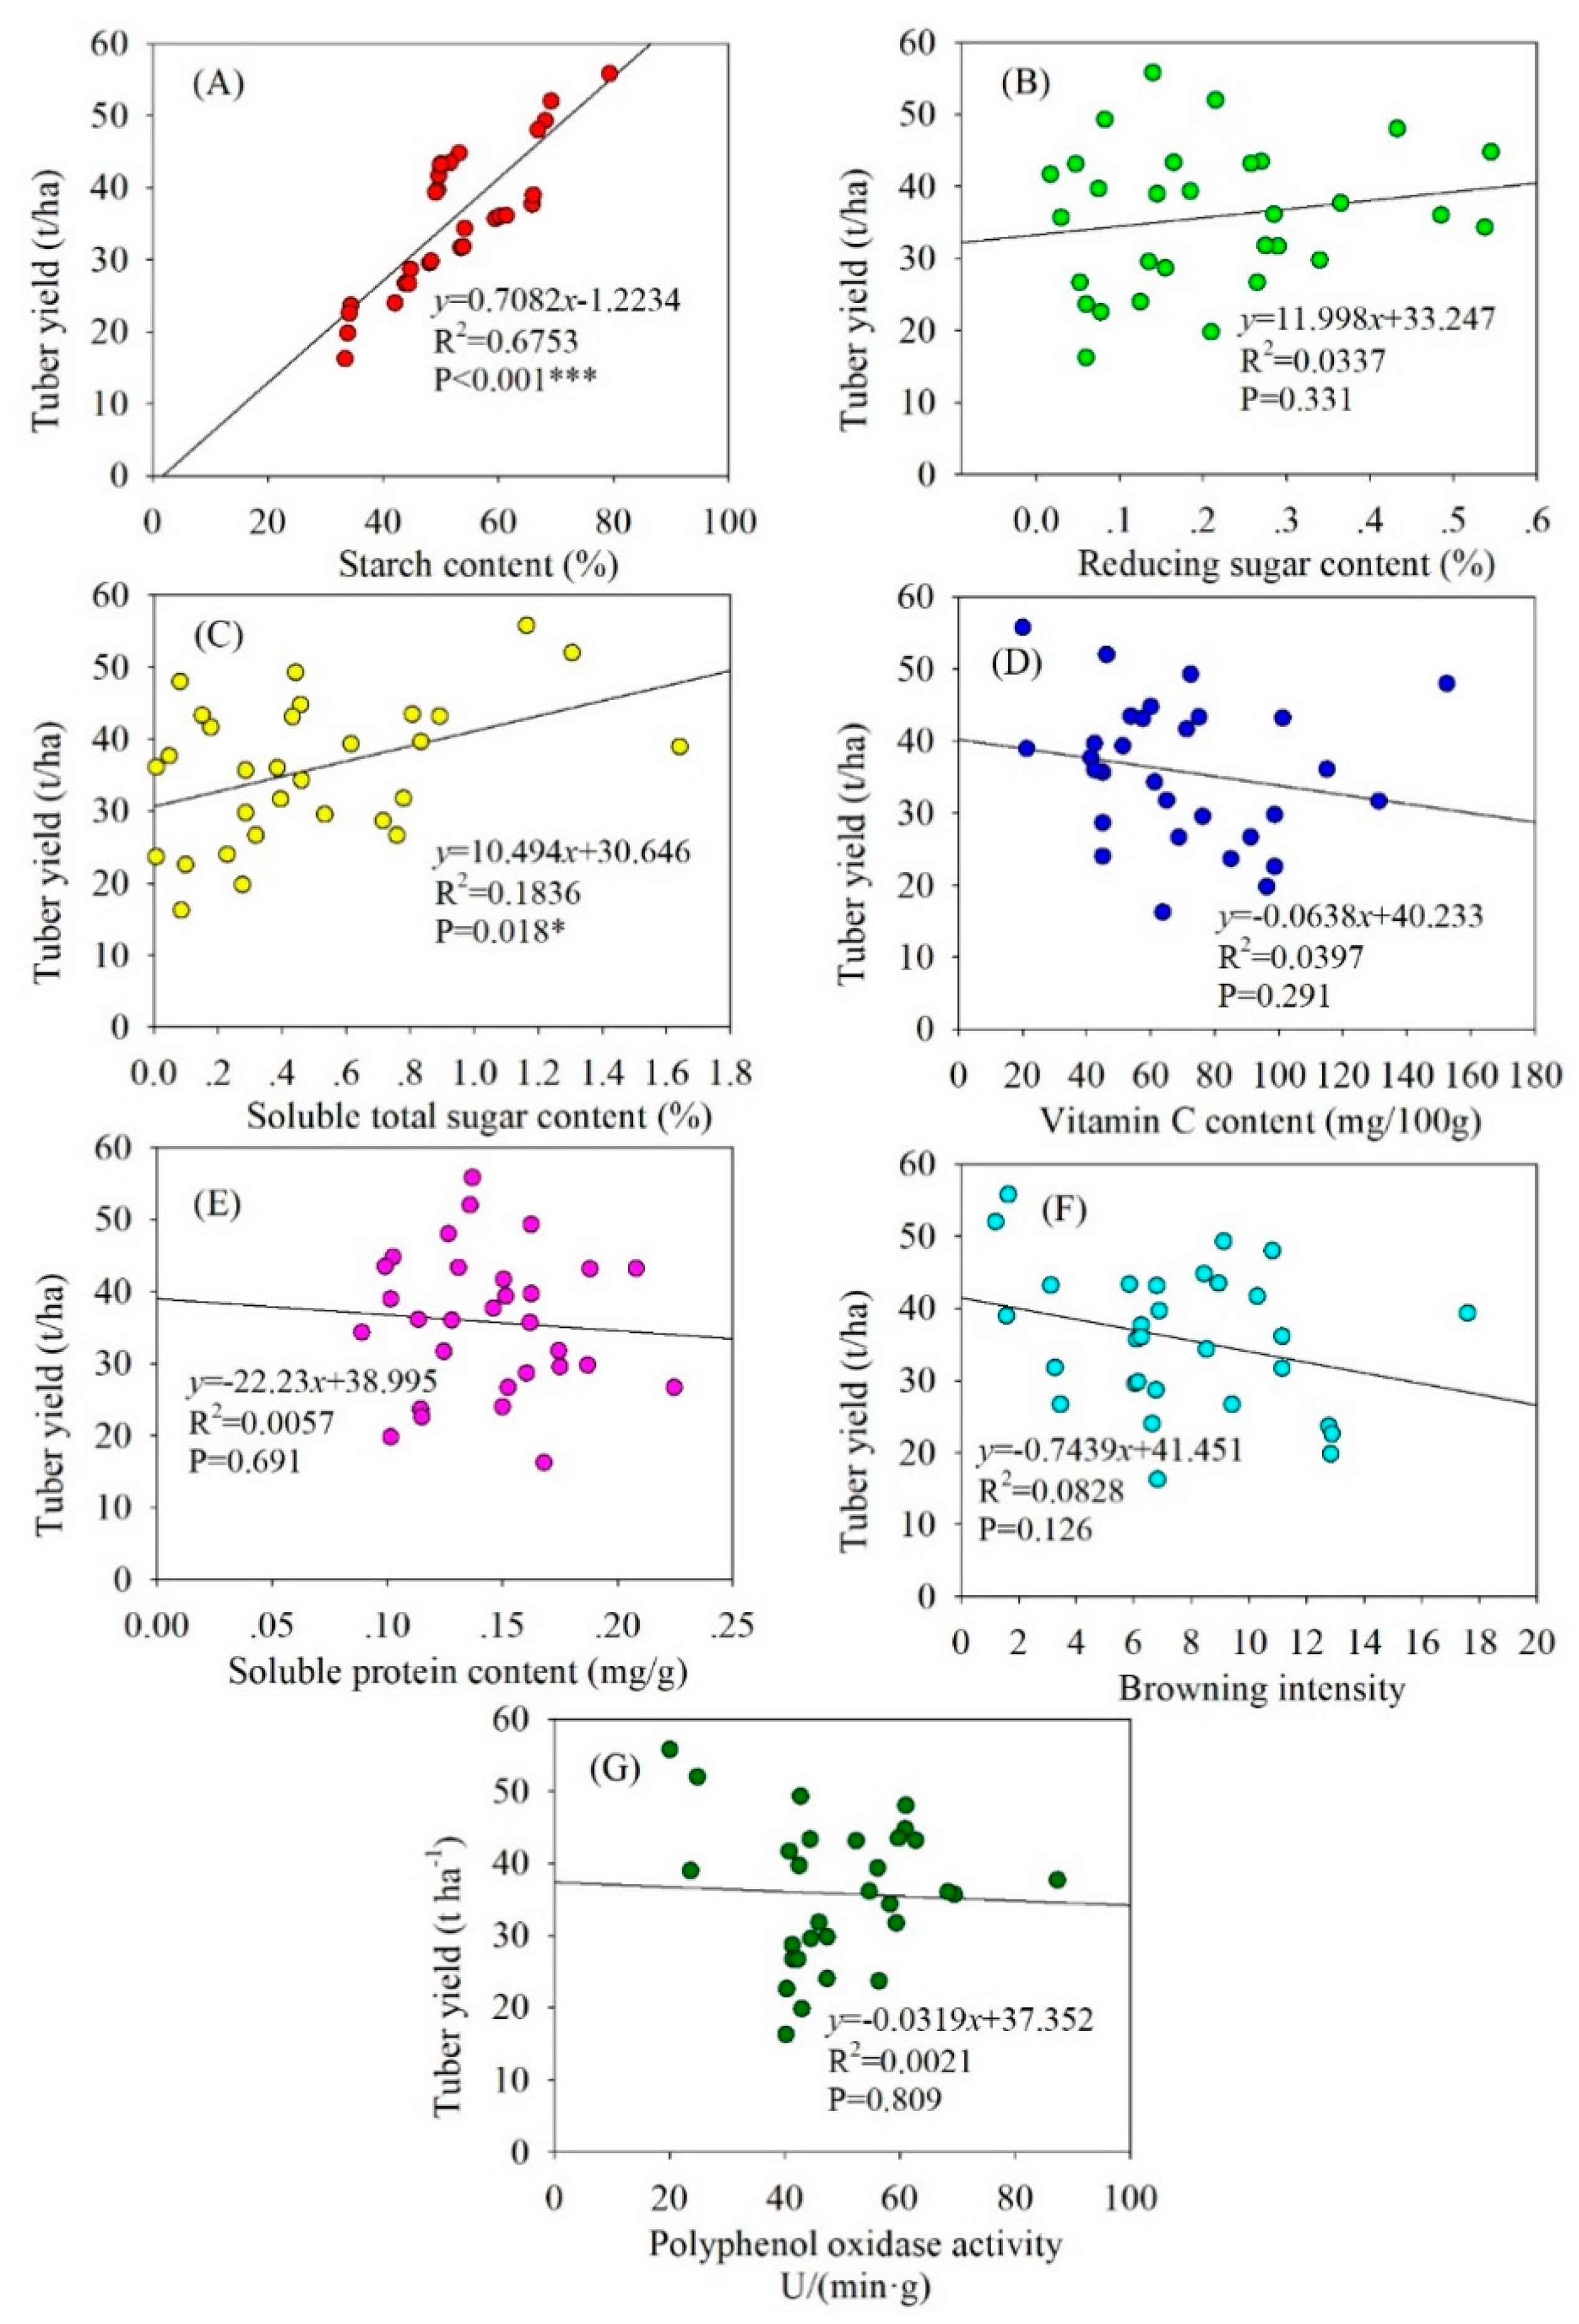
3.2. Linear Regression Analysis of Potato Yield and Quality

The linear regression analysis of potato yield and potato tuber quality is shown in Figure 3. The results showed that starch content (p < 0.001, Figure 3A) and soluble total sugar content (p = 0.018, Figure 3C) were significantly correlated with potato yield, while potato yield was not significantly correlated with other potato tuber quality. Potato tuber yield increased with the increase of starch content, reducing sugar content and soluble total sugar content (Figure 3), with the determination coefficient (R2) ranging from 0.034 to 0.675. The potato tuber yield decreased with the increase of vitamin C content, soluble protein content, browning intensity, polyphenol oxidase activity (Figure 3), and the determination coefficient (R2) only ranged from 0.002 to 0.083.

3.3. Differences in Soil Nutrients and Potato Tuber Quality

The soil nutrients in potato farmland on the loess plateau are shown in Table 1. The maximum value of soil organic matter content was 11.62 g/kg, the minimum value was 2.12 g/kg, and the standard deviation accounted for 47.7% of the average soil organic matter content (Table 1). The standard deviation of soil available phosphorus content accounted for 56% of the average, and the maximum was 13 times the minimum (Table 1). The variation of soil pH was small, with the standard deviation accounting for only 3.2% of the mean pH and the maximum 1.1 times of the minimum (Table 1). The maximum value of soil available potassium was 91.14 mg/kg, the minimum value was 35.34 mg/kg, and the maximum was 2.58 times the minimum (Table 1).
The potato tuber quality in the Loess Plateau are shown in Table 2. The starch content ranged from 79.27% to 33.39%, and the standard deviation accounted for 21.8% of the average starch content (Table 2). The standard deviation of reducing sugar content accounted for 71.4% of the average value, and the maximum was 27.5 times the minimum (Table 2). The content of soluble total sugar varies greatly, the maximum value is 165 times of the minimum value, and the standard deviation of soluble total sugar accounts for 81.6% of the mean value (Table 2). Vitamin C content ranges from to 152.5 mg/(100g), and the maximum value was 7.63 times the minimum value (Table 2). The standard deviation of soluble protein content accounted for 21.4% of the mean value, and the maximum value was 2.44 times of the minimum value (Table 2). The standard deviation of soluble protein content and polyphenol oxidase activity accounted for 49.8% and 28.7% of the average value, respectively (Table 2).

3.4. Correlation Analysis between Soil Nutrients and Potato Quality

The correlation analysis between soil nutrients and potato quality is shown in Table 3. The soil nutrient factors that had significant influence on potato starch content were ammonium nitrogen (correlation coefficient, 0.396), available potassium (correlation coefficient, 0.64), and pH (correlation coefficient, 0.445) (Table 3). The soil nutrient factor that had a significant effect on potato reducing sugar content was ammonium nitrogen (correlation coefficient, −0.427) (Table 3). The soil nutrient factor that had significant influence on the soluble total sugar content of potato was soil available nitrogen (correlation coefficient, 0.396) (Table 3). The soil nutrient factor with significant influence on potato vitamin C content was water content (correlation coefficient, 0.447) (Table 3). The soil nutrient factor with significant influence on potato soluble protein content was available phosphorus (correlation coefficient, 0.487) (Table 3). The soil nutrient factors that significantly affected the activity of potato polyphenol oxidase were soil water content (correlation coefficient, −0.382), soil nitrate nitrogen (correlation coefficient, 0.461), and soil ammonium nitrogen (correlation coefficient, −0.484) (Table 3).

3.5. Variable Importance for Projection of Soil Nutrient Factors Affecting the Potato Tuber Quality

In this study, the VIP value greater than 1.0 was used as the screening criterion to select the main soil nutrient factors that affect potato quality characteristics. The VIP of soil nutrient factors affecting the potato quality is shown in Table 4. The effect of soil water content on soluble total sugar, vitamin C, soluble protein, browning intensity, and polyphenol oxidase activity was significant (VIP > 1) (Table 4). The soil organic matter has little effect on potato tuber quality (VIP < 1).
The influence of soil available nitrogen on the soluble total sugar and browning intensity was significant (Table 4). The effect of soil ammonium nitrogen on starch content, reducing sugar, soluble total sugar, browning intensity, and polyphenol oxidase activity was significant (Table 4). The soil nitrate nitrogen has great effect on reducing sugar, soluble total sugar, vitamin C, and polyphenol oxidase activities (Table 4). The effect of soil available phosphorus on reducing sugar, soluble total sugar, vitamin C, soluble protein, and browning intensity was significant (Table 4). The effect of soil available potassium on starch content, reducing sugar, soluble protein, and browning intensity was significant (Table 4). The soil pH has great influence on starch content, reducing sugar, and soluble protein (Table 4).

3.6. PLSR of the Relationship between Soil Nutrient Content and Potato Tuber Quality

In this study, soil water content (x1), soil organic matter (x2), soil available nitrogen (x3), soil nitrate nitrogen (x4), soil ammonium nitrogen (x5), soil available phosphorus (x6), soil available potassium (x7), and pH (x8) were used as independent variables. Starch content (y1), reducing sugar content (y2), soluble total sugar content (y3), vitamin C content (y4), soluble protein content (y5), browning intensity (y6), and polyphenol oxidase activity (y7) were the dependent variables. The relationship between independent variables and dependent variables was established to define the importance of soil nutrients on potato tuber quality in the Loess Plateau. On the basis of considering the importance of variable projection, soil nutrient factors influencing potato quality were screened out, and the regression equation of soil nutrient factors influencing potato quality in the Loess Plateau was established by PLSR method (Table 5). The regression equation of soil nutrients to potato quality factors reached a significant level, indicating that the established regression equation was stable and reliable (Table 5). The importance and positive and negative effects of different soil nutrient factors on potato quality can be determined by the coefficients and symbols of the regression equation (Table 5). The larger the coefficient, the greater the effect on potato quality, and vice versa. Soil nutrient factor is positive, which has positive effect on potato tuber quality improvement, while soil nutrient factor is negative, which has side effect on potato tuber quality improvement.
The main soil nutrient factors influencing potato quality are soil nitrate nitrogen and pH (Table 5). The most important soil nutrient factor affecting potato starch content, reducing sugar content, and soluble protein content was pH (Table 5). Soil nitrate nitrogen is the most important soil nutrient factor affecting soluble total sugar content, vitamin C content, browning intensity, and polyphenol oxidase activity (Table 5). The effects of soil water content, soil available potassium, and pH on potato starch content were positive (Table 5). The effect of soil ammonium nitrogen and soil available phosphorus on reducing sugar content was negative, while the effect of soil nitrate nitrogen, soil available potassium, and pH on reducing sugar content was positive (Table 5). The effect of soil water content and soil nitrate nitrogen content on soluble total sugar content was negative, while the effect of soil available nitrogen content, soil ammonium nitrogen content, and available phosphorus content on soluble total sugar content was positive (Table 5). The effect of soil water content and soil nitrate nitrogen content on vitamin C was positive, while the effect of soil available phosphorus content on vitamin C was negative (Table 5). The effect of soil water content, soil available phosphorus content, and pH on soluble protein content was positive, while the effect of soil available potassium content on soluble protein content was negative (Table 5). Soil water content and soil nitrate nitrogen content had positive effects on browning intensity, while soil available nitrogen content, soil ammonium nitrogen content, soil available phosphorus content, and soil available potassium content had negative effects on browning intensity. The effect of soil water content and soil ammonium nitrogen content on polyphenol oxidase activity was negative, while the effect of soil nitrate nitrogen on polyphenol oxidase activity was positive.

4. Discussion

The PLSR can construct the most explanatory subspace regression model effectively under the condition of multiple correlation of independent variables, and improve the accuracy and reliability of the model significantly [43]. The PLSR method was used to evaluate the potato soluble total sugar content, and the results showed that the evaluation model was wrong to evaluate the potato sugar content by 14% to 18% [44]. In this study, the soluble total sugar content had a most significant correlation with soil water content and soil nitrate nitrogen content. We can infer that the effective way to increase the total sugar content of potato is to increase the soil water content and soil nitrate nitrogen content. However, our results found a significant inverse correlation between the soluble total sugar content and the soil available nitrogen content, soil ammonium nitrogen content, and available phosphorus content. Therefore, the soluble total sugar content can be increased by reducing the content of available nitrogen, ammonium nitrogen, and available phosphorus in soil. The researchers reported that the PLSR method was stronger correlation than transformed chlorophyll absorption reflectance index (TCARI) method with leaf-%N [45]. In this study, the determination coefficient (R2) was ranged from 0.316 to 0.576. The selected soil nutrient factors in this study can significantly describe the quality of each potato tuber. The PLSR analysis has made great progress in predicting the accuracy of all parameters [46]. In this study, the regression equation of the effect of soil nutrient factors on potato tuber quality was established. It is a new research idea to quantitatively analyze the relationship between the potato tuber quality and soil nutrients by PLSR method.
There are synergistic and antagonistic effects between soil nutrients, which have a complex influence on potato quality characteristics [47]. The results showed that the effect of soil nitrogen, phosphorus, and potassium content on potato quality was more important than that of single factor [48,49]. PLSR method and variable projection importance assistive technology were used to screen the soil nutrient factors influencing potato quality in the Loess Plateau. Soil nitrate nitrogen had the greatest effect on browning intensity, while soil available phosphorus had the least effect. Some researchers have proved that the relationship between nutrient supply and physiological processes, soil nutrient factors have important influence on potato tuber quality, such as potassium has the greatest influence on potato growth and photosynthesis [50,51]. This is consistent with our findings that the maximum determination coefficient of potato yield and soil available potassium content was 0.169 (p = 0.024). This may be related to the effect of nutrients on a particular species, and quality characteristics may overlap with other factors such as climate or specific site conditions. Thus, in addition to the proper nutrients and their proportions, even the choice of fertilizer may have different specific correlations [52]. In this study, the soil available potassium was significantly correlated with soluble protein content and browning intensity. Processing tubers with high protein content has economic significance for the potato starch industry because of the high economic value of these compounds [53]. The result indicated that genetic loci is an important factor that affects the potato tuber soluble protein content [54]. Therefore, in addition to providing adequate nutrients for potato growth, other agronomic measures, such as variety selection and plant protection, need to be considered.
Potato quality is affected by varieties, soil nutrients, climate, and cultivation conditions, among which soil nutrients account for a large proportion [55]. The results of this study by PLSR method show that the soil nutrient factors influencing potato quality from large to small were soil ammonium nitrogen > soil available phosphorus > soil nitrate nitrogen > available potassium > pH. The content of potato starch, vitamin C, soluble total sugar, potato crude protein, and reducing sugar can be significantly increased by applying appropriate nitrogen, phosphorus, and potassium fertilizer into potato planting plot [56]. In this study, the pH was significantly correlated with starch content, reducing sugar content, and soluble protein content. This phenomenon may be associated with the higher and lower soil pH values, which may change the biological availability of nutrient elements needed by plants, leading to the malnourishment of some elements in plants [57,58]. Many researchers have concluded that soil pH has a significant effect on potato tuber quality [24,59]. Soil pH first affects soil microbial enzyme activity, which directly affects the absorption and utilization of soil nutrients by potato roots, and finally affects potato tuber quality. The pH value of soil first affects the soil microbial activity, which directly affects the absorption and utilization of soil nutrients by potato roots, and finally affects the quality of potato tuber quality [60]. The results of this study show that increasing pH can increase starch content, reducing sugar content and soluble protein content. It can be concluded that potato growth likes more acidic soil, and it is an effective way to improve potato quality to improve potato soil acidity through fertilization measures.
In this study, soil factors with positive effects on potato starch content were pH and soil available potassium content. This is consistent with the linear analysis results that soil available potassium content and soil water content were significantly correlated with potato yield. Similar results showed that potassium fertilizer not only increased tuber yield, but also increased commodity yield, average tuber weight and starch content, and reduced soluble total sugar content [61]. The soil factors with positive effect on reducing sugar content of potato were soil nitrate nitrogen content, soil available potassium content, and pH, while the soil factors with negative effect were soil ammonium nitrogen content and available phosphorus content. Studies have shown that the application of phosphate fertilizer is more effective during planting or at the beginning of the season [62].
Nitrogen plays an important role in the growth and development of potato. Nitrogen contributes 40% to 50% of crop yield [63]. The forms of nitrogen in soil can be divided into inorganic nitrogen and organic nitrogen, and inorganic nitrogen mainly includes ammonium nitrogen and nitrate nitrogen. The main nitrogen sources for plant growth are ammonium nitrogen and nitrate nitrogen, but the uptake of the two forms of nitrogen by different crops is different under the influence of genetic factors and external conditions [64]. The effect of different forms of nitrogen on potato is complicated, and the mechanism of its effect on potato is not clear. In the model established by PLSR method, there are positive and negative effects of different nitrogen forms on potato tuber quality. The response of potato to nitrogen uptake and utilization of different forms and the mechanism of its action on potato remain to be further studied. Potato is a potassium-loving crop, and a large number of studies have shown that potassium fertilizer has an effect on potato yield, starch content, reducing sugar content, soluble protein content, and vitamin C content [65,66,67]. This study showed that potassium fertilizer promoted the accumulation of sugar in tubers and increased the content of starch in tubers. In the model established by PLSR method, the effect of phosphate fertilizer on potato starch was small, but it had significant positive effect on soluble sugar. The mechanism of soil nutrient’s influence on crop growth is complicated, so it is necessary to study the factors of soil nutrient’s influence on potato quality through a lot of field experiments and model construction, so as to carry out targeted field fertilization management.

5. Conclusions

The biggest factor of soil nutrients affecting potato starch content, reducing sugar content and soluble protein content is soil pH value. Soil nitrate nitrogen was the biggest factor influencing soluble total sugar content, vitamin C, browning intensity, and polyphenol oxidase activity. Starch content was mainly influenced by soil ammonium nitrogen, soil available potassium, and soil pH value. Vitamin C content was mainly influenced by soil water content, soil nitrate nitrogen, and soil available phosphorus. Therefore, we suggest that adjusting soil pH and increasing nitrogen fertilizer application are effective ways to improve potato tuber quality.

Author Contributions

Y.X., N.W., and X.N. wrote the paper, X.W. designed the study idea and applied the model to be calculated, Y.X., N.W., and X.N. collected and arranged the all database, Y.X. and X.W. analyzed and discussed. All the authors revised the manuscript. All authors have read and agreed to the published version of the manuscript.

Funding

This research was funded the National Natural Science Foundation (51669034, 51809224), Shaanxi Innovation Talent Promotion Program—Young Science and Technology Star Project (2018KJXX-080), and Key Scientific Research Program of Education Department of Shaanxi Province (18JS117). The APC was funded by the National Natural Science Foundation (51669034).

Acknowledgments

We thank Jia Yun, Huihui Zhang, Tao Guo, and Tianmei Li for providing us with experimental field plots and helping us to collect the data.

Conflicts of Interest

The authors declare no conflict of interest.

References

  1. Li, Q.; Li, H.; Zhang, L.; Zhang, S.; Chen, Y. Mulching Improves Yield and Water-Use Efficiency of Potato Cropping in China: A meta-analysis. Field Crop. Res. 2018, 221, 50–60. [Google Scholar] [CrossRef]
  2. Slavin, J.L.; Lloyd, B. Health Benefits of Fruits and Vegetables. Adv. Nutr. 2012, 3, 506–516. [Google Scholar] [CrossRef] [PubMed] [Green Version]
  3. Dhall, R.K. Advances in Edible Coatings for Fresh Fruits and Vegetables: A review. Crit. Rev. Food Sci. Nutr. 2013, 53, 435–450. [Google Scholar] [CrossRef] [PubMed]
  4. Urban, J.; Hamouz, K.; Jaromír, L.; Pulkrábek, J.; Pazderů, K. Effect of Genotype, Flesh Colour and Environment on the Glycoalkaloid Content in Potato Tubers from Integrated Agriculture. Plantsoil Environ. 2018, 64, 186–191. [Google Scholar]
  5. Zhu, Z.; Guo, W. Frequency, Moisture Content, and Temperature Dependent Dielectric Properties of Potato Starch Related to Drying with Radio-Frequency/Microwave Energy. Sci. Rep. 2017, 7, 9311. [Google Scholar] [CrossRef] [PubMed]
  6. Ezekiel, R.; Singh, N.; Sharma, S.; Kaur, A. Beneficial Phytochemicals in Potato — A review. Food Res. Int. 2013, 50, 487–496. [Google Scholar] [CrossRef]
  7. Pfaltzgraff, L.A.; De bruyn, M.; Cooper, E.C.; Budarin, V.; Clark, J.H. Food Waste Biomass: A resource for high-value chemicals. Green Chem. 2013, 15, 307–314. [Google Scholar] [CrossRef]
  8. Wang, X.; Xing, Y. Evaluation of the Effects of Irrigation and Fertilization on Tomato Fruit Yield and Quality: A principal component analysis. Sci. Rep. 2017, 7, 350. [Google Scholar] [CrossRef] [Green Version]
  9. Hu, Q.; Yang, N.; Pan, F.; Pan, X.; Wang, X.; Yang, P. Adjusting Sowing Dates Improved Potato Adaptation to Climate Change in Semiarid Region, China. Sustainability 2017, 9, 615. [Google Scholar] [CrossRef] [Green Version]
  10. Bhandari, K.B.; West, C.P.; Acosta-Martinez, V.; Cotton, J.; Cano, A. Soil Health Indicators as Affected by Diverse Forage Species and Mixtures in Semi-Arid Pastures. Appl. Soil Ecol. 2018, 132, 179–186. [Google Scholar] [CrossRef]
  11. Lehman, R.M.; Cambardella, C.A.; Stott, D.E.; Acosta-Martinez, V.; Manter, D.K.; Buyer, J.S.; Maul, J.E.; Smith, J.L.; Collins, H.P.; Halvorson, J.J.; et al. Understanding and Enhancing Soil Biological Health: The solution for reversing soil degradation. Sustainability 2015, 7, 988–1027. [Google Scholar] [CrossRef] [Green Version]
  12. Suseela, V.; Conant, R.T.; Wallenstein, M.D.; Dukes, J.S. Effects of Soil Moisture on the Temperature Sensitivity of Heterotrophic Respiration Vary Seasonally in an Old-Field Climate Change Experiment. Glob. Chang. Biol. 2012, 18, 336–348. [Google Scholar] [CrossRef]
  13. Bhandari, K.B.; West, C.P.; Acosta-Martinez, V. Assessing the Role of Interseeding Alfalfa into Grass on Improving Pasture Soil Health in Semi-Arid Texas High Plains. Appl. Soil Ecol. 2020, 147, 103399. [Google Scholar] [CrossRef]
  14. Bhandari, K.B.; West, C.P.; Longing, S.D.; Brown, C.P.; Green, P.E. Comparison of Arthropod Communities among Different Forage Types on the Texas High Plains Using Pitfall Traps. Crop. Turfgrass Manag. 2018, 4, 1–7. [Google Scholar] [CrossRef]
  15. Bhandari, K.B.; West, C.P.; Longing, S.D.; Brown, C.P.; Green, P.E.; Barkowsky, E. Pollinator Abundance in Semiarid Pastures as Affected by Forage Species. Crop Sci. 2018, 58, 2665–2671. [Google Scholar] [CrossRef] [Green Version]
  16. Bhandari, K.B.; West, C.P.; Klein, D.; Subbiah, S.; Surowiec, K. Essential Oil Composition of ‘WW-B.Dahl’ Old World Bluestem (Bothriochloa bladhii) Grown in the Texas High Plains. Ind. Crop. Prod. 2019, 133, 1–9. [Google Scholar] [CrossRef]
  17. Bhandari, K.B.; West, C.P.; Longing, S.D. Communities of Canopy-Dwelling Arthropods in Response to Diverse Forages. Agric. Environ. Lett. 2018, 3, 1–5. [Google Scholar] [CrossRef]
  18. Bhandari, K.B.; West, C.P.; Longing, S.D. Fly Densities on Cattle Grazing ‘WW-B. Dahl’old World Bluestem Pasture Systems. Tex. J. Agric. Nat. Resour. 2018, 31, 1–5. [Google Scholar]
  19. Morier, T.; Cambouris, A.N.; Chokmani, K. In-Season Nitrogen Status Assessment and Yield Estimation Using Hyperspectral Vegetation Indices in a Potato Crop. Agron. J. 2015, 107, 1295–1309. [Google Scholar] [CrossRef]
  20. Gao, X.; Li, C.; Zhang, M.; Wang, R.; Chen, B. Controlled Release Urea Improved the Nitrogen Use Efficiency, Yield and Quality of Potato (Solanum tuberosum L.) on Silt Loamy Soil. Field Crop. Res. 2015, 181, 60–68. [Google Scholar] [CrossRef]
  21. Farouk, S. Imroving Growth and Productivity of Potato (Solanum tuberosum L.) by Some Biostimulants and Lithovit with or without Boron. J. Plant Prod. 2015, 6, 2187–2206. [Google Scholar] [CrossRef]
  22. Gerendás, J.; Heuser, F.; Sattelmacher, B. Influence of Nitrogen and Potassium Supply on Contents of Acrylamide Precursors in Potato Tubers and on Acrylamide Accumulation in French Fries. J. Plant Nutr. 2007, 30, 1499–1516. [Google Scholar] [CrossRef]
  23. Wilton, M.J.; Karagatzides, J.D.; Tsuji, L.J.S. Nutrient Concentrations of Bush Bean (Phaseolus vulgaris L.) and Potato (Solanum tuberosum L.) Cultivated in Subarctic Soils Managed with Intercropping and Willow (Salix spp.) Agroforestry. Sustainability 2017, 9, 2294. [Google Scholar] [CrossRef] [Green Version]
  24. Agbede, T.M. Tillage and Fertilizer Effects on Some Soil Properties, Leaf Nutrient Concentrations, Growth and Sweet Potato Yield on an Alfisol in Southwestern Nigeria. Soil Tillage Res. 2010, 110, 25–32. [Google Scholar] [CrossRef]
  25. Khan, M.Z.; Akhtar, M.E.; Safdar, M.N.; Mahmood, M.M.; Ahmad, S.; Ahmed, N. Effect of Source and Level of Potash on Yield and Quality of Potato Tubers. Pak. J. Bot. 2010, 42, 3137–3145. [Google Scholar]
  26. Ierna, A.; Pandino, G.; Lombardo, S.; Mauromicale, G. Tuber Yield, Water and Fertilizer Productivity in Early Potato as Affected by a Combination of Irrigation and Fertilization. Agric. Water Manag. 2011, 101, 35–41. [Google Scholar] [CrossRef]
  27. Mehmood, T.; Liland, K.H.; Snipen, L.; Sæbø, S. A Review of Variable Selection Methods in Partial Least Squares Regression. Chemom. Intell. Lab. Syst. 2012, 118, 62–69. [Google Scholar] [CrossRef]
  28. Wang, N.; Xing, Y.; Wang, X. Exploring Options for Improving Potato Productivity through Reducing Crop Yield Gap in Loess Plateau of China Based on Grey Correlation Analysis. Sustainability 2019, 11, 5621. [Google Scholar] [CrossRef] [Green Version]
  29. Zhang, Z.; Yuan, Y.; Zhao, W.; He, H.; Li, D.; He, W.; Liu, Q.; Yin, H. Seasonal Variations in the Soil Amino Acid Pool and Flux following the Conversion of a Natural Forest to a Pine Plantation on the Eastern Tibetan Plateau, China. Soil Biol. Biochem. 2017, 105, 1–11. [Google Scholar] [CrossRef]
  30. Zhang, Z.; Wang, W.; Qi, J.; Zhang, H.; Tao, F.; Zhang, R. Priming Effects of Soil Organic Matter Decomposition with Addition of Different Carbon Substrates. J. Soils Sediments 2019, 19, 1171–1178. [Google Scholar] [CrossRef]
  31. Sun, S.; Li, Z.; Wang, R.; Zhang, J.; Pan, C.; Cai, Z. Conversion of Secondary Forests into Chestnut Forests Affects Soil Nutrients in Anji County, China. Sustainability 2019, 11, 2373. [Google Scholar] [CrossRef] [Green Version]
  32. Wang, X.; Li, Z.; Xing, Y. Effects of Mulching and Nitrogen on Soil Temperature, Water Content, Nitrate-N Content and Maize Yield in the Loess Plateau of China. Agric. Water Manag. 2015, 161, 53–64. [Google Scholar]
  33. Xiaoli, N.; Hanmi, Z.; Xiukang, W.; Tiantian, H.; Puyu, F.; Ting, L.; Na, Z.; Dongxue, Y. Changes in Root Hydraulic Conductance in Relation to the Overall Growth Response of Maize Seedlings to Partial Root-Zone Nitrogen Application. Agric. Water Manag. 2019, 229, 105839. [Google Scholar] [CrossRef]
  34. Jiang, W.; Wang, X.; Xing, Y.; Liu, X.; Cui, Z.; Yang, L. Enhancing Rice Production by Potassium Management: Recommended reasonable fertilization strategies in different inherent soil productivity levels for a sustainable rice production system. Sustainability 2019, 11, 6522. [Google Scholar] [CrossRef] [Green Version]
  35. Bilias, F.; Barbayiannis, N. Potassium-Fixing Clay Minerals as Parameters that Define K Availability of K-Deficient Soils Assessed with a Modified Mitscherlich Equation Model. J. Soil Sci. Plant Nutr. 2019, 19, 830–840. [Google Scholar] [CrossRef]
  36. Wang, H.; Wang, X.; Bi, L.; Wang, Y.; Fan, J.; Zhang, F.; Hou, X.; Cheng, M.; Hu, W.; Wu, L.; et al. Multi-Objective Optimization of Water and Fertilizer Management for Potato Production in Sandy Areas of Northern China Based on TOPSIS. Field Crop. Res. 2019, 240, 55–68. [Google Scholar] [CrossRef]
  37. Paul, S.; Gogoi, N.; Sarma, B.; Baroowa, B. Biochemical Changes in Potato under Elevated Temperature. Indian J. Plant Physiol. 2014, 19, 36–42. [Google Scholar] [CrossRef]
  38. Bogucka, B.; Elżbieta, T. Effect of Nitrogen and Potassium Fertilization on Mineral and Amino Acid Content of Colored Flesh Potato Cultivar Blue Congo. J. Plant Nutr. 2018, 41, 856–866. [Google Scholar] [CrossRef]
  39. Liu, Q.; Guo, Q.; Akbar, S.; Zhi, Y.; El Tahchy, A.; Mitchell, M.; Li, Z.; Shrestha, P.; Vanhercke, T.; Ral, J.-P.; et al. Genetic Enhancement of Oil Content in Potato Tuber (Solanum tuberosum L.) through an Integrated Metabolic Engineering Strategy. Plant Biotechnol. J. 2017, 15, 56–67. [Google Scholar] [CrossRef] [Green Version]
  40. Nguyen, H.T.; van der Fels-Klerx, H.J.; van Boekel, M.A.J.S. Acrylamide and 5-Hydroxymethylfurfural Formation during Biscuit Baking. Part II: Effect of the Ratio of Reducing Sugars and Asparagine. Food Chem. 2017, 230, 14–23. [Google Scholar] [CrossRef]
  41. Gomes, M.H.; Vieira, T.; Fundo, J.F.; Almeida, D.P.F. Polyphenoloxidase Activity and Browning in Fresh-Cut ‘Rocha’ Pear as Affected by pH, Phenolic Substrates, and Antibrowning Additives. Postharvest Biol. Technol. 2014, 91, 32–38. [Google Scholar] [CrossRef] [Green Version]
  42. Haitovsky, Y. Missing Data in Regression Analysis. J. R. Stat. Soc. Ser. B (Methodol.) 1968, 30, 67–82. [Google Scholar] [CrossRef]
  43. Elmasry, G.; Kamruzzaman, M.; Sun, D.-W.; Allen, P. Principles and Applications of Hyperspectral Imaging in Quality Evaluation of Agro-Food Products: A Review. Crit. Rev. Food Sci. Nutr. 2012, 52, 999–1023. [Google Scholar] [CrossRef] [PubMed]
  44. Rady, A.; Guyer, D.; Lu, R. Evaluation of Sugar Content of Potatoes Using Hyperspectral Imaging. Food Bioprocess Technol. 2015, 8, 995–1010. [Google Scholar] [CrossRef]
  45. Cohen, Y.; Alchanatis, V.; Zusman, Y.; Dar, Z.; Bonfil, D.J.; Karnieli, A.; Zilberman, A.; Moulin, A.; Ostrovsky, V.; Levi, A.; et al. Leaf Nitrogen Estimation in Potato Based on Spectral Data and on Simulated Bands of the VENμS Satellite. Precis. Agric. 2010, 11, 520–537. [Google Scholar] [CrossRef]
  46. Hasan, U.; Sawut, M.; Chen, S. Estimating the Leaf Area Index of Winter Wheat Based on Unmanned Aerial Vehicle RGB-Image Parameters. Sustainability 2019, 11, 6829. [Google Scholar] [CrossRef] [Green Version]
  47. Aulakh, M.S.; Malhi, S.S. Interactions of Nitrogen with Other Nutrients and Water: Effect on crop yield and quality, nutrient use efficiency, carbon sequestration, and environmental pollution. In Advances in Agronomy; Academic Press: Cambridge, MA, USA, 2005. [Google Scholar]
  48. Artyszak, A. Effect of Silicon Fertilization on Crop Yield Quantity and Quality—A literature review in Europe. Plants 2018, 7, 54. [Google Scholar] [CrossRef] [Green Version]
  49. Darabi, A.; Omidvari, S.; Shafiezargar, A.; Rafie, M.; Javadzadeh, M. Impact of Integrated Management of Nitrogen Fertilizers on Yield and Nutritional Quality of Potato. J. Plant Nutr. 2018, 41, 2482–2494. [Google Scholar] [CrossRef]
  50. Naumann, M.; Koch, M.; Thiel, H.; Gransee, A.; Pawelzik, E. The Importance of Nutrient Management for Potato Production Part II: Plant nutrition and tuber quality. Potato Res. 2019, 63, 1–17. [Google Scholar] [CrossRef] [Green Version]
  51. Zörb, C.; Senbayram, M.; Peiter, E. Potassium in Agriculture—Status and perspectives. J. Plant Physiol. 2014, 171, 656–669. [Google Scholar] [CrossRef]
  52. Doré, T.; Makowski, D.; Malézieux, E.; Munier-Jolain, N.; Tchamitchian, M.; Tittonell, P. Facing up to the Paradigm of Ecological Intensification in Agronomy: Revisiting methods, concepts and knowledge. Eur. J. Agron. 2011, 34, 197–210. [Google Scholar] [CrossRef]
  53. Akyol, H.; Riciputi, Y.; Capanoglu, E.; Caboni, M.F.; Verardo, V. Phenolic Compounds in the Potato and Its Byproducts: An overview. Int. J. Mol. Sci. 2016, 17, 835. [Google Scholar] [CrossRef] [PubMed]
  54. Klaassen, M.T.; Bourke, P.M.; Maliepaard, C.; Trindade, L.M. Multi-allelic QTL Analysis of Protein Content in a Bi-Parental Population of Cultivated Tetraploid Potato. Euphytica 2019, 215, 14. [Google Scholar] [CrossRef] [PubMed]
  55. Herencia, J.F.; García-Galavís, P.A.; Dorado, J.A.R.; Maqueda, C. Comparison of Nutritional Quality of the Crops Grown in an Organic and Conventional Fertilized Soil. Sci. Hortic. 2011, 129, 882–888. [Google Scholar] [CrossRef]
  56. Fritsch, C.; Staebler, A.; Happel, A.; Cubero Márquez, M.A.; Aguiló-Aguayo, I.; Abadias, M.; Gallur, M.; Cigognini, I.M.; Montanari, A.; López, M.J.; et al. Processing, Valorization and Application of Bio-Waste Derived Compounds from Potato, Tomato, Olive and Cereals: A review. Sustainability 2017, 9, 1492. [Google Scholar] [CrossRef] [Green Version]
  57. Luo, W.; Sardans, J.; Dijkstra, F.A.; Peñuelas, J.; Lü, X.-T.; Wu, H.; Li, M.-H.; Bai, E.; Wang, Z.; Han, X.; et al. Thresholds in Decoupled Soil-Plant Elements under Changing Climatic Conditions. Plant Soil 2016, 409, 159–173. [Google Scholar] [CrossRef]
  58. Hong, S.; Piao, S.; Chen, A.; Liu, Y.; Liu, L.; Peng, S.; Sardans, J.; Sun, Y.; Peñuelas, J.; Zeng, H. Afforestation Neutralizes Soil pH. Nat. Commun. 2018, 9, 520. [Google Scholar] [CrossRef] [Green Version]
  59. Tein, B.; Kauer, K.; Eremeev, V.; Luik, A.; Selge, A.; Loit, E. Farming Systems Affect Potato (Solanum tuberosum L.) Tuber and Soil Quality. Field Crop. Res. 2014, 156, 1–11. [Google Scholar] [CrossRef]
  60. Ninh, H.T.; Grandy, A.S.; Wickings, K.; Snapp, S.S.; Kirk, W.; Hao, J. Organic Amendment Effects on Potato Productivity and Quality are Related to Soil Microbial Activity. Plant Soil 2015, 386, 223–236. [Google Scholar] [CrossRef]
  61. Li, S.; Duan, Y.; Guo, T.; Zhang, P.; He, P.; Johnston, A.; Shcherbakov, A. Potassium Management in Potato Production in Northwest Region of China. Field Crop. Res. 2015, 174, 48–54. [Google Scholar] [CrossRef]
  62. Rosen, C.J.; Kelling, K.A.; Stark, J.C.; Porter, G.A. Optimizing Phosphorus Fertilizer Management in Potato Production. Am. J. Potato Res. 2014, 91, 145–160. [Google Scholar] [CrossRef]
  63. Wang, X.; Fan, J.; Xing, Y.; Xu, G.; Wang, H.; Deng, J.; Wang, Y.; Zhang, F.; Li, P.; Li, Z. The Effects of Mulch and Nitrogen Fertilizer on the Soil Environment of Crop Plants. In Advances in Agronomy; Sparks, D.L., Ed.; Academic Press: Cambridge, MA, USA, 2019. [Google Scholar]
  64. Chietera, G.; Chaillou, S.; Bedu, M.; Marmagne, A.; Masclaux-Daubresse, C.; Chardon, F. Impact of the Genetic–Environment Interaction on the Dynamic of Nitrogen Pools in Arabidopsis. Agriculture 2018, 8, 28. [Google Scholar] [CrossRef] [Green Version]
  65. Reis Jr, R.D.A.; Monnerat, P.H. Nutrient Concentrations in Potato Stem, Petiole and Leaflet in Response to Potassium Fertilizer. Scientia Agricola 2000, 57, 251–255. [Google Scholar] [CrossRef]
  66. Ayyub, C.M.; Wasim Haidar, M.; Zulfiqar, F.; Abideen, Z.; Wright, S.R. Potato Tuber Yield and Quality in Response to Different Nitrogen Fertilizer Application Rates under Two Split Doses in an Irrigated Sandy Loam Soil. J. Plant. Nutr. 2019, 42, 1850–1860. [Google Scholar] [CrossRef]
  67. Alam, S.; Islam, N.; Hossain, J.; Islam, M.; Bhuiyan, S.R.; Hossain, I. Optimizing Crop Geometry for Processing-Grade Tuber Yield, Quality and Economics of Potato in Grey Terrace Soil. Arch. Agron. Soil Sci. 2016, 62, 1496–1507. [Google Scholar] [CrossRef]
Figure 1. The map depicts the collection area of soil and plant samples on the loess plateau of China. These circles indicate the location of the experiment site. The thick line represents the city boundary and the thin line represents the county boundary [28].
Sustainability 12 01588 g001
Figure 2. Linear regression analysis of potato yield and soil water content (A), soil organic matter content (B), soil available N content (C), soil nitrate nitrogen content (D), soil ammonium nitrogen content (E), soil available phosphorus content (F), soil available potassium content (G), and pH (H). * indicates significance at p < 0.05. The linear regression value of each slope is obtained according to the homogeneity test of regression coefficient.
Sustainability 12 01588 g002
Figure 3. Linear regression analysis of potato yield and starch content (A), reducing sugar content (B), soluble total sugar content (C), vitamin C content (D), soluble protein content (E), browning intensity (F), polyphenol oxidase activity (G). ***, **, and * indicate significance at p < 0.001, p < 0.01, and p < 0.05, respectively. The linear regression value of each slope is obtained according to the homogeneity test of regression coefficient.
Sustainability 12 01588 g003
Table 1. The soil nutrient contents of potato farmland in the Loess Plateau.
ItemsSWC (%)SOM (g/kg)SAHN (mg/kg)SNN (mg/kg)SAMN (mg/kg)P (mg/kg)K (mg/kg)pH
Site 111.18 + 0.352.17 + 0.098.44 + 0.362.14 + 0.8711.72 + 1.264.97 + 0.6345.26 + 5.688.93 + 0.04
Site 215.34 + 0.99.46 + 0.229.13 + 1.664.95 + 0.7511.97 + 1.156.61 + 2.7573.78 + 17.688.77 + 0.02
Site 315.02 + 0.318.42 + 0.5430.29 + 1.295.86 + 1.7110.13 + 0.4214.74 + 1.5558.9 + 4.688.26 + 0.05
Site 411.94 + 0.2510 + 0.6835.82 + 2.442.88 + 0.758.85 + 0.54.53 + 0.9639.68 + 5.988.17 + 0.03
Site 513.28 + 0.510.6 + 0.5931.62 + 1.685.11 + 0.65.45 + 1.058.54 + 1.2453.94 + 13.418.6 + 0.06
Site 68.6 + 0.393.44 + 0.819.56 + 2.320.64 + 1.319.04 + 2.1424.62 + 0.6347.12 + 9.548.54 + 0.03
Site 74.27 + 0.33.2 + 0.3115.05 + 0.475.43 + 0.2310.7 + 0.429.71 + 0.6552.08 + 3.229.03 + 0.03
Site 813.75 + 0.44.18 + 0.4611.08 + 0.45.42 + 1.0611.64 + 1.12.08 + 0.6676.88 + 2.848.94 + 0.01
Site 98.98 + 1.210.8 + 0.9845.93 + 11.345.41 + 0.28.17 + 0.6712.36 + 3.0259.52 + 3.728.69 + 0.16
Site 1010.7 + 0.626.64 + 0.2536.98 + 1.632.57 + 0.3714.86 + 1.375.93 + 1.0775.02 + 3.878.6 + 0.05
Minimum3.932.128.051.534.271.3735.348.15
Maximum15.9411.6254.257.9916.0817.9091.149.06
Mean11.316.8826.394.7110.258.6858.228.65
Standard Deviation3.303.2912.311.732.654.8614.550.28
Note: SWC, soil water content; SOM, soil organic matter; SAHN, soil available nitrogen; SNN, soil nitrate nitrogen; SAMN, soil ammonium nitrogen; P, soil available phosphorus; K, soil available potassium.
Table 2. The potato tuber quality in the Loess Plateau.
ItemsSC
(%)
RSC
(%)
STS
(%)
VC
mg/(100g)
SPC
(mg/g)
BIPPO
U/ (g min)
Site 142.52 + 8.240.1 + 0.050.54 + 0.450.42 + 11.610.16 + 06.83 + 0.0641.32 + 1.14
Site 253.83 + 12.680.05 + 0.030.31 + 0.1370.83 + 1.910.16 + 0.019.61 + 0.6141.64 + 0.98
Site 348.79 + 1.080.21 + 0.110.32 + 0.1983.33 + 13.370.16 + 0.036.01 + 0.1545.44 + 1.7
Site 434.1 + 0.270.12 + 0.080.13 + 0.1493.33 + 7.320.11 + 0.0112.83 + 0.0646.56 + 8.62
Site 552.95 + 1.290.45 + 0.160.57 + 0.258.33 + 4.020.1 + 0.018.64 + 0.2759.68 + 1.32
Site 647.01 + 4.330.12 + 0.070.43 + 0.1951.25 + 6.250.16 + 0.0210.34 + 6.2852 + 4.4
Site 761.84 + 3.510.29 + 0.240.24 + 0.1742.92 + 1.910.15 + 0.026.21 + 0.0975.1 + 10.65
Site 860.57 + 6.740.34 + 0.080.16 + 0.21132.9 + 18.810.12 + 0.0111.05 + 0.258.4 + 3.3
Site 949.41 + 4.740.27 + 0.010.81 + 0.0785.83 + 18.720.2 + 0.033.28 + 0.1750.3 + 10.93
Site 1071.46 + 6.940.17 + 0.041.37 + 0.2529.17 + 14.810.12 + 0.021.48 + 0.2422.84 + 2.5
Minimum33.390.020.0120.000.091.2120.04
Maximum79.270.551.64152.500.2217.5987.36
Mean52.250.210.4969.830.147.6349.33
Standard Deviation11.410.150.4030.700.033.8014.17
Note: SC, starch content; RSC, reducing sugar content; STS, soluble total sugar content; VC, vitamin C content; SPC, soluble protein content; BI, browning intensity; PPO, polyphenol oxidase activity.
Table 3. The correlation analysis between soil nutrients and potato quality.
ItemsSC (%)RSC (%)STS (%)VC mg/(100g)SPC (mg/g)BIPPO U/(g min)
SWC (%)−0.156−0.08−0.1410.447*−0.2070.254−0.382 *
SOM (g/kg)−0.1880.140.0810.207−0.089−0.023−0.186
SAHN (mg/kg)−0.0750.0170.396 *0.0120.134−0.321−0.346
SNN (mg/kg)0.0630.265−0.3320.1940.2230.1980.461 *
SAMN (mg/kg)0.396 *−0.427 *0.292−0.1850.066−0.301−0.484 **
P (mg/kg)−0.112−0.0170.057−0.2520.487 **−0.1760.147
K (mg/kg)0.640 **0.1240.2040.174−0.061−0.309−0.222
pH0.445 *0.1450.021−0.1250.103−0.1480.317
Note: SC, starch content; RSC, reducing sugar content; STS, soluble total sugar content; VC, vitamin C content; SPC, soluble protein content; BI, browning intensity; PPO, polyphenol oxidase activity; SWC, soil water content; SOM, soil organic matter; SAHN, soil available nitrogen; SNN, soil nitrate nitrogen; SAMN, soil ammonium nitrogen; P, soil available phosphorus; K, soil available potassium. ***, **, and * indicate significance at P < 0.001, P < 0.01, and P < 0.05, respectively.
Table 4. Variable importance for projection of soil nutrient factors affecting the potato quality.
ItemsSC (%)RSC (%)STS (%)VC mg/(100g)SPC (mg/g)BIPPO U/(g min)
SWC (%)0.6450.6321.1551.6091.2271.1551.062
SOM (g/kg)0.7560.8140.9560.9180.420.3680.737
SAHN (mg/kg)0.7520.3581.5680.8260.9431.2910.956
SNN (mg/kg)0.4411.1211.461.2370.9941.1531.249
SAMN (mg/kg)1.1511.9151.1870.8060.9541.2431.497
P (mg/kg)0.4571.0091.0431.4851.8921.120.81
K (mg/kg)1.9551.0720.7490.7171.0741.1910.622
pH1.2141.1660.8990.7331.4910.7570.923
Note: SC, starch content; RSC, reducing sugar content; STS, soluble total sugar content; VC, vitamin C content; SPC, soluble protein content; BI, browning intensity; PPO, polyphenol oxidase activity; SWC, soil water content; SOM, soil organic matter; SAHN, soil available nitrogen; SNN, soil nitrate nitrogen; SAMN, soil ammonium nitrogen; P, soil available phosphorus; K, soil available potassium.
Table 5. Regression equation for the effect of soil nutrients on potato tuber quality.
Quality FactorCodeMajor Affecting FactorRegression EquationR2F
SC y1x5, x7, x8y1 = −73.404 + 0.033x5 + 0.412x7 + 11.354x80.4908.327 **
RSCy2x4, x5, x6, x7, x8y2 = −0.358 + 0.015x4 − 0.004x5 − 0.007x6 + 0.003x7 + 0.086x80.3772.907 *
STSy3x1, x3, x4, x5, x6y3 = 0.027 − 0.025x1 + 0.014x3 − 0.078x4 + 0.006x5 + 0.019x60.4373.726 *
VC y4x1, x4, x6y4 = 12.09 + 3.433x1 + 10.086x4 − 3.289x60.4075.948 **
SPCy5x1, x6, x7, x8y5 = −0.218 + 0.001x1 + 0.004x6 − 0.000125x7 + 0.037x80.3162.887 *
BIy6x1, x3, x4, x5, x6, x7y6 = 11.158 + 0.445x1 − 0.069x3 + 1.343x4 − 0.009x5 − 0.421x6 − 0.146x70.5765.208 **
PPOy7x1, x4, x5y7 = 74.727 − 1.512x1 + 2.477x4 − 0.195x50.4507.091 **
Note: SC, starch content (y1); RSC, reducing sugar content (y2); STS, soluble total sugar content (y3); VC, vitamin C content (y4); SPC, soluble protein content (y5); BI, browning intensity (y6); PPO, polyphenol oxidase activity (y7); x1, soil water content; x2, soil organic matter; x3, soil available nitrogen; x4, soil nitrate nitrogen; x5, soil ammonium nitrogen; x6, soil available phosphorus; x7, soil available potassium; x8,pH.

