Article

Strategic Planning of Offshore Wind Farms in Greece

by
Sofia Spyridonidou
1,
Dimitra G. Vagiona
1,* and
Eva Loukogeorgaki
2
1
Department of Spatial Planning and Development, Aristotle University of Thessaloniki, 54124 Thessaloniki, Greece
2
Department of Civil Engineering, Aristotle University of Thessaloniki, 54124 Thessaloniki, Greece
*
Author to whom correspondence should be addressed.
Sustainability 2020, 12(3), 905; https://doi.org/10.3390/su12030905
Submission received: 9 January 2020 / Revised: 20 January 2020 / Accepted: 23 January 2020 / Published: 26 January 2020
(This article belongs to the Special Issue Renewable Energies for Sustainable Development)

Abstract

:
In the present article, a new methodological framework for the efficient and sustainable exploitation of offshore wind potential was developed. The proposed integrated strategic plan was implemented for the first time at national spatial planning scale in Greece. The methodological approach is performed through geographical information systems (GIS) and Microsoft Project Server Software and includes five distinct stages: (i) definition of vision/mission, (ii) identification of appropriate areas for offshore wind farms’ (OWFs) siting, (iii) determination of the OWFs’ layout, (iv) calculation of the OWFs’ (projects) total investment cost and, finally, (v) portfolio analysis. The final outcome of the proposed strategic planning is the prioritization of the proposed sixteen offshore wind projects based on their strategic value, as well as the estimation of the overall investment cost of the entire portfolio. High economic, socio-political and environmental benefits could be achieved through the implementation of only 60% of the total investment capital of the proposed strategic plan.

1. Introduction

In recent years, there has been a growing interest towards the installation of OWFs, due to the existence of multiple benefits related to the siting and operation of wind turbines offshore, such as existence of stronger winds of longer duration, availability of extensive free space for the construction of large-scale projects, reduction, and/or avoidance of noise and visual disturbances caused to the landscape by these structures, etc. Following the installation of the first OWF in Denmark in the early 1990s, a significant increase of the offshore wind industry was noted in the first decade of 2000, with the overall capacity doubling every 2–4 years [1].
On a global scale, according to statistical figures from Global Wind in 2014, over 90% of all offshore wind installations were implemented in European waters. Offshore wind energy in Europe reached the record figure of 3148 megawatt (MW) of total installed capacity in 2017, which corresponds to 560 new offshore wind turbines and 17 OWFs [1,2]. This particular record is two times higher than the figures of 2016 and 4% higher than the previous record of 2015 [2]. In the following year (2018), 409 new offshore wind turbines connected to the electricity grid across 18 offshore wind projects in Europe [3]. The referred amount corresponds to 2649 MW of net additional capacity, which is 15.8% lower than in 2017 [3]. Thus, Europe’s cumulative offshore wind capacity reached 18,499 MW at the end of 2018, which corresponds to a total of 4543 grid-connected wind turbines across 11 European countries [3]. At present, the UK has the largest amount of offshore wind capacity in Europe with 44% of all installations in MW, followed by Germany with 34%, Denmark (7%), Belgium (6.4%) and the Netherlands (6%) [3]. Finally, in recent years focus was given on the development of OWFs in deeper waters [4,5,6,7], where floating support structures are preferable. For example, useful methodologies have been developed for determining with accuracy all the relevant economic decision variables of floating OWFs [6], for proposing the best technological alternatives [5] and analyzing future wind resources in deeper waters [7].
An important process of the installation of OWFs is the determination of areas suitable for the deployment of the offshore energy systems. The site selection for utilizing OWFs corresponds to a multidimensional decision-making issue. Although several applications in various spatial planning scales can be found in the literature [8,9,10,11,12,13,14,15,16,17,18,19,20,21,22,23,24], the applications of OWF siting at national scale are really handful. Only five out of seventeen [8,10,14,17,19], refer to site suitability analyses on a national spatial planning scale. More specifically, [8] applied five factors and seven constraints using multi-criteria decision making and GIS models to provide a suitability map for offshore wind energy in Egypt. The analysis was conducted at large scale covering the whole of Egypt and its surrounding waters. The large-scale potential of China’s offshore wind energy from the perspective of current technical, spatial, and economic constraints and its possible contributions to the nation’s energy system was investigated in [10]. With the aid of a GIS-based tool, offshore wind potential was evaluated as a combination of wind resources, technical projections of wind turbines, economic costs and spatial constraints of offshore wind farms. Location-specific levelized production cost and cost supply curves of offshore wind energy were also developed. A two-step decision-making procedure was adopted in [14] to evaluate the locations for offshore wind farms in Greece. Unsuitable locations were initially rejected using GIS and three constraint factors, while the remaining sites were evaluated with the AHP method and five evaluation criteria. A spatial model for the assessment of offshore wind energy potential, production costs, and the identification of suitable areas based on GIS was presented in [17] and applied in a part of the Danish Exclusive Economic Zone (EEZ). Finally, a multi-criteria site selection analysis was performed by considering technical, social, and civil restrictions for finding the most suitable offshore wind farm locations in Turkey among the 55 coastal regions, including their technical power capacities [19].
Considering the tools and techniques that have been applied so far in the OWF siting literature, several researchers have applied multi-criteria techniques to rank OWF siting alternatives (e.g., [8,12,13,14]), indicating that multi-criteria decision analysis plays a crucial role in OWF siting. GIS presents also an important tool for the identification and the selection of suitable sites for the installation of wind farms either on land or in the marine environment [25]. It has been used globally in many countries for the site selection of offshore wind projects, such as Egypt [8], Ohio-USA [9], China [10], Greece [11,12,13,14], South Korea [15], Spain [16], Thailand [26], etc.
What is missing from the current literature and practice is the development of an integrated strategic plan for the efficient and sustainable exploitation of the offshore wind potential and the relevant deployment of OWFs. In the present paper a new Strategic Planning methodology to identify and prioritize suitable areas for offshore wind sites is introduced, which addresses a gap in knowledge in the offshore wind energy field. In order to do this, this work utilizes a countrywide case study (Greece) where the developed methodology is applied. It should be noted that no OWFs have been developed so far in Greece.
The methodology proposed and applied includes the implementation of five distinct stages corresponding to: (i) the definition of vision and mission of the strategic planning, as previously mentioned, (ii) the identification of appropriate areas for OWFs’ siting based on specific exclusion criteria, (iii) the determination of the OWFs’ layout in the aforementioned areas, (iv) the calculation of the OWFs’ (projects) total investment cost by calculating the capital expenditure (CAPEX), the operating expenses (OPEX) and the decommissioning expenses (DECEX) and, finally, (v) a portfolio analysis based on seven assessment criteria.
A critical advantage of the proposed methodology is that it addresses existing gaps on renewable energy sources (RES) siting issues, by: (i) introducing a holistic, step-by-step, OWF siting methodology, which considers all the relevant critical issues that an OWF developer or/and an energy planner should analyze and resolve, (ii) providing a long-term planning approach (25 years, after the plan’s implementation), and (iii) recognizing a multi-disciplinary approach, as it considers legal, technical, economic, environmental, societal, and political issues. The final outcome is the assessment and ranking of all OWF project proposals considering their strategic value and cost constraints. The proposed methodology can be easily applied in other regions by following the abovementioned five stages. The novelty of the paper lies both on the integrated methodology itself (strategic spatial planning) and on the tools and criteria used in the analysis.
More specifically, GIS is used in a twofold way in the present paper: (i) for identifying the most suitable areas (SAs) for OWFs in Greece and (ii) for determining the layout and for the first time the precise location coordinates of the wind turbines in each OWF (OWFs’ mapping and micro-siting determination) and, therefore, the energy capacity of the projects. The estimation of the precise location coordinates of the wind turbines in an OWF is a critical issue in the planning phase and should be accomplished before the construction phase of such large-scale projects. Moreover, the present paper proposes for the first time a prioritization of OWF projects (and, thus, an identification of optimum sites for OWFs’ installation) through portfolio analysis. Portfolio analysis includes a collection of projects/proposals that will compete for selection based on their cost relative to their strategic value. The Microsoft Project Server tool, which integrates multi-criteria evaluation techniques and mathematical optimization, is used for the first time on the subject of OWFs’ siting, in order to perform the required portfolio analysis and strategic scenarios in relation to the country’ energy needs.
Finally, a total of twenty (exclusion and assessment) criteria are employed in the proposed methodology and the present site suitability support framework almost fully covers the economic, social, political, technical and environmental dimensions of the OWFs’ siting problem in a national spatial planning scale. Τhe proposed methodology deploys a number of criteria and restrictions of previous studies (e.g., wind velocity, water depth, distance from protected areas), while it introduces innovative criteria in relation to OWF siting issues. Exclusion criteria such as seismic hazard zones, landscape protection/visual and acoustic disturbance as well as assessment criteria (AC) such as electrical energy demand and distance from military exercise areas (firing fields and exercise locations) are applied for the first time at national planning scale.
Τhis paper is structured in eight sections. Section 2 briefly presents the proposed methodology. Section 3 defines the exclusion criteria and the relevant exclusion zones and presents the sources and the processing method of the required spatial data. In Section 4, the main technical specifications of offshore wind turbines (e.g., most suitable support structure definition) and their layout characteristics considered in this study are presented. Section 5 describes the method applied for estimating CAPEX, OPEX, and DECEX during the life cycle of the projects and, thus, the total investment costs of the portfolio projects. Section 6 includes a description of the criteria used for assessing SA for OWF siting and of the portfolio analysis, while in Section 7 the results of all stages of the methodological framework are presented and discussed. Finally, in Section 8 the conclusions of the present study are cited.

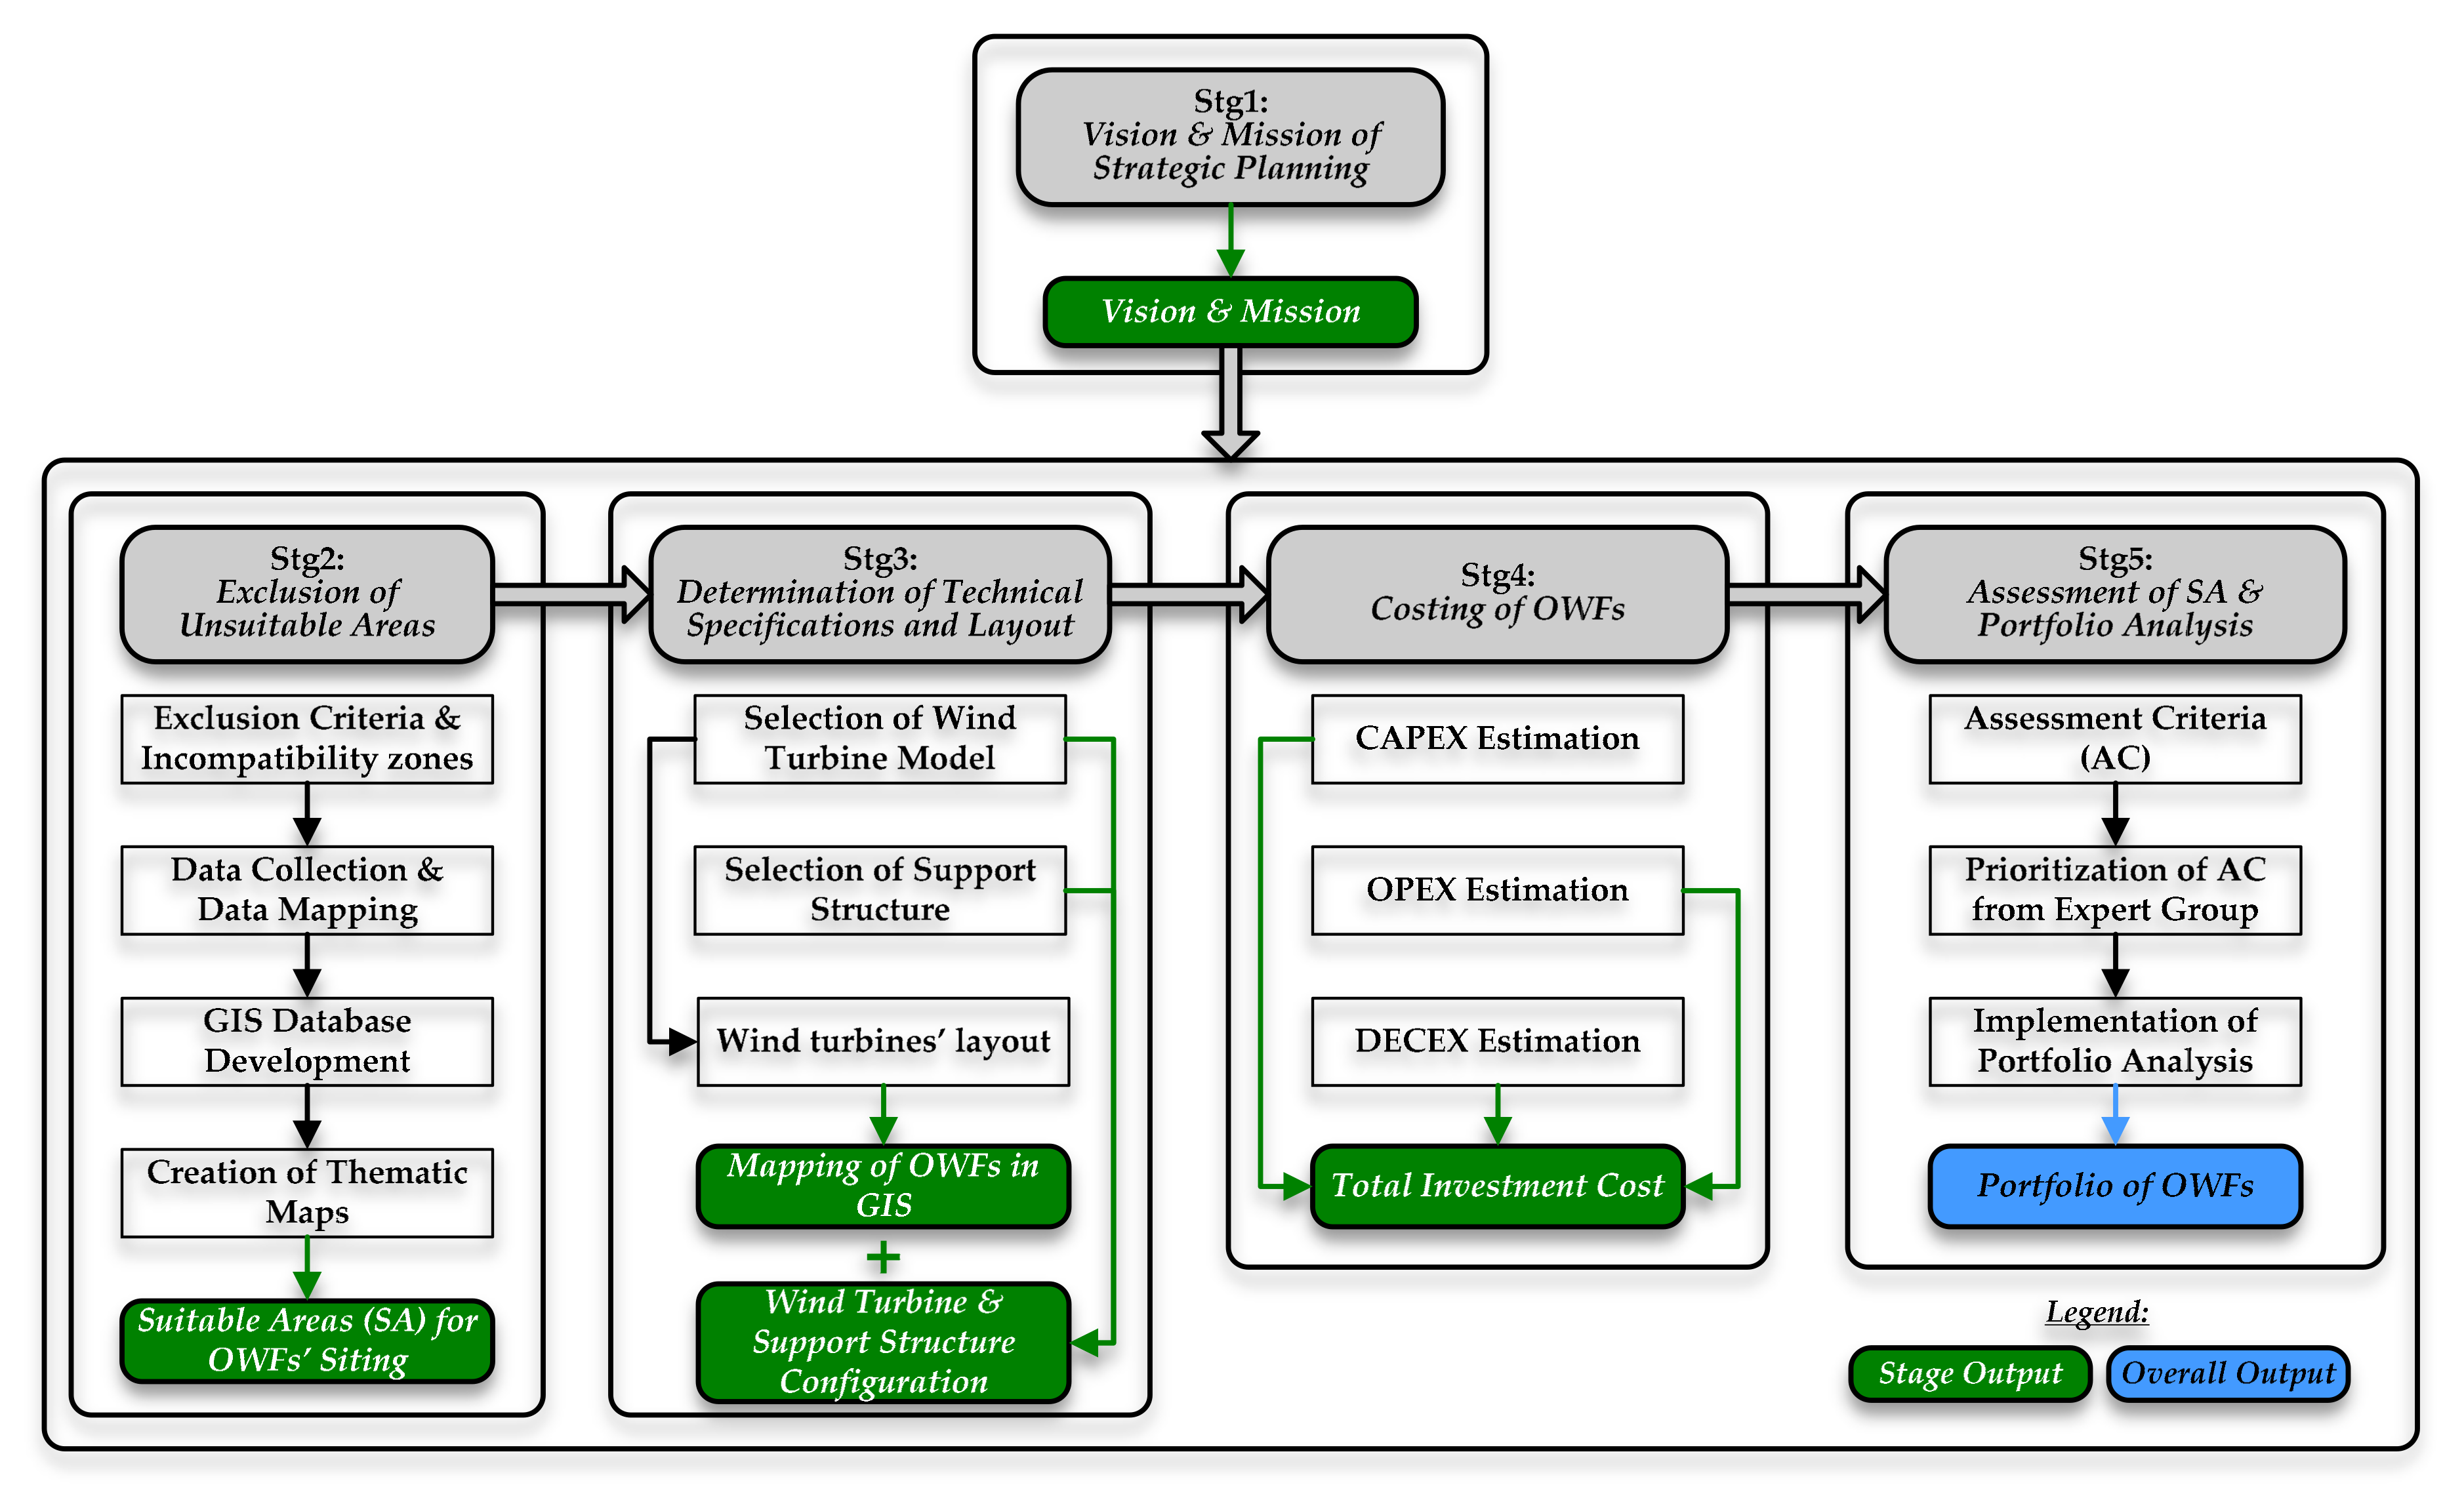
2. Materials and Methods

In order to identify the most appropriate, sustainable, technically and economically viable solutions to site offshore wind projects in Greece the strategic planning methodology shown in Figure 1 is developed and applied in the present paper. The proposed methodological framework consists of five stages, which are analyzed below.
  • Stage 1 (Stg1)—Vision and Mission of Strategic Planning
In the first stage, the vision and mission of the strategic planning are defined, on which the next four stages are based. This stage is approached through a combination of proactive and empirical strategy [27]. It takes into account the current situation in the examined country, regarding the issue of energy independence, as well as the future demand for the production of a large number of public commodities, such as electricity, with the ultimate goal to export the latter and, thus, improve the country’s current economic status. At this point, it is worth to mention that in Greece by the end of June 2018, the total wind capacity, generated only by onshore wind turbines, was 2690.5 MW, representing an increase of only 1.5% or 39.2 MW compared to the end of 2017 [28]. Thus, the abundant wind potential existing in the Greek marine environment remains still unexploited. In addition, the national effort to reduce GHG emissions is focused on the energy sector. The policy plan for Greece ‘National Energy Plan: Roadmap to 2050’ was posted by the Ministry for Energy, Environment and Climate Change in 2012 [29]. The roadmap aimed at a reduction of 60% to 70% of CO2 emissions from the energy sector by 2050 compared to 2005, with 85%–100% of electricity coming from RES [29].
  • Stage 2 (Stg2)—Exclusion of Unsuitable Areas
This particular stage is based on the use of the GIS mapping tool. It includes the exclusion of the areas deemed unsuitable for the siting of OWFs, through the application of various exclusion criteria, resulting to the definition of SA on a national level. The exclusion criteria are defined based on the special characteristics of the examined area, considering also the relevant provisions of the Greek Specific Framework for the Spatial Planning and Sustainable Development for the Renewable Energy Sources (SFSPSD-RES) [30].
  • Stage 3 (Stg3)—Determination of Technical Specifications and Layout
This stage deals with technical issues related to such projects, such as the selection of the model type of the wind turbine (rotor-nacelle-assembly), the selection of most suitable type of support structure, etc. The required technical specifications are determined by the following elements: (i) the specific characteristics of the suitable sites, that is, wind velocity, wind direction, water depth and the available surface area/shape of the proposed sites, and, also, (ii) studying similar projects that have been completed and are in full or partial operation to this day [31]. In addition, using GIS, the OWFs are sited within the SA identified in Stage 2.
  • Stage 4 (Stg4)—Costing of OWFs
This stage includes the estimation of CAPEX, OPEX and DECEX of all proposed projects, considering the available data of similar completed projects that are still in operation [31].
  • Stage 5 (Stg5)—Assessment of SA and Portfolio Analysis
In the final stage of the proposed methodology, the project portfolio is created for the strategic planning of OWFs in Greece and its analysis is carried out. The portfolio decision analysis approach combines multi-criteria evaluation and mathematical optimization and is characterized by the following elements: (i) formation of one portfolio of project proposals (basic goal), taking into account multiple objectives, interactions, and resource constraints; (ii) capturing of the decision makers’ preferences regarding the objectives by utilizing a multi-attribute value function; (iii) implementation of integer optimization to obtain the feasible portfolio with the greatest overall strategic value and (iv) potential implementation of interactive “what-if” analyses to examine how the optimal portfolio of actions changes in response to changes in the model parameters or constraints [32]. The objective of this particular stage is to calculate the strategic value of the proposed projects based on specific AC and to prioritize the implementation of the portfolio projects. AC arise mainly from the special characteristics of the SA and their prioritization is achieved with the contribution of an expert group (EG) on issues related to the siting of RES and, more specifically, OWFs, through a questionnaire survey. The portfolio analysis is carried out using Microsoft Project Portfolio Server software. Various energy policy scenarios are formulated for the country based on economic restrictions.

3. Exclusion Criteria and Data Collection/Digitization

3.1. Exclusion Criteria
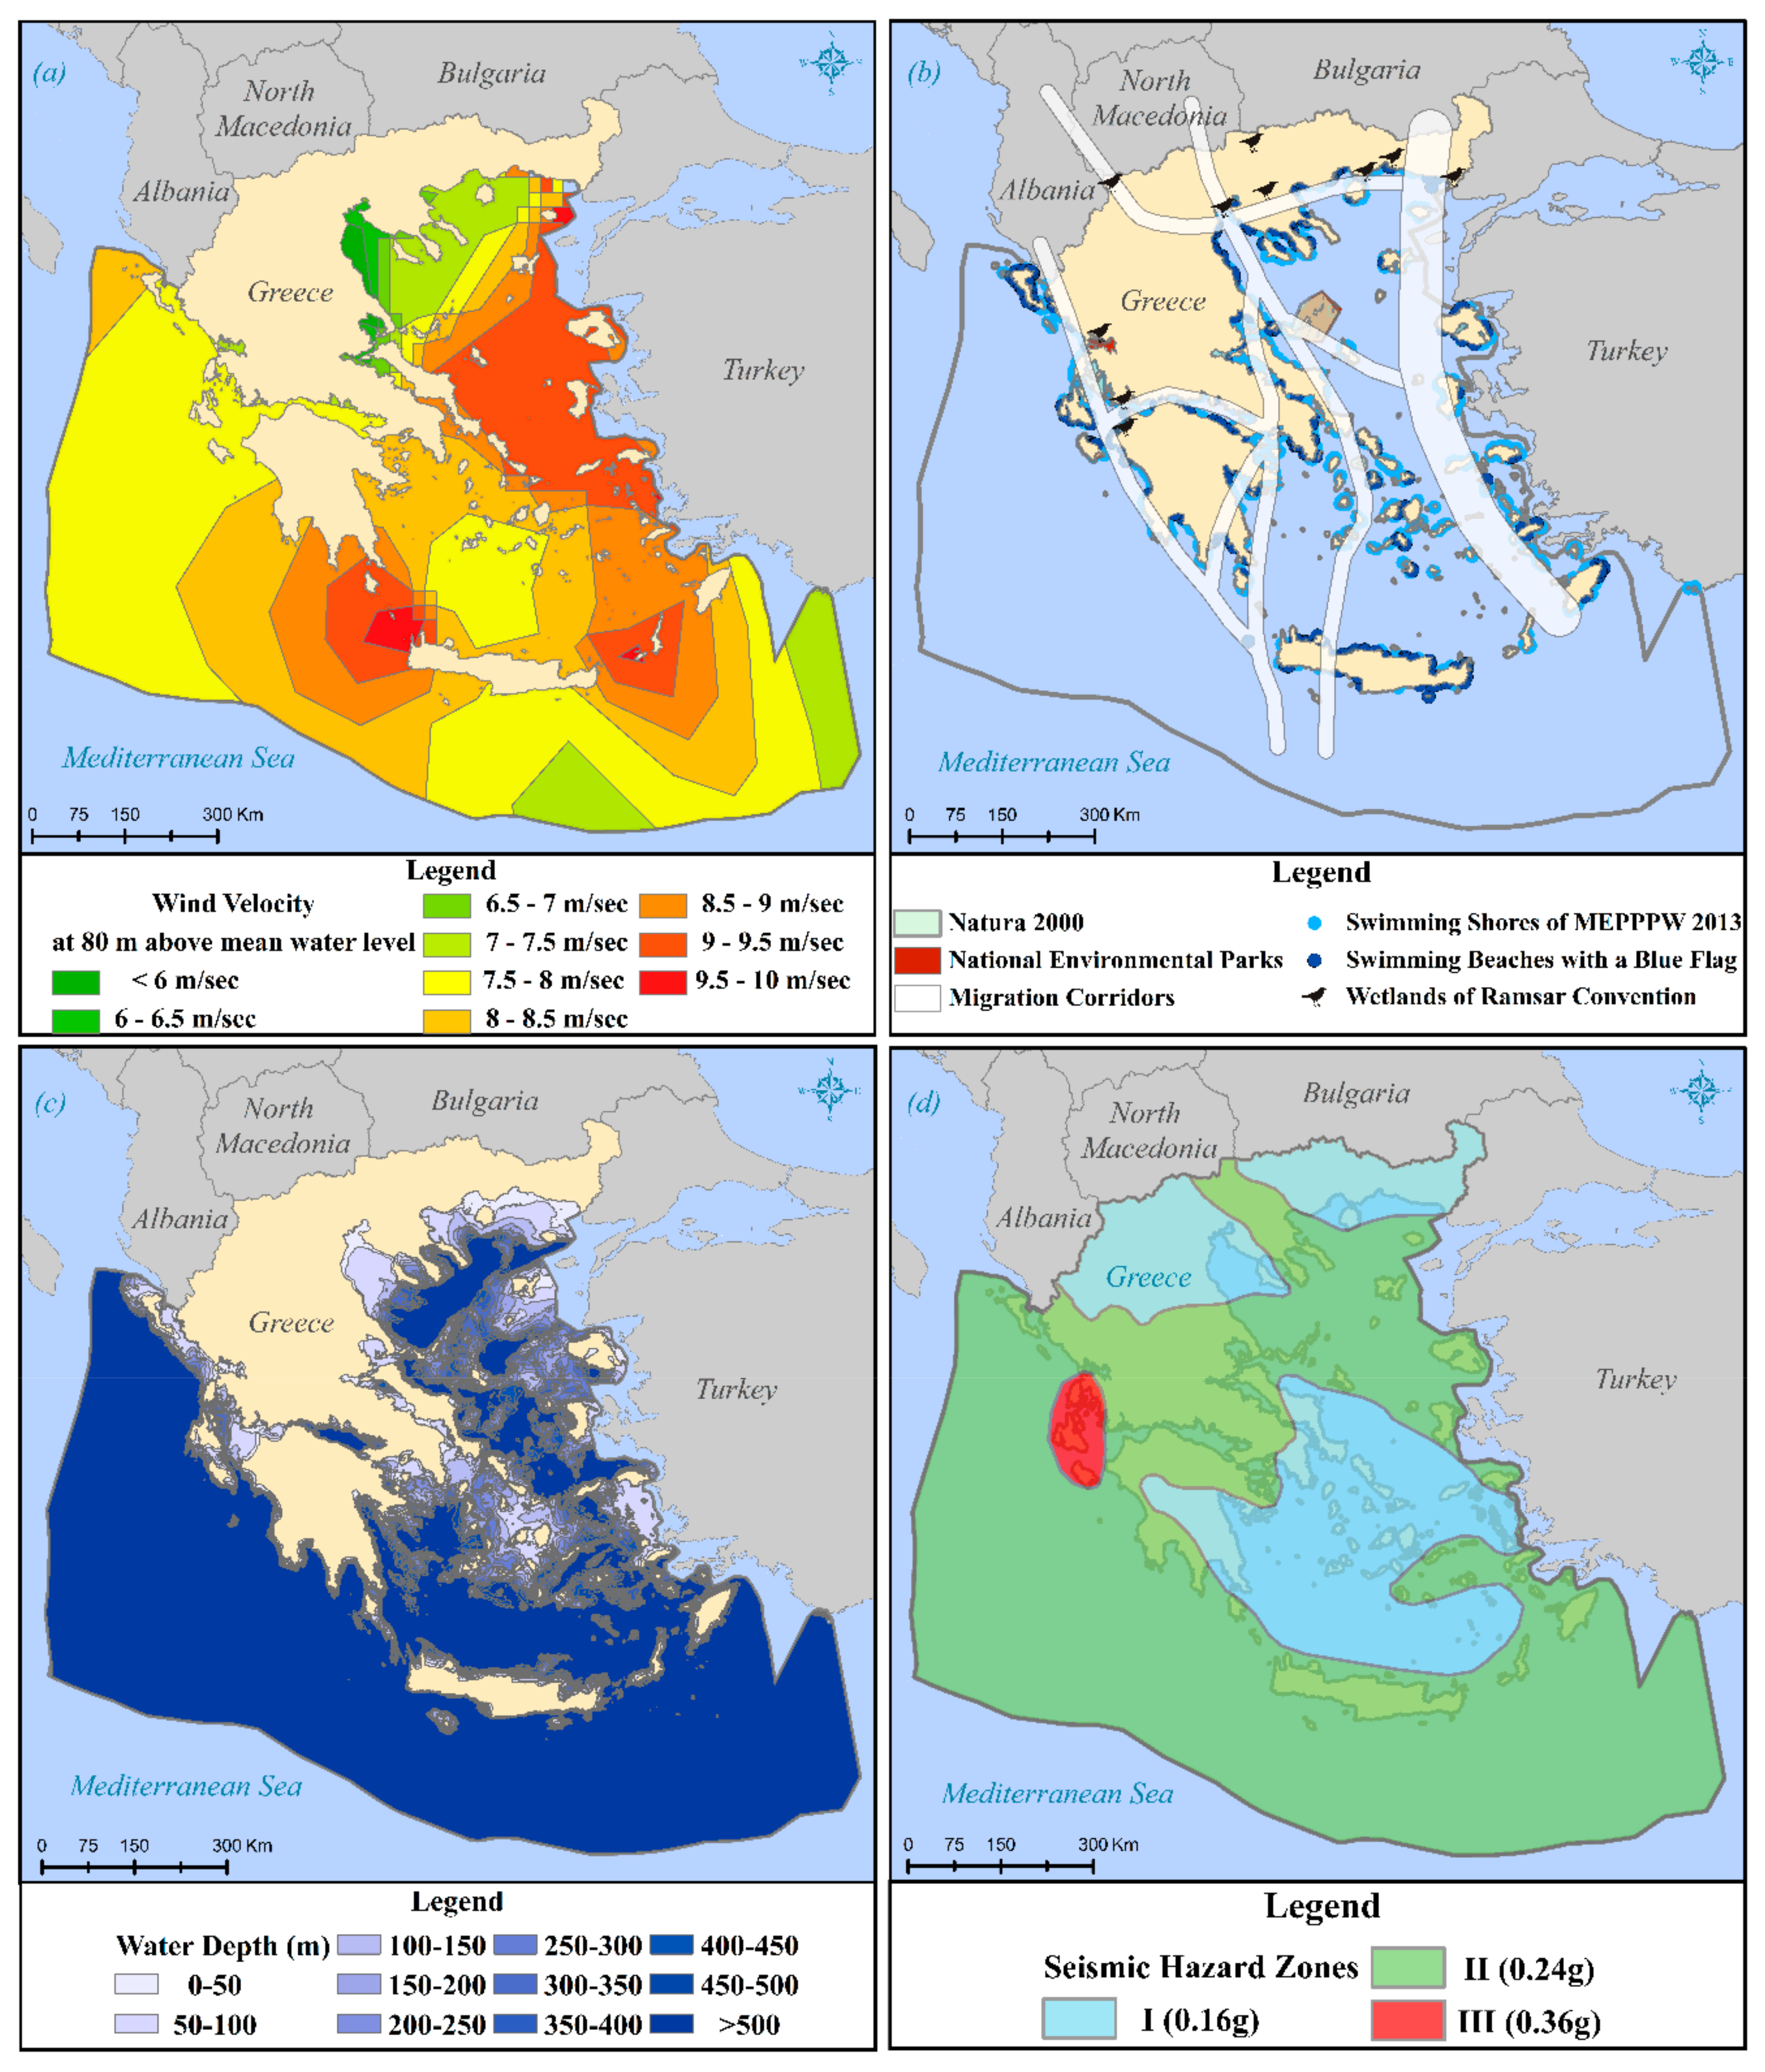
The study area is defined by the EEZ of Greece and any area outside of it, is legally excluded. The EEZ of a country or otherwise the National Territorial Waters, particularly in recent years, is formally taken into consideration, as a siting criterion, [16,20,33,34,35]. The exclusion criteria considered in this paper are discussed below.
  • Wind Velocity
Wind velocity is a significant criterion for the site selection of an OWF, as it is directly linked to the economic feasibility of the project. Therefore, an accurate and detailed analysis of wind data is crucial for a potential wind energy assessment of the proposed suitable sites. In this study, wind velocity data are provided based on measurements made at the height of 80 m on an hourly basis and includes measurements for 10 years (2009–2018). In the present site suitability analysis, marine areas, where annual average wind velocity is smaller than 6 m/s at a height of 80 m above the mean water level, are considered unsuitable for the siting of OWFs [16].
  • Water Depth
Water depth is one of the key criteria for OWFs’ siting, as it significantly contributes to the determination of the investment cost of such projects [1]. Specifically, the water depth affects the selection of the wind turbine’s support structure, as well as the CAPEX and OPEX of an OWF project, which increase significantly in deeper waters. For example, according to [36], it can be assumed that with water depth the costs increase due to mooring, anchoring, and cabling costs in deeper waters. In the present investigation, the maximum limit of water depth is set to 500 m [16,36,37].
  • Military Zones
These marine areas are officially used by the National Army either for training purposes or as firing fields and therefore cannot be considered for any other use. The present criterion is taken into consideration by [8,15,33,34,37].
  • Seismic Hazard Zones
Τhe seismic hazard factor should be considered generally in the site selection process to reduce construction cost. Greece corresponds to one of the most seismically active countries worldwide. Therefore, all infrastructures should be adequately designed against earthquake. In the case of OWFs, this fact may lead to special designs of the wind turbines’ support structure and, therefore, to larger construction costs. Thus, the areas belonging to the Seismic Hazard Zone ΙΙΙ (0.36 g) in Greece are excluded. The present criterion has not been considered so far in any other study of OWFs’ siting internationally, whereas it has been proposed as a criterion for selecting sites suitable for OWF developments in the South Korea by [38], but it was not considered as a site selection criterion in their study.
  • Underwater Cables
This exclusion criterion refers to the cables that already exist on the seafloor and serve either for electricity transmission or for telecommunication purposes (e.g., [8,12,33,34]). It is important to consider the underwater routes of those cables, in order to avoid any damage to them during the installation process of OWF developments.
  • Distance from Ports
The distance of an OWF project from a port presents an important factor affecting the total investment cost, since it has a direct impact on the installation costs, the operation and maintenance costs, as well as the decommission costs of the OWF [39]. Specifically, the total investment cost decreases as the location of an OWF is closer to an existing port, while, moreover, the proximity of the installation area to a port simplifies the overall project management (e.g., no need to install a substation within the marine environment). This criterion has been considered in the site selection of hybrid offshore wind and wave energy systems in Greece [37]. The selected limit of the distance from a domestic port is set in the present paper at 100 km and marine areas that are further away from 100 km are excluded.
  • Distance from High Voltage Electricity Grid
The distance of an OWF from the national electricity grid and particularly from a high voltage grid is extremely important for technical and economic reasons. A connection to the high voltage grid is selected, because in the opposite case (connection to a medium or low voltage grid) there might be a serious risk of cable destruction due to overloading of the electricity grid [20,26,36]. There are studies that set the distance of the candidate siting areas from the electricity grid at a limit of 200 km [8,39], while there are others that reduce this limit to 60 km [20] or even to 40 km [26]. In the present paper, the limit of 100 km from the existing and the potential officially approved high voltage electricity grid was selected. Moreover, one of the most important factors for the development of OWFs is the evaluation of capacity of the grid. In Greece, the Independent Power Transmission Operator (IPTO) S.A. undertakes the role of transmission system operator for the Hellenic Electricity Transmission System (medium and high voltage grid). In 2018, IPTO published an approved future plan for the spatial development of medium and high voltage grids in Greece as a target for 2027 [40]. In this plan, the majority of the islands that are both close and far away of the mainland lack medium and high voltage grids. Therefore, it is impossible and economically not viable to find locations for the development of OWFs in a long distance from the mainland in the near future. A more detailed analysis of the capacity of grid could be useful for the OWFs’ development, but this analysis is out of the scope of the present study.
  • Landscape Protection/Visual and Acoustic Disturbance
The present criterion is related to the distance of an OWF from the coast and it has been used to ensure landscape protection, avoid visual and acoustic disturbances, and ensure the social acceptance of an OWF [15,17]. In the present study, marine areas with a distance from the coast smaller than 20 km are considered unsuitable for OWFs’ siting and are excluded from further analysis. This limit is defined based on [36]. Moreover, the 20 km ensure a distance of at least 130 times of the total height of the selected offshore wind turbine, in order to avoid the visual and acoustic impacts of the project.
  • Distance from Shipping Routes
The existence of safe navigation routes that connect the plethora of Greek islands with the mainland is an extremely important issue. In order to ensure the protection of shipping movement either for trade or tourism, a safety distance of approximately 5 km (3 miles) from the referred routes is selected [9,13].
  • Distance from Marine Protected Areas
In this paper, marine protected areas correspond to Sites of Community Importance (SCI) of Natura 2000, national marine environmental parks, coastal bathing waters monitored and assessed in the framework of the Monitoring Programme of Bathing Water Quality according to the provisions of the Directive 2006/7/EC and swimming beaches awarded with the Blue Flag. In this paper, the minimum distance from marine protected areas is selected equal to 2 km, as according to previous studies [11,13,17] the relevant distance limit is set at 1–2 km.
  • Distance from Wildlife Refugees and Migration Corridors
This criterion includes migration corridors and wetlands of international importance, as defined according to the Ramsar Convention. The specific criterion is considered in order to reduce the potential risk of birds’ collision on the wind turbines, mainly during the migratory period. The installation of OWFs should be avoided within the boundaries of the referred areas which are hosting a variety of birds. An exclusion zone of 3 km is taken into account [10,13].
  • Distance from Residential Network
According to the national legislative framework (SFSDSP-RES) [30] minimum distances from residential settlements and from traditional settlements equal to 1 km and 1.5 km respectively are taken into consideration.
Based on all the above, Table 1 summarizes the exclusion criteria considered in the present paper and their incompatibility zones.

3.2. Data Collection/Digitization

In order to identify and analyze all the environmental, economic, technical, legal, and political characteristics of the EEZ of Greece, it was essential to collect and appropriately digitize, if necessary, certain geographical information data from national institutes, research centers, services, and official international and national websites that provide officially approved cartographic data.
More specifically, the digital data used in the present study in correspondence with the responsible entity/source are as follows: (i) Water depth data obtained from the Hellenic Navy Hydrographic Service [41]. (ii) Wind velocity data provided by the Hellenic Centre for Marine Research [42]. (iii) Data of the EEZ of Greece, the Mediterranean Sea and Greece gathered from the electronic database of the European Statistical Service [43]. (iv) Data of SCI, national marine environmental parks, coastal bathing waters, swimming beaches and wetlands of international importance obtained from the “GEODATA” official national website, which has been characterized as the national gate of geographical information data of Greece [44]. (v) Data of the underwater telecommunication cables within the EEZ of Greece, which were collected from the electronic database of the official European website “EMODnet” [45].
Except of the above, the following data were identified, collected, and mapped: (i) The verified shipping routes of the whole country were digitized through the basemaps of the cartographic tool ArcGIS, using the same projected coordinate system. (ii) The military zones used for training purposes and as firing fields, which were provided in analog format by the Hellenic Navy Hydrographic Service [41] and they were, then, appropriately digitized. (iii) The migration corridors, which were mapped by obtaining a corresponding map (in image format) from the Hellenic Ornithological Society [46]. (iv) The domestic ports, which were mapped by providing information of their locations and their names [47]. Only the officially designated ports of the country were mapped. (v) The seismic hazard zones of the country, which were digitized through the official seismic hazard map, collected as an image from the Technical Chamber of Greece [48]. (vi) The data related to the underwater cables of the electricity grid, the locations of the 400 kilovolt (kV) high voltage centers and the 150 kV high voltage substations, obtained from the IPTO, through an official map found in [40].

4. Technical Specifications and OWF Siting Layout

4.1. Definition of Wind Turbine Model

In the present study, the generic 5 MW turbine, which was developed by the National Renewable Energy Laboratory (NREL) [49] is selected. This wind turbine model has been also used in several previous studies [39,50,51,52], while a large number of existing and fully or partially operational OWFs globally, deploy offshore wind turbines with the same nominal power (ten in Europe and six in Asia) [31].

4.2. Selection of Wind Turbines’ Support Atructure

The selection of the wind turbines’ support structure is related to the water depth of the SA (Stg2, Figure 1). These areas are located at a water depth of over 50 m (see Section 7.2 below) and, therefore, floating platforms as support structures are preferable [16,39,51]. In the present paper, for water depths of 50–200 m, the Tension Leg Buoy (TLB) is selected as the floating support structure of each wind turbine. TLB systems can serve as sustainable solutions for the exploitation of RES [39,53]. In the North Sea, where harsher wind and wave conditions compared to the Greek marine environment exist, it has been demonstrated that TLBs present the most cost-effective systems for water depths from 50 to 200 m [52]. As for water depths of 200 to 500 m, the Hywind concept is selected. The simple design of Hywind offers many important advantages, such as evidence-based technology, simple support structure construction with the possibility of standardization and lower fabrication cost, as well as robustness and suitability in case of harsh environmental conditions [54]. The Hywind floating system, although slightly more expensive than the SWAY system in terms of cost per megawatt hour (MWh) [39], corresponds to a floating platform that has been used with success globally [54,55].

4.3. Definition of the Wind Turbines’ Layout Within the Suitable Areas

The layout of the wind turbines depends on various factors (e.g., cost, wake effects, etc.) and its determination corresponds to an optimization problem [56,57]. In this paper, an oriented approach that fulfills the aim of the present investigation is developed which, moreover, takes into consideration the European best practices. Specifically, the distance between two successive turbines at a line parallel and perpendicular to the prevailing wind direction is denoted as dx and dy respectively, while Drotor denotes the rotor diameter. In existing, fully-commissioned European OWFs (e.g., Nysted OWF Denmark, Eneco Luchterduinen OWF Netherlands, Kentish Flats OWF United Kingdom, Belwind OWF Belgium), the values of dx are between 4.6~12.1Drotor, while the corresponding range for dy is 3.2~8Drotor [58]. In addition, according to [59] NREL recommends values of dy correspond to 5~10Drotor. In the present study, the wind turbines’ layout is determined with the use of ‘Advanced Editor Tools’ in ArcGIS and according to the following elements: (i) main wind direction of each specific site, (ii) Drotor of the selected wind turbine model, (iii) shape of each OWF site and, also, (iv) the referred European standards, in order to minimize the array losses in the proposed OWF projects. Considering all the above, in this study, the defined dx and dy values for the wind turbines layout are 7Drotor and 7Drotor respectively.

5. Cost of OWFs

5.1. Estimation of CAPEX

The components of CAPEX considered in the present study are: (i) development and consenting, (ii) construction phase insurance, (iii) rotor-nacelle-assembly costs, (iv) production costs (including tower and support structure), (v) mooring costs (including installation for the case of floating wind turbines), (vi) grid costs (including installation), and (vii) installation of the whole wind turbine system [39,51]. According to [16,60,61,62], CAPEX is estimated taking into account the water depth and the distance from the shore. In addition to these factors, the CAPEX of such projects depends upon: (i) the wind turbine support structure deployed, which can be either fixed to the sea bed or floating [16,39,51,52,60] and (ii) the nominal power of the wind turbine.

5.2. Estimation of OPEX

OPEX of OWFs are a major part of the total investment costs and they are directly linked and largely affected by the distance from ports and by the water depth [39,51]. In addition, according to [16,39,51], OPEX per year for floating support structures correspond to approximately 3% of CAPEX (€/MW). In [39,51] OPEX was considered equal to 3.7% of CAPEX (€/MW) for wind turbines with a TLB floating platform and equal to 3.44% of CAPEX (€/MW) for wind turbines with a Hywind floating platform. After calculating OPEX for all OWFs for their first year of operation, OPEX during their total life cycle, which is defined equal to 25 years [62], can be estimated. For this purpose, the formula of the present value of annually allocated expenses (PVAAE) (Eq 1.) was used [63]:
P V A A E = 1 + i n 1 i 1 + i n
where n are the years of operation (25 years) and i the interest rate, which is taken equal to 2.5%.

5.3. Estimation of DECEX

DECEX of an OWF project may correspond to 0%–4% of the total investment costs [16,51,62,64]. In the present paper, for each project, DECEX is taken equal to 2% of the corresponding total investment cost, since it is considered that although a significant amount is collected from recycling the salvaged construction materials, this amount does not suffice to cover the DECEX in total.

6. Assessment of Suitable Areas and Portfolio Analysis

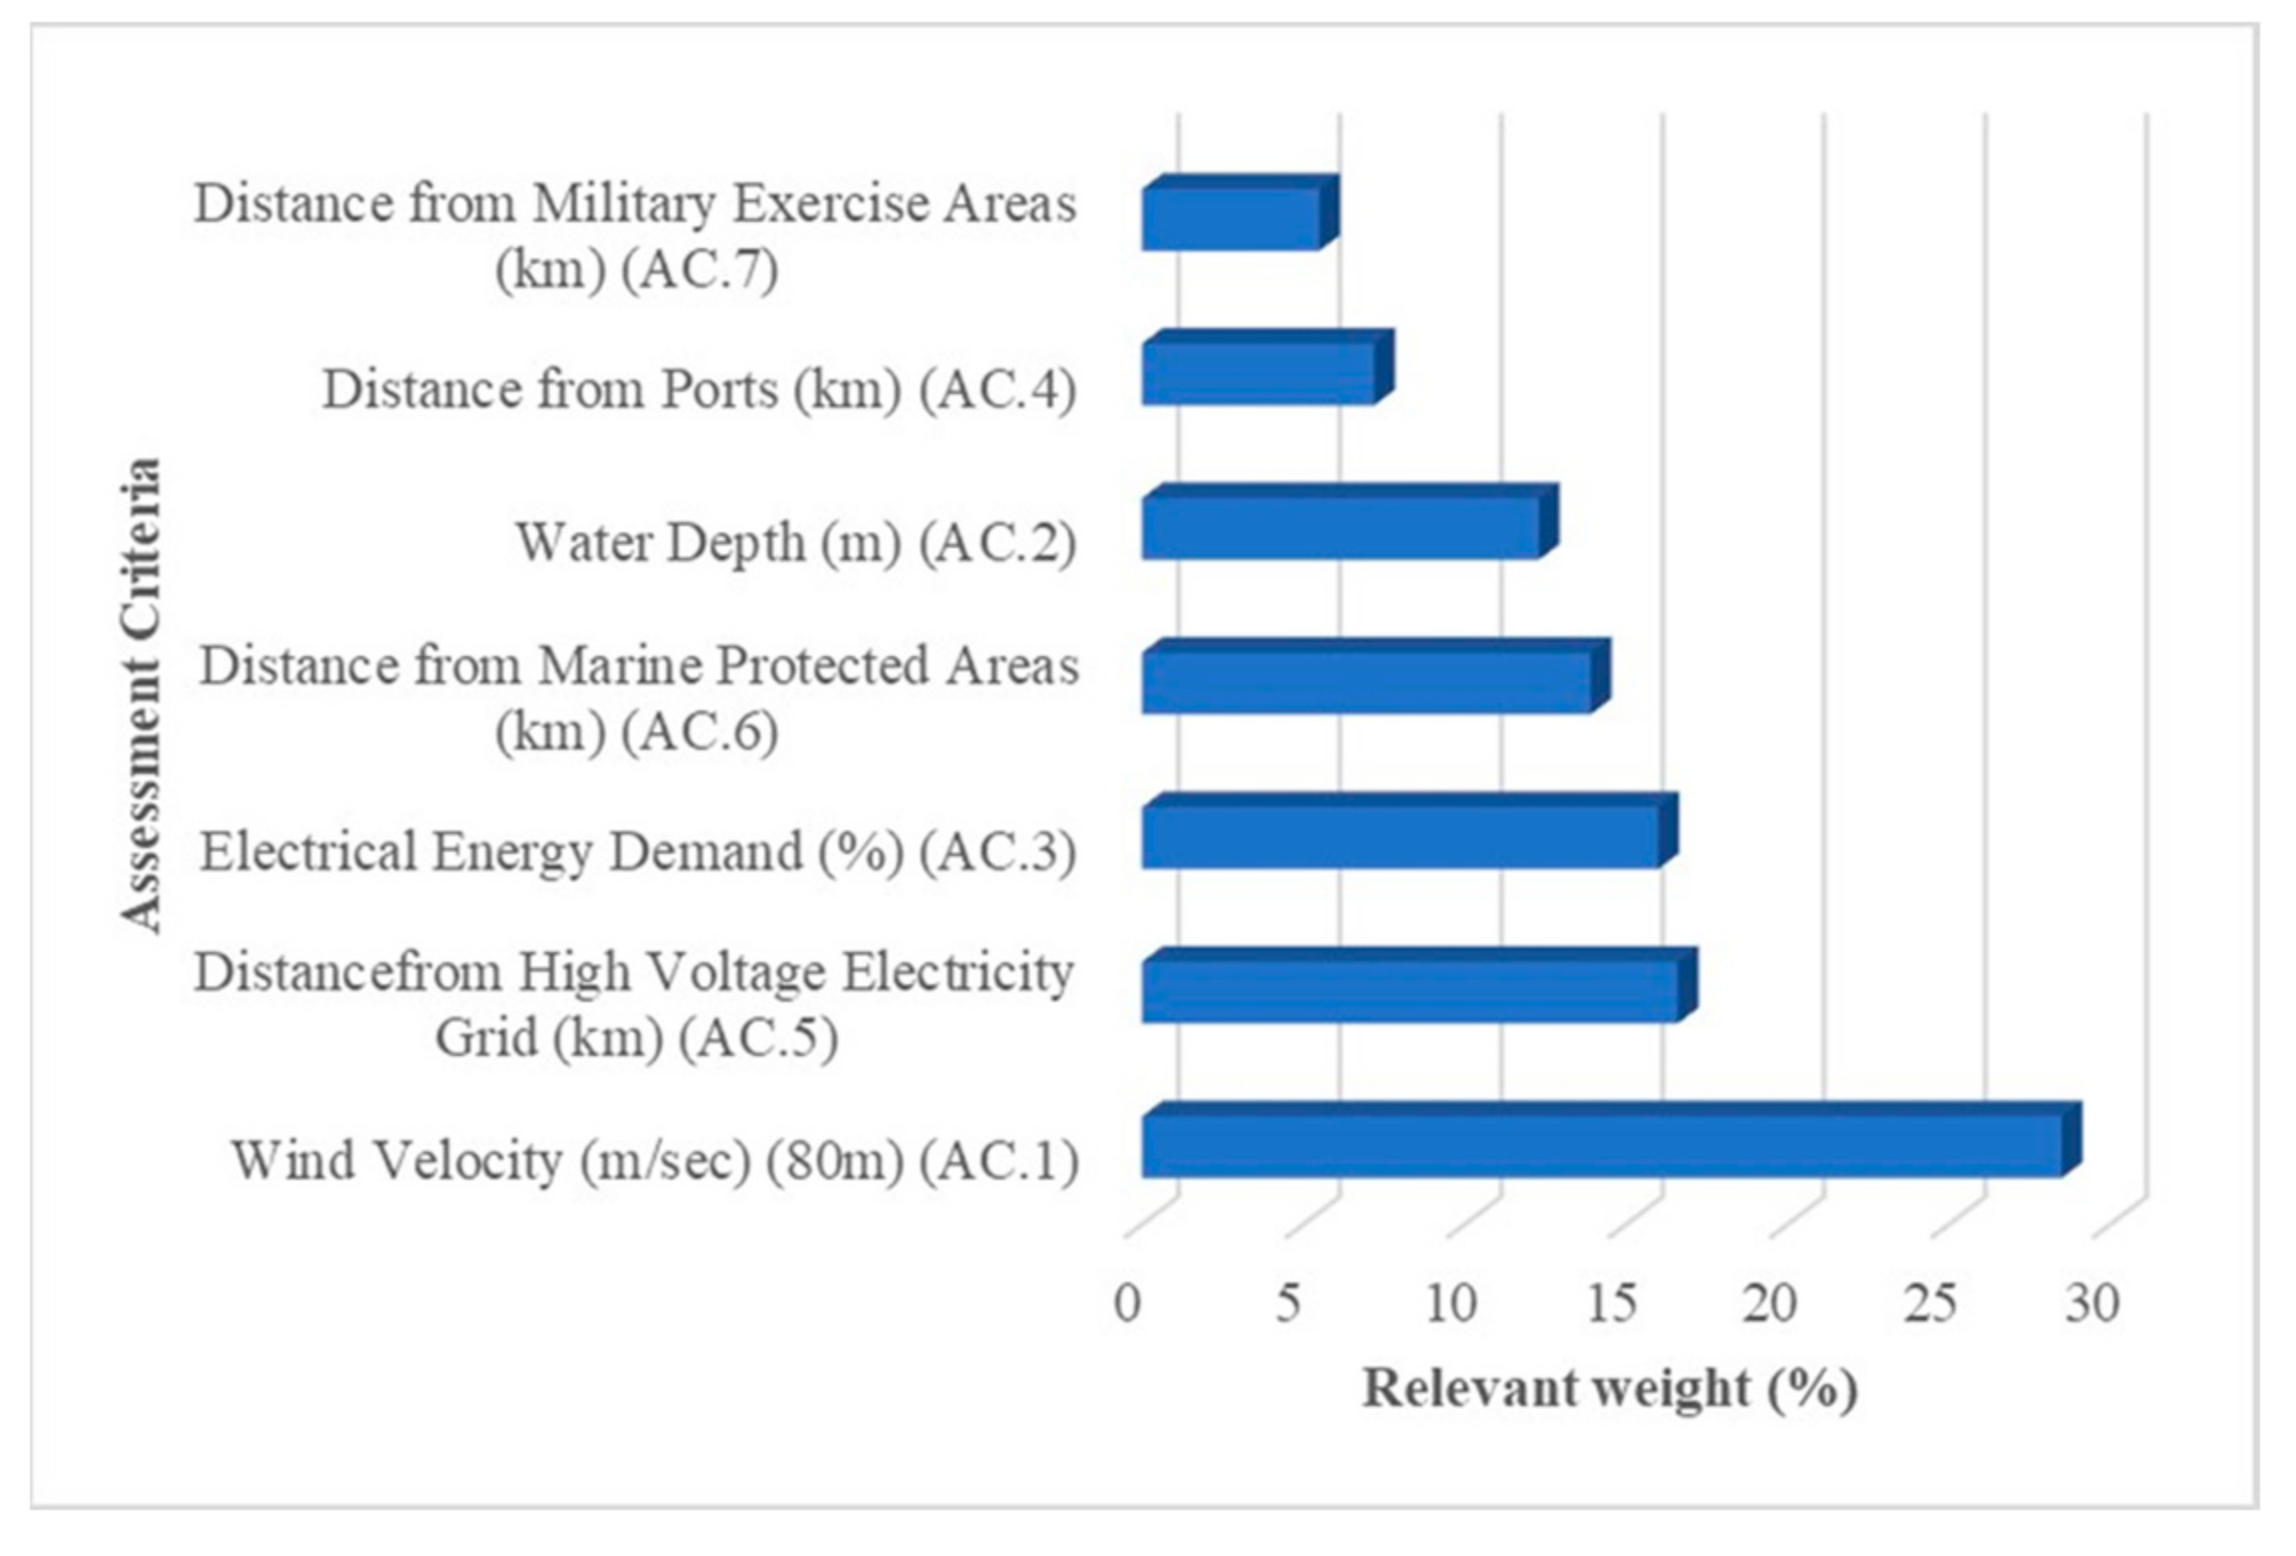
6.1. Assessment Criteria

The AC used for the portfolio analysis include: (i) wind velocity (AC.1) [8,12,13,14,20,26,36], (ii) water depth (AC.2) [8,26,36], (iii) electrical energy demand (AC.3), (iv) distance from ports (with water depth >10 m in terms of draft requirements) (AC.4) [36], (v) distance from high voltage electricity grid (AC.5) [8,9,12], (vi) distance from Marine Protected Areas (AC.6) [12,13,14] (vii) distance from military exercise areas (firing fields and exercise locations) (AC.7). It is worth to note that “electrical energy demand” and “distance from military exercise areas (firing fields and exercise locations)” have not been used before as AC for the siting of OWFs.

6.2. Prioritisation of AC

The prioritization of AC is based on a suitably designed questionnaire, which was sent via e-mail to an EG on siting of RES, and, more specifically, of OWFs. The group consists of forty experts from universities, institutes, research centers and companies around the world (USA, Europe, and Asia). These experts were carefully selected, considering the different backgrounds of the participants, so that their distinct opinions reflect different strategic orientations of the present RES siting problem and in order to emphasize the complexity of such siting problems. Out of the forty questionnaires sent out, seven were successfully completed, and were answered by professors, experienced scientific researchers and spatial analysts of RES from various European countries (Greece, Spain, Italy, The Netherlands, etc.). The experts prioritized the selected criteria in the questionnaires based on their own high experience and their own different preferences; the majority of the experts have over seven years of experience on such topics. Figure 2 presents the final prioritization of the AC. The consistency ratio calculated by Microsoft Project Server reached 100%.

6.3. Portfolio Analysis

This particular step involves the actual selection process, where all project proposals are examined in conjunction with the AC and economic restrictions. More specifically, the portfolio analysis arrives at a prioritization of the project proposals, depending on their performance in relation to the AC. Thus, if a project has a major impact on several parallel AC, it is placed high on the priority list and receives a high strategic value score.
In this paper, the portfolio analysis is carried out using Microsoft Project Server software and include the following main steps: (i) input of AC in the library of the influencing factors, (ii) input of all projects (OWFs) and of their estimated total investment cost in the project center, (iii) assessment of the strategic impact of each OWF, based on the particular features of the projects related to the specific AC using a 5-point scale (Table 2), (iv) input of the relevant weight of each AC (Figure 2) according to the EG and (v) creation of scenarios based on economic restrictions (50%, 60%, and 75% of the total portfolio).

7. Results and Discussion

7.1. Strategic Planning Vision and Mission

The Strategic Planning vision and mission involves a clear constant declaration of purpose that describes the values and priorities of the country, as regards the implementation of OWFs and it is addressed to several different stakeholders, people or groups that are directly or indirectly linked to the implementation of the proposed Strategic Plan. In this paper the vision/mission is defined as follows:
“To acquire national energy independence, by considering sustainable development as well as social responsibility and acceptance as a top priority. The main strategic goal is to promote integrated solutions for the siting, technical characteristics and decision-making issues of OWFs”.

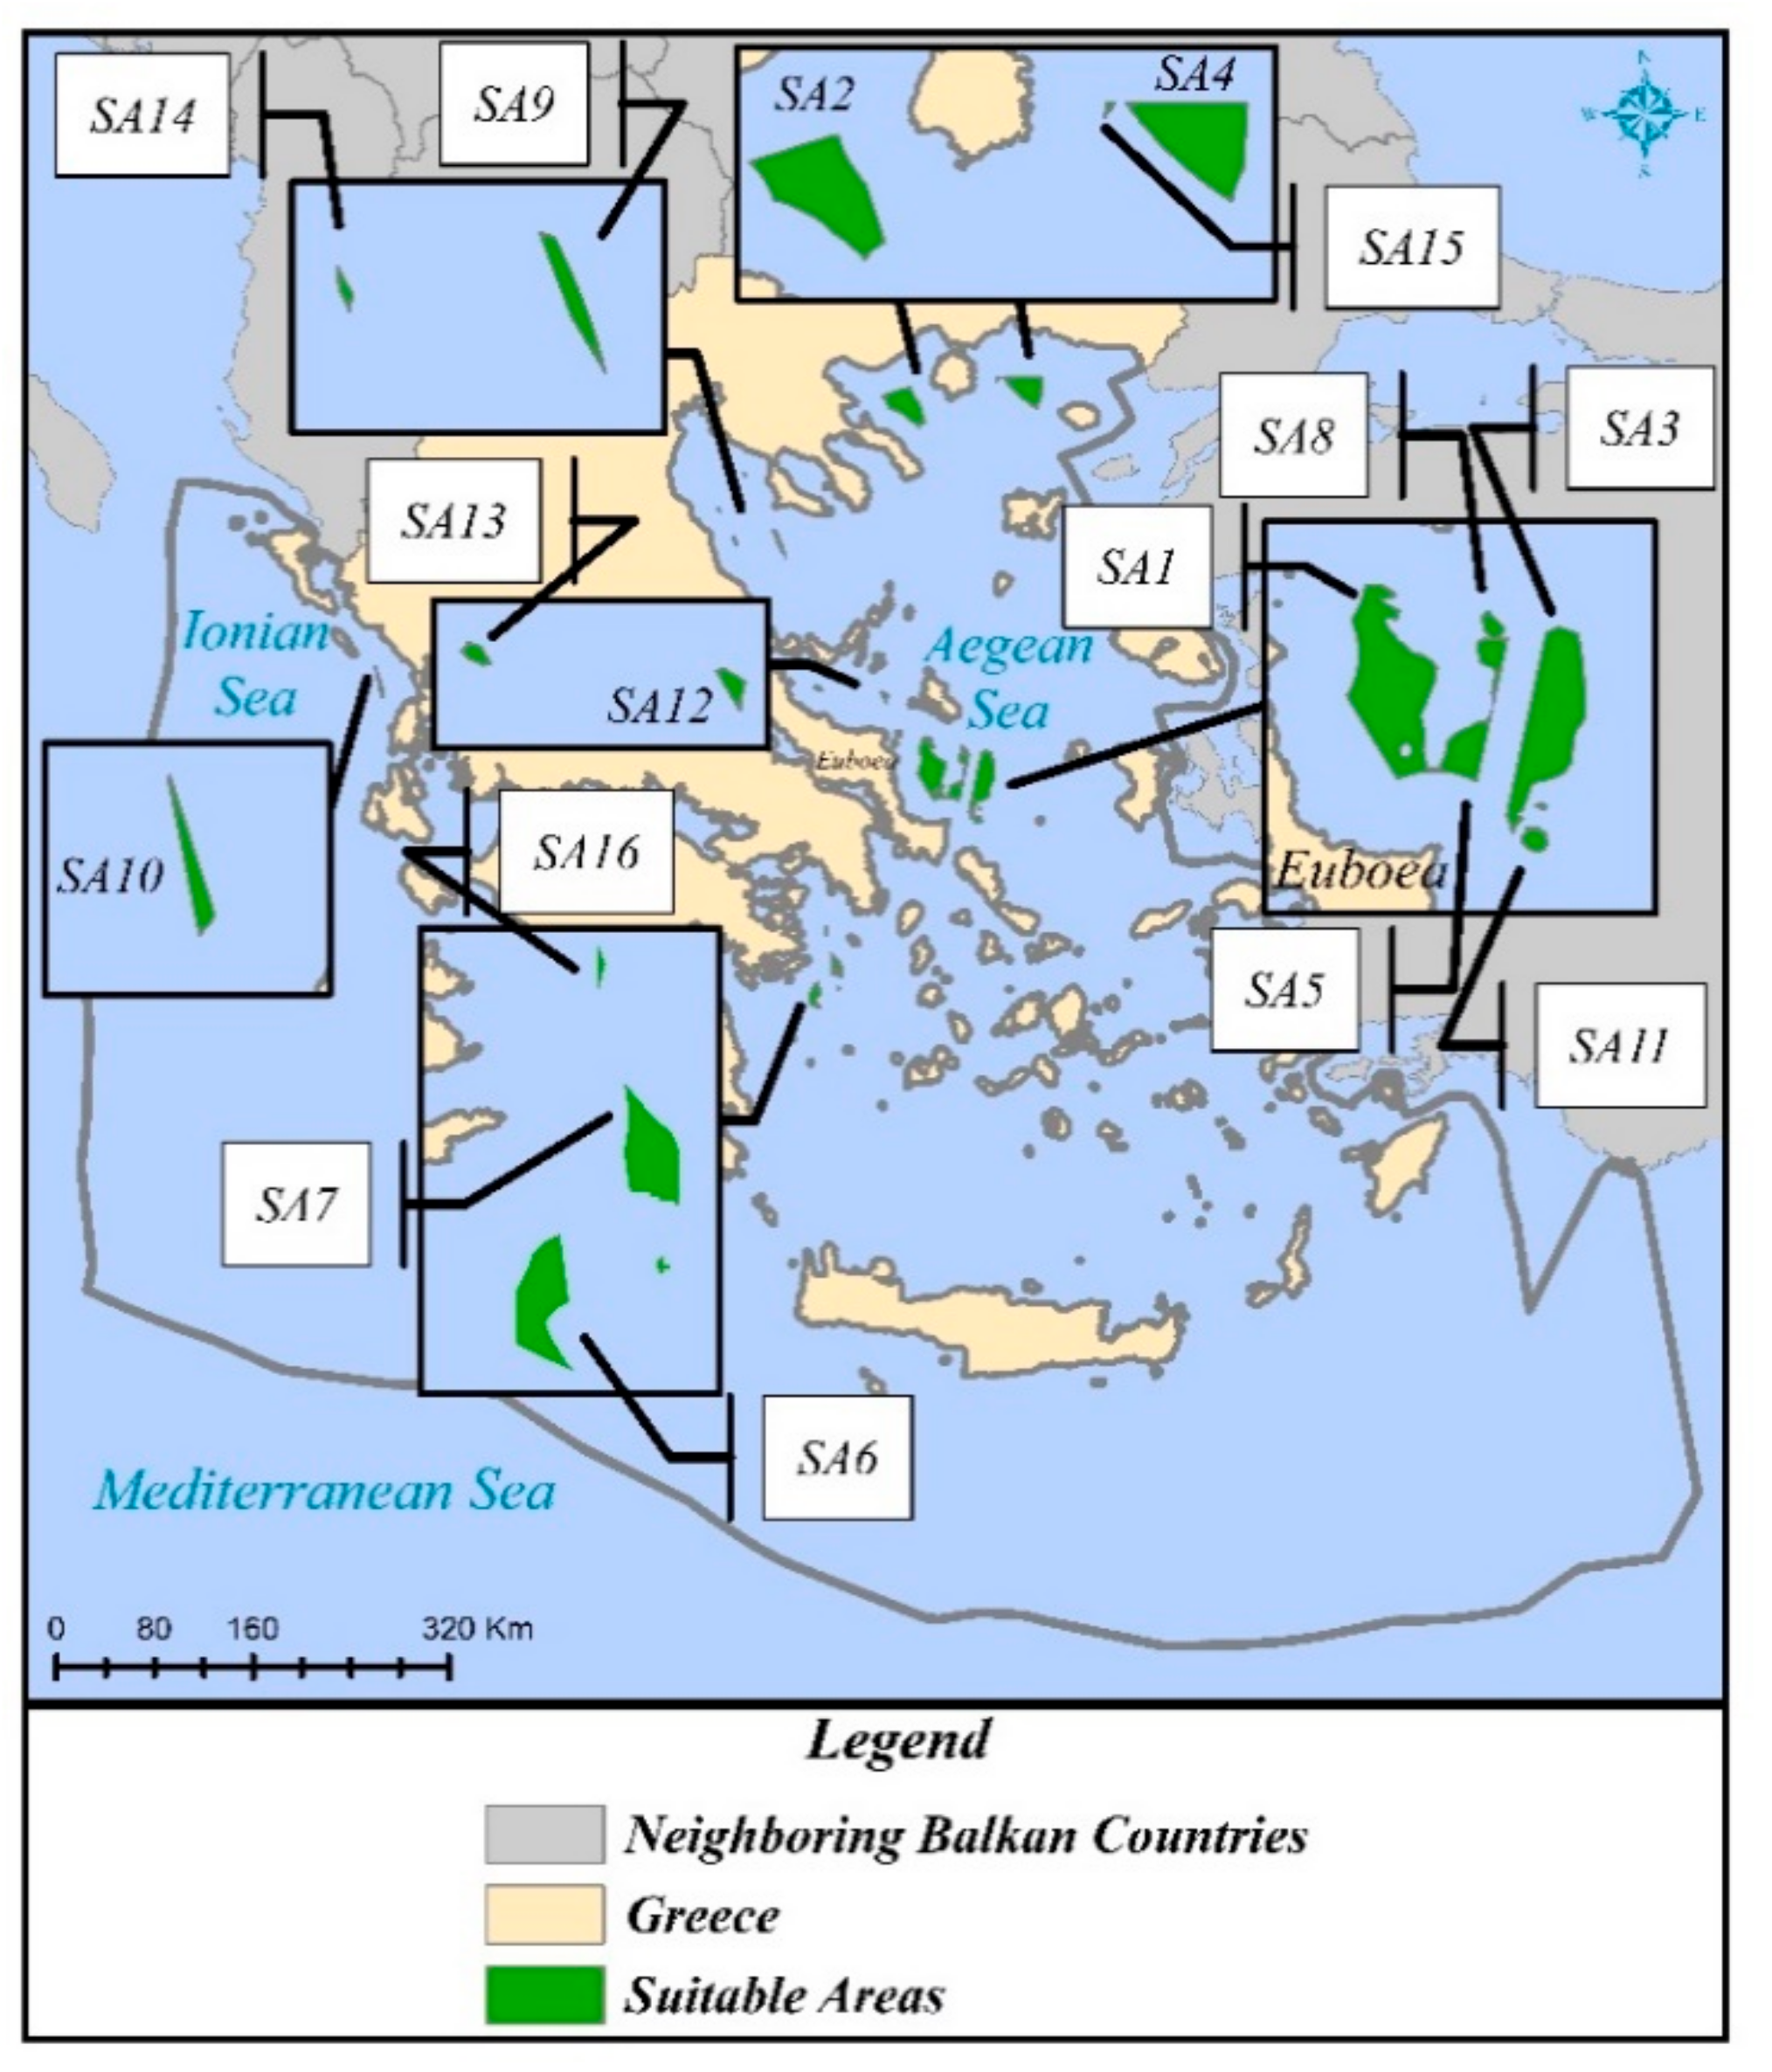
7.2. Identification of Suitable Areas

For identifying marine areas suitable for OWFs’ siting in Greece the 13 exclusion criteria, EC.1~EC.13, (Table 1) are taken into account. Figure 3a–d show indicatively the developed for this purpose thematic maps of the exclusion criteria corresponding to: (a) wind velocity (EC.2), (b) marine protected areas (EC.11), wildlife refuges and migration corridors (EC.12), (c) water depth (EC.3) and (d) seismic hazard zones (EC.5). By creating, editing, and managing three different linear models with the use of geoprocessing tools in the ‘ModelBuilder’ in ArcGIS software, the SA for OWFs’ siting in the Greek marine environment emerge and are shown in Figure 4. Specifically, applying the referred models, all prohibited and unsuitable areas erased of the map, according to the limitations that defined on Stg 2.
The number of SA is sixteen (16). Certain very small sites, less than 2.5 km2, are not taken into account, since the installation of wind turbines in these small areas does not fulfill any financial purpose. Among the exclusion criteria considered, the water depth and the lack of a high voltage electricity grid represent the two most limiting factors. More specifically, with regard to latter exclusion criterion, there are very few high voltage centers of 400 kV in the south of the country, which are actually situated close to the shore. It should be also noted that for all SA, the water depth is larger than 50 m, advocating the use of floating support structures.

7.3. Identification of Suitable Areas

The mapping of the 16 OWFs is carried out, using the ‘Advanced Editor Tools’ in ArcGIS, and the exact number of 5 ΜW wind turbines is calculated, along with the capacity of each OWF (Table 3). Indicatively, the micro-siting configuration of OWF15 and OWF4 is presented in Figure 5.
According to European Network of Transmission System Operators for Electricity [65], the net electricity generating capacity of Greece was in total 16,392.43 MW for 2017 and specifically the amount of 8220.02 MW was produced from RES (25.33% from onshore wind energy, 29.78% from solar energy, 0.73% from biomass energy, 41.35% from renewable hydro energy and 2.81% from other renewable energy sources) and the amount of 8172.41 MW was produced from non-RES. Consequently, with the development and the implementation of the proposed strategic plan, the results from the applied methodology reveal that 45.34% of the electrical energy produced from all the projects in the above table would suffice for the country to achieve energy independence.
In order to keep the total investment costs (e.g., operation and maintenance costs) to minimum and to deploy the suitable marine sites to maximum, the large OWF projects (e.g., OWF1, OWF2) should not be separated into smaller projects. It is suggested that the referred large projects should be implemented in phases, such as ‘Gode Wind OWF’ in Germany (Project Capacity: 582 MW) [66,67].

7.4. Investment Cost of OWFs

According to [39], CAPEX of offshore 5 MW wind turbines with a TLB platform and Hywind platform, located at a distance of 200 km from the port and at a water depth of 200 m, are estimated equal to 3.537 × 10⁶ €/MW and 3.807 × 10⁶ €/MW respectively. Moreover, it has been shown in [1] that an increase of 10% in water depth or of the distance from the shore will lead to an increase of 1% of investment costs, related mainly to installation and grid connection costs, as well as support structure costs (including installation). By using this rule-of-thumb and considering the aforementioned values of CAPEX per MW as a basis for CAPEX calculations, the CAPEX of OWFs for a given water depth and distance from shore are finally estimated. For example, for a 5 MW wind turbine with a TLB floating platform installed at a water depth of 100 m and at a distance of 50 km from the shore, CAPEX is estimated equal to 3.095 × 10⁶ €/MW (a 12.5% reduction of the 3.537 × 10⁶ €/MW base value has been assumed, due to decrease of both water depth and distance from the shore). Regarding OPEX and DECEX, these quantities are expressed as percentages of CAPEX and of total investment cost respectively, as explained in Section 5.2 and Section 5.3 above. Table 4 includes the total investment cost of the 16 OWFs, which is used as input in the portfolio analysis. The proposed projects, shown in Table 3 and Table 4, could be financed by European Investment Bank (EIB), as the EIB Board (2015) approved support for strategic infrastructure investment totaling nearly € 7 billion for new OWFs in the UK and Belgian coasts [68]. Moreover, the proposed OWF projects could be financial supported by both private (e.g., Greek private banks) and public funds (e.g., Greek public bank).

7.5. Results of Portfolio Analysis

The characteristics of all OWFs in relation to the AC required as input in the portfolio analysis are presented in Table 4.
By taking into account the relevant weights of the AC (Figure 2) and the data of Table 4, the portfolio analysis is implemented. Table 5 presents the prioritization of the project portfolio based on the calculated strategic value. The implementation of the whole portfolio achieves a strategic value of 100%, since all proposed projects are implemented, and the investment cost of the whole portfolio amounts to 111.214 × 10⁹ €.
Next, three possible scenarios for the implementation of portfolio projects are examined. The first scenario corresponds to an investment of 50% of the total portfolio (i.e., 55.607 × 10⁹ €), the second one to an investment of 60% of the total portfolio (i.e., 66.729 × 10⁹ €), while the third one to an investment of 75% of the total portfolio (i.e., 83.411 × 10⁹ €). By implementing the first scenario, eleven OWFs with a 70.08% total strategic value can be realized including OWF3, OWF5, OWF16, OWF8, OWF7, OWF13, OWF11, OWF4, OWF15, OWF12, and OWF14 (in descending order). Most of these OWFs are located Southeast of Euboea (OWF3, OWF5, OWF8, OWF11, Figure 4) and in the Northern Aegean (OWF4, OWF14, OWF15). The total investment cost of these eleven OWFs is equal to 55.207 × 10⁹ €. On the other hand, in the case of the second scenario, the following twelve OWFs with a 76.92% strategic value and a total investment cost of 66.181 × 10⁹ € are implemented (Figure 4): OWF3, OWF1, OWF16, OWF8, OWF7, OWF6, OWF13, OWF11, OWF10, OWF15, OWF12, and OWF14 (in descending order). Finally, the third scenario leads to the implementation of the following fourteen OWFs with 87.79% strategic value: OWF3, OWF5, OWF16, OWF8, OWF7, OWF6, OWF13, OWF11, OWF4, OWF10, OWF2, OWF15, OWF12, and OWF14 (in descending order). The total investment cost of these projects amounts to 82.160 × 10⁹ €, while most of these OWFs are located Southeast of Euboea (OWF3, OWF5, OWF8, OWF11, Figure 4) and in the Northern Aegean (OWF2, OWF4, OWF14, OWF15).
It is worth noting that any of the three scenarios selected for implementation will be particularly beneficial for the country, since the strategic value of all scenarios is over 70%, and national energy independence is ensured. The optimum choice naturally is the implementation of the whole portfolio, since this entails a strategic value of 100% and all strategic goals of this plan are reached. However, such an investment would be particularly costly. Therefore, the second scenario is recommended for implementation, since it requires a little less than 60% of the total investment capital, while, at the same time, it fully satisfies the vision and mission of the present strategic plan (i.e., national energy independence).
Through the strategic planning performed, it has been proven that the combination of GIS with Microsoft Project Server software can, therefore, be seen as a powerful tool for solving complex siting and decision-making issues of OWFs. Moreover, the GIS-Microsoft Project Server integration could be used as an excellent tool for displaying the results in useful maps and, also, in practical portfolio selection scenarios. The proposed methodological approach is essential, as it could be utilized efficiently and easily from academics, scientific researchers, renewable energy planners, developers, government agencies, consultants, and potential investors for the efficient and sustainable exploitation of the offshore wind potential and the relevant deployment of OWFs at different spatial planning scales. The need and the importance of such a strategic planning increase significantly over time, as the increasing population and improving living standards produce an increment on the energy demand. The present study could be further extended with a field investigation analysis of the proposed OWF sites, in order to verify their overall appropriateness. Thus, future work could include a thorough individual assessment of the proposed sites in conjunction with field investigation, in order to make the final selection/prioritization of sites for OWFs installation. Finally, it would be interesting to consider the utilization of energy storage systems in the proposed strategic plan for improving the penetration of RES into the electricity supply mix and maximizing the reliability of the OWF projects regardless weather conditions.

8. Conclusions

The present paper aims at the development of an integrated strategic planning methodology for OWFs in Greece, where portfolio analysis is used for the first time in relation to the siting of RES. More specifically, it focuses on a strategic plan that will ensure national energy independence for 25 years following its partial implementation, with significant economic, socio-political and environmental benefits for Greece.
A total of twenty criteria (exclusion and assessment) are employed for the siting of OWFs, which almost fully cover the economic, socio-political, technical and environmental issues that are related to such installations and applications. The majority of the criteria are in line with the international literature; however, there are also criteria proposed and applied for the first time in relation to siting issues, such as “seismic hazard zones” (exclusion criterion—on RES issues) and “electrical energy demand” (assessment criterion—on RES issues). In addition, “landscape protection/visual and acoustic disturbance” criterion is introduced, facilitating the combined use of two, relevant, previously suggested siting criteria (“distance from shore” and “visual and acoustic impacts”).
Wind turbines of 5 MW capacity are taken into account, while the types of support structures selected are the TLB for depths of 50–200 m and the Hywind for depths of 200–500 m. For each OWF the precise mapping of the wind turbines is carried out by setting specific in-between distances in directions parallel and perpendicular to the prevailing wind direction. Then, the total investment cost for each project is calculated by estimating CAPEX, OPEX and DECEX.
In order to perform the portfolio analysis, the seven selected AC are evaluated by an EG. The highest weight is assigned to the “wind velocity” and “distance from high voltage electricity grid” criteria. Therefore, according to different expert participants the strategic policy orientation of the current plan focuses on the technical and economic dimension of the planning issue, based on the own high-experience. Next, the strategic impact of each OWF is evaluated on each AC and three different management scenarios are realized involving economic restrictions (investing 50%, 60%, and 75% of the total portfolio). After the application of the economic restrictions on the three scenarios, 11, 12 and 14 OWF projects are respectively selected for implementation. In all three scenarios, OWF3 presents the highest strategic value out of the selected projects and OWF14 the lowest, while the commonly selected projects in all 3 portfolios are OWF7, OWF8, OWF11, OWF12, OWF13, OWF14, OWF15, and OWF16. It is worth noting that, in all three cases, the energy independence of the country is achieved. The second scenario is recommended for implementation, since it requires less than 60% of the total investment capital and fully satisfies the vision and mission of the present strategic plan, which ensures national energy independence.
The proposed strategic planning for OWFs in Greece serves as a guide for the development of OWFs in Greece, according to criteria that are based on: (i) the special characteristics of the study area and the individual characteristics of each suitable site, (ii) the relevant provisions of the SFSPSD-RES, (iii) indisputable global experience, (iv) experts’ opinion and (v) on extensive international literature review, which specializes on such topics. For this reason, the present paper does not simply recommend certain sites for the installation of OWFs, but areas that have been examined according to several parameters within a broader field of study, which is based on a guideline with clear strategic goals. Consequently, the current strategic planning framework can bridge important gaps between research, development and implementation on the complex RES siting and development issues. The relevant methodology includes distinct stages and can be applied in relation to various study areas and diverse spatial planning scales.

Author Contributions

Conceptualization, S.S. and D.G.V.; methodology, S.S., D.G.V. and E.L.; formal analysis, S.S. and E.L.; investigation, S.S.; data curation, S.S.; writing—original draft preparation, S.S., D.G.V.; writing—review and editing, S.S., D.G.V. and E.L.; visualization, S.S.; supervision, D.G.V. and E.L. All authors have read and agreed to the published version of the manuscript.

Funding

This research received no external funding.

Acknowledgments

The authors would like to thank Paraskevi Drakopoulou, GIS Specialist of the Lab of Geographical Information Systems at the Institute of Oceanography of the Hellenic Centre for Marine Research (HCMR) for providing wind velocity data, as well as all professors, researchers and spatial analysts who participated in the questionnaire survey.

Conflicts of Interest

The authors declare no conflict of interest.

References

  1. Ng, C.; Ran, L. Offshore Wind Farms: Technologies, Design and Operation; Woodhead Publishing: Duxford, UK, 2016. [Google Scholar]
  2. Wind Europe Business Intelligence; Remy, T.; Mbistrova, A. Offshore Wind in Europe: Key Trends and Statistics 2017; Wind Europe: Brussels, Belgium, 2018. [Google Scholar]
  3. Wind Europe Business Intelligence; Selot, F.; Fraile, D.; Brindley, G. Offshore Wind in Europe: Key Trends and Statistics 2018; Wind Europe: Brussels, Belgium, 2019. [Google Scholar]
  4. Ruccell, T. Floating Wind: Changing Gear. 2019. Available online: https://www.4coffshore.com/news/floating-wind--changing-gear-nid13899.html (accessed on 17 January 2020).
  5. Castro-Santos, L.; Martins, E.; Soares, C.G. Economic comparison of technological alternatives to harness offshore wind and wave energies. Energy 2017, 140, 1121–1130. [Google Scholar] [CrossRef]
  6. Castro-Santos, L. Decision variables for floating offshore wind farms based on life-cycle cost: The case study of Galicia (North-West of Spain). Ocean Eng. 2016, 127, 114–123. [Google Scholar] [CrossRef]
  7. Costoya, X.; deCastro, M.; Santos, F.; Sousa, M.C.; Gomez-Gesteira, M. Projections of wind energy resources in the Caribbean for the 21st century. Energy 2019, 178, 356–367. [Google Scholar] [CrossRef]
  8. Mahdy, M.; Bahaj, A.S. Multi criteria decision analysis for offshore wind energy potential in Egypt. Renew. Energy 2018, 118, 278–289. [Google Scholar] [CrossRef]
  9. Mekonnen, A.D.; Gorsevski, P.V. A web-based participatory GIS (PGIS) for offshore wind farm suitability within Lake Erie, Ohio. Renew. Sustain. Energy Rev. 2015, 41, 162–177. [Google Scholar] [CrossRef] [Green Version]
  10. Hong, L.; Möller, B. Offshore wind energy potential in China: Under technical, spatial and economic constraints. Energy 2011, 36, 4482–4491. [Google Scholar] [CrossRef] [Green Version]
  11. Christoforaki, M.; Tsoutsos, T. Sustainable siting of an offshore wind park a case in Chania, Crete. Renew. Energy 2017, 109, 624–633. [Google Scholar] [CrossRef]
  12. Stefanakou, A.-A.; Nikitakos, N. A decision support model for site selection of offshore wind farms. In Proceedings of the 9th International Scientific Conference on Energy and Climate Change, Athens, Greece, 12–14 October 2016. [Google Scholar]
  13. Vagiona, D.G.; Kamilakis, M. Sustainable site selection for offshore wind farms in the South Aegean-Greece. Sustainability 2018, 10, 749. [Google Scholar] [CrossRef] [Green Version]
  14. Vagiona, D.G.; Karanikolas, N.M. A multicriteria approach to evaluate offshore wind farms siting in Greece. Glob. NEST J. 2012, 14, 235–243. [Google Scholar]
  15. Kim, C.-K.; Jang, S.; Kim, T.Y. Site selection for offshore wind farms in the southwest coast of South Korea. Renew. Energy 2018, 120, 151–162. [Google Scholar] [CrossRef]
  16. Schallenberg-Rodríguez, J.; Montesdeoca, N.G. Spatial planning to estimate the offshore wind energy potential in coastal regions and islands. Practical case: The Canary Islands. Energy 2018, 143, 91–103. [Google Scholar] [CrossRef]
  17. Möller, B. Continuous spatial modelling to analyse planning and economic consequences of offshore wind energy. Energy Policy 2011, 39, 511–517. [Google Scholar] [CrossRef]
  18. Beacham, J.L.; Jensen, J.R.; Wang, Z. A Feasibility Analysis of South Carolina Wind Resources for Electric Power Generation; Institute for Public Service and Policy Research, University of South Carolina: Columbia, SC, USA, 2009. [Google Scholar]
  19. Argin, M.; Yerci, V.; Erdogan, N.; Kucuksari, S.; Cali, U. Exploring the offshore wind energy potential of Turkey based on multicriteria site selection. Energy Strateg. Rev. 2019, 23, 33–46. [Google Scholar] [CrossRef]
  20. Chaouachi, A.; Covrig, C.F.; Ardelean, M. Multi-criteria selection of offshore wind farms: Case study for the Baltic States. Energy Policy 2017, 103, 179–192. [Google Scholar] [CrossRef]
  21. Kim, T.; Park, J.-I.; Maeng, J. Offshore wind farm site selection study around Jeju Island, South Korea. Renew. Energy 2016, 94, 619–628. [Google Scholar] [CrossRef]
  22. Lee, K.-H.; Jun, S.-O.; Pak, K.-H.; Lee, D.-H.; Lee, K.-W.; Park, J.-P. Numerical optimization of site selection for offshore wind turbine installation using genetic algorithm. Curr. Appl. Phys. 2010, 10, S302–S306. [Google Scholar] [CrossRef]
  23. Fetanat, A.; Khorasaninejad, E. A novel hybrid MCDM approach for offshore wind farm site selection: A case study of Iran. Ocean Coast. Manage. 2015, 109, 17–28. [Google Scholar] [CrossRef]
  24. Wu, B.; Yip, T.L.; Xie, L.; Wang, Y. A fuzzy-MADM based approach for site selection of offshore wind farm in busy waterways in China. Ocean Eng. 2018, 168, 121–132. [Google Scholar] [CrossRef]
  25. Christidis, T.; Law, J. Review: The use of Geographic Information Systems in wind turbine and wind energy research. J. Renew. Sustain. Energy 2012, 4, 012701. [Google Scholar] [CrossRef]
  26. Waewsak, J.; Landry, M.; Gagnon, Y. Offshore wind power potential of the Gulf of Thailand. Renew. Energy 2015, 81, 609–626. [Google Scholar] [CrossRef]
  27. Fred, D.; Forest, D. Strategic Management: A Competitive Advantage Approach, Concepts and Cases, 16th ed.; Pearson Education: Edinburgh, UK, 2017. [Google Scholar]
  28. Hellenic Wind Energy Association Wind energy statistics—First semester of 2018; Hellenic Wind Energy Association (HWEA): Athens, Greece, 2018.
  29. Georgopoulou, E.; Mirasgedis, S.; Sarafidis, Y.; Koutentaki, D.; Lalas, D.; Gakis, N. National Energy Plan: Roadmap to 2050; Institute for Environmental Research and Sustainable Development, National Observatory of Athens: Athens, Greece, 2014. [Google Scholar]
  30. Ministry of Environment, Energy and Climate Change (MEECC). Specific Framework for Spatial Planning and Sustainable Development for Renewable Energy Sources; JMD 49828/2008, OGHE B’ 2464/3-12-08; MEECC: Athens, Greece, 2008.
  31. 4C Offshore. Global offshore wind farms database. Available online: https://www.4coffshore.com/windfarms/ (accessed on 12 October 2019).
  32. Lahtinen, T.; Hämäläinen, R.; Liesiö, J. Portfolio decision analysis methods in environmental decision making. Environ. Modell. Softw. 2017, 94, 73–86. [Google Scholar] [CrossRef]
  33. Argin, M.; Yerci, V. The assessment of offshore wind power potential of Turkey. In Proceedings of the 9th International Conference on Electrical and Electronics Engineering (ELECO), Bursa, Turkey, 26–28 November 2015. [Google Scholar]
  34. Ou, L.; Xu, W.; Yue, Q.; Ma, C.L.; Teng, X.; Dong, Y.E. Offshore wind zoning in China: Method and experience. Ocean Coast. Manage. 2018, 151, 99–108. [Google Scholar] [CrossRef]
  35. Yue, C.-D.; Yang, M.-H. Exploring the potential of wind energy for a coastal state. Energy Policy 2009, 37, 3925–3940. [Google Scholar] [CrossRef]
  36. Lynch, K.; Murphy, J.; Serri, L.; Airoldi, D. Site selection methodology for combined wind and ocean energy technologies in Europe. In Proceedings of the 4th International Conference on Ocean Energy, Dublin, Ireland, 17–19 October 2012. [Google Scholar]
  37. Vasileiou, M.; Loukogeorgaki, E.; Vagiona, D.G. GIS-based multi-criteria decision analysis for site selection of hybrid offshore wind and wave energy systems in Greece. Renew. Sustain. Energy Rev. 2017, 73, 745–757. [Google Scholar] [CrossRef]
  38. Kim, J.Y.; Kang, K.S.; Oh, K.Y.; Lee, J.S.; Ryu, M.S. A study on the site selection of offshore wind farm around Korean Peninsula. In Proceedings of the 3rd International Conference on Ocean Energy, Bilbao, Spain, 6–8 October 2010. [Google Scholar]
  39. Myhr, A.; Bjerkseter, C.; Ågotnes, A.; Nygaard, T.A. Levelised cost of energy for offshore floating wind turbines in a life cycle perspective. Renew. Energy 2014, 66, 714–728. [Google Scholar] [CrossRef] [Green Version]
  40. Independent Power Transmission Operator. Available online: http://www.admie.gr/ (accessed on 10 July 2018).
  41. Hellenic Navy Hydrographic Service. Available online: https://www.hnhs.gr/el/?option=com_opencart&Itemid=269&route=common/home/ (accessed on 12 July 2018).
  42. Hellenic Centre for Marine Research. Available online: http://www.hcmr.gr/el/ (accessed on 12 July 2018).
  43. European statistical service: Eurostat. Available online: https://ec.europa.eu/eurostat/ (accessed on 23 August 2018).
  44. GEODATA: Digital data. Available online: https://web.archive.org/web/20180315103323/http://geodata.gov.gr/ (accessed on 15 March 2018).
  45. EMODnet: Your gateway to marine data in Europe. Available online: http://www.emodnet-humanactivities.eu/view-data.php/ (accessed on 15 July 2018).
  46. Hellenic Ornithological Society. Available online: http://www.ornithologiki.gr/ (accessed on 10 July 2018).
  47. MarineTraffic: Global Ship Tracking Intelligence | AIS Marine Traffic. Available online: https://www.marinetraffic.com/en/ais/home/centerx:25.7/centery:36.3/zoom:11 (accessed on 6 July 2018).
  48. Technical Chamber of Greece: Official seismic hazard map. Available online: http://portal.tee.gr/portal/page/portal/SCIENTIFIC_WORK/ARTICLES/033/%D7%C1%D1%D4%C7%D3%20%D3%C5%C9%D3%CC%C9%CA%C7%D3%20%C5%D0%C9%CA%C9%CD%C4%D5%CD%CF%D4%C7%D4%C1%D3.htm/ (accessed on 18 July 2018).
  49. Jonkman, J.; Butterfield, S.; Musial, W.; Scott, G. Definition of a 5-MW Reference Wind Turbine for Offshore System Development; National Renewable Energy Laboratory: Golden, CO, USA, 2009. [Google Scholar]
  50. Fischer, T.; de Vries, W.; Schmidt, B. Upwind WP4 Design Basis; Institure of Aircraft Design Universität Stuttgart: Stuttgart, Germany, 2010. [Google Scholar]
  51. Bjerkseter, C.; Agotnes, A. Levelised costs of energy for offshore floating wind turbine concepts. Master Thesis, Norwegian University of Life Sciences (NMBU), Oslo, Norway, 2013. [Google Scholar]
  52. Myhr, A. Developing offshore floating wind turbines: The Tension-Leg-Buoy design. Philosophiae Doctor (PhD) Thesis, Norwegian University of Life Sciences (NMBU), Oslo, Norway, 2016. Ph.D. Thesis, Norwegian University of Life Sciences (NMBU), Oslo, Norway, 2016. [Google Scholar]
  53. Nygaard, T.A.; Myhr, A.; Karl, J.M. A comparison of two conceptual designs for floating wind turbines. In Proceedings of the 3rd European Offshore Wind Conference & Exhibition, Stockholm, Sweden, 14–16 September 2009. [Google Scholar]
  54. Hywind: The world’s leading floating offshore wind solution. Available online: https://www.equinor.com/en/what-we-do/hywind-where-the-wind-takes-us.html/ (accessed on 28 August 2018).
  55. Hywind Scotland Pilot Park—4C Offshore. Available online: https://www.4coffshore.com/windfarms/hywind-scotland-pilot-park-united-kingdom-uk76.html/ (accessed on 28 August 2018).
  56. Pillai, A.C.; Chick, J.; Khorasanchi, M.; Barbouchi, S.; Johanning, L. Application of an offshore wind farm layout optimization methodology at Middelgrunden wind farm. Ocean Eng. 2017, 139, 287–297. [Google Scholar] [CrossRef] [Green Version]
  57. Sun, H.; Yang, H.; Gao, X. Study on offshore wind farm layout optimization based on decommissioning strategy. Energy Procedia 2017, 143, 566–571. [Google Scholar] [CrossRef]
  58. Deutsche WindGuard GmbH Capacity Densities of European Offshore Wind Farms; Federal Maritime and Hydrographic Agency: Hamburg, Germany, 2018.
  59. Lynch, K.; Murphy, J. Overview of Offshore Wind and Ocean Energy Technologies; Hydraulics and Maritime Research Centre: Ireland, UK, 2012. [Google Scholar]
  60. Stehly, T.; Heimiller, D.; Scott, G. 2016 Cost of Wind Energy Review; National Renewable Energy Laboratory: Denver, CO, USA, 2017. [Google Scholar]
  61. Gonzalez-Rodriquez, A.G. Review of offshore wind farm cost components. Energy Sustain. Dev. 2017, 37, 10–19. [Google Scholar] [CrossRef]
  62. Ioannou, A.; Angus, A.; Brennan, F. A lifecycle techno-economic model of offshore wind energy for different entry and exit instances. Appl. Energy 2018, 221, 406–424. [Google Scholar] [CrossRef]
  63. Brigham, E.F.; Houston, J.F. Fundamentals of Financial Management, Concise 8th ed.; Cengage Learning: Mason, OH, USA, 2015. [Google Scholar]
  64. BVG Associates Oil and Gas “Seize the Opportunity” Guides: Offshore Wind; Scottish Enterprise: Glasgow, UK, 2016.
  65. European Network of Transmission System Operators for Electricity: Net Electricity Generating Capacity. Available online: https://www.entsoe.eu/data/power-stats/net-gen-capacity/ (accessed on 29 October 2019).
  66. Weston, D. Gode Wind construction starts. 2015. Available online: https://www.windpoweroffshore.com/article/1342947?utm_source=website&utm_medium=social (accessed on 22 June 2019).
  67. Gode Wind 1 and 2—4C Offshore. Available online: https://www.4coffshore.com/windfarms/gode-wind-1-and-2-germany-de13.html (accessed on 22 June 2019).
  68. Russell, T. OWFs supported by EIB’s €17 billion; 2015. Available online: https://www.4coffshore.com/news/owfs-supported-by-eib27s-8017-billion-nid2431.html (accessed on 15 May 2019).
Figure 1. Proposed strategic planning methodology for offshore wind farms (OWFs’) siting in Greece.
Sustainability 12 00905 g001
Figure 2. Relevant weights of assessment criteria (AC).
Sustainability 12 00905 g002
Figure 3. Thematic maps of: (a) wind velocity (EC.2), (b) marine protected areas (EC.11), wildlife refuges and migration corridors (EC.12), (c) water depth (EC.3) and (d) seismic hazard zones (EC.5).
Sustainability 12 00905 g003
Figure 4. Suitable areas for OWFs siting in Greece.
Sustainability 12 00905 g004
Figure 5. Micro-siting configuration of OWF15 and OWF4.
Sustainability 12 00905 g005
Table 1. Exclusion criteria and incompatibility zones.
No.Exclusion CriterionFactorUnsuitable Areas
EC.1Exclusive Economic ZoneLegalOutside the boundaries
EC.2Wind VelocityEconomic<6 m/s
EC.3Water DepthEconomic/Technical>500 m
EC.4Military ZonesPolitical/RestrictiveAll
EC.5Seismic Hazard ZonesProtective/RestrictiveΖone ΙΙΙ (0.36g)
EC.6Underwater CablesProtective/Technical/RestrictiveAll
EC.7Distance from PortsEconomic/Technical>100 km
EC.8Distance from High Voltage Electricity GridEconomic/Technical>100 km
EC.9Landscape Protection/Visual and Acoustic DisturbanceSocial/Political/Protective≤20 km
EC.10Distance from Shipping RoutesSocial/Political/Protective⪷5 km (≤3 miles)
EC.11Distance from Marine Protected AreasEnvironmental/Protective≤2 km
EC.12Distance from Wildlife Refugees and Migration CorridorsEnvironmental/Protective≤3 km
EC.13Distance from Residential NetworkLegal/Social/Protective≤1 km (non-traditional settlements)
≤1.5 km (traditional settlements)
Table 2. Scaling of AC.
ACScaling
None (0)Low (1)Moderate (3)Strong (6)Extreme (9)
AC.1<66–77–88–9>9
AC.2>100>6550–6535–5020–35
AC.300–55–1010–15>15
AC.4015–2525–3535–4545–55
AC.5>500Up to 500Up to 400Up to 300Up to 200
AC.6>100>7560–7545–6030–45
AC.700–2020–4040–6060–80
Table 3. Basic features of the 16 OWFs.
No.Name of OWFLocationArea (km2)Wind Turbine Support Structure 1Project Capacity (MW)
1“Eolos”Southeast of Euboea677.43TLB and Hywind4310
2“Aphrodite”Southwest of Thasos552.07TLB and Hywind3500
3“Poseidon”Southeast of Euboea/North of Andros542.6TLB and Hywind3430
4“Apollo”Southeast of Thasos/Northwest of Samothrace477.46TLB3095
5“Zeus”Southeast of Euboea125.63TLB and Hywind785
6“Hera”South of Hydra110.29TLB and Hywind680
7“Ares”East of Hydra104.46TLB and Hywind600
8“Athena”Southeast of Euboea82.03Hywind485
9“Hephaestus”Northeast of Volos46.79Hywind280
10“Demeter”Northwest of Lefkada/West of Preveza42.7Hywind270
11“Dionysus”Southeast of Euboea/North of Andros30.94Hywind205
12“Hestia”Northwest of Skyros22.71Hywind150
13“Hermes”Northeast of Euboea/South of Skopelos15.6Hywind100
14“Νemesis”North of Volos6.9TLB50
15“Artemis”East of Thasos4.81TLB45
16“Persephone”East of Poros4.45TLB40
TotalPortfolio OWFsEEZ of Greece2846.87TLB and Hywind18,025
1 TLB is considered for water depths 50–200 m, while Hywind for water depths 200–500 m (see Section 4.2).
Table 4. Investment cost and OWFs’ characteristics in relation to the AC.
A/AInvestment Cost
(€)
AC.1
(m/s)
AC.2
(m)
AC.3
(%)
AC.4
(km)
AC.5
(km)
AC.6
(km)
AC.7
(km)
OWF127.255 × 1099–9.550–50073.7947.547.033.522.5
OWF220.858 × 1097–7.5100–50059.9251.562.030.046.5
OWF322.173 × 1099–9.5150–50058.7290.547.542.042.0
OWF417.283 × 1097–850–15052.9998.072.528.540.5
OWF55.092 × 1099–9.5150–50013.4473.029.524.542.0
OWF64.375 × 1098–8.5150–50011.6452.054.551.04.5
OWF73.573 × 1098–8.5100–50010.2745.025.034.54.0
OWF83.338 × 1099–9.5450–5008.3069.057.051.548.5
OWF91.799 × 1097–7.5200–4004.7985.047.031.032.5
OWF101.720 × 1097.5–8250–5004.6234.031.029.069.5
OWF111.382 × 1099–9.5150–5003.5192.529.024.019.5
OWF12962.336 × 1068.5–9.5300–4002.5735.081.017.548.0
OWF13664.512 × 1068–8.5350–5001.7139.029.520.577.0
OWF14272.904 × 1066–6.550–1000.8698.540.519.547.5
OWF15246.342 × 1067–7.550–1500.7770.546.022.525.5
OWF16219.871 × 1068–8.5100–2000.6830.022.028.50.5
Table 5. Strategic value of portfolio projects.
RankingOWFStrategic Value (%)
1OWF38.46
2OWF18.17
3OWF57.75
4OWF167.44
5OWF87.27
6OWF77.2
7OWF66.69
8OWF136.35
9OWF116.13
10OWF45.84
11OWF105.58
12OWF25.45
13OWF154.84
14OWF124.69
15OWF144.11
16OWF94.03

