Article

Sustainable Intensification? Increased Production Diminishes Omega-3 Content of Sheep Milk

1
School of Natural and Environmental Science, Newcastle University, Newcastle upon Tyne NE3 2SF, UK
2
Laboratory of Parasitology, Veterinary Research Institute, Hellenic Agricultural Organisation Demeter, Thermi 57001, Thessaloniki
3
Clinic of Reproductive Medicine, Vetsuisse Faculty, University of Zurich, Winterthurerstrasse 260, 8057 Zurich, Switzerland
4
School of Agriculture, Policy and Development, University of Reading, Earley Gate, Reading RG6 6AR, UK
5
Independent Researcher, Kritsá, Lasithi, Greece
6
Mérieux NutriSciences, Via Fratta, 25, 31023 Resana, Italy
7
Centre for Organics Research, Southern Cross University, Lismore, NSW 2480, Australia
*
Authors to whom correspondence should be addressed.
Sustainability 2020, 12(3), 1228; https://doi.org/10.3390/su12031228
Submission received: 7 January 2020 / Revised: 30 January 2020 / Accepted: 3 February 2020 / Published: 8 February 2020

Abstract

:
Intensifying agricultural production alters food composition, but this is often ignored when assessing system sustainability. However, this could compromise consumer health and influence the concept of “sustainable diets”. Here, we consider the milk composition of Mediterranean dairy sheep, finding inferior fatty acid (FA) profiles with respect to consumer health as a result of a more intensive system of production. Semi-intensive management produced 57% more milk per ewe, with a 20% lower fat content (but inferior fat composition). The milk had a nutritionally poorer fatty acid (FA) profile, with an 18% lower omega-3 FA concentration (n-3) (19% fewer long-chain n-3s) and a 7% lower monounsaturated FA concentration but a 3% higher saturated FA (9% higher in C14:0) concentration compared to ewes under traditional, extensive management. A redundancy analysis identified close associations between fat composition and animal diets—particularly concentrate supplementation and cultivated pasture grazing—and n-3 was associated with grazing in diverse, native mountain pastures. This paper questions if identifying such key elements in traditional systems could be deployed for “sustainable intensification” to maintain food quality while increasing output.

1. Introduction

Many traditional farming systems are changing, generally becoming more intensive. The rationale is increasing yields and output to increase income for farmers, and at a global level, producing sufficient food for the world’s growing population [1]. Many studies have assessed the impact of these intensification processes on sustainability; however, while they have often compared economic, environmental, and social aspects [2,3], impacts on food composition and potential knock-on effects on public health have rarely been considered. Yet sustainable diets are defined by the FAO [4] as those diets that not only have a low environmental impact but also contribute to food and nutrition security for public health now as well as for future generations. Recent studies, including meta-analysis, have suggested that intensification in both crop and livestock production does change food composition, reducing valued nutrients such as antioxidants or omega-3 fatty acids and increasing a range of other components that we perhaps do not want in our diets [5,6]. In addition, the consumption of foods from low-input production systems (such as organic food) has been linked to health benefits, including a reduced incidence of being overweight/obesity, pre-eclampsia, hypospadias, and eczema (in human cohort studies) [7], as well as type 2 diabetes [8] and metabolic syndromes [9]. It is therefore feasible that the sustainability of our food production could be compromised if food composition is negatively affected by intensification, which possibly poses a challenge to consumer health rather than supplying vital nutrients. However, this is often overlooked.
The Mediterranean region accounts for approximately half of global sheep milk production and includes a range of breeds and production systems in different countries; further, in this region, sheep dairy products often contribute significantly to overall dietary intake [10]. Dairy products may be considered to be high in saturated fat, which has been linked to increased risks of certain chronic diseases in humans, including being overweight, hypertension, and cardiovascular disease (CVD) [11]. Specific saturated fatty acids (SFAs) including lauric (LU), myristic (MA), and palmitic (PA) acid have been linked to increases in total and low-density lipoprotein (LDL) cholesterol, as well as some hemostatic/thrombotic factors that promote thrombosis [12]. However, the view that dairy consumption, especially milk fat, has a negative impact on health has been challenged, and recent evidence has suggested that dairy consumption has a protective effect against certain chronic diseases [13,14]. These beneficial health influences have been attributed to a range of monounsaturated (MUFAs) and polyunsaturated fatty acids (PUFAs) in milk, including several with a protective effect against CVD. Most importantly, milk contains omega-3 PUFAs (n-3), including eicosapentaenoic acid (EPA), docosapentaenoic acid (DPA), and docosahexaenoic acid (DHA), and levels of these very-long-chain omega-3 PUFAs (VLC n-3s) are substantially higher in ovine milk than in bovine milk [15,16]. These VLC n-3s are essential to the healthy development of the brain and eyes during childhood, reduce childhood obesity [17], improve neurological and immune functions [18], protect against CVD, and improve insulin sensitivity.
Moreover, milk from ruminant animals contains conjugated linoleic acid (CLA), which is linked to positive health impacts, including anticarcinogenic, antiatherogenic, and antiobesity effects and the modulation of the immune system, although most evidence has been from animal studies [19]. There is growing interest in odd-chain fatty acids (OCFAs) such as C15 and C17, since the intake of OCFAs has been linked to a reduced risk of CVD and type 2 diabetes [20]. Although they are present in relatively low concentrations of dairy products, dietary intake in humans is mainly linked to dairy products, since their synthesis is thought to be unique to microbial fermentation, as plasma concentrations in OCFAs have been suggested to be suitable markers for dairy consumption [21].
The balance of fatty acids in milk and associated products is highly dependent on what we feed animals: we know a high proportion of grazing or fresh foraging tends to increase beneficial fatty acids, including n-3, compared to animal diets based on silage and/or high concentrated feed intake, although most published evidence has come from dairy cows [22,23,24]. Recent reviews comparing milk fat from different species have indicated that sheep milk has less SFAs and more MUFAs and PUFAs, including n-3, than does cow milk. Specifically, the concentrations reported for cows and sheep milk were (a) 69–70% vs. 61–64% for SFAs, (b) 25–27% vs. 30–32% for MUFAs, and (c) 4–5% vs. 5–7% for PUFAs (0.6% vs. 1.31% for n-3) [15,16]. Although the principle drivers of milk fat composition are likely similar for cows, goats, and ewes [25], there is limited information on the relative influence of feeding regimes, breed choice, production intensity, milking frequency, or the stage of lactation on the nutritional quality of milk from sheep.
Some studies have reported on the impact on milk quality of specific feeds, including grasses, preserved forages, concentrates such as maize, other cereals or grain legumes, [26,27,28], and/or diets supplemented with vegetable oils or algae [29,30]. On the other hand, there is, to our knowledge, no published information on changes in the nutritional quality of milk that are triggered by the intensification of traditional Mediterranean, grazing-based dairy sheep systems or the potential impacts of climate change (and resulting changes in grazing and dietary regimes) on ovine milk quality. A shift in milk composition driven by altered management or changes in the weather could impact the sustainability of dairy production as well as the nutritional composition of traditional dairy products.
This study on traditional sheep on the island of Crete aimed to identify the factors driving differences in milk quality (including FA profiles), quantifying their impact. Milk composition was assessed at a flock level throughout six months of lactation over two consecutive years under two contrasting management systems (extensive and semi-intensive). We also identified the associations between animal nutrition (the amount and type of concentrate and forage feeds or grazing time) and environmental drivers (temperature, humidity, and rainfall).

2. Materials and Methods

2.1. Animals and Systems

To focus on the impact on milk quality of changes in animal nutrition and to avoid potential complications due to genetic influences, this study was conducted on the island of Crete, in Greece, with traditional “Sfakiano” sheep. This breed represents over 80% of the island’s one million ewes (Stefanakis, Heraklion, Crete, personal communication), and it is well adapted to harsh, semiarid, mountainous conditions, although they are also used in more intensive production systems. Mature ewes are around 40 kg on average and produce 1.2–1.5 lambs per ewe per birth plus around 180 kg of milk per annum [31]. Most flocks lamb mature ewes in October/November, but 20–25% of ewes lamb later, in January/February. Suckling lasts for 30 to 60 days before male (and surplus female) lambs are slaughtered for meat. After weaning, ewes are milked twice per day until early- to mid-summer, either by hand (still widely practiced in extensively managed flocks) or with machines (typical for semi-intensive systems).
Of the 20 farms included in this survey, 10 were classified as “extensive” (EX), meaning that they has low stocking densities (>0.5 ha/ewe), spent at least 300 days each year grazing seminatural vegetation on marginal land, and fed ewes less than 200 kg of supplementary concentrates per ewe per year [32]. In contrast, the 10 semi-intensive (SI) farms had higher stocking densities (0.25 ha/ewe), grazed ewes on improved grassland for more than 200 days, and fed over 250 kg of supplementary concentrate per ewe per year [33].

2.2. Experimental Design and Sampling Procedure

Monitoring was carried out over 2 years, between December 2009 and December 2011. We visited all farms monthly during lactation to collect milk from the bulk tanks along with records on productivity (daily milk yield per ewe and flock output for the month prior to sampling), animal nutrition (grazing time on natural and cultivated pastures, the use of conserved forage and concentrate feed), flock health status (the prevalence of mastitis and other diseases), and other management practices (including vaccination and mating procedures) using a standard questionnaire. All grazing areas were classified on a floristic code between 2 and 4 (as a proxy for altitude, with plant communities at sites higher up in the hills having higher values). Temperature and relative humidity were monitored continuously on all farms with recorders placed outside housing facilities (T&D Recorders®, RTR-53). Rainfall data came from local National Observatory of Athens weather stations. Detailed information characterizing each farm (flock size, pedigree information, facilities, grazing area, vaccinations, treatments, feeding practices, and health issues) was collected at the beginning of each lactation/production year with a more detailed farm questionnaire. The work described in this study was carried out in accordance with EU Directive 2010/63/EU for animal experiments.

2.3. Measurements and Analytical Methods

Milk composition was assessed using a range of methods, including infrared spectroscopy to measure fat, protein, and lactose content (MilkoscanTMFT, FOSS®) and flow cell cytometry to determine the Somatic Cell Count (SCC) and Colony-Forming Units (CFU) of culturable bacteria (FossomaticTMFC and BactoScanTM, respectively, FC, FOSS®). The milk preparation, methylation, and gas chromatography analysis for FAs were as described by Butler et al. [23] using a Shimadzu GC-2014 gas chromatograph (Shimadzu, Kyoto, Japan). Individual FAs were identified by retention time using a standard mix of methyl ester expressed as a proportion of total peak areas for all quantified FAs. Unidentified peaks (not necessarily FA methyl esters) comprised <6.5% of the total area. Concentrations of FAs were used to calculate groups for each sample: SFAs, MUFAs, PUFAs, n-3s, long-chain n-3s, omega-6 PUFAs (n-6), OCFAs, and the ratio of C15:C17.

2.4. Statistical Analyses

An analysis of variance (ANOVA) was performed using linear mixed-effects models [34] in R (R Development core team), with “management system”, “sampling month”, and “year” as fixed factors and “flock” as a random factor. Variables calculated as proportions (individual FAs, SFAs, MUFAs, and PUFAs) were arcsine-transformed, whereas other measurements were not transformed. Tukey’s honest significant difference test was used for pairwise comparisons of the means (p < 0.05) where appropriate. Residual normality was assessed using a qqnorm function [35], with no data showing deviation. Multivariate redundancy analyses (RDAs) related to individual dietary components, environmental conditions, and milking systems were performed for a) milk yield, b) milk composition, c) SCC and CFUs, d) the content of major FAs, e) FA groups, f) odd-chain fatty acids, and g) the ratio of C15:C17. The RDAs were performed with a CANOCO package [36] using the automatic forward selection of variables, with significance calculated using the Monte Carlo permutation test.

3. Results

3.1. Environmental Conditions

The average monthly temperatures and rainfall of the study area in Crete over two years are shown in Supplementary Table S1. The first year was drier, with rain occurring mostly during December (4.1 mm) and February (5.7 mm) and relatively high spring temperatures (January, 15.7 °C; March, 14.7 °C). Weather conditions in the second year were more extreme: average winter temperatures (December to March) were lower (e.g., 12.9 °C in January and 12.2 °C in March), but summer temperatures were higher (18.6 °C and 22.0 °C in May and June in year 2 vs. 16.3 °C and 17.3 °C, respectively, in year 1). The spring was also wetter in year 2 (the average cumulative rainfall between January and May was 9.5 mm in year 1 and 16.5 mm in year 2), which was possibly conducive to greater herbage growth in both seminatural and cultivated pastures.

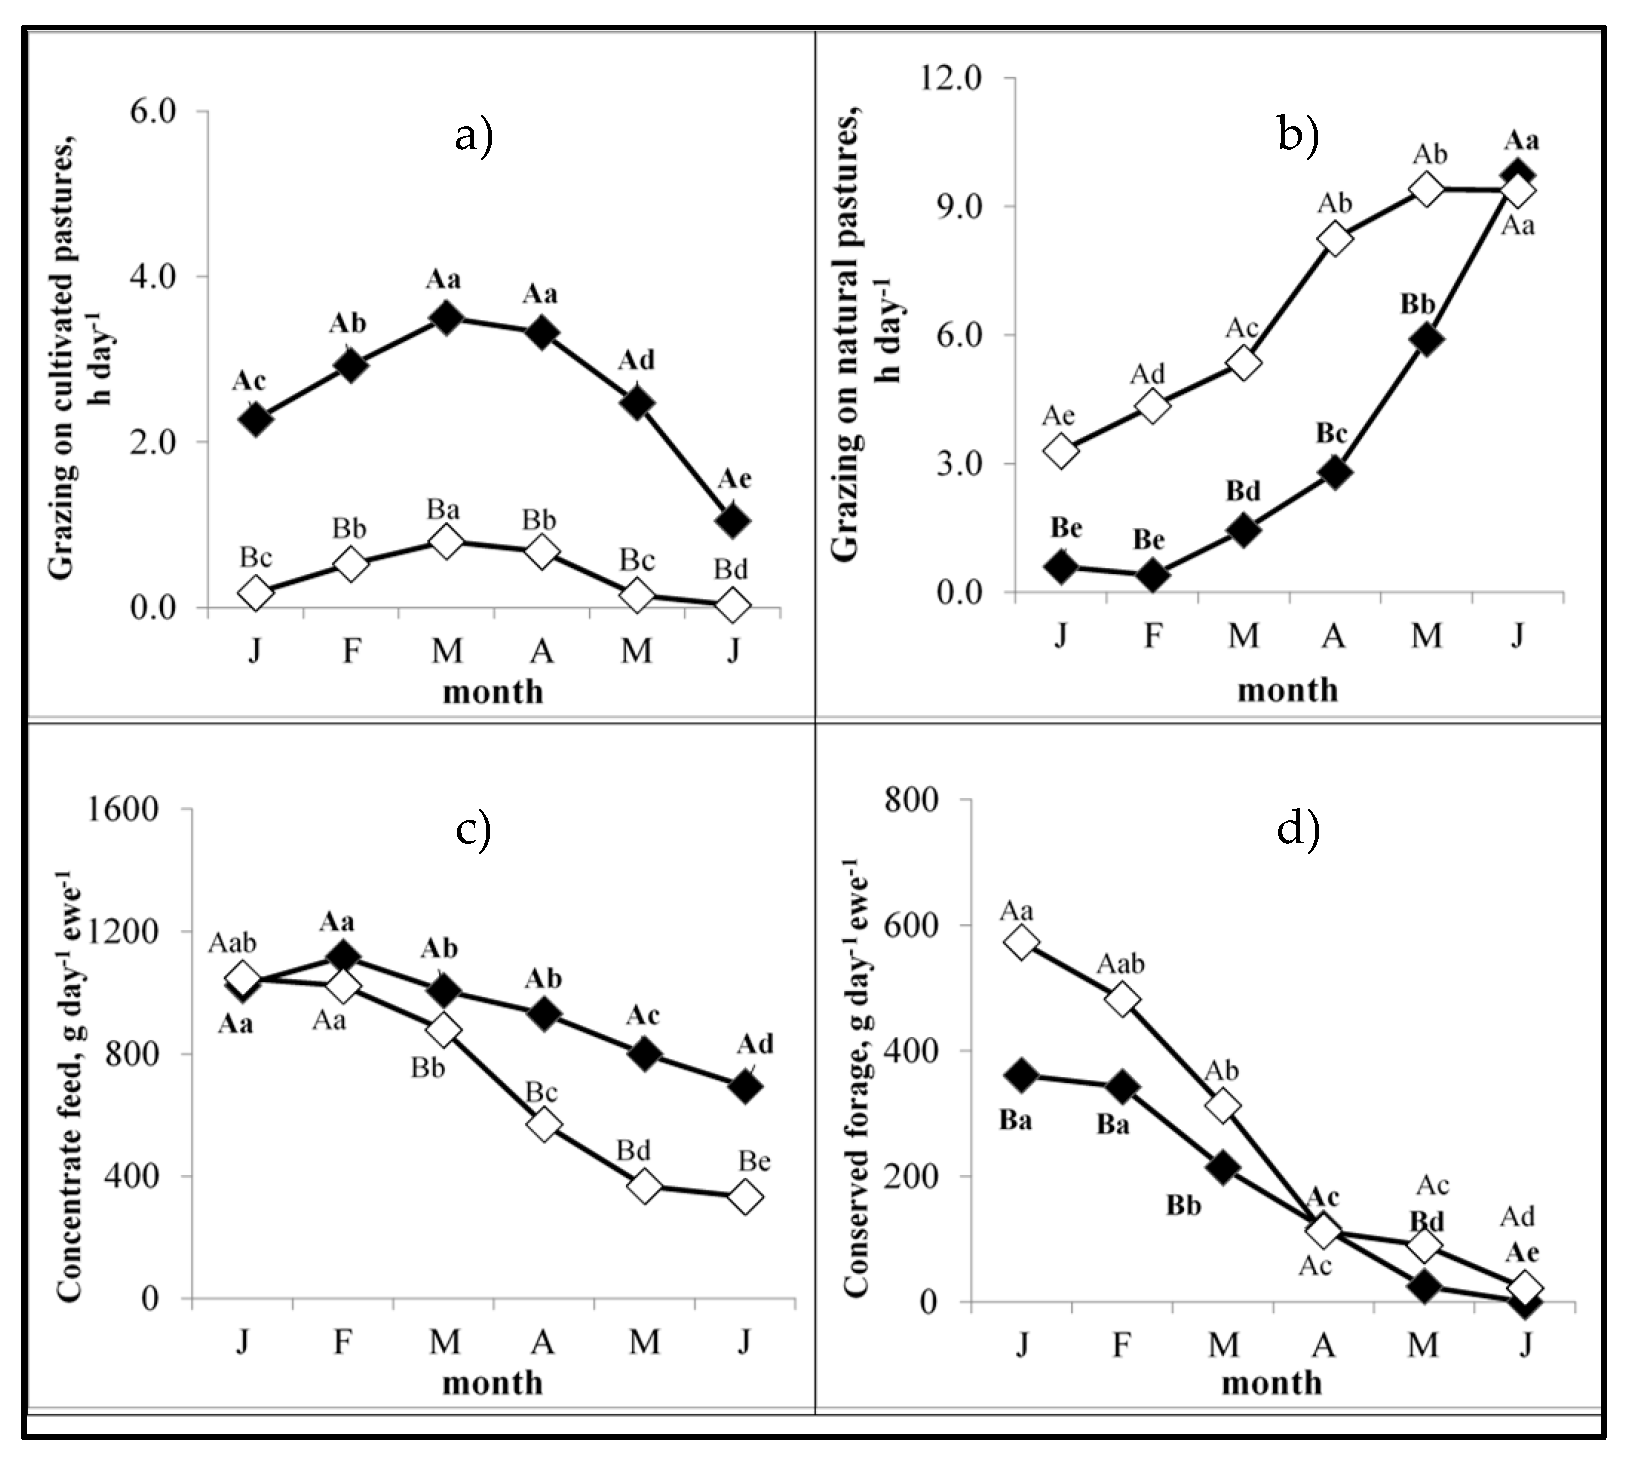
3.2. Feeding Regimes

Seasonal changes in diet composition for semi-intensive (SI) and extensive (EX) farming systems are presented in Figure 1. As expected, intensification led to substantial and significant (p < 0.001) differences in feeding management for flocks under the two production systems (see also Table S2, Supplementary Data). Over the two years, SI flocks used 24% more concentrates, but 46% less conserved forage than did EX flocks, who fed more than twice as much in total and in terms of alfalfa hay. However, SI sheep had more than twice as much whole-crop oat hay in their diet and spent six times longer on cultivated pastures—but half the time grazing natural pastures—compared to EX flocks.
Grazing strategies were similar over both years, although concentrate and conserved forage use did vary, with farms using 36% less concentrate and 82% less conserved forage in year 2 compared to year 1, possibly confirming a greater contribution from grazing in the second year of the study.

3.3. Milk Yield and Basic Composition

The results in this section are presented in Table 1. Milk yield and fat and lactose content differed between the production systems, although protein concentrations, the SCC, and the CFUs in milk did not. Extensive flocks produced 37% less milk but with 11.5% higher fat content compared to the SI flocks.
Milk yield and all parameters of basic composition, with the exception of protein content, fluctuated throughout the seasons. As expected, daily milk yield per ewe gradually fell as lactation progressed between January and June, while fat content dropped sharply (by around 17%) in March but then remained consistent. For lactose, SCC and CFUs significant changes were observed toward the end of lactation in May and June when lactose concentrations were lower and the CFUs were higher than in previous months. The SCC was lower in April and May compared to other months.
Milk yield, fat and lactose content, the SCC, and CFUs also all differed between the two years of the study. On average, the milk yield was 18% lower, while the SCC and CFUs were 48% and 60% higher, respectively, in year 2 compared to year 1.
A significant interaction was detected between management systems and the sampling month for milk lactose content: while this was similar for both systems between January and April, the extensive flocks produced milk with less lactose in May and June (Table S3, Supplementary Data).

3.4. Fatty Acid Profile

All three factors (management system, sampling month, and year) had significant impacts on the concentration of many individual FAs: a wide range of FA groups and calculated values are presented in Table 2, Table 3 and Table 4 and in the Supplementary Tables.

3.4.1. Major Saturated and Monounsaturated Fatty Acids.

All results mentioned here for major SFAs and MUFAs are shown in Table 2. Production system, sampling month, and production year all influenced the concentrations of major SFAs (lauric, myristic, palmitic, and stearic acids) and MUFAs (oleic and vaccenic acid) in milk. Milk from EX farms had 18%, 8%, and 12% less lauric, myristic, and vaccenic acids, respectively, but 2%, 10%, and 10% more palmitic, stearic, and oleic acids, respectively.
Concentrations of (a) lauric acid decreased over the lactation period, with the lowest being in June; (b) myristic acid was the highest in March and the lowest in June; (c) palmitic, stearic, and oleic acid were low between January and April compared to May and June; and (d) vaccenic acid was lower in May and June than between January and April.
Milk produced in year 1 was 26%, 16%, and 9% higher in lauric, myristic, and palmitic acids, while levels of stearic, oleic, and vaccenic acids were 18%, 13%, and 74% lower compared to milk in year 2.
Interactions between sampling months and management systems were significant for all major SFAs (lauric, myristic, palmitic, and stearic acid) and MUFAs (oleic and vaccenic acid), with differences between production systems detected in some but not all months (Figures S1 and S2, Supplementary Data). Milk from EX farms was higher in myristic acid in January but lower in May, and it had less oleic acid in January but more in May and June compared to milk from SI farms (as shown in Tables S4 and S5).
There were also significant interactions between (a) year and management systems for lauric, palmitic, and oleic acid and (b) sampling months and year for lauric and palmitic acid. For lauric acid, the relative difference between EX and SI farms was larger in the first than in the second year (Table S4). More palmitic and oleic acid was found in milk from EX farms in the first year compared to SI farms, while similar concentrations from the two systems were found in the second year (Table S4). Concentrations of lauric acid differed between years in some, but not all, sampling months (Table S5).

3.4.2. Major Polyunsaturated Fatty Acids

The type of farming system influenced the concentrations of most individual n-3 PUFAs: α-linoleic acid (ALA), EPA, and DPA were higher in milk from EX compared to SI farms, although there was no difference between farming systems for DHA, linoleic acid (LA) (values not shown), and CLA (the details of the PUFA concentrations are in Table 3).
The sampling month also influenced the concentrations of individual n-3s—ALA, EPA, and DPA—as well as CLA, but again, not LA or DHA. Concentrations of ALA and CLA increased between January and April and then decreased again, while concentrations of EPA and DPA were lower in the winter (January–March) compared to later in the year (April–June).
Concentrations of all individual n-3s (ALA, EPA, DPA, and DHA) and CLA also differed between years, in contrast to LA. Concentrations of these six PUFAs were higher in the second year, although the difference was not significant for LA.
There were also interactions between (a) management systems and sampling month for ALA, CLA, EPA, and DPA; and (b) management system and year for ALA and EPA. ALA and DPA concentrations in milk from EX farms were higher in February, April, and June, but not in January, March, and May (Figure 2). Except for January, EPA concentrations in milk from the EX systems were higher and increased between January and June, whereas milk from SI farms had similar EPA concentrations throughout the season (Figure 2).
ALA was higher in milk from EX farms in both years, although differences between the systems were smaller in the first compared to the second year (Table S4, Supplementary Data). Higher levels of EPA concentrations in milk from EX farms only reached significance in the first year (Table S4, Supplementary Data).

3.4.3. Fatty Acid Groups and the Omega-6/Omega-3 Ratio

Details on the concentration of the FA groups and ratios are presented in Table 4. The management system was found to influence total SFA, MUFA, and n-3 concentrations, but not total PUFA or n-6 concentrations or the ratio of n-6/n-3 in milk. Concentrations of SFAs were 3% lower, while MUFAs and n-3s were 7% and 21% higher, respectively, in milk from EX flocks.
The sampling month also influenced total SFAs, MUFAs, PUFAs, n-3 concentrations, and the n-6/n-3 ratio, but not n-6 levels in milk. SFAs were lower while MUFAs were higher in June compared to all other months. Concentrations of PUFAs and n-3s were lower and the n-6/n-3 ratio was higher in winter milk (January to March) compared to that collected in spring/early summer (April to June) (Table 4).
Differences were also detected between years for all FA groups and the n-6/n-3 ratio (Table 4). SFAs were 8% higher in the first year, while MUFAs, PUFAs, n-3s, and n-6s were 17%, 28%, 73%, and 8% higher (respectively) in the second year (Table 4). In addition, the ratio of n-6/n-3 was higher in the first year.
Interactions between sampling months and management systems were significant for SFAs, MUFAs, PUFAs, and n-3 concentrations and the n-6/n-3 ratio (Table 4). The magnitude of difference between management systems varied between sampling months. In addition, many parameters differed in some months, but not every month (Figures S1–S3, Supplementary Data). For the n-6/n-3 ratio, higher levels were recorded in milk from SI farms in most months except for May (Figure S3).
There were also significant interactions between management systems and the year for PUFAs and n-3s, but not SFAs, MUFAs, n-6s, or the n-6/n-3 ratio (Table 4). In the first year, total PUFAs and n-3s were similar for both production systems. In contrast, in year 2, total PUFAs and n-3s were higher in milk from EX flocks compared to SI flocks (Table S4, Supplementary Data).

3.4.4. Odd-Chain Fatty Acids

Management systems, sampling month, and year all influenced the concentration of total OCFAs, although C15:0 was only affected by management and sampling month, whereas C17:0 was sensitive to the management system and year, with the ratio of C15:C17 significantly altered between sampling month and year but not in terms of the management system (Table S6, Supplementary Data). Milk from the EX farms was lower in terms of C15 (8%), C17 (3%), and total OCFAs (11%) than was milk from the SI farms, although the relative concentrations of these two FA did not differ. Concentrations of C15 started the year low in January and February before increasing to a maximum in April and May, whereas total OCFAs was at its lowest in June and at its highest in March, with values for all other months not being statistically different. Milk from year 2 was 32% higher in C17 and 8% higher in total OCFAs than was milk from year 1.

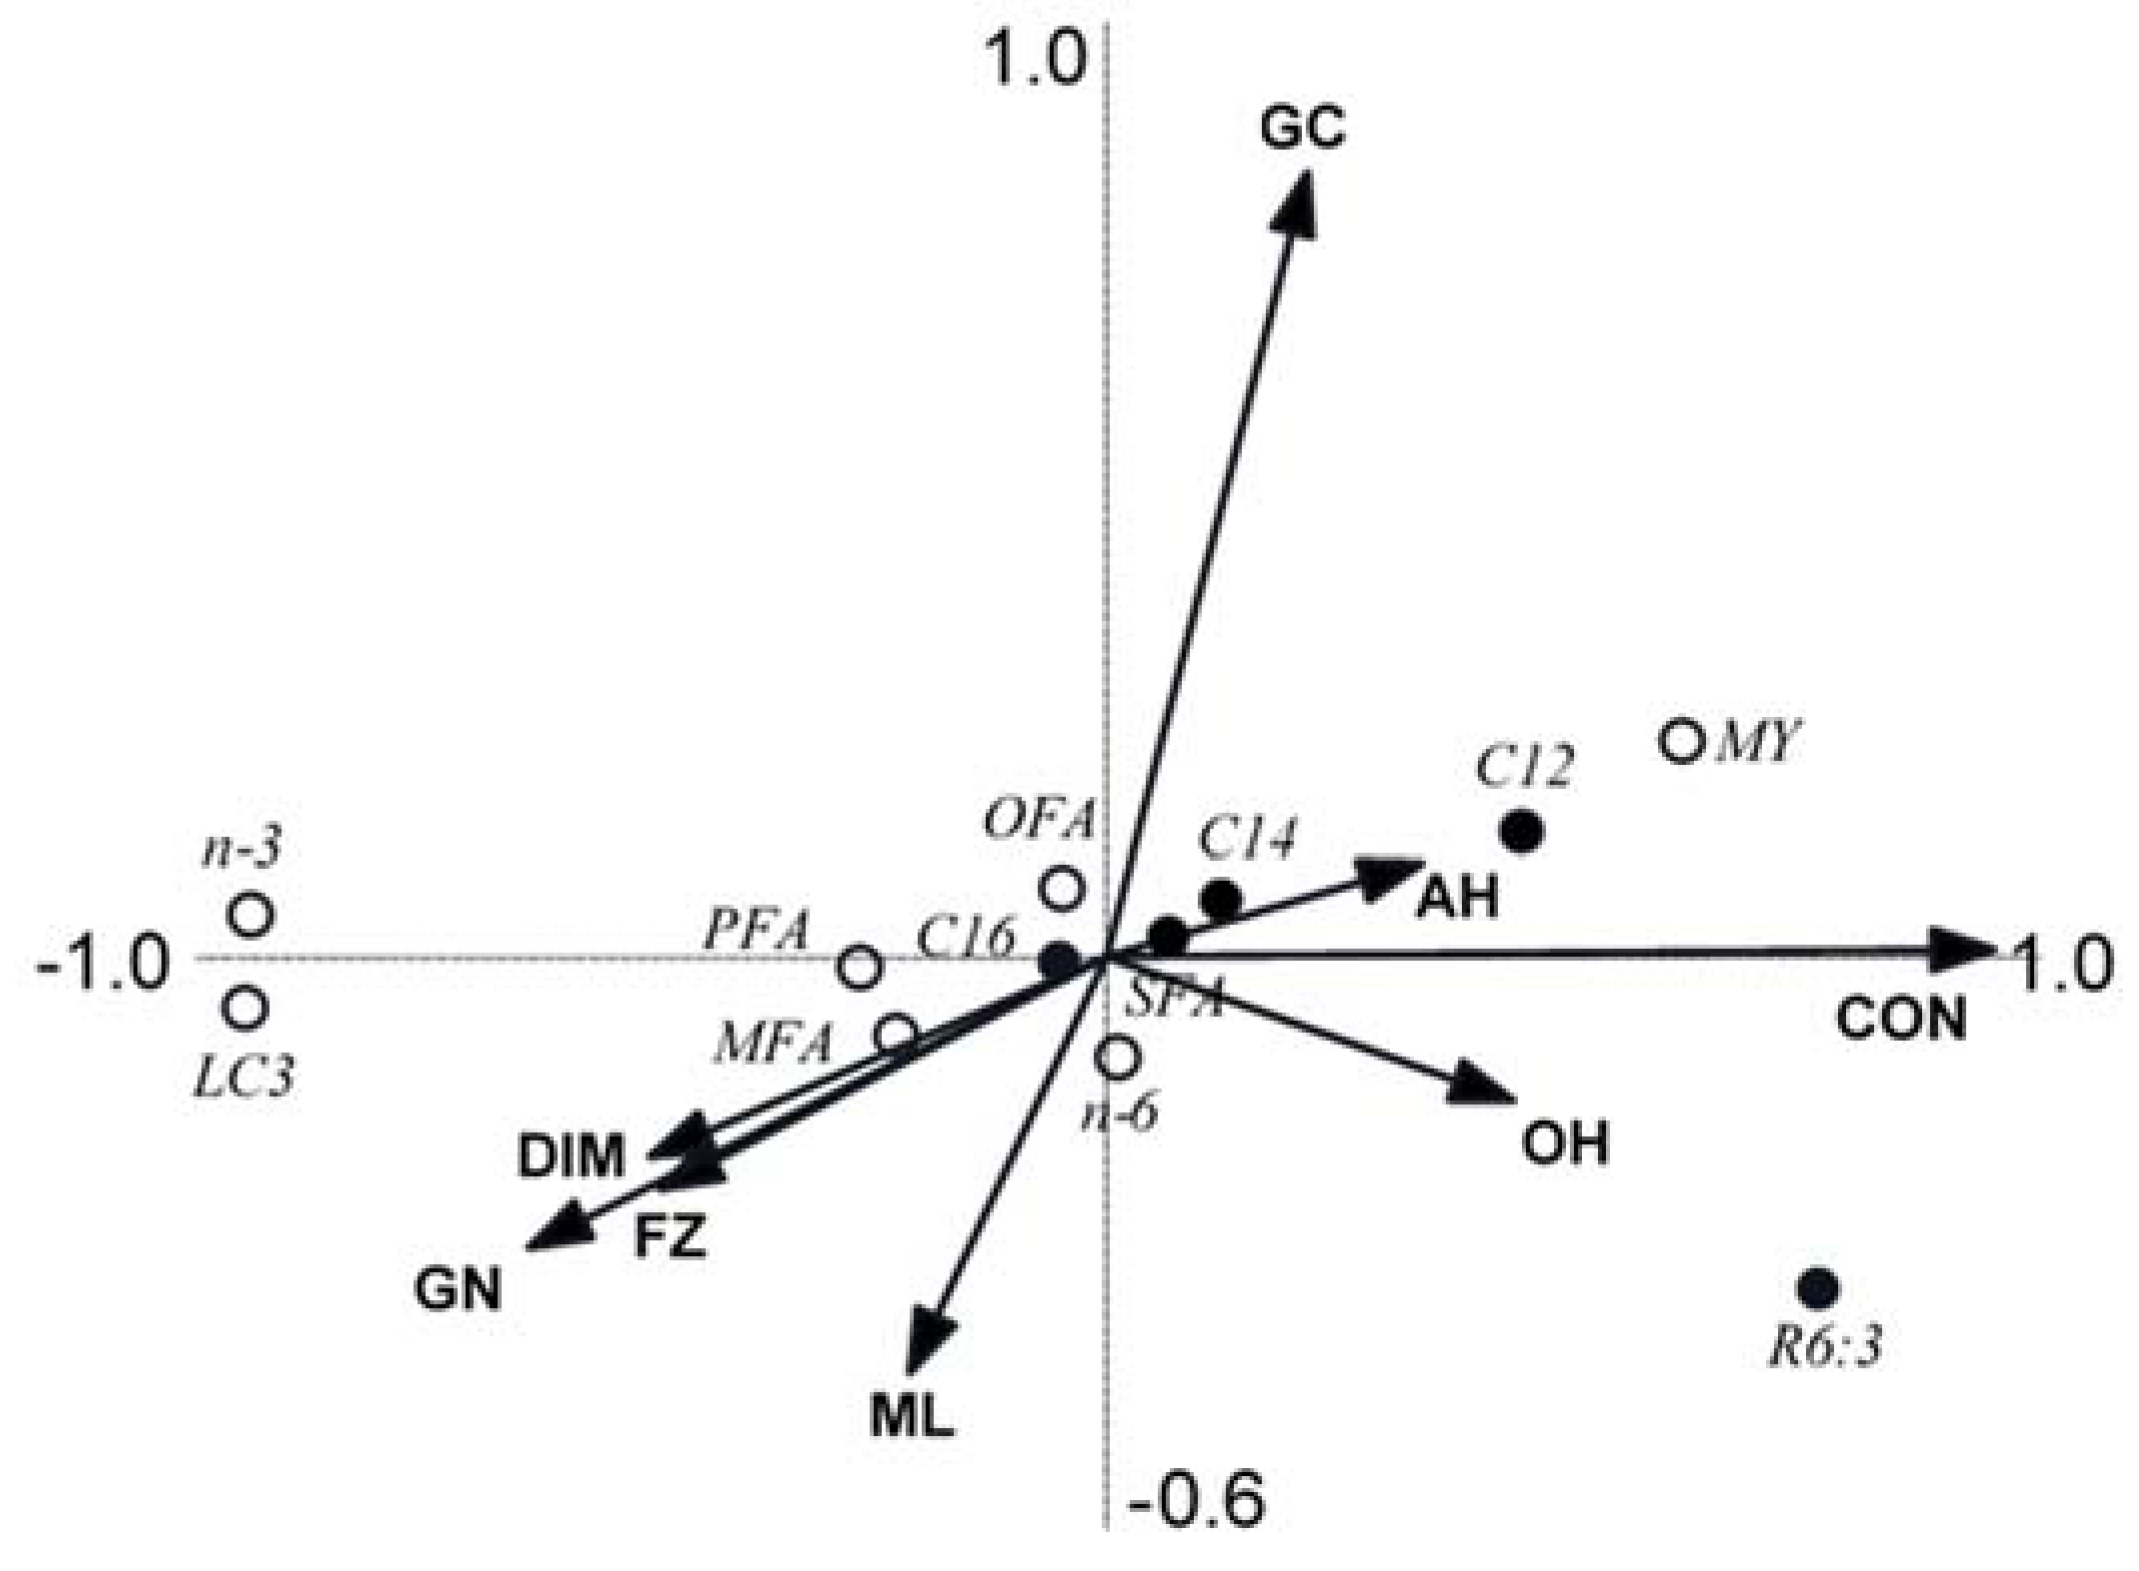
3.5. Redundancy Analyses

The RDAs (see Figure 2) revealed that ewe feeding, the environment, and the milking system (hand vs. machine) were drivers of milk yield and milk fat composition
By far, the most influential factor was concentrate feed supplementation (CON), explaining 26% of variation (p-value = 0.002) in the concentration of beneficial and detrimental fatty acids in the milk. This was followed by the time spent grazing cultivated pasture (3% variation, p-value = 0.002) and the consumption of alfalfa and oat hay (1.1% and 1.2% of variation, respectively, with p-values of 0.008 and 0.012). Other significant factors included grazing on natural pastures as well as the milking system ewes were exposed to at the time samples were taken; however, these each only accounted for less than 1% of the variation. The biplot in Figure 2 shows that higher milk yields and all of the less desirable composition traits of milk (saturated fatty acids and a high ratio of n-6/n-3) were associated with supplementary feeding, especially concentrate feeds (but also alfalfa and oat hay and to some extent time spent grazing on cultivated pastures). On the other hand, beneficial fatty acids (MUFAs, PUFAs, n-3s, and long-chain n-3s) were closely associated with the time ewes spent on natural vegetation, the floristic zone of these pastures, and to some extent the milking system practiced (hand milking had a higher score than machine milking).

4. Discussion

While this study confirmed that Cretan Sfakiano sheep milk had fewer SFAs and more MUFAs, PUFAs, and n-3s compared to published data for bovine milk [24], it also highlighted the differences in milk (fat) composition brought about by flock management as well as changes within and between seasons. Since many of the fatty acids found to vary are known to be relevant to health, this divergence in fat composition could potentially impact consumer health and hence the sustainability of dairy products from these production systems.

4.1. Differences in Milk Yield and Composition

Over the last 20 years, many traditional, grazing-based sheep producers have intensified management to increase milk yields and the financial viability of their farms. Intensification has involved a range of changes, including (a) confining ewes to improved or cultivated pastures at lower altitudes close to the farm rather than letting them range on seminatural mountain vegetation; (b) feeding more supplementary concentrate feeds; and (c) replacing hand-milking with semiautomatic or automatic milking machines [33]. Similar intensification approaches have been shown to reduce the nutritional quality of bovine milk by decreasing the concentrations of desirable PUFAs (n-3 and CLA) and antioxidants (α-tocopherol and carotenoids) [24]. As a result, there has also been concern about the potential negative effects of intensification on the nutritional composition of ovine milk, especially FA profiles.
This study clearly documented significant negative effects on the FA profiles in milk as a result of intensification, although neither system monitored could be considered to be “intensive”. The 18% depression in total n-3 concentration in milk from flocks under SI management may have the greatest nutritional impact, since typical Western diets are recognized as being deficient in n-3s, especially in very-long chain (VLC) n-3s (EPA, DPA, and DHA) [37]. As a consequence, the European Food Standards Authority (EFSA) recommends that the average daily intake of VLC n-3s needs to be at least doubled, with even greater intake for population groups with higher needs, such as pregnant and breastfeeding women [38]. The 21% increase and 9% increase, respectively, in the concentration of saturated lauric and (especially) myristic acid in milk from SI farms are also of concern, since these, along with palmitic acid, are the main SFAs linked to inflammation and increased cardiovascular risk, with the strongest connection being for myristic acid [12]. Such composition differences, along with the fact that ewes in the EX flocks produced 37% less milk, confirm previous studies that have reported that while higher conserved forage and concentrate feeds in dairy diets do increase productivity, they also have negative effects on milk’s nutritional quality, especially in terms of FA profiles [24,27]. It ought to be noted here, however, that there were no differences in CLA or protein contents, the SCC, or CFUs, and there was only a small difference in the lactose content between milk from semi-intensive and extensive systems. In addition, the magnitude of difference in the nutritionally desirable n-3s and the undesirable SFAs did vary within and between years, which will be discussed later (see below).

4.2. Possible Explanations

The botanical composition of grazing swards may have been at least partially responsible for differences in the milk quality between SI and EX systems. The seminatural vegetation grazed by extensive flocks was species-rich [39] and comprised a mosaic of grasses, legumes, flowers, and shrubs. In contrast, the improved or sown swards grazed in the semi-intensive systems consisted primarily of vegetative growth from cultivated oats. Such monocultures, where feeding behavior is controlled by available vegetation, offer ewes limited opportunities for selective grazing, in contrast to diverse upland pastures with mixes of species and plant growth stages. This allows for “opportunist” selective grazing, with ewes showing a strong preference for legumes and young, leafy plants [40], a highly likely explanation for the differences found in milk quality. This view is supported by studies reporting higher PUFAs in milk when ewes graze pastures rich in legumes compared to pure grass swards [41,42].
Early in the seasons, EX flocks were fed more conserved forage, mainly alfalfa or lucerne hay, compared to SI flocks. Although cutting and drying reduces the PUFA content compared to fresh herbage [43], there is evidence from studies on cows that such legume-based conserved forages still increase PUFAs and n-3s in milk relative to forages from grass-only swards [22]: this is likely due to reduced rumen retention (and hence hydrogenation), leading to a greater transfer of PUFAs from legume forages into milk.
The finding of substantial seasonal variation in milk fatty acid profiles (especially in extensive production) is well recognized in many systems [28,44] and can be attributed to changes in the ewes’ diets, sward quality, and the stage of lactation [40,42]. Grazing on seminatural pastures offers a transition in plants for grazing as the season progresses, in contrast to the fairly uniform quality of sown vegetation. In addition, the higher concentration of palmitic, stearic, and oleic acid seen in milk in May and June could have been due to the mobilization of body fat, which has been reported by Chilliard et al. [45], in response to a lower energy intake when supplements were withdrawn and grazing quality deteriorated as temperatures rose.
The survey was repeated in two production years characterized by markedly different climatic conditions, which inevitably had an impact on plant population, grazing quality, and utilization. The results imply a strong influence of climatic conditions on both productivity and milk quality, either directly or via impacts on the forage supply and the need for extra feeding. The higher levels of supplementation (both concentrate feeds and forages) necessary in year 1 may have boosted milk yield but could have had a negative impact on milk fatty acid profiles with respect to consumer health, elevating the damaging SFAs and depressing the PUFAs, particularly in terms of n-3 content. Similar results have been reported by Virto et al. [46].
A redundancy analysis clearly identified elements of the production systems closely linked to these changes in composition, again confirming results from both bovine and other ovine production systems. For example, several studies/reviews have concluded that milk from ruminants with a high grazing intake has more PUFAs and n-3s and/or a lower myristic and lauric acid content [22,28] compared to milk from ruminants fed diets high in concentrates. Almost without exception, all beneficial fatty acids that enhance our diet, especially n-3, were found to be closely associated with “time spent grazing natural pastures”, the “floristic zone”, and “hand milking” systems. The appearance of hand milking in this quadrant is likely to only be due to its association with grazing conditions, which, as discussed, are the true driver of milk quality (although perhaps this apparent link with the milking system needs further investigation). Previous studies have shown that grazing on diverse vegetation enhances milk fat composition, and when ewes move from the farmstead to mountain pastures, machine milking is not feasible, so mountain grazing is inevitably linked with hand milking.
In contrast, the fatty acids that ought to be reduced in the diet (particularly myristic and lauric acid) and the ratio of n-6/n-3 appeared to be closely associated with the supplementary feeding of both “hays” and “concentrate feeds”, with the latter clearly being the most influential of all the factors considered. Again, this confirms indications from univariate analyses and previous studies [22,24,27].

4.3. Potential Consequences

In general, the results showed that animals of the same genetic background reared under semi-intensive management systems might produce more milk with a lower fat content but with fewer omega-3 PUFAs compared to ewes under extensive management. A move from the traditional management of dairy sheep to a more intensive system has a negative influence on the nutritional composition of milk, potentially challenging sustainability irrespective of any environmental impacts. In addition, since the terroir of traditional, regional food is also heavily influenced by animals’ diets [47], it is also highly likely to be altered by such intensification. These trade-offs, together with differences in environmental impacts and economic performance (not covered by this study), need to be considered when developing future policies, marketing strategies, and support structures for traditional agricultural production.
Milk from extensive systems also shows greater seasonal variation compared to that from semi-intensive management, and this may need to be considered by processors when declaring the nutrient contents of milk, cheese, yogurt, and other milk-based products. The close relation between feeding regimes and milk quality identified here could be used to establish quality assurance systems that allow for the production and marketing of certified “enhanced fat quality” dairy products of a recognized terroir. However, such schemes will need to understand and account for anything that might change milk composition. All three factors considered in this study significantly influence milk yield and quality to differing degrees. Some of these relationships are well recognized, such as the reduction in milk yield as lactation progresses, whereas others, especially those linked to the management system or the production year, are novel. Table 5 summarizes the evidence from this study on the relative impact on milk yield and nutritional quality of the production year, the stage of lactation, the month, and the management system used by the farm—all likely to be reflected in the diet consumed by ewes.
Finally, if we are to offer farmers an opportunity to earn reasonable returns and a comfortable living from their endeavors without compromising the nutritional sustainability of the food they deliver, we perhaps need to understand the key elements of our traditional management on farms (such as the mountain grazing in this study). Then, if possible, we should investigate if these can be maintained to achieve more effective sustainable intensification, minimizing any negative changes in food composition, whatever the weather conditions.

Supplementary Materials

The following are available online at https://www.mdpi.com/2071-1050/12/3/1228/s1, Figure S1: Interaction means for the concentration of saturated fatty acids (SFAs), lauric acid (C12:0), myristic acid (C14:0), and palmitic acid (C16:0) in milk fat and the respective atherogenicity (AI) and thrombogenicity (TI) indices of milk for different management systems and sampling months; Figure S2: Interaction means for the concertation of monounsaturated fatty acids (MUFAs), polyunsaturated fatty acids (PUFAs), vaccenic acid (C18:1trans-11), and CLAcis9trans-11 in milk and oleic acid (C18:1 cis9) fat for the different management systems and sampling months; Figure S3: Interaction means for omega-3 PUFAs (omega-3), the omega-3 to omega-6 ratio, α-linoleic acid (C18:3cis9.cis12.cis15; ALA), eicosapentaenoic acid (C20:5omega-3; EPA), docosapentaenoic acid (C22:5omega-3; DPA), and docosahexaenoic acid (C22:6omega-3; DHA) for the different management systems and sampling months; Table S1: Monthly temperature and rainfall during the study (mean values ± SEM); Table S2: Grazing regimes, supplementary concentrates, and conserved forages used in the different management systems (production intensity) by sampling month and year (mean values ± SEM); Table S3: Interaction means ± SEMs for milk lactose content for the management systems and sampling months; Table S4: Interaction means/SEMs for total PUFAs, omega-3 PUFAs, lauric acid (C12:0), palmitic acid (C16:0), oleic acid (C18:1 cis 9), α-linolenic acid (C18:3cis9.cis12.cis15), and eicosapentaenoic acid (EPA) in milk fat from two management systems and two years; Table S5: Interaction mean values ± SEMs for whole-crop-oat- and alfalfa-hay-fed-= and the palmitic acid and conjugated linoleic acid (CLA) concentrations in milk fat from two years and sampling months; Table S6: Effect of management systems (production intensity), sampling month, and year on the concentrations of odd-chain fatty acids in milk fat (mean values ± SEMs).

Author Contributions

N.V. and N.T. were responsible for day-to-day recording and sample collection throughout the study as well as for basic milk quality assessments, and N.V. drafted the initial manuscript. S.St. supervised the fatty acid analysis. L.R. and M.E. were responsible for statistical analysis. I.A. and E.F. each conducted one year’s analysis of the fatty acids. C.L., A.S., S.S., and G.B. were all involved in the study design, implementation, and overall project management. S.S. supervised sample and data collection, while G.B. was responsible for preparing the final manuscript. All authors have read and agreed to the published version of the manuscript.

Funding

The authors gratefully acknowledge financial support from the European Community under the “7th Framework Project, LowInput-Breeds, FP7, Project No. KBBE 222 632”.

Conflicts of Interest

The authors declare no conflicts of interest in carrying out this work, and the founding sponsors had no role in the design of the study; in the collection, analyses, or interpretation of data; in writing the manuscript; or in the decision to publish the results.

References

  1. FAO. Proceedings of the Expert Meeting on How to Feed the World 2050; Food and Agriculture Organisation of the United Nations: Rome, Italy, 2009; ISBN 978-92-5-106363-7. [Google Scholar]
  2. Schader, C.; Baumgart, L.; Landert, J.; Muller, A.; Ssebunya, B.; Blockeel, J.; Weisshaidinger, R.; Petrasek, R.; Mészáros, D.; Padel, S.; et al. Using the Sustainability Monitoring and Assessment Routine (SMART) for the systematic analysis of trade-offs and synergies between sustainability dimensions and themes at farm level. Sustainability 2016, 8, 274. [Google Scholar] [CrossRef] [Green Version]
  3. Ripoll-Bosch, R.; Díez-Unquera, B.; Ruiz, R.; Villalba, D.; Molina, E.; Joy, M.; Olaizola, A.; Bernués, A. An integrated sustainability assessment of mediterranean sheep farms with different degrees of intensification. Agric. Syst. 2012, 105, 46–56. [Google Scholar] [CrossRef]
  4. FAO. Sustainable Diets and Biodiversity; Food and Agriculture Organization of the United Nations (FAO): Rome, Italy, 2012; ISBN 978-92-5-107288-2. [Google Scholar]
  5. Średnicka-Tober, D.; Barański, M.; Seal, C.; Sanderson, R.; Benbrook, C.; Steinshamn, H.; Gromadzka-Ostrowska, J.; Rembiałkowska, E.; Skwarło-Sońta, K.; Eyre, M.; et al. Composition differences between organic and conventional meat: A systematic literature review and meta-analysis. Br. J. Nutr. 2016, 115, 994–1011. [Google Scholar] [CrossRef] [PubMed]
  6. Barański, M.; Średnicka-Tober, D.; Volakakis, N.; Seal, C.; Sanderson, R.; Stewart, G.B.; Benbrook, C.; Biavati, B.; Markellou, E.; Giotis, C.; et al. Higher antioxidant and lower cadmium concentrations and lower incidence of pesticide residues in organically grown crops: A systematic literature review and meta-analyses. Br. J. Nutr. 2014, 112, 794–811. [Google Scholar] [CrossRef] [PubMed] [Green Version]
  7. Barański, M.; Rempelos, L.; Iversen, P.O.; Leifert, C. Effects of organic food consumption on human health; the jury is still out! Food Nutr. Res. 2017, 61, 1287333. [Google Scholar] [CrossRef]
  8. Sun, Y.; Liu, B.; Du, Y.; Snetselaar, L.G.; Sun, Q.; Hu, F.B.; Bao, W. Inverse association between organic food purchase and diabetes mellitus in US adults. Nutrients 2018, 10, 1877. [Google Scholar] [CrossRef] [Green Version]
  9. Baudry, J.; Lelong, H.; Adriouch, S.; Julia, C.; Allès, B.; Hercberg, S.; Touvier, M.; Lairon, D.; Galan, P.; Kesse-Guyot, E. Association between organic food consumption and metabolic syndrome: Cross-sectional results from the NutriNet-Santé study. Eur. J. Nutr. 2018, 57, 2477–2488. [Google Scholar] [CrossRef]
  10. Sanchez-Villegas, A.; Martinez, J.A.; Prattala, R.; Toledo, E.; Roos, G.; Martinez-Gonzalez, M.A.; Group, F. A systematic review of socioeconomic differences in food habits in Europe: Consumption of cheese and milk. Eur. J. Clin. Nutition 2003, 57, 917–929. [Google Scholar] [CrossRef] [Green Version]
  11. Schaefer, E.J. Lipoproteins, nutrition, and heart disease. Am. J. Clin. Nutition 2002, 75, 191–212. [Google Scholar] [CrossRef]
  12. American Heart Association Nutrition Committee; Lichtenstein, A.H.; Appel, L.J.; Brands, M.; Carnethon, M.; Daniels, S.; Franch, H.A.; Franklin, B.; Kris-Etherton, P.; Harris, W.S.; et al. Diet and lifestyle recommendations revision 2006: A scientific statement from the American Heart Association Nutrition Committee. Circulation 2006, 114, 82–96. [Google Scholar]
  13. Elwood, P.C.; Givens, D.I.; Beswick, A.D.; Fehily, A.M.; Pickering, J.E.; Gallacher, J. The survival advantage of milk and dairy consumption: An overview of evidence from cohort studies of vascular diseases, diabetes and cancer. J. Am. Coll. Nutr. 2008, 27, 723S–734S. [Google Scholar] [CrossRef] [PubMed]
  14. Lordan, R.; Zabetakis, I. Invited review: The anti-inflammatory properties of dairy lipids. J. Dairy Sci. 2016, 100, 4197–4212. [Google Scholar] [CrossRef] [PubMed]
  15. Zervas, G.; Tsiplakou, E. The effect of feeding systems on the characteristics of products from small ruminants. Small Rumin. Res. 2011, 101, 140–149. [Google Scholar] [CrossRef]
  16. Markiewicz-Kęszycka, M.; Czyżak-Runowska, G.; Lipińska, P.J.W. Fatty Acid Profile of Milk-A Review. Bull. Vet. Inst. Pulawy 2013, 57, 135–139. [Google Scholar] [CrossRef] [Green Version]
  17. Scharf, R.J.; Demmer, R.T.; DeBoer, M.D. Longitudinal evaluation of milk type consumed and weight status in preschoolers. Arch. Dis. Child. 2013, 98, 335–340. [Google Scholar] [CrossRef]
  18. Robinson, J.G.; Ijioma, N.; Harris, W. Omega-3 fatty acids and cognitive function in women. Women’s Health 2010, 6, 119–134. [Google Scholar] [CrossRef]
  19. Bhattacharya, A.; Banu, J.; Rahman, M.; Causey, J.; Fernandes, G. Biological effects of conjugated linoleic acids in health and disease. J. Nutr. Biochem. 2006, 17, 789–810. [Google Scholar] [CrossRef]
  20. Jenkins, B.; West, J.A.; Koulman, A. A review of odd-chain fatty acid metabolism and the role of pentadecanoic acid (C15:0) and heptadecanoic acid (C17:0) in health and disease. Molecules 2015, 20, 2425–2444. [Google Scholar] [CrossRef] [Green Version]
  21. Fievez, V.; Colman, E.; Castro-Montoya, J.M.; Stefanov, I.; Vlaeminck, B. Milk odd- and branched-chain fatty acids as biomarkers of rumen function—An update. Anim. Feed Sci. Technol. 2012, 172, 51–65. [Google Scholar] [CrossRef]
  22. Dewhurst, R.J.; Shingfield, K.J.; Lee, M.R.F.; Scollan, N.D. Increasing the concentrations of beneficial polyunsaturated fatty acids in milk produced by dairy cows in high-forage systems. Anim. Feed Sci. Technol. 2006, 131, 168–206. [Google Scholar] [CrossRef]
  23. Butler, G.; Stergiadis, S.; Seal, C.; Eyre, M.; Leifert, C. Fat composition of organic and conventional retail milk in northeast England. J. Dairy Sci. 2011, 94, 24–36. [Google Scholar] [CrossRef] [PubMed]
  24. Stergiadis, S.; Leifert, C.; Seal, C.J.; Eyre, M.D.; Nielsen, J.H.; Larsen, M.K.; Slots, T.; Steinshamn, H.; Butler, G. Effect of feeding intensity and milking system on nutritionally relevant milk components in dairy farming systems in the north east of England. J. Agric. Food Chem. 2012, 60, 7270–7281. [Google Scholar] [CrossRef] [PubMed]
  25. Sanz Sampelayo, M.R.; Chilliard, Y.; Schmidely, P.; Boza, J. Influence of type of diet on the fat constituents of goat and sheep milk. Small Rumin. Res. 2007, 68, 42–63. [Google Scholar] [CrossRef]
  26. Biondi, L.; Valvo, M.A.; Di Gloria, M.; Tenghi, E.S.; Galofaro, V.; Priolo, A. Changes in ewe milk fatty acids following turning out to pasture. Small Rumin. Res. 2008, 75, 17–23. [Google Scholar] [CrossRef]
  27. Martini, M.; Liponi, G.B.; Salari, F. Effect of forage:concentrate ratio on the quality of ewe’s milk, especially on milk fat globules characteristics and fatty acids composition. J. Dairy Res. 2010, 77, 239–244. [Google Scholar] [CrossRef]
  28. Tsiplakou, E.; Kominakis, A.; Zervas, G. The interaction between breed and diet on CLA and fatty acids content of milk fat of four sheep breeds kept indoors or at grass. Small Rumin. Res. 2008, 74, 179–187. [Google Scholar] [CrossRef]
  29. Mele, M.; Contarini, G.; Cercaci, L.; Serra, A.; Buccioni, A.; Povolo, M.; Conte, G.; Funaro, A.; Banni, S.; Lercker, G.; et al. Enrichment of Pecorino cheese with conjugated linoleic acid by feeding dairy ewes with extruded linseed: Effect on fatty acid and triglycerides composition and on oxidative stability. Int. Dairy J. 2011, 21, 365–372. [Google Scholar] [CrossRef]
  30. Gómez-Cortés, P.; Toral, P.G.; Frutos, P.; Juárez, M.; de la Fuente, M.A.; Hervás, G. Effect of the supplementation of dairy sheep diet with incremental amounts of sunflower oil on animal performance and milk fatty acid profile. Food Chem. 2011, 125, 644–651. [Google Scholar] [CrossRef]
  31. Volanis, M.; Kominakis, A.; Rogdakis, E. Genetic analysis of udder score and milk traits in test day records of Sfakia dairy ewes. Archiv. fur Tierzucht Dummerstorf 2002, 45, 69–77. [Google Scholar] [CrossRef]
  32. Volanis, M.; Stefanakis, A.; Hadjigeorgiou, I.; Zoiopoulos, P. Supporting the extensive dairy sheep smallholders of the semi-arid region of Crete through technical intervention. Trop. Anim. Health Prod. 2007, 39, 325–334. [Google Scholar] [CrossRef]
  33. Stefanakis, A.; Volanis, M.; Zoiopoulos, P.; Hadjigeorgiou, I. Assessing the potential benefits of technical intervention in evolving the semi-intensive dairy-sheep farms in Crete. Small Rumin. Res. 2007, 72, 66–72. [Google Scholar] [CrossRef]
  34. Pinheiro, J.C.; Bates, D.M. Mixed-Effects Models in S and S-PLUS; Springer: New York, NY, USA, 2000. [Google Scholar]
  35. Crawley, M.J. The R Book; Wiley: Chichester, UK; Hoboken, NJ, USA, 2007. [Google Scholar]
  36. ter Braak, C.J.F.; Smilauer, P. CANOCO Reference Manual and CanoDraw for Windows User’s Guide: Software for Canonical Community Ordination (version 4.5); Biometris: Wageningen, The Netherlands, 2002. [Google Scholar]
  37. Hibbeln, J.R.; Nieminen, L.R.; Blasbalg, T.L.; Riggs, J.A.; Lands, W.E. Healthy intakes of n-3 and n-6 fatty acids: Estimations considering worldwide diversity. Am. J. Clincal Nutr. 2006, 83, 1483s–1493s. [Google Scholar] [CrossRef] [PubMed]
  38. European Food Safety Authority (EFSA). Panel on Dietetic Products, Nutrition, and Allergies, Scientific Opinion on Dietary Reference Values for fats, including saturated fatty acids, polyunsaturated fatty acids, monounsaturated fatty acids, trans fatty acids, and cholesterol. Eur. Food Saf. Auth. J. 2010, 8, 107. [Google Scholar]
  39. Parente, G. Grazing systems and biodiversity in Mediterranean areas: Spain, Italy and Greece. Grass Forage Sci. 2011, 66, 606. [Google Scholar] [CrossRef]
  40. Molle, G.; Decandia, M.; Ligios, S.; Fois, N. Grazing management and stocking rate with particular reference to Mediterranean environments. In Dairy Sheep Nutrition; Pulina, G., Bencini, R., Eds.; CABI Pub: Oxfordshire, UK, 2004; pp. 191–211. [Google Scholar]
  41. Nudda, A.; Battacone, G.; Boaventura Neto, O.; Cannas, A.; Francesconi, A.H.D.; Atzori, A.S.; Pulina, G. Feeding strategies to design the fatty acid profile of sheep milk and cheese. Rev. Bras. de Zootec. 2014, 43, 445–456. [Google Scholar] [CrossRef] [Green Version]
  42. Cabiddu, A.; Decandia, M.; Addis, M.; Piredda, G.; Pirisi, A.; Molle, G. Managing Mediterranean pastures in order to enhance the level of beneficial fatty acids in sheep milk. Small Rumin. Res. 2005, 59, 169–180. [Google Scholar] [CrossRef]
  43. Dervishi, E.; Joy, M.; Sanz, A.; Alvarez-Rodriguez, J.; Molino, F.; Calvo, J.H. Forage preservation (grazing vs. hay) fed to ewes affects the fatty acid profile of milk and CPT1B gene expression in the sheep mammary gland. BMC Vet. Res. 2012, 8, 106. [Google Scholar] [CrossRef] [Green Version]
  44. Carloni, M.; Fedeli, D.; Roscioni, T.; Gabbianelli, R.; Falcioni, G. Seasonal variation of fat composition in sheep’s milk from areas of central Italy. Mediterr. J. Nutr. Metab. 2009, 3, 55–60. [Google Scholar] [CrossRef]
  45. Chilliard, Y.; Ferlay, A.; Rouel, J.; Lamberet, G. A review of nutritional and physiological factors affecting goat milk lipid synthesis and lipolysis. J. Dariy Sci. 2003, 86, 1751–1770. [Google Scholar] [CrossRef] [Green Version]
  46. Virto, M.; Bustamante, M.; Ruiz de Gordoa, J.C.; Amores, G.; Fernandez-Caballero, P.N.; Mandaluniz, N.; Arranz, J.; Najera, A.I.; Albisu, M.; Perez-Elortondo, F.J.; et al. Interannual and geographical reproducibility of the nutritional quality of milk fat from commercial grazing flocks. J. Dairy Res. 2012, 79, 485–494. [Google Scholar] [CrossRef]
  47. Martin, B.; Buchin, S.; Hurtaud, C. Conditions in milk production and the sensory qualitites of cheese. Prod. Anim. 2003, 16, 283–288. [Google Scholar]
Figure 1. Interaction means for (a) cultivated pasture grazing, (b) natural pasture grazing, (c) the use of concentrate feed, and (d) conserved forage for management systems and sampling months. Semi-intensive management is represented by (♦) and extensive management by (◊). J: January, F: February, M: March, A: April, M: May, J: June. Values with different capitilized letters represent statistically significant differences between management systems, and those with different lowercase letters represent statistically significant differences between months within the same system (p-value < 0.05).
Sustainability 12 01228 g001
Figure 2. Biplot derived from redundancy analyses showing the relationship between milk yield (MY), the content of fatty acid groups (SFA: saturated fatty acids; MFA: monounsaturated fatty acids; PFA: polyunsaturated fatty acids; OFA: odd-chain fatty acids; n-3s: omega-3 fatty acids; n-6: omega-6 fatty acids; LC3: very long omega-3 fatty acids), R6:3: the omega-6 to omega-3 ratio, the content of major fatty acids in milk fat (C12: lauric; C14: myristic acid; C16: palmitic acid), nutritional variables (GC: grazing time on cultivated pastures; GN: grazing time on natural pastures; FZ: floristic zone; CON: total supplementary concentrate; OH: oat hay; AH: alfalfa hay), the days in milk (DIMs), and the milking system (ML).
Sustainability 12 01228 g002
Table 1. Effect of management systems (production intensity), month, and year on milk yield and basic quality (mean values ± SEMs).
Milk YieldFatProteinLactoseSomatic Cell CountColony-Forming Units
Factorsl/ewe/dayg/100 mLg/100 mLg/100 mL1000 cells/mL1000 units/mL
Management
Semi-Intensive1.00 ± 0.035.43 ± 0.115.17 ± 0.034.78 ± 0.0298 ± 6477 ± 54
Extensive0.63 ± 0.026.05 ± 0.115.24 ± 0.034.73 ± 0.03108 ± 8537 ± 60
Sampling Months
January1.02 ± 0.06 a6.22 ± 0.17 a5.17 ± 0.064.78 ± 0.03 ab107 ± 10 abc331 ± 74 b
February0.92 ± 0.05 ab6.53 ± 0.16 a5.28 ± 0.064.77 ± 0.04 ab126 ± 15 a435 ± 93 b
March0.83 ± 0.04 bc5.41 ± 0.16 b5.24 ± 0.064.88 ± 0.03 a97 ± 12 abc423 ± 90 b
April0.79 ± 0.04 cd5.33 ± 0.21 b5.24 ± 0.064.85 ± 0.03 ab91 ± 13 bc387 ± 88 b
May0.71 ± 0.05 de5.21 ± 0.20 b5.23 ± 0.054.76 ± 0.05 b76 ± 12 c786 ± 114 a
June0.60 ± 0.05 e5.68 ± 0.17 b5.06 ± 0.054.47 ± 0.08 c121 ± 14 ab714 ± 117 a
Milking Year
First0.90 ± 0.035.41 ± 0.115.16 ± 0.034.85 ± 0.0383 ± 6389 ± 50
Second0.74 ± 0.036.06 ± 0.115.24 ± 0.034.66 ± 0.03123 ± 9623 ± 61
ANOVA (p-values) 1
Main effects
Management (MS)******nsnsnsns
Sample Month (SM)******t*******
Year (Y)******t********
Interactions
MS × SM 2nsnsns***nsns
MS × Ynstnsnsnsns
SM × Ynsnsnsnsnsns
MS × SM × Ynsnsnsnsnsns
a–e Means in a column with different letters are significantly different according to Tukey’s honestly significant difference test (p-values < 0.05). 1 *** p < 0.001; ** p < 0.01; * p < 0.05; t: p < 0.1; ns: p > 0.1. 2 See Table S3 for significant interaction means/SEMs.
Table 2. Effect of management (production intensity), sample month, and year on the concentrations of major saturated fatty acids (SFAs) and monounsaturated fatty acids (MUFAs) in milk fat (mean values ± SEM).
Lauric Acid
C12:0
Myristic Acid
C14:0
Palmitic Acid
C16:0
Stearic Acid
C18:0
Oleic Acid
C18:1 Cis9
Vaccenic Acid
C18:1 trans11
Factorsg/100 g total FAs
Management
Semi-Intensive4.92 ± 0.1312.4 ± 0.1527.2 ± 0.208.72 ± 0.1919.3 ± 0.331.15 ± 0.05
Extensive4.06 ± 0.1211.3 ± 0.1527.6 ± 0.249.60 ± 0.1821.3 ± 0.351.01 ± 0.05
Sampling Months
January4.93 ± 0.18 ab 11.6 ± 0.21 ab26.9 ± 0.27 b 9.13 ± 0.30 bc19.7 ± 0.51 bc1.18 ± 0.08 ab
February5.14 ± 0.19 a12.0 ± 0.24 a26.6 ± 0.36 b 8.83 ± 0.32 bc19.5 ± 0.48 bc1.19 ± 0.09 a
March5.06 ± 0.21 ab12.3 ± 0.26 a27.0 ± 0.30 b8.34 ± 0.33 c19.1 ± 0.60 c1.14 ± 0.07 ab
April4.56 ± 0.22 b12.1 ± 0.30 a26.8 ± 0.36 b 9.19 ± 0.35 bc19.0 ± 0.49 c1.18 ± 0.09 ab
May3.97 ± 0.22 c12.0 ± 0.31 a28.5 ± 0.46 a 9.36 ± 0.34 ab20.6 ± 0.61 a1.00 ± 0.07 b
June3.19 ± 0.17 d11.2 ± 0.30 b28.7 ± 0.41 a 10.15 ± 0.29 a24.0 ± 0.60 a0.76 ± 0.07 c
Milking Year
First5.18 ± 0.1313.0 ± 0.1228.7 ± 0.208.38 ± 0.1819.0 ± 0.330.78 ± 0.04
Second3.85 ± 0.1110.8 ± 0.1326.1 ± 0.169.89 ± 0.1821.5 ± 0.341.36 ± 0.04
ANOVA (p-values) 1
Main Effects
Management (MS)*****************
Sample Month (SM)******************
Year (Y)******************
Interactions
MS × SM 2************
MS × Y 3*ns*ns*ns
SM × Y 4nsns**nsnsns
MS × SM × Y*nsnsns**ns
a–e Means in a column with different letters are significantly different according to Tukey’s honestly significant difference test (p < 0.05). 1 *** p < 0.001; ** p < 0.01; * p < 0.05; t: p < 0.1; ns: p > 0.1. 2 See Figures S1 and S2 for significant interaction means/SE. 3 Table S4 reports the significant interaction means/SE. 4 Table S5 reports the significant interaction means/SEMs.
Table 3. Effect of management systems (production intensity), month, and year on concentrations of polyunsaturated fatty acids (PUFAs) in milk fat (mean values ± SEM).
α-Linolenic Acid C18:3 Cis9.Cis12.Cis15Conjugated Linoleic Acid
C18:2 Cis9.Trans11
Eicosapentaenoic Acid
C20:5 N-3
Docosapentaenoic Acid
C22:5 N-3
Docosahexaenoic Acid
C22:6 N-3
Factorsg/100 g total FA
Management
Semi-Intensive0.55 ± 0.021.04 ± 0.020.046 ± 0.0030.075 ± 0.0040.019 ± 0.002
Extensive0.75 ± 0.050.99 ± 0.030.061 ± 0.0030.092 ± 0.0050.020 ± 0.002
Sampling Months
January0.47 ± 0.03 d0.87 ± 0.04 c0.041 ± 0.003 c 0.076 ± 0.007 bc0.019 ± 0.003
February0.48 ± 0.05 d0.98 ± 0.05 bc0.037 ± 0.003 c0.074 ± 0.007 c0.019 ± 0.003
March0.54 ± 0.03 cd1.07 ± 0.04 ab0.039 ± 0.004 c0.068 ± 0.005 c0.017 ± 0.003
April0.88 ± 0.09 a1.13 ± 0.05 a0.056 ± 0.005 b0.099 ± 0.008 a0.020 ± 0.003
May0.84 ± 0.08 ab1.08 ± 0.05 ab0.066 ± 0.006 b 0.095 ± 0.009 ab0.023 ± 0.003
June0.68 ± 0.06 bc0.96 ± 0.04 bc0.084 ± 0.005 a 0.088 ± 0.008 abc0.020 ± 0.003
Milking Year
First0.53 ± 0.030.90 ± 0.030.044 ± 0.0030.049 ± 0.0020.003 ± 0.000
Second0.75 ± 0.041.12 ± 0.030.062 ± 0.0030.116 ± 0.0040.036 ± 0.001
ANOVA (p-values) 1
Main effects
Management (MS)***ns******ns
Sample Month (SM)************ns
Year (Y)***************
Interactions
MS × SM 2***********
MS × Y 3*ns*nsns
SM × Y 4ns*nsnsns
MS × SM × Ynsnsnsnsns
a–e Means in a column with different letters are significantly different according to Tukey’s honestly significant difference test (p < 0.05). 1 *** p < 0.001; ** p < 0.01; * p < 0.05; t: p < 0.1; ns: p > 0.1. 2 See Figures S1 and S2 for significant interaction means/SE. 3 Table S4 reports the significant interaction means/SEMs. 4 Table S5 reports the significant interaction means/SEMs.
Table 4. Effect of management systems (production intensity), month, and production year on concentrations of major fatty acid groups (SFAs, MUFAs, PUFAs, omega-3 PUFAs, omega-6 PUFAs) and the ratio of omega-6 PUFAs to omega-3 PUFAs (omega-6/omega-3) (mean values ± SEM).
SFAsMUFAsPUFAsOmega-3 PUFAsOmega-6 PUFAsOmega-6/Omega-3 Ratio
Factorsg/100 g Total FA
Management
Semi-Intensive69.8 ± 0.4024.5 ± 0.365.73 ± 0.090.97 ± 0.043.06 ± 0.073.9 ± 0.20
Extensive67.6 ± 0.4926.3 ± 0.365.88 ± 0.141.18 ± 0.073.03 ± 0.053.7 ± 0.25
Sampling Months
January69.8 ± 0.61 a24.8 ± 0.54 a5.40 ± 0.15 c0.85 ± 0.06 d3.06 ± 0.104.6 ± 0.39 ab
February69.4 ± 0.63 a24.9 ± 0.53 a5.72 ± 0.19 bc0.86 ± 0.08 cd3.21 ± 0.124.9 ± 0.56 a
March70.1 ± 0.75 a24.2 ± 0.65 a5.64 ± 0.17 bc0.94 ± 0.06 cd2.95 ± 0.093.7 ± 0.28 bc
April68.8 ± 0.96 a24.2 ± 0.52 a6.28 ± 0.26 a1.40 ± 0.12 a2.94 ± 0.112.7 ± 0.25 c
May68.2 ± 0.79 a25.7 ± 0.64 a6.08 ± 0.22 ab1.31 ± 0.11 ab3.00 ± 0.103.0 ± 0.29 c
June65.6 ± 0.81 b28.7 ± 0.70 b5.74 ± 0.18 abc1.08 ± 0.09 bc3.10 ± 0.093.8 ± 0.40 bc
Milking Year
First71.6 ± 0.3123.3 ± 0.285.07 ± 0.090.78 ± 0.042.93 ± 0.074.9 ± 0.28
Second65.9 ± 0.4227.4 ± 0.356.51 ± 0.101.35 ± 0.053.15 ± 0.052.7 ± 0.10
ANOVA (p-values) 1
Main effects
Management(MS)******ns***nsns
Sample Month (SM)************ns***
Year (Y)*****************
Interactions
MS × SM 2************ns***
MS × Y 3nsns**nsns
SM × Y 4nsnsnsnsnsns
MS × SM × Ynsnsnsnsnsns
a–e Means in a column with different letters are significantly different according to Tukey’s honestly significant difference test (p < 0.05). 1 *** p < 0.001; ** p < 0.01; * p < 0.05; t: p <0.1; ns: p > 0.1. 2 See Figures S1 and S2 for significant interaction means/SEMs. 3 Table S4 reports the significant interaction means/SEMs. 4 Table S5 reports the significant interaction means/SEMs.
Table 5. Summary of influences on milk yield and nutritional quality 1.
FactorYearsStage of LactationManagement System
Liquid yield++++++
Solids yield0+++++
SFAs000
MUFAs++0
PUFAs++0
Omega-3+++++++
LC-omega-3++++++
Omega-6000
Ratio of n-6/n-3++++++0
1 Calculated as the range between the highest and lowest values for these factors, expressed as % of mean value, with answers depicted as 0 = <10%, + = 11–30%, ++ = 31–45%, and +++ = >45%. SFAs = saturated fatty acids, MUFAs = monounsaturated fatty acids, PUFAs = polyunsaturated fatty acids.

